
Towards Self-Powered WSN: The Design of Ultra-Low-Power Wireless Sensor Transmission Unit Based on Indoor Solar Energy Harvester


 and
and
Abstract
:1. Introduction
2. Materials and Methods
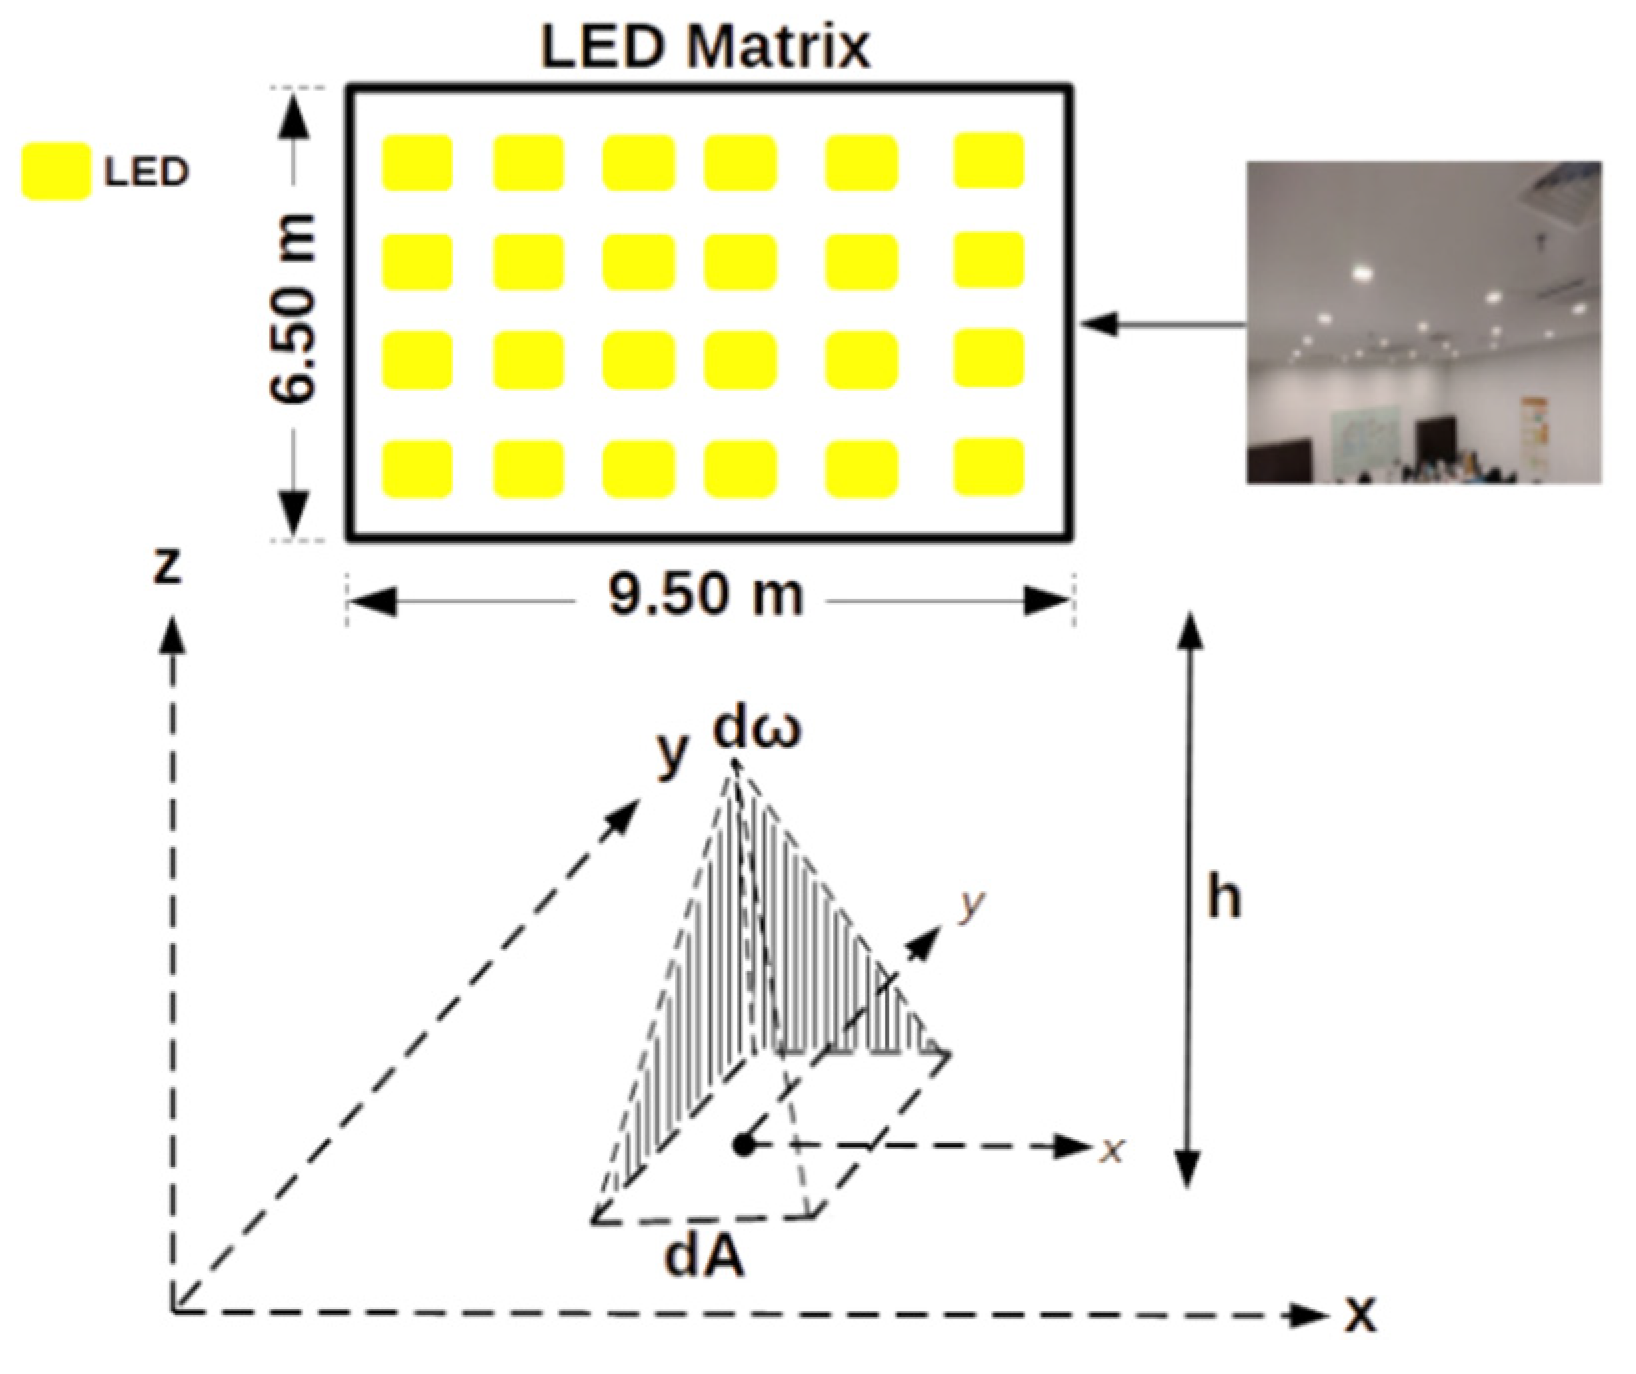
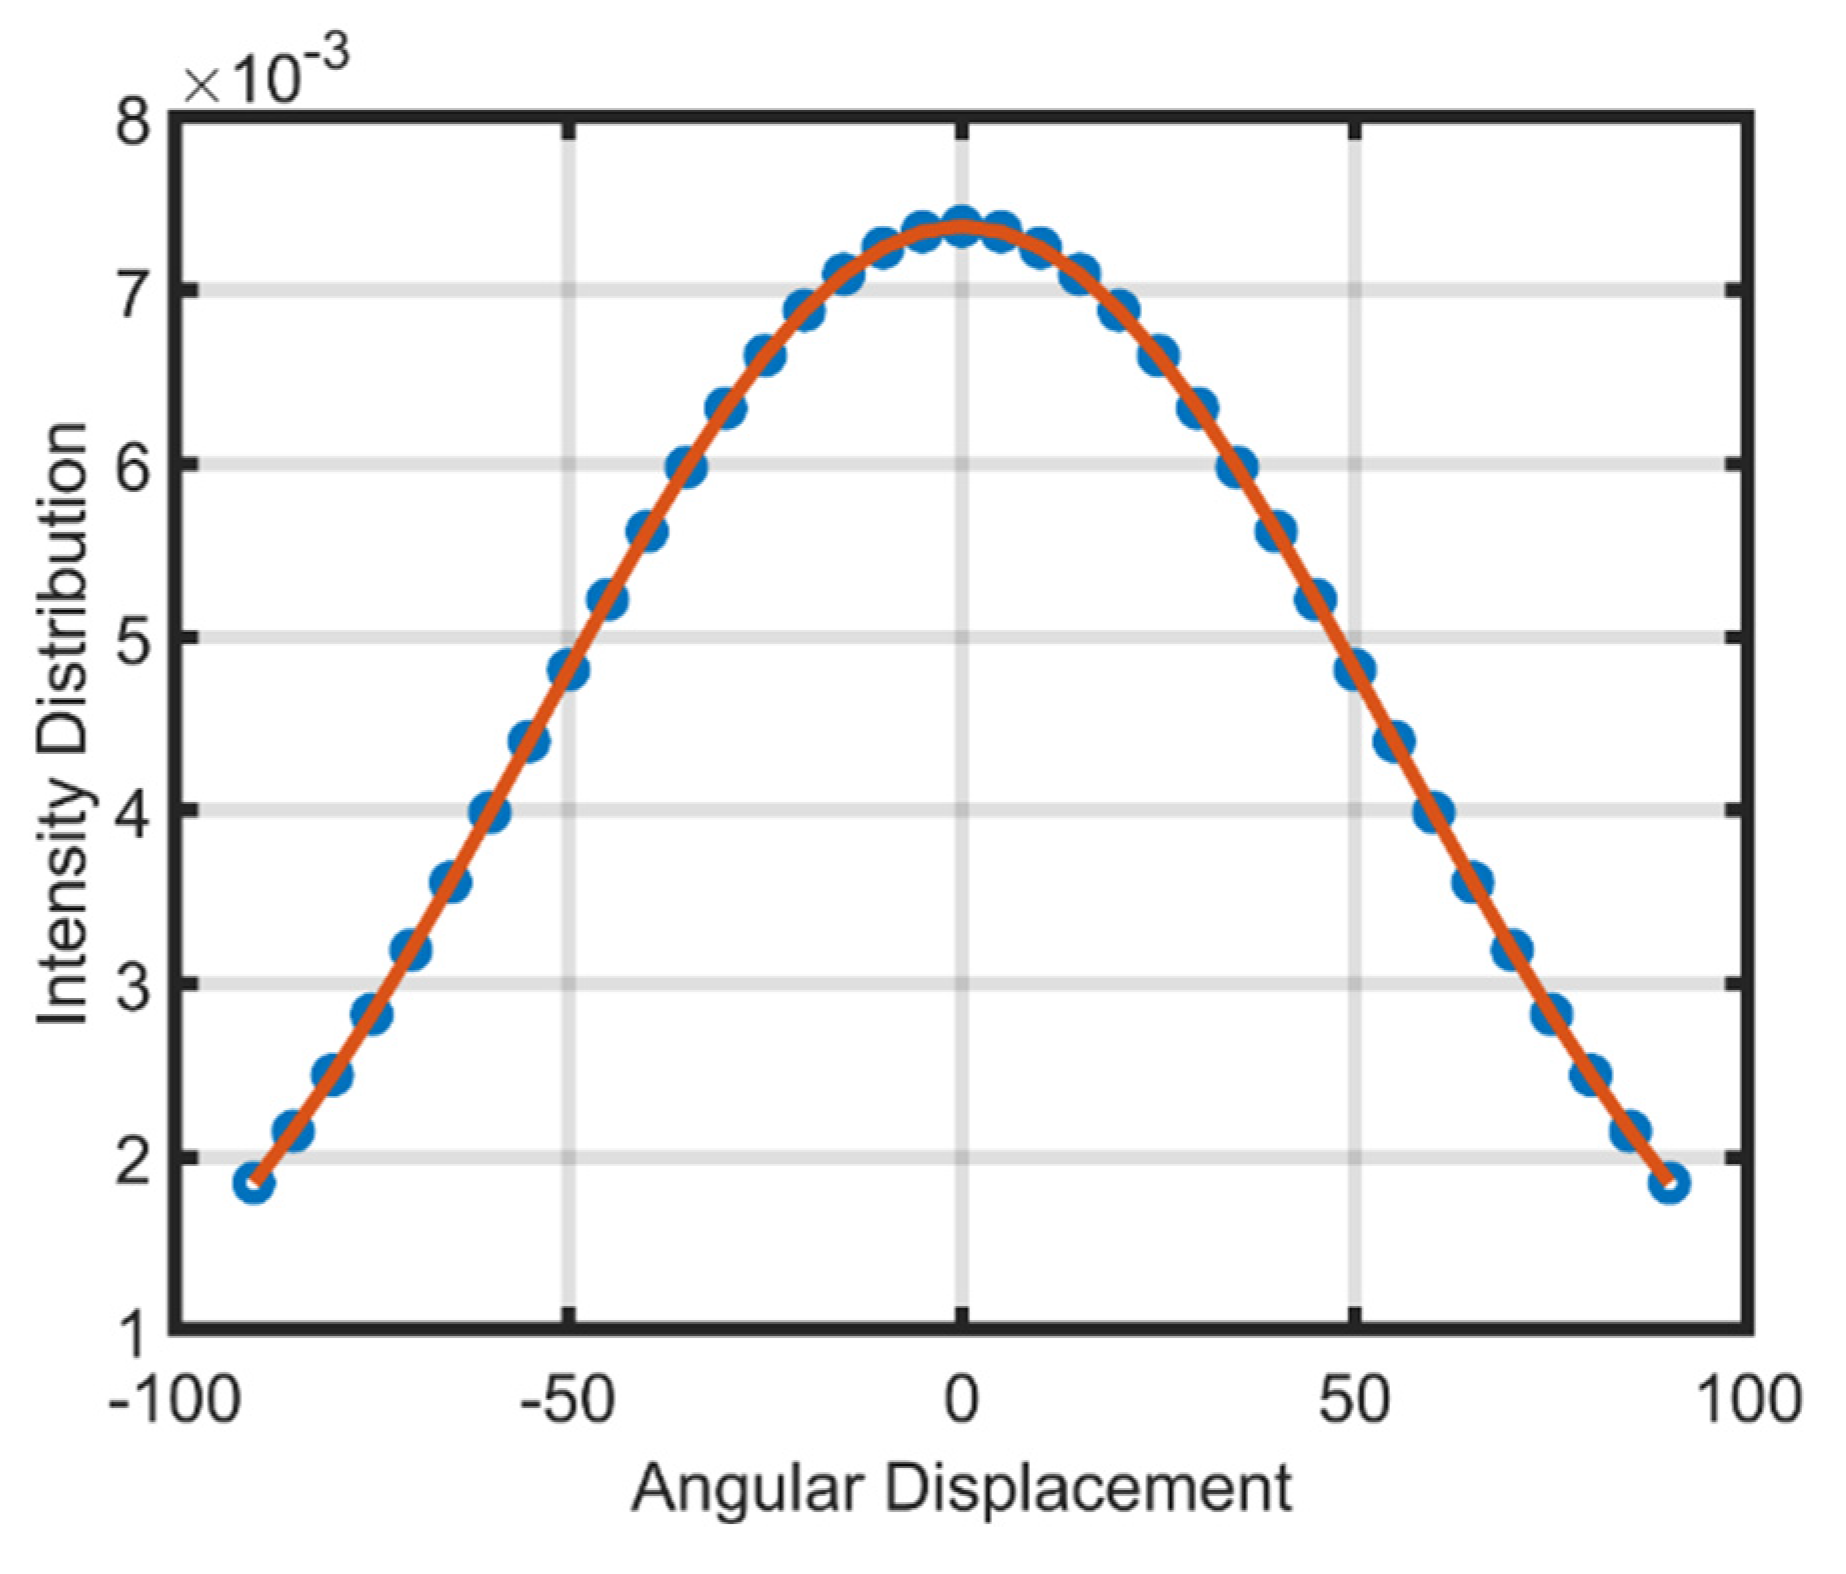
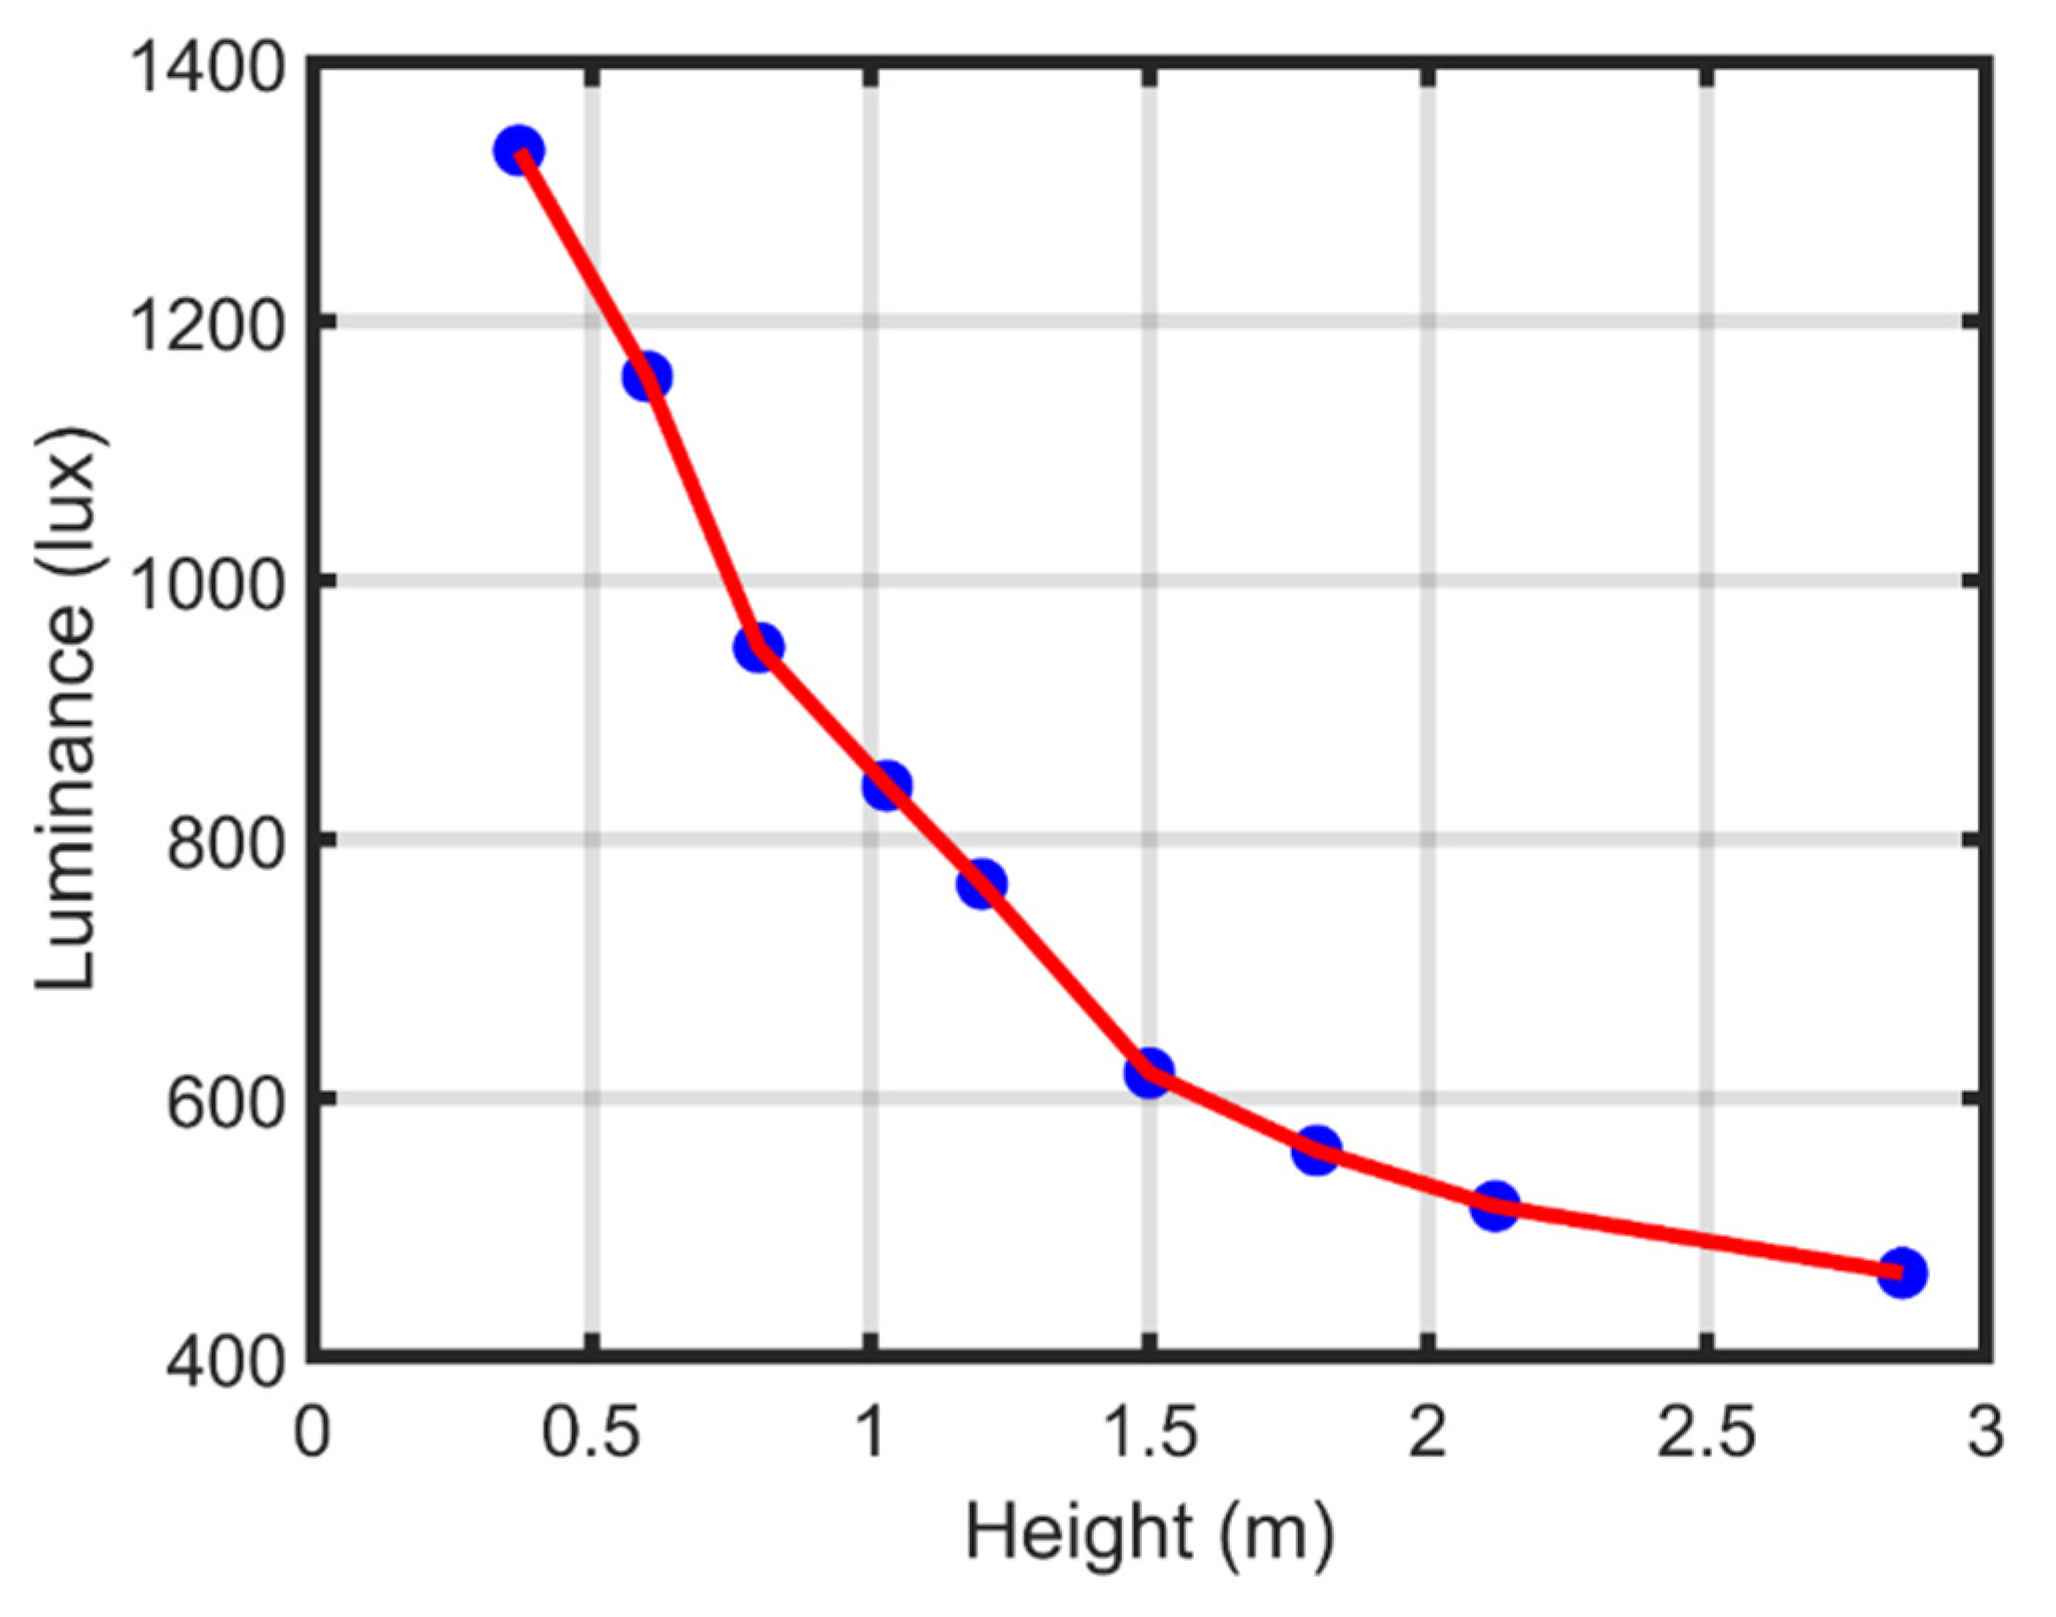
2.1. Study Area
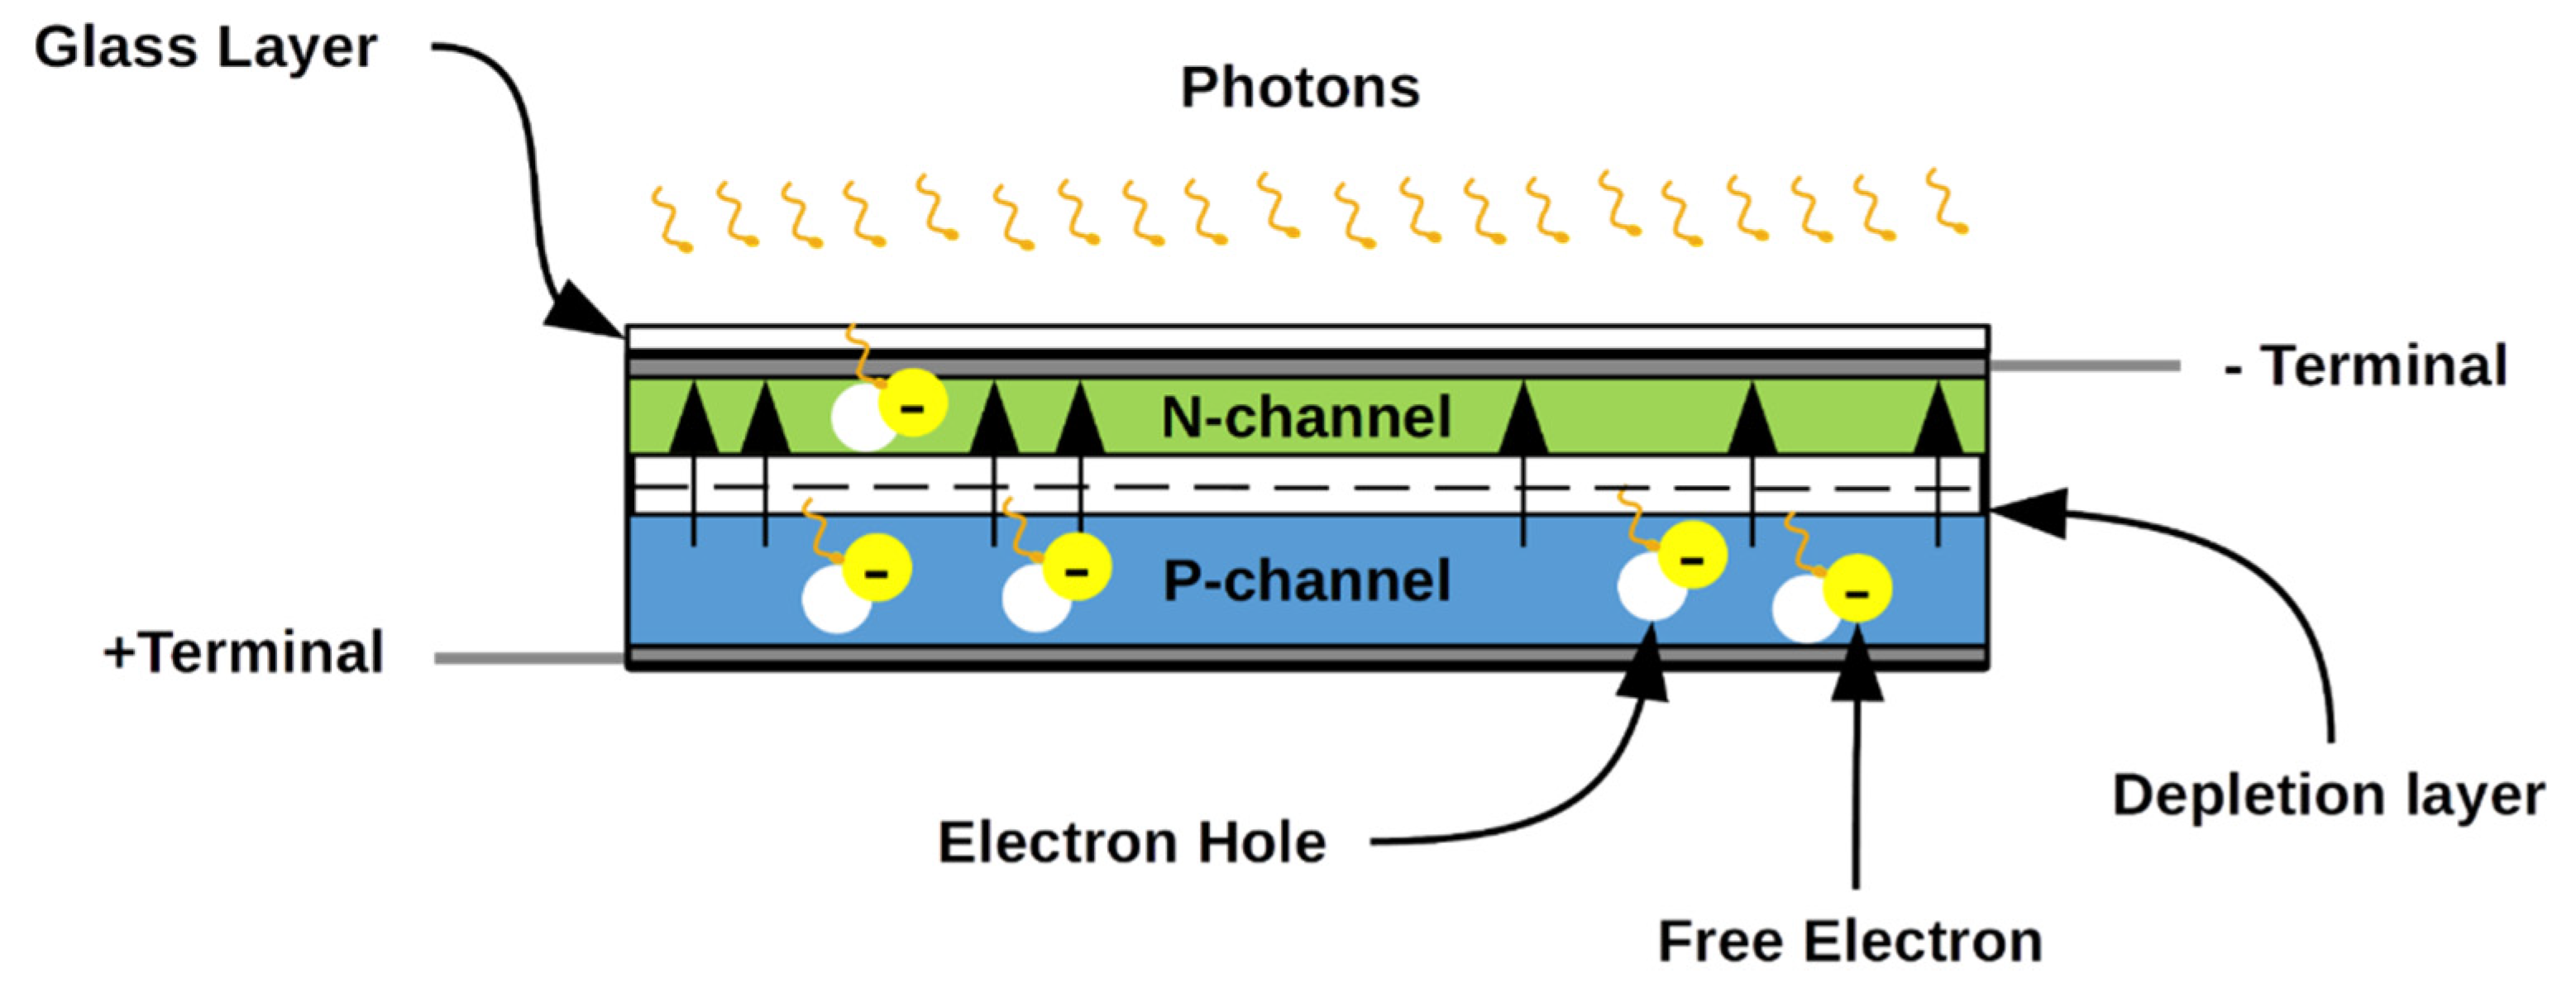
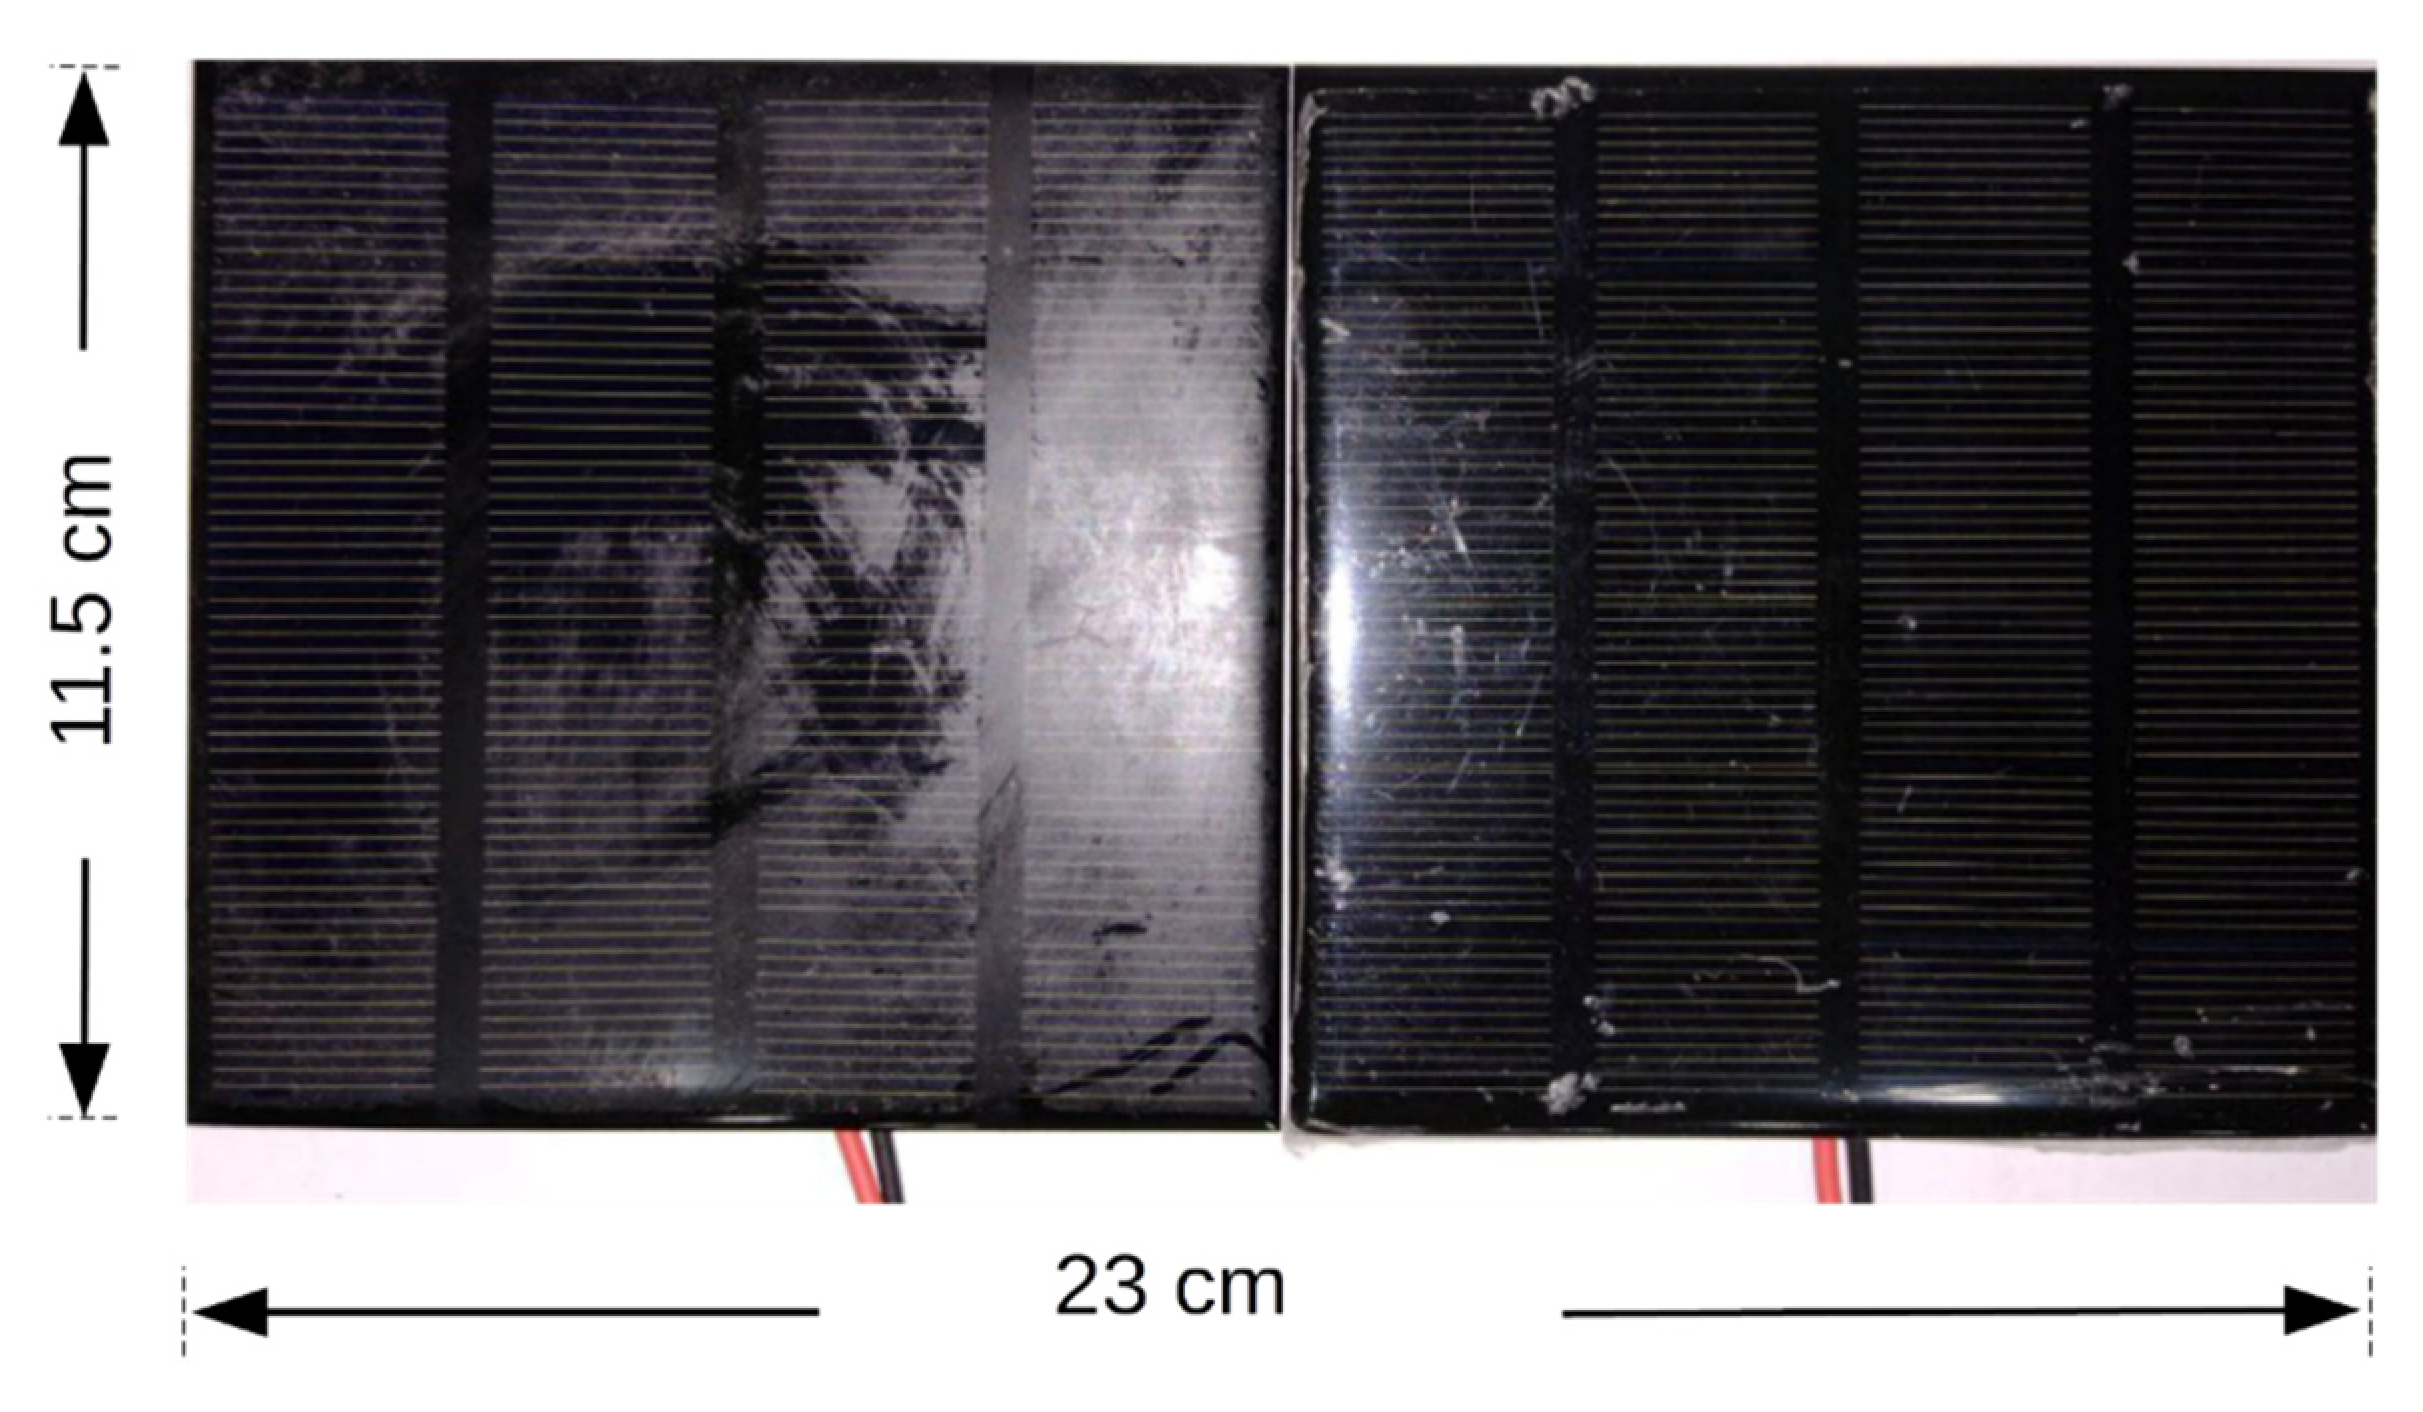
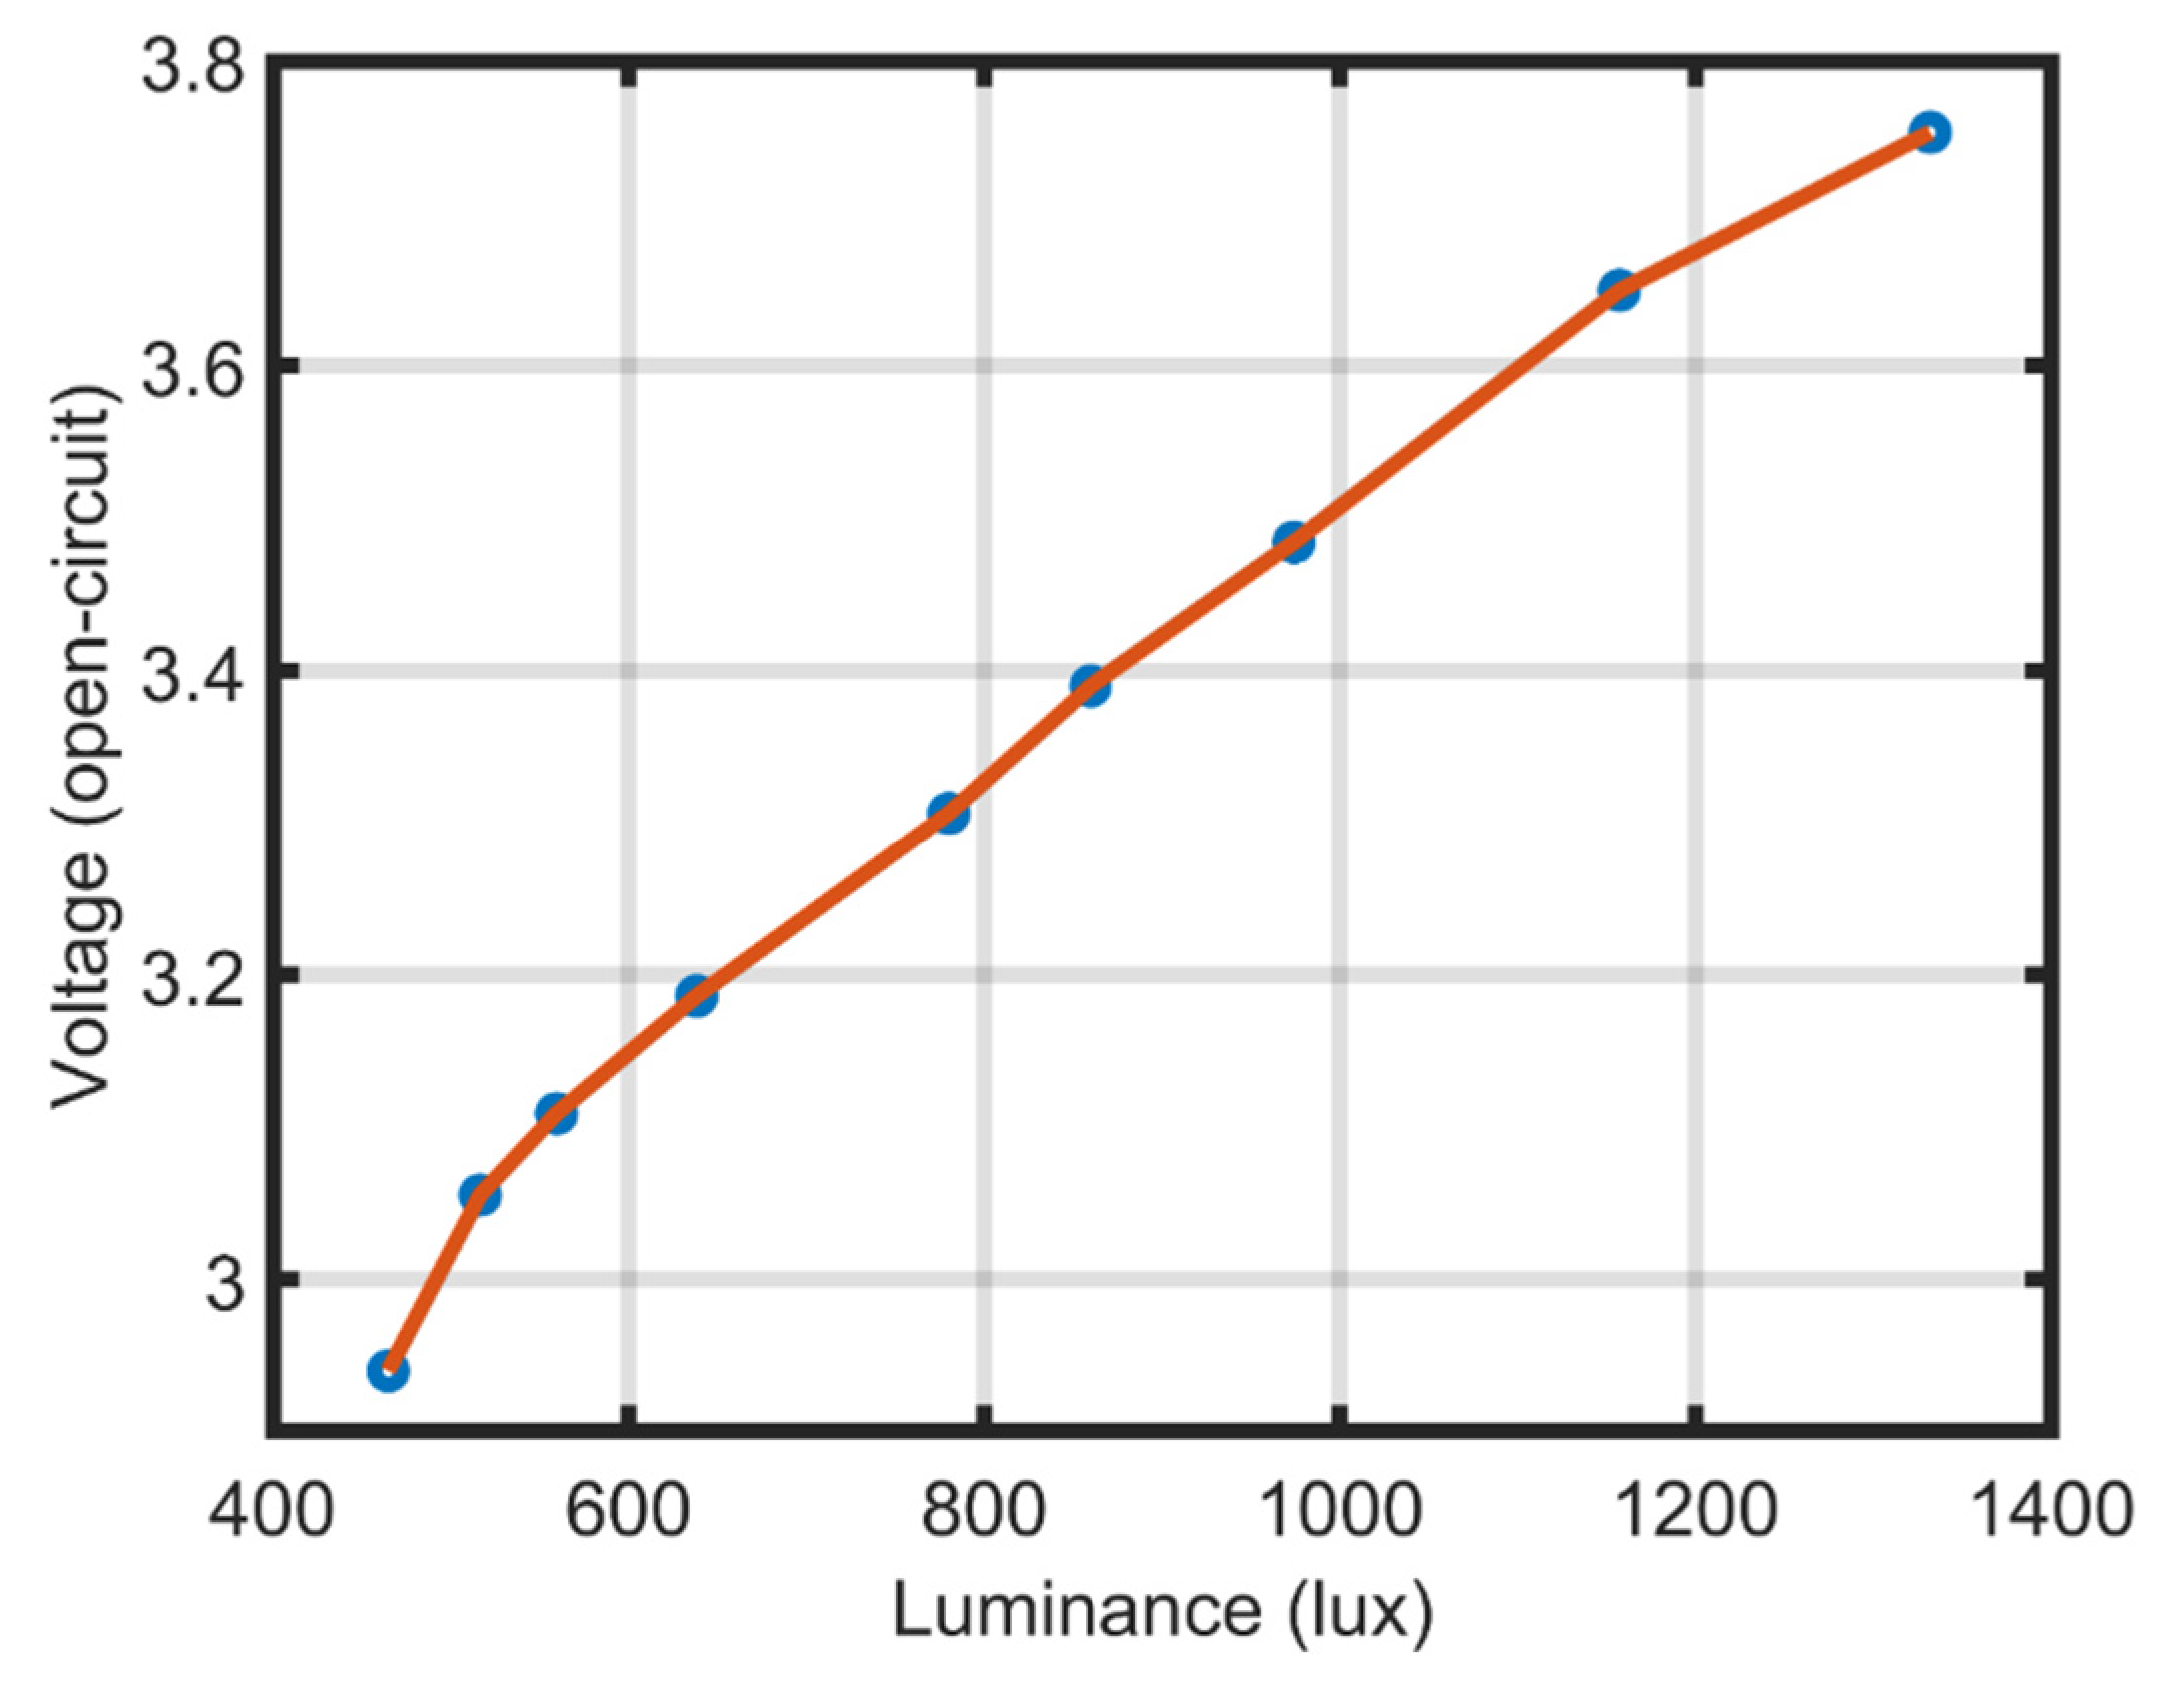
2.2. PV Cells
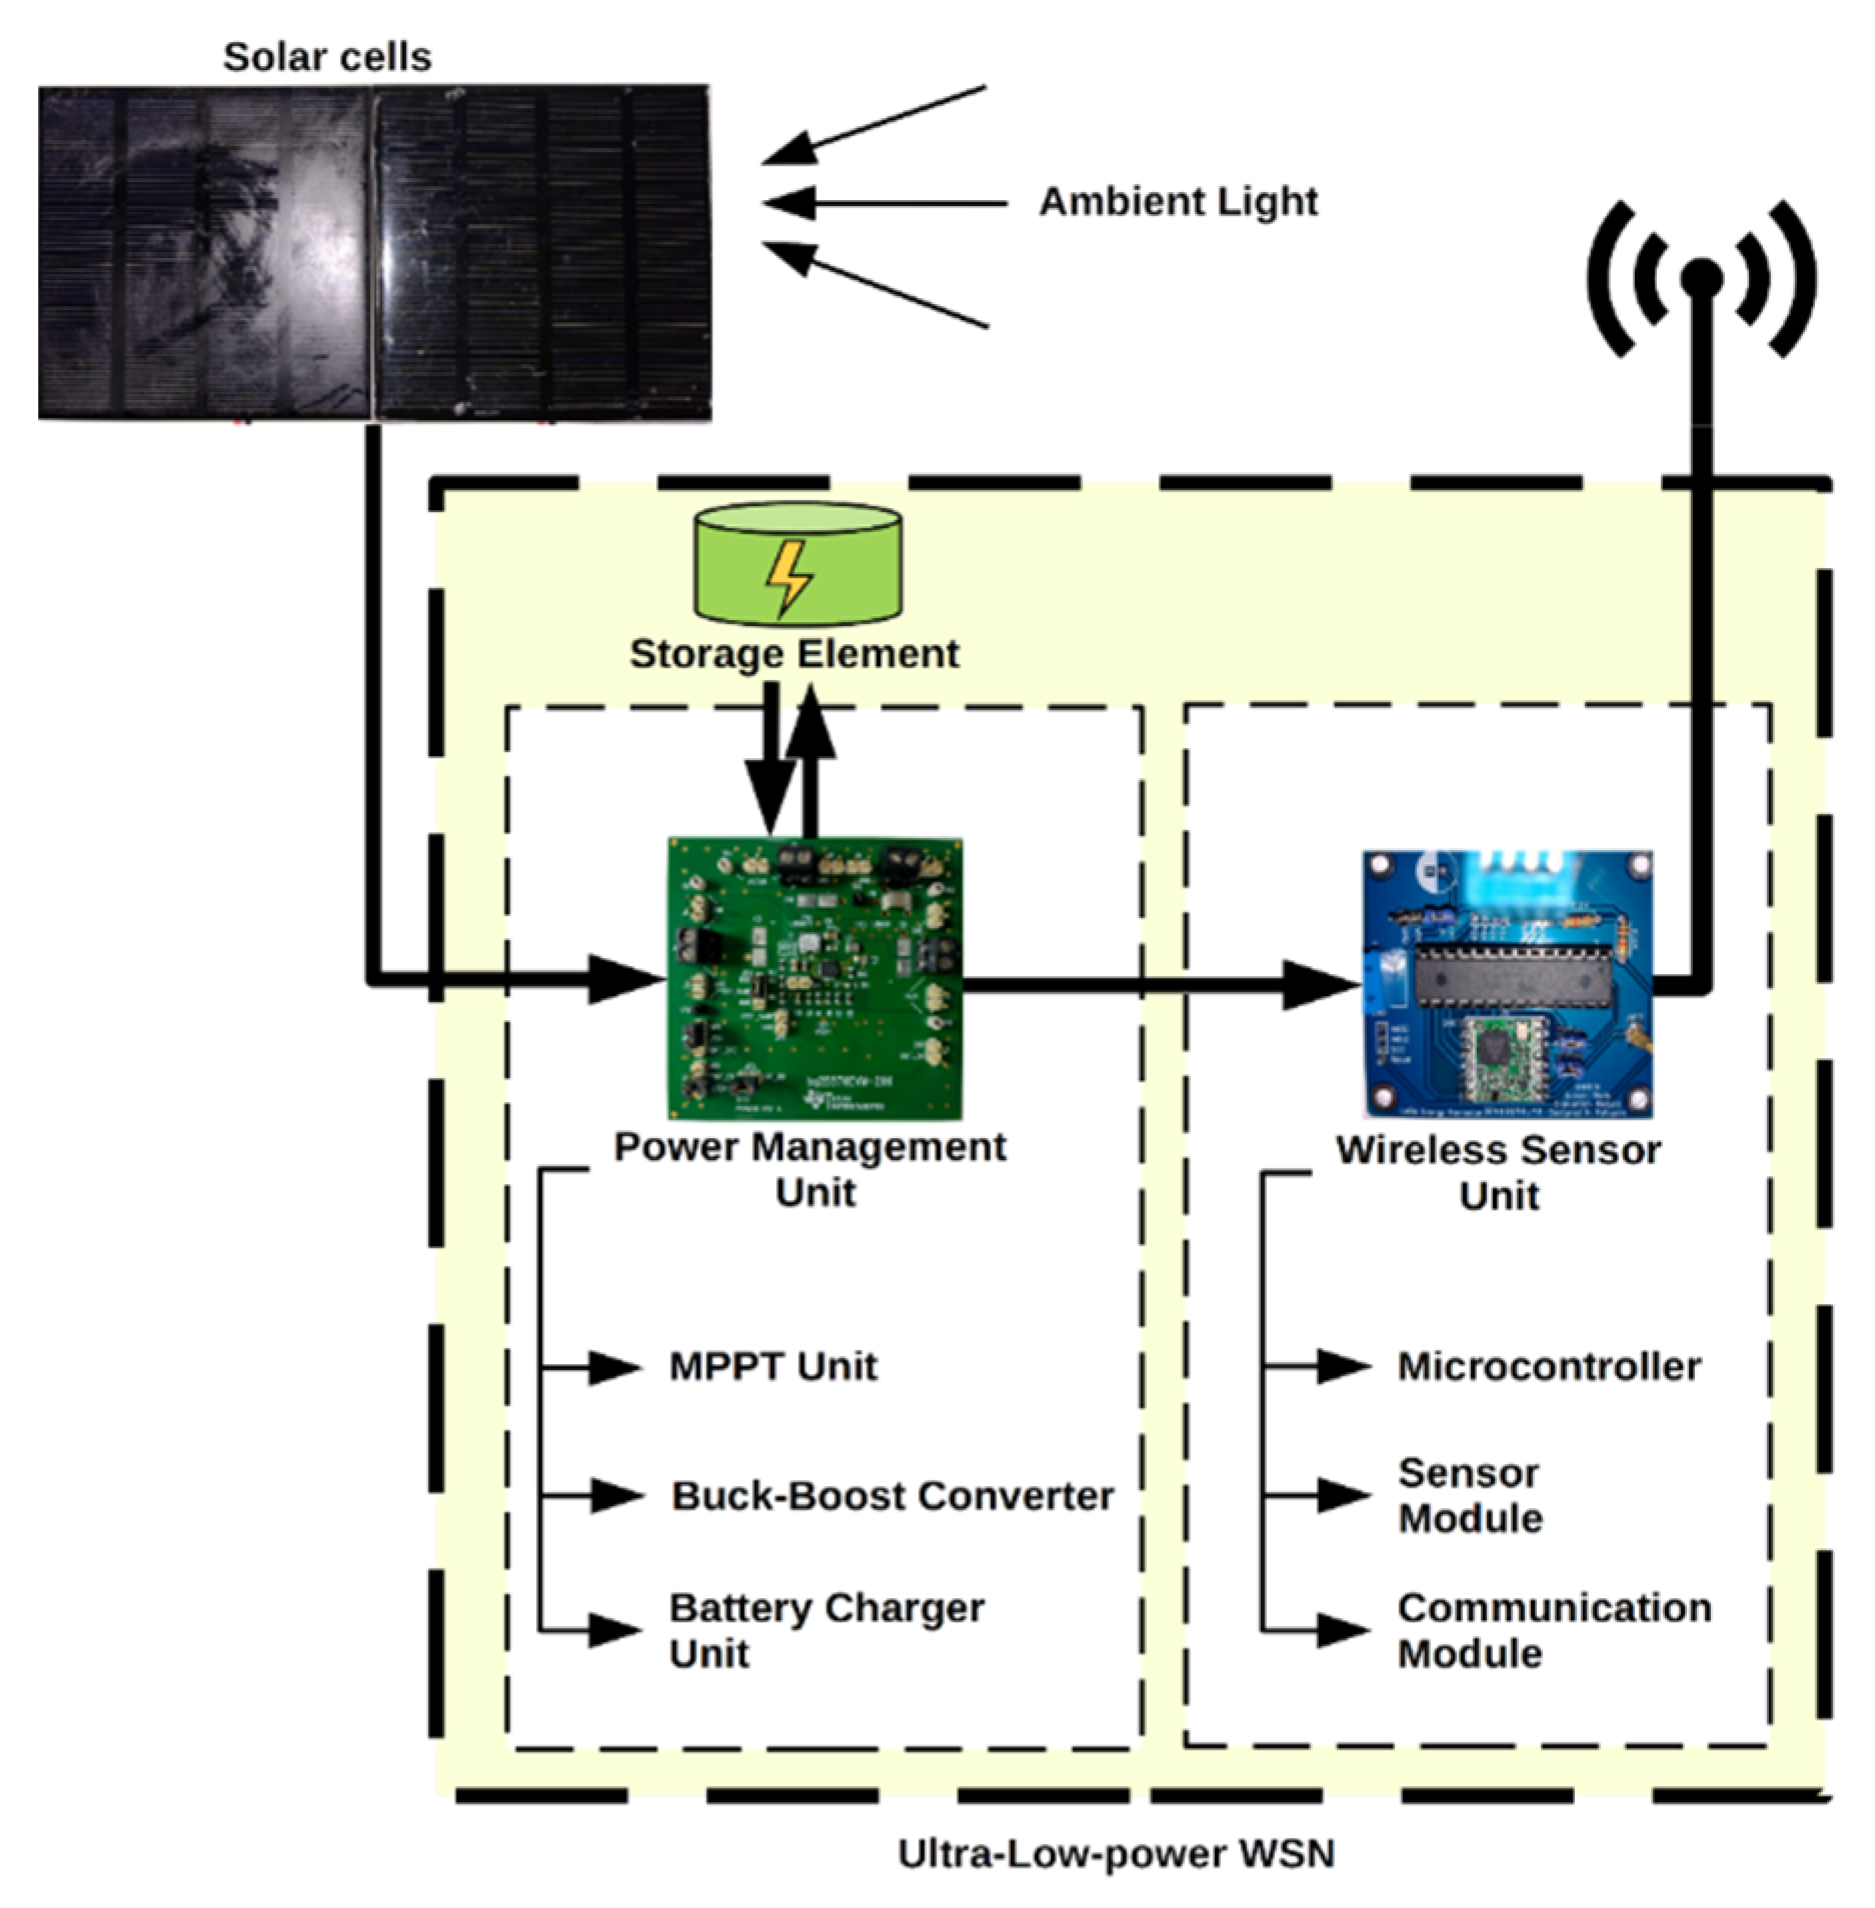
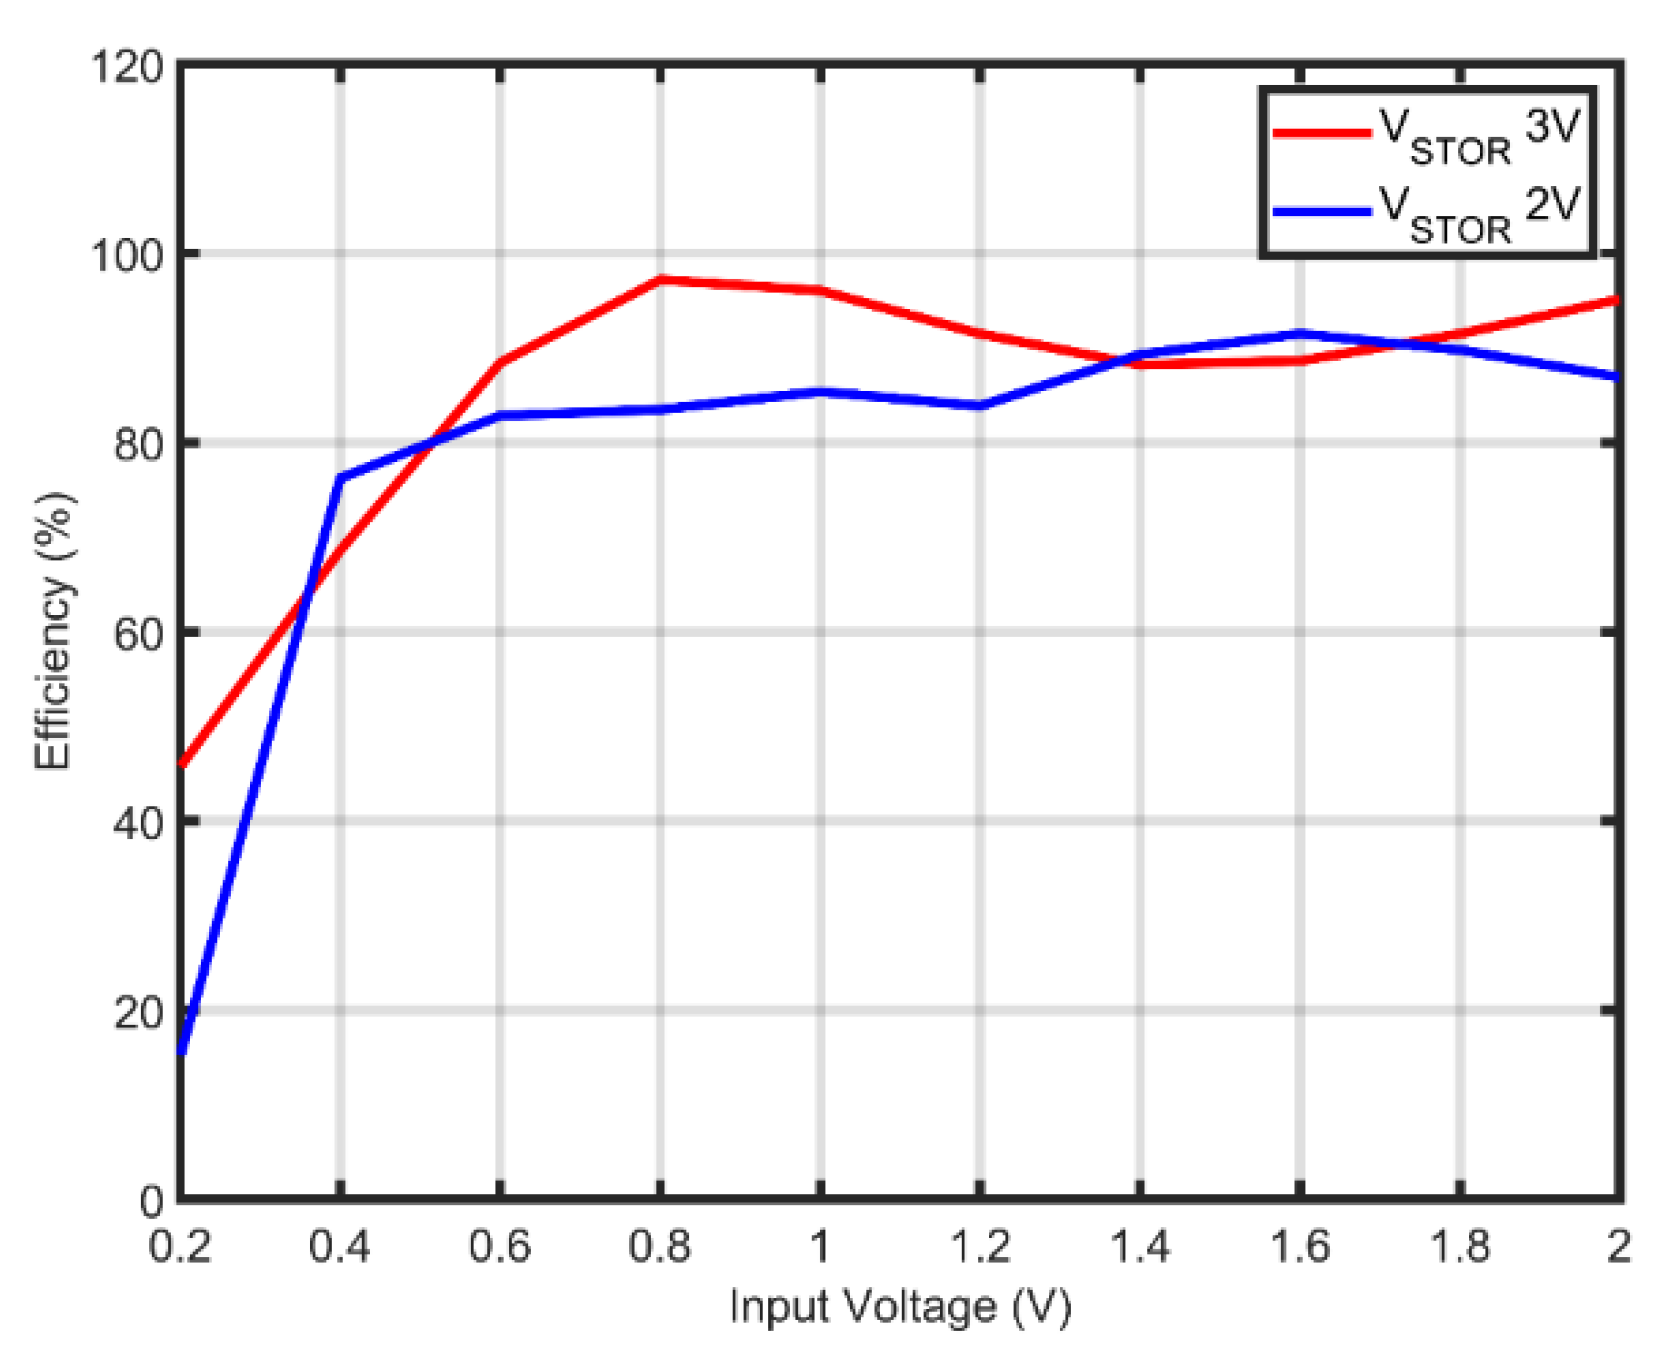
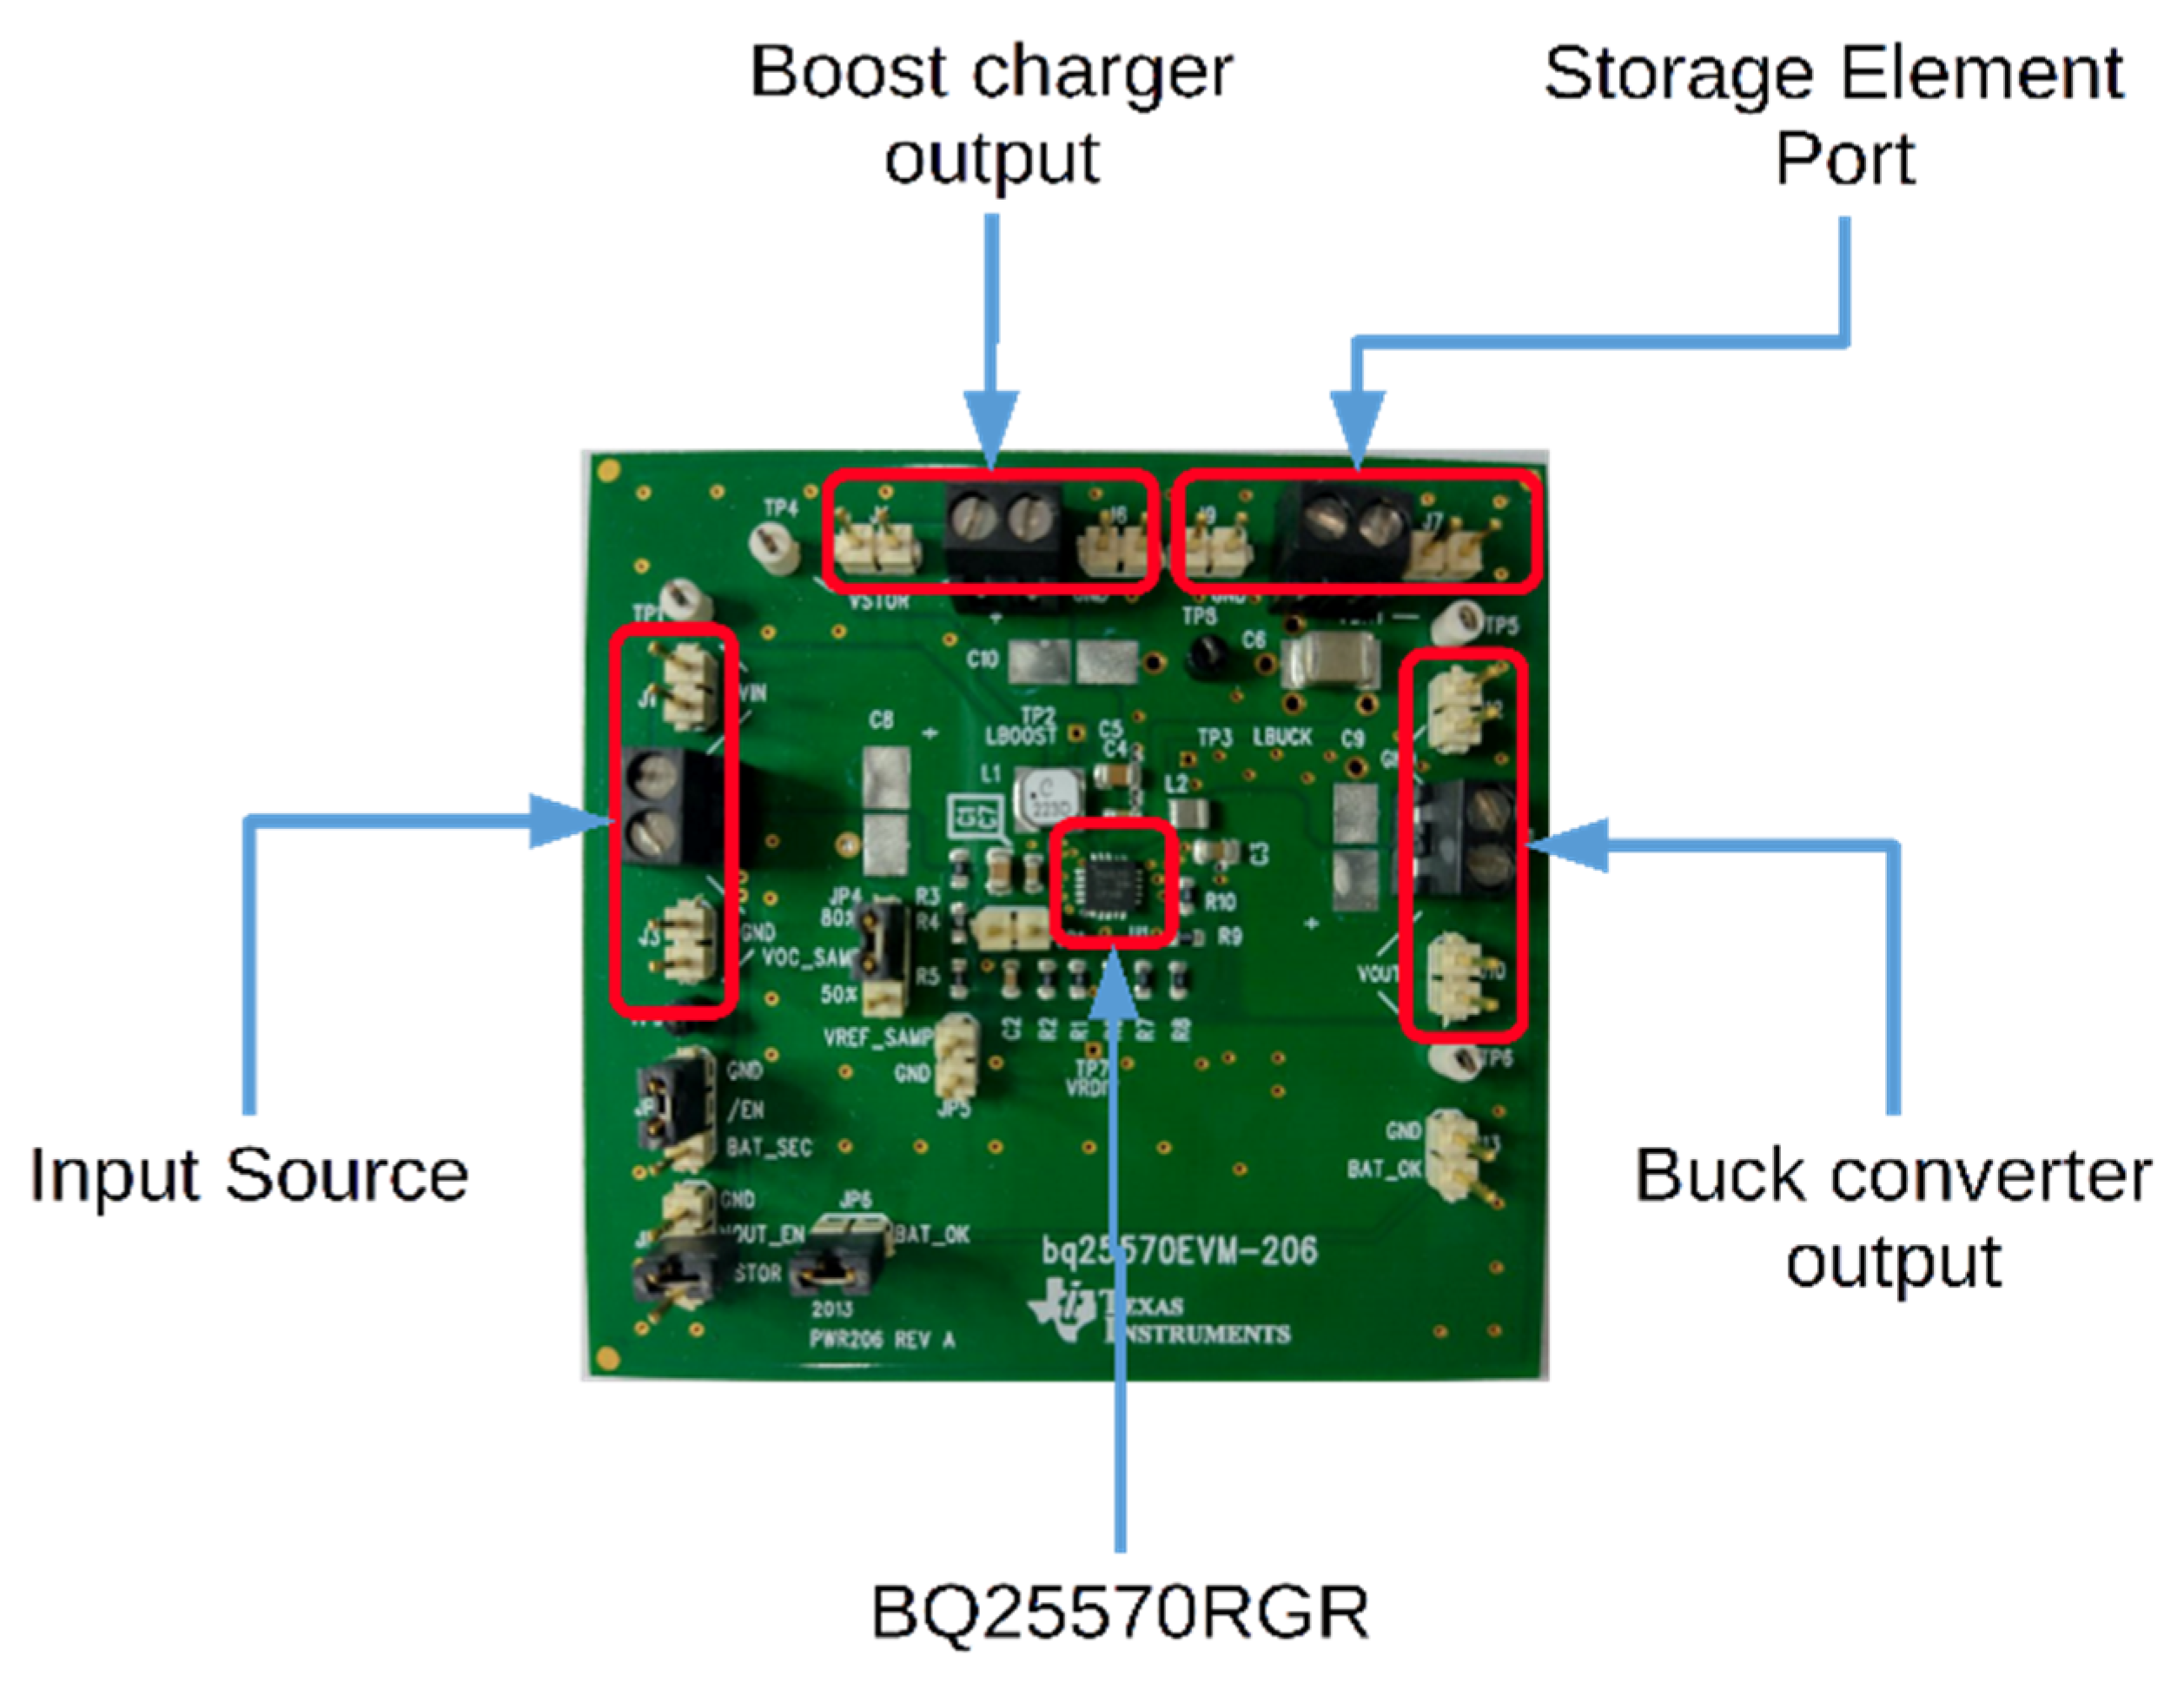
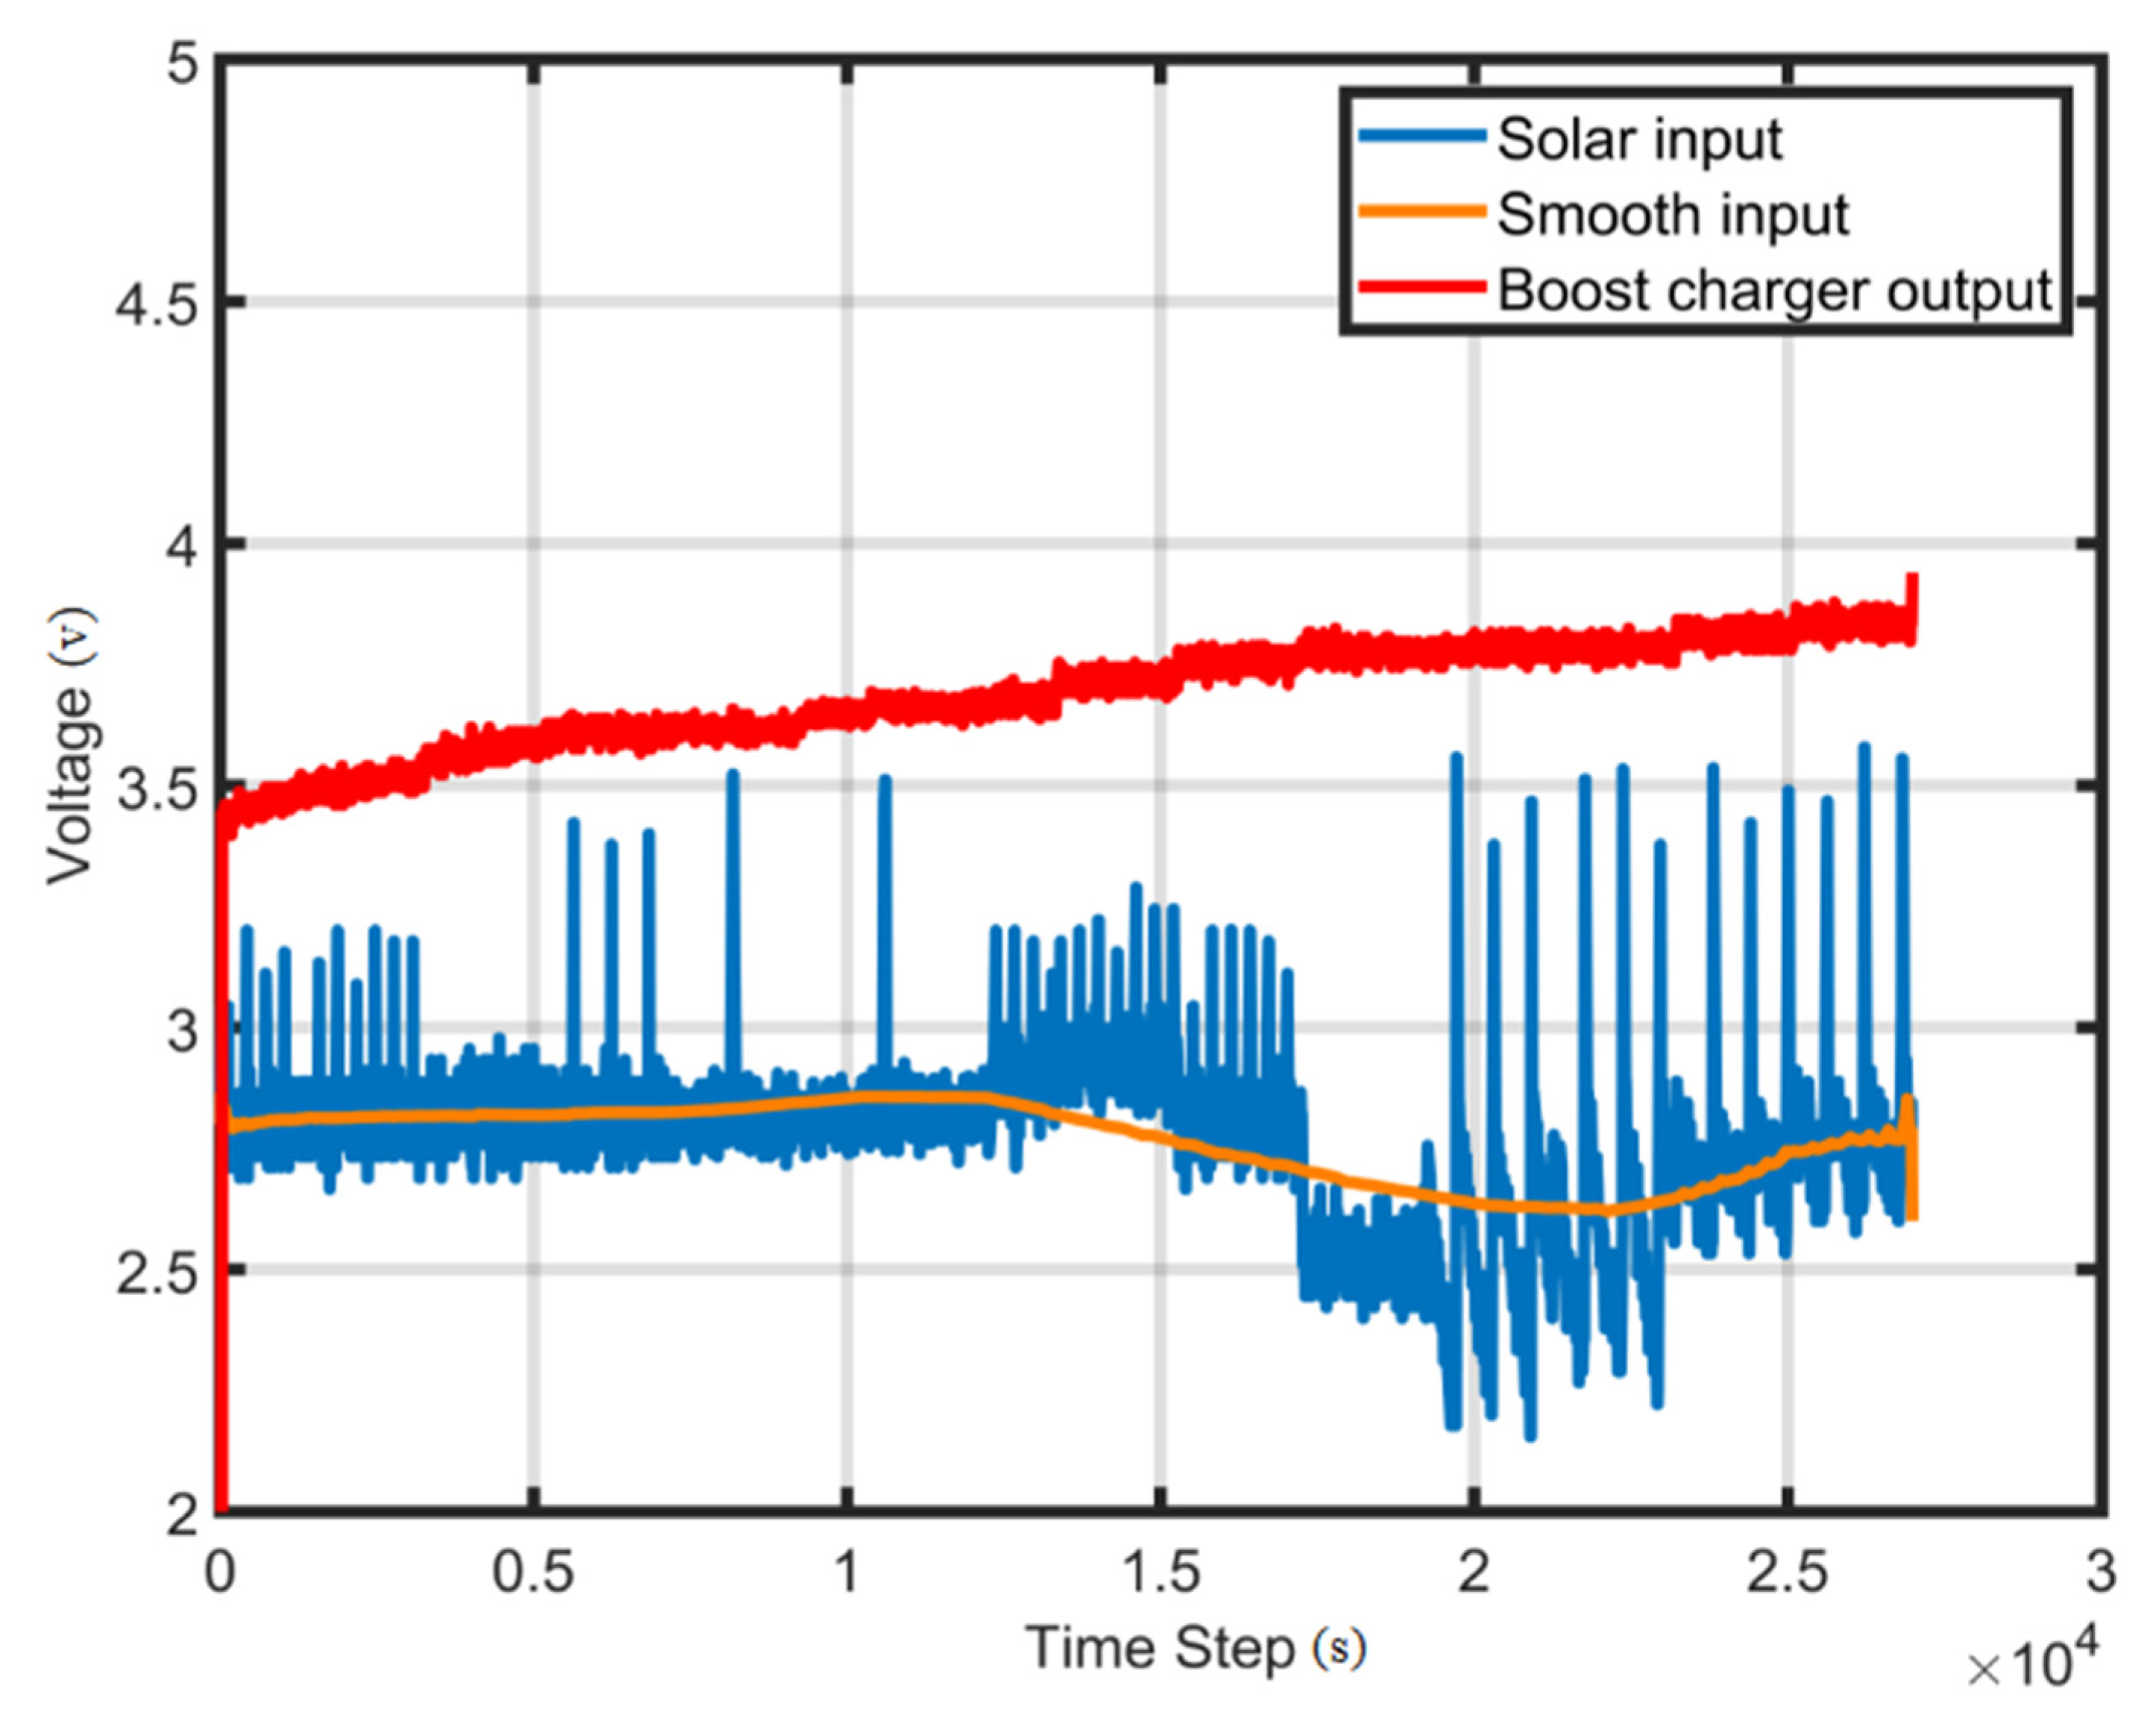
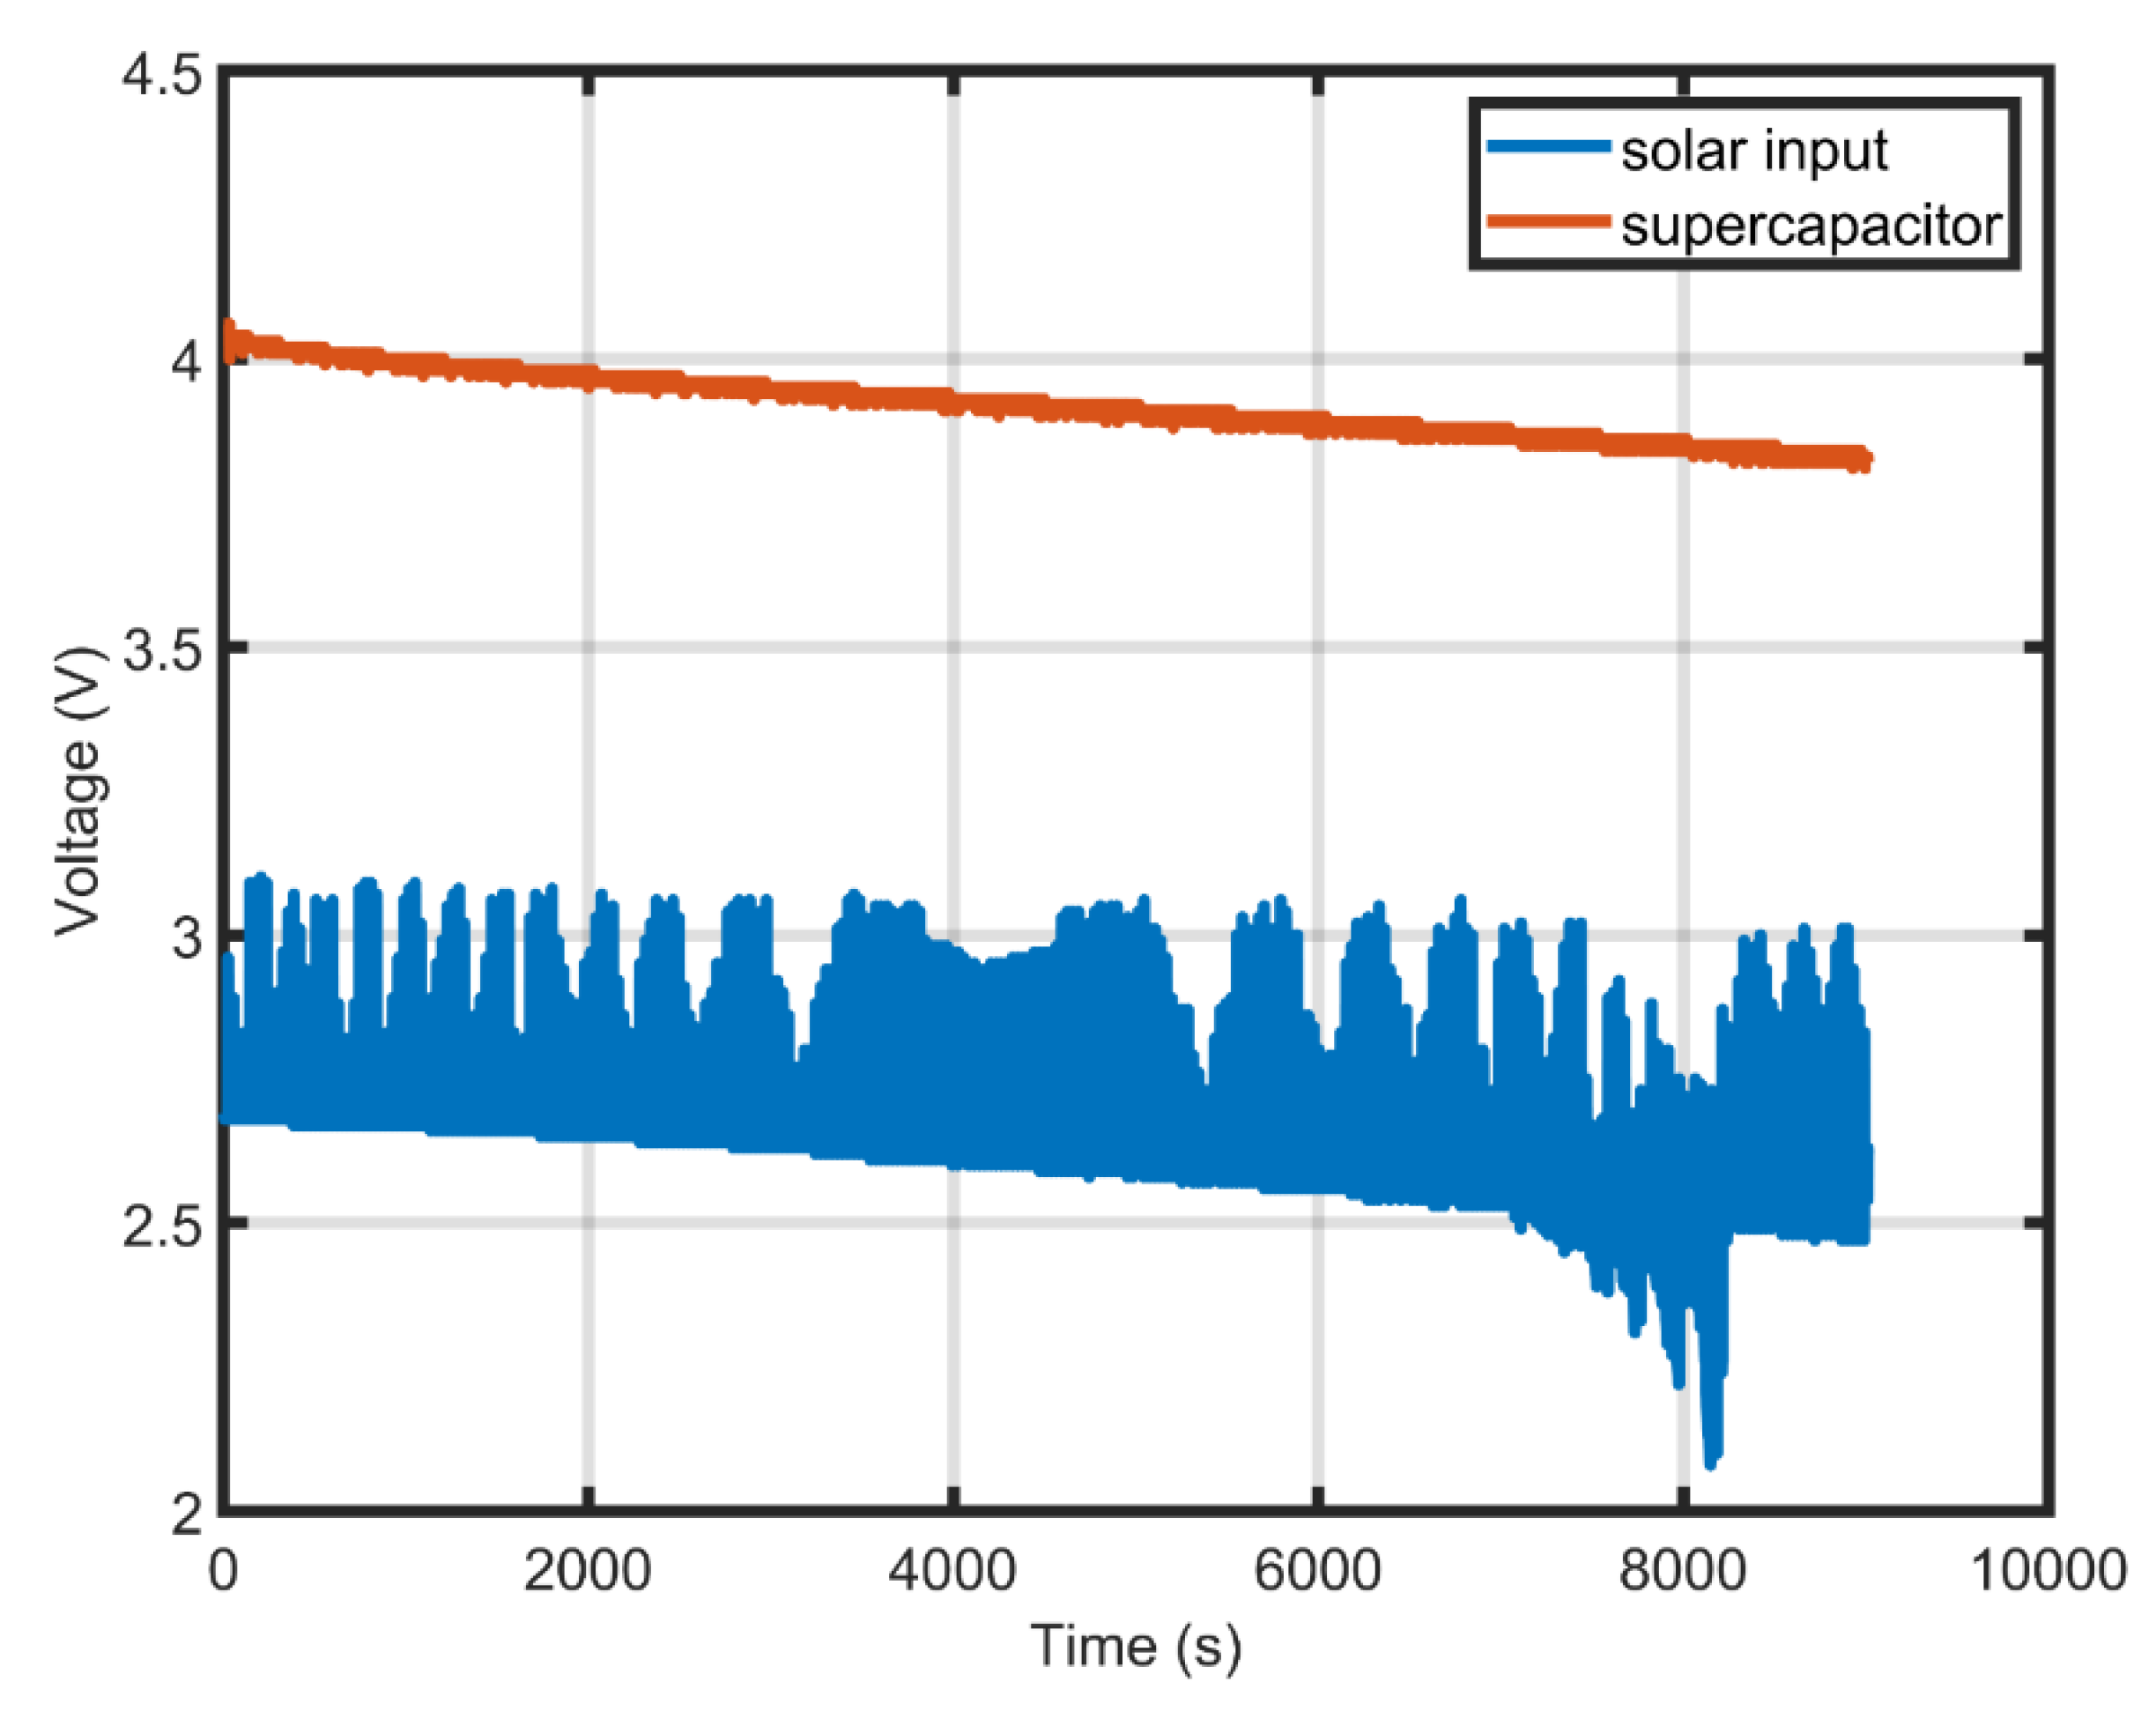
2.3. Power Management Unit
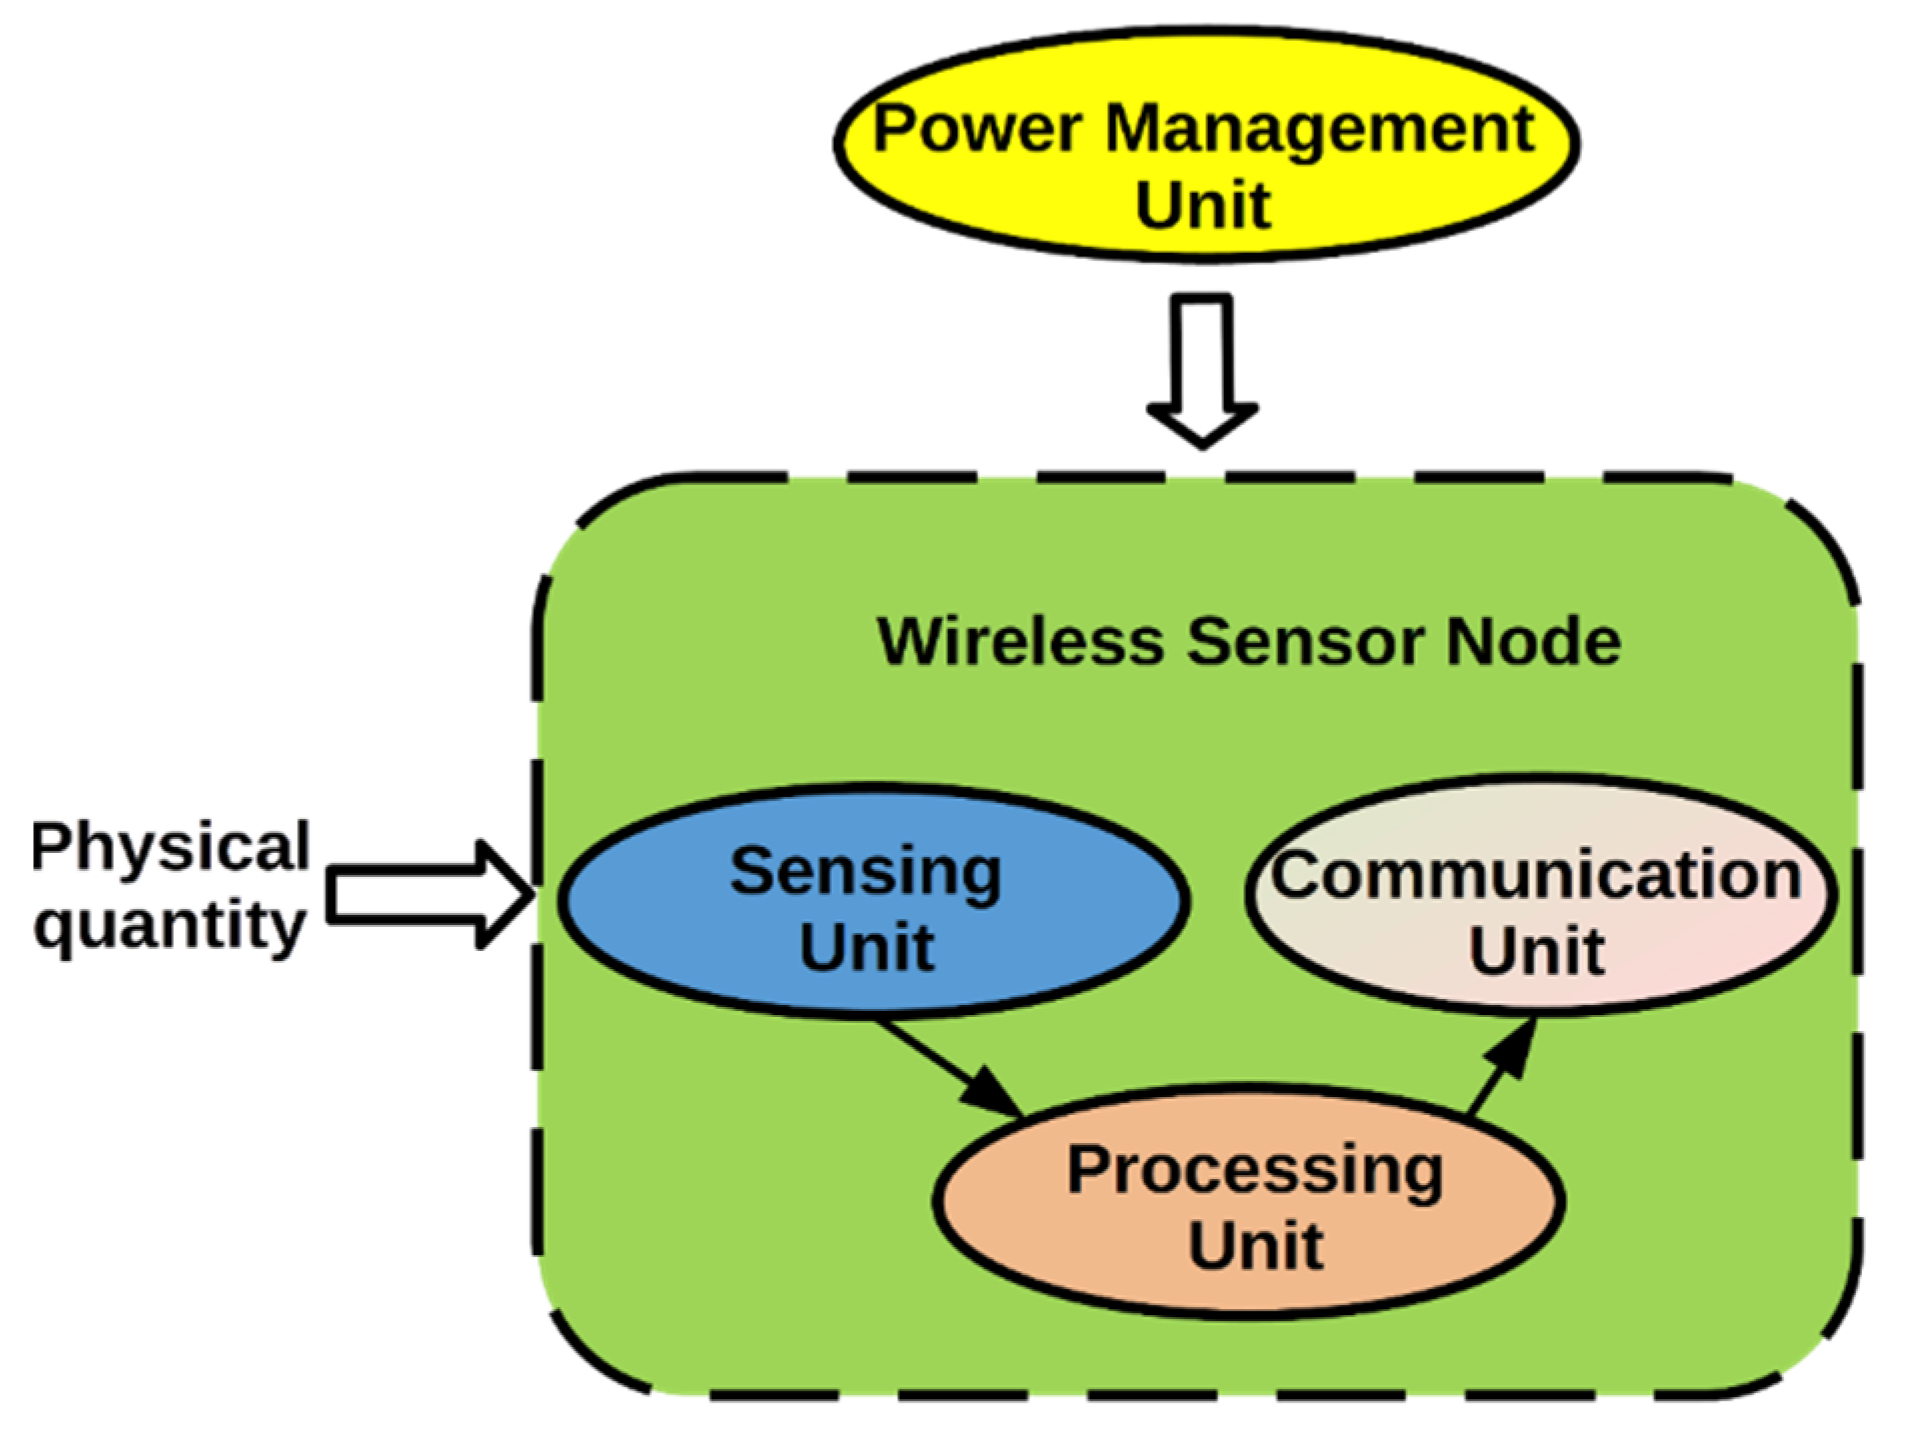
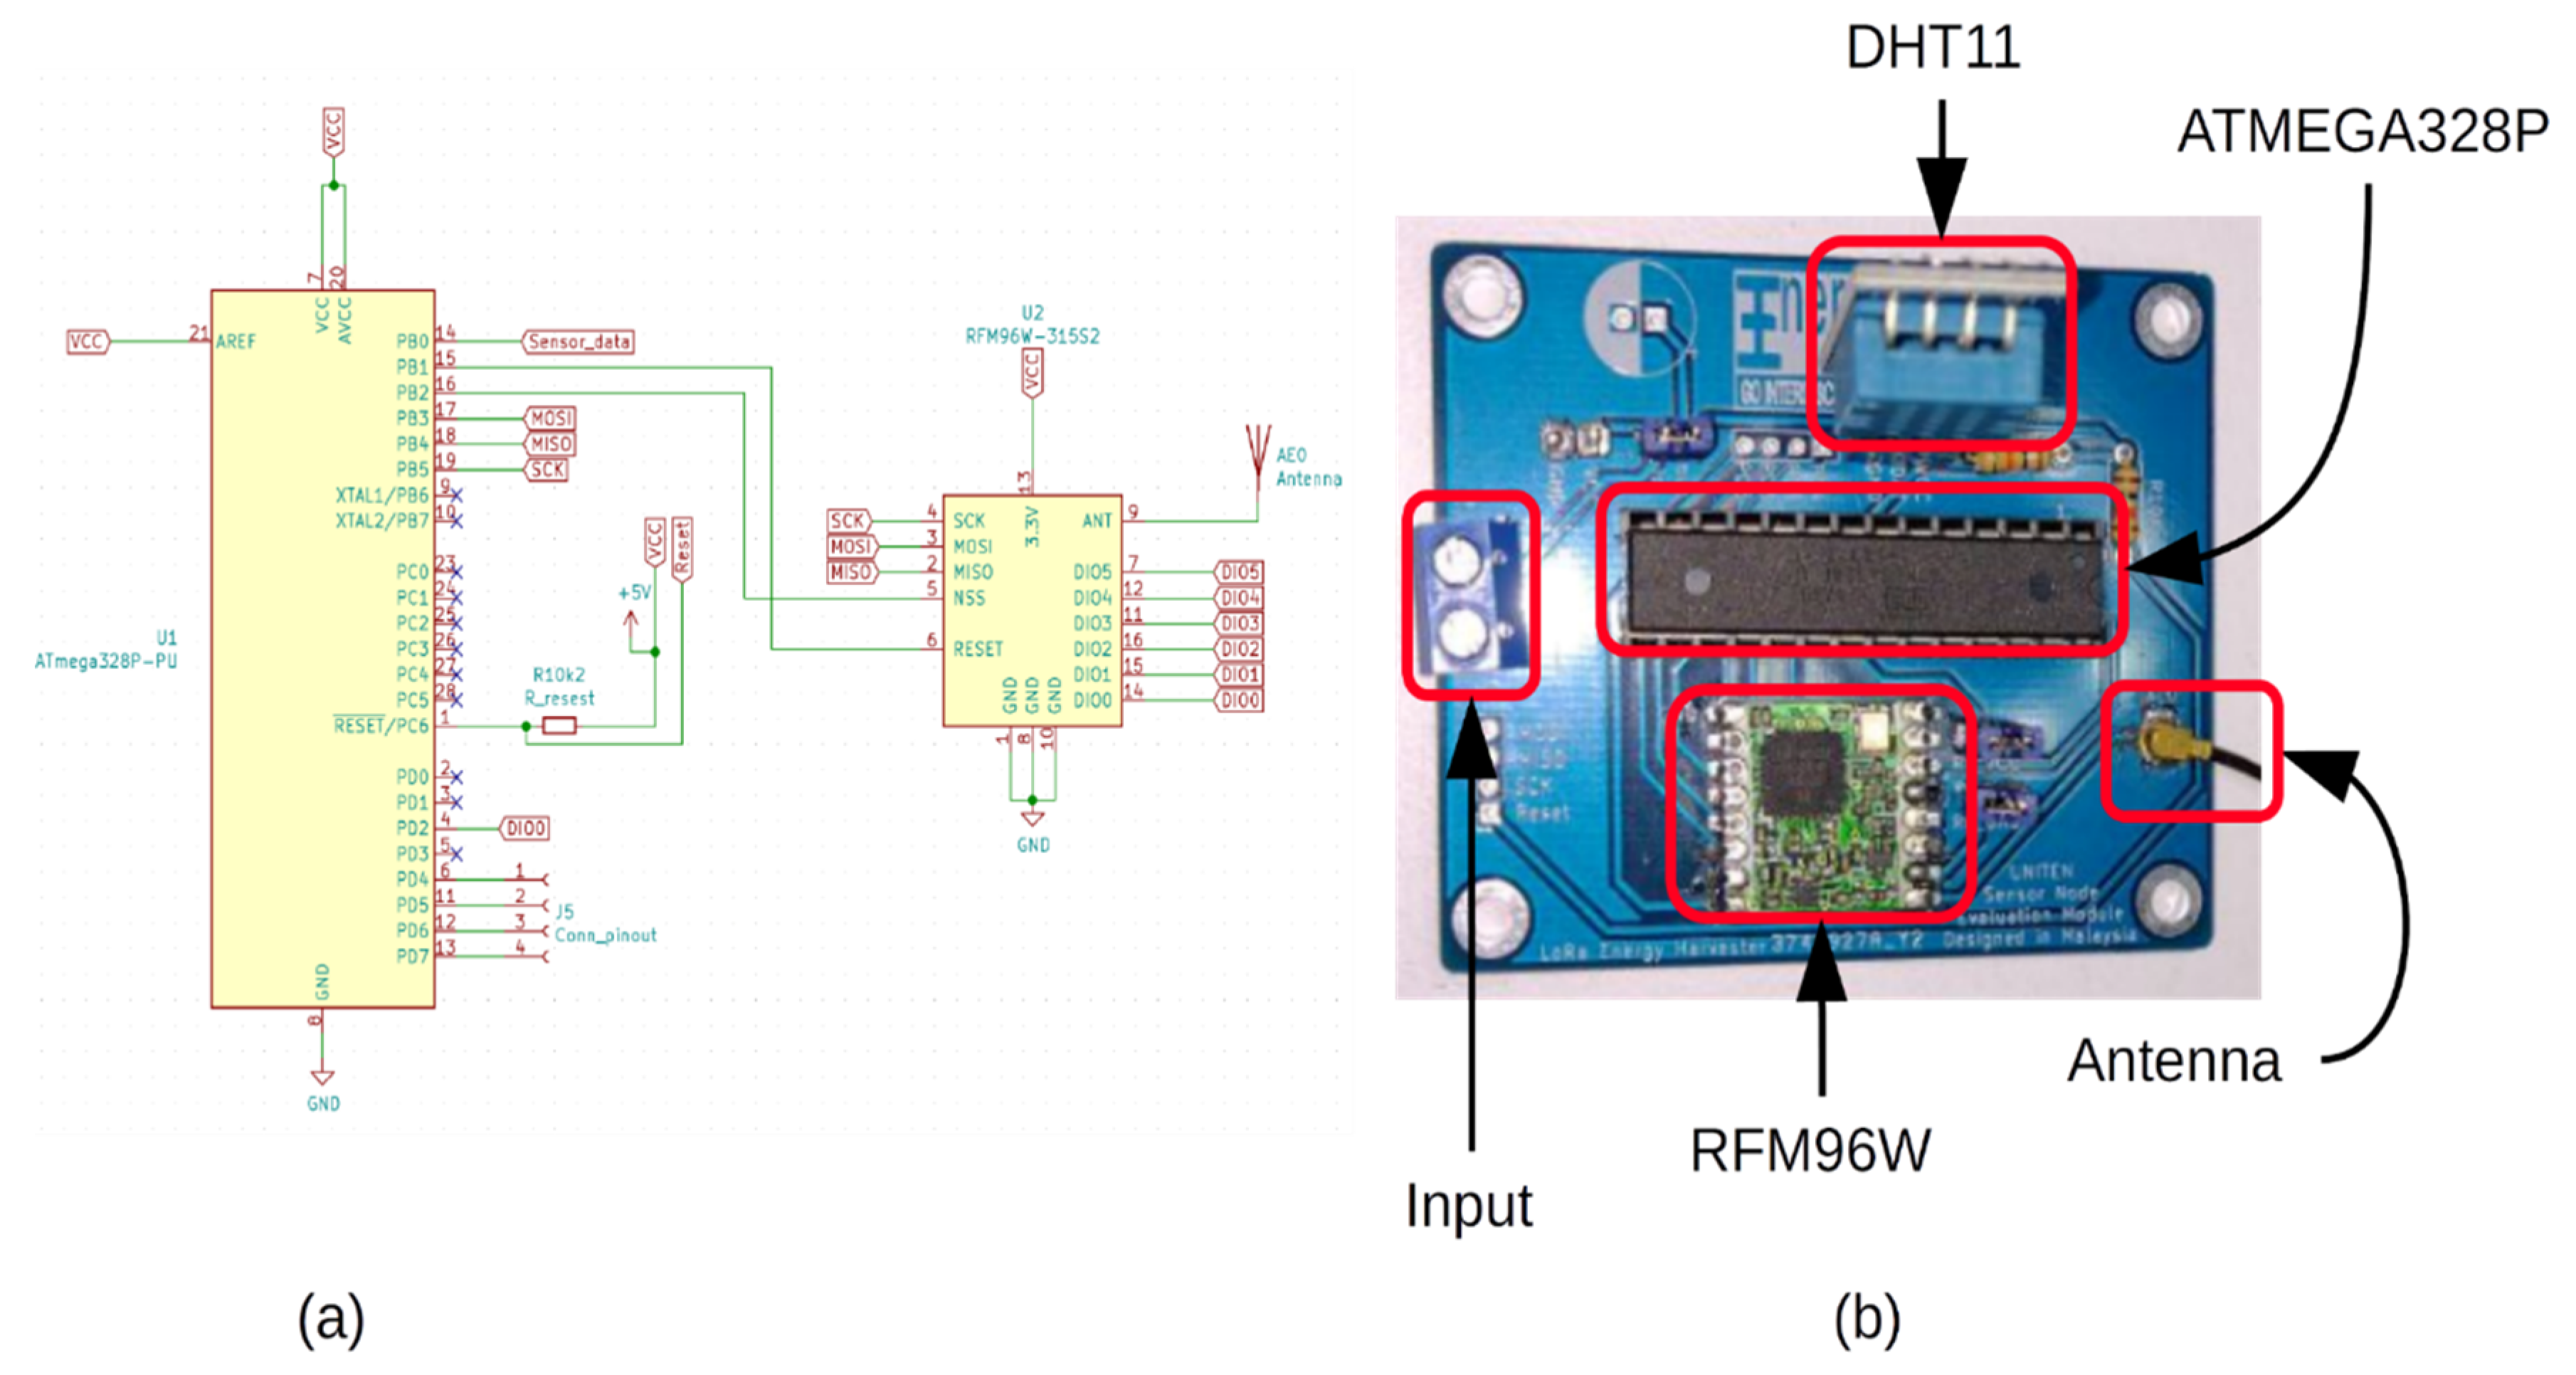
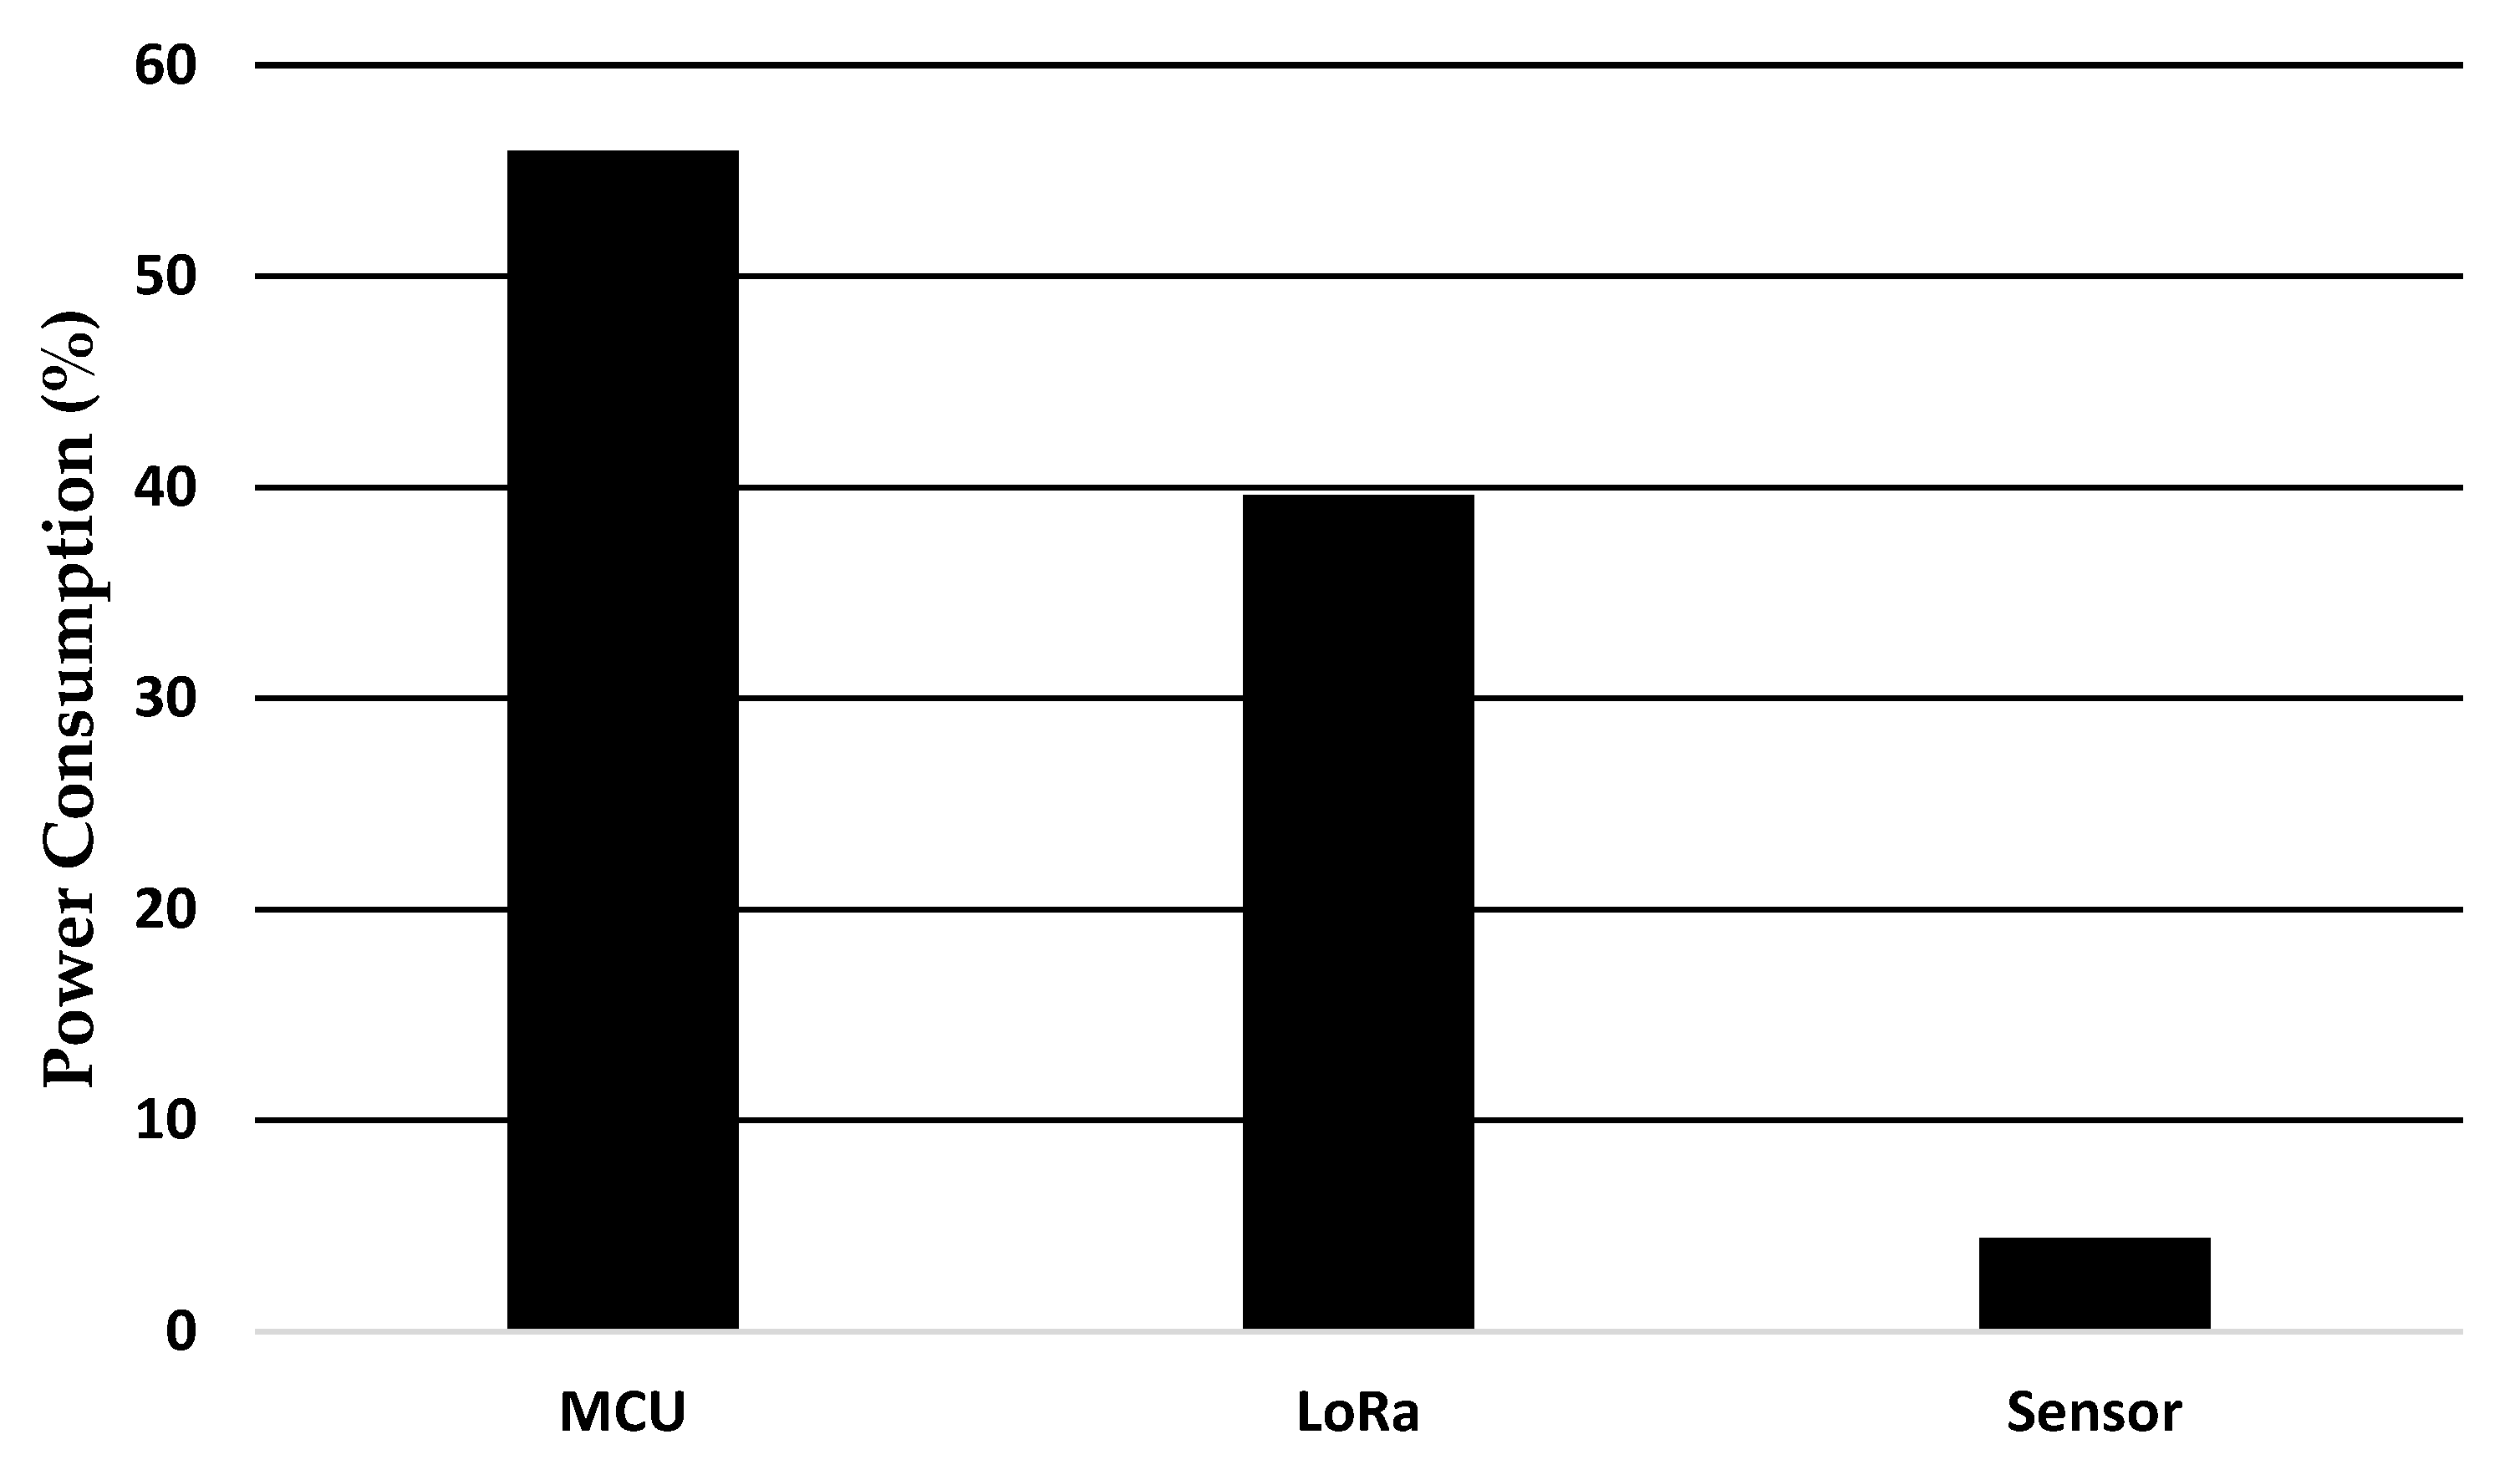
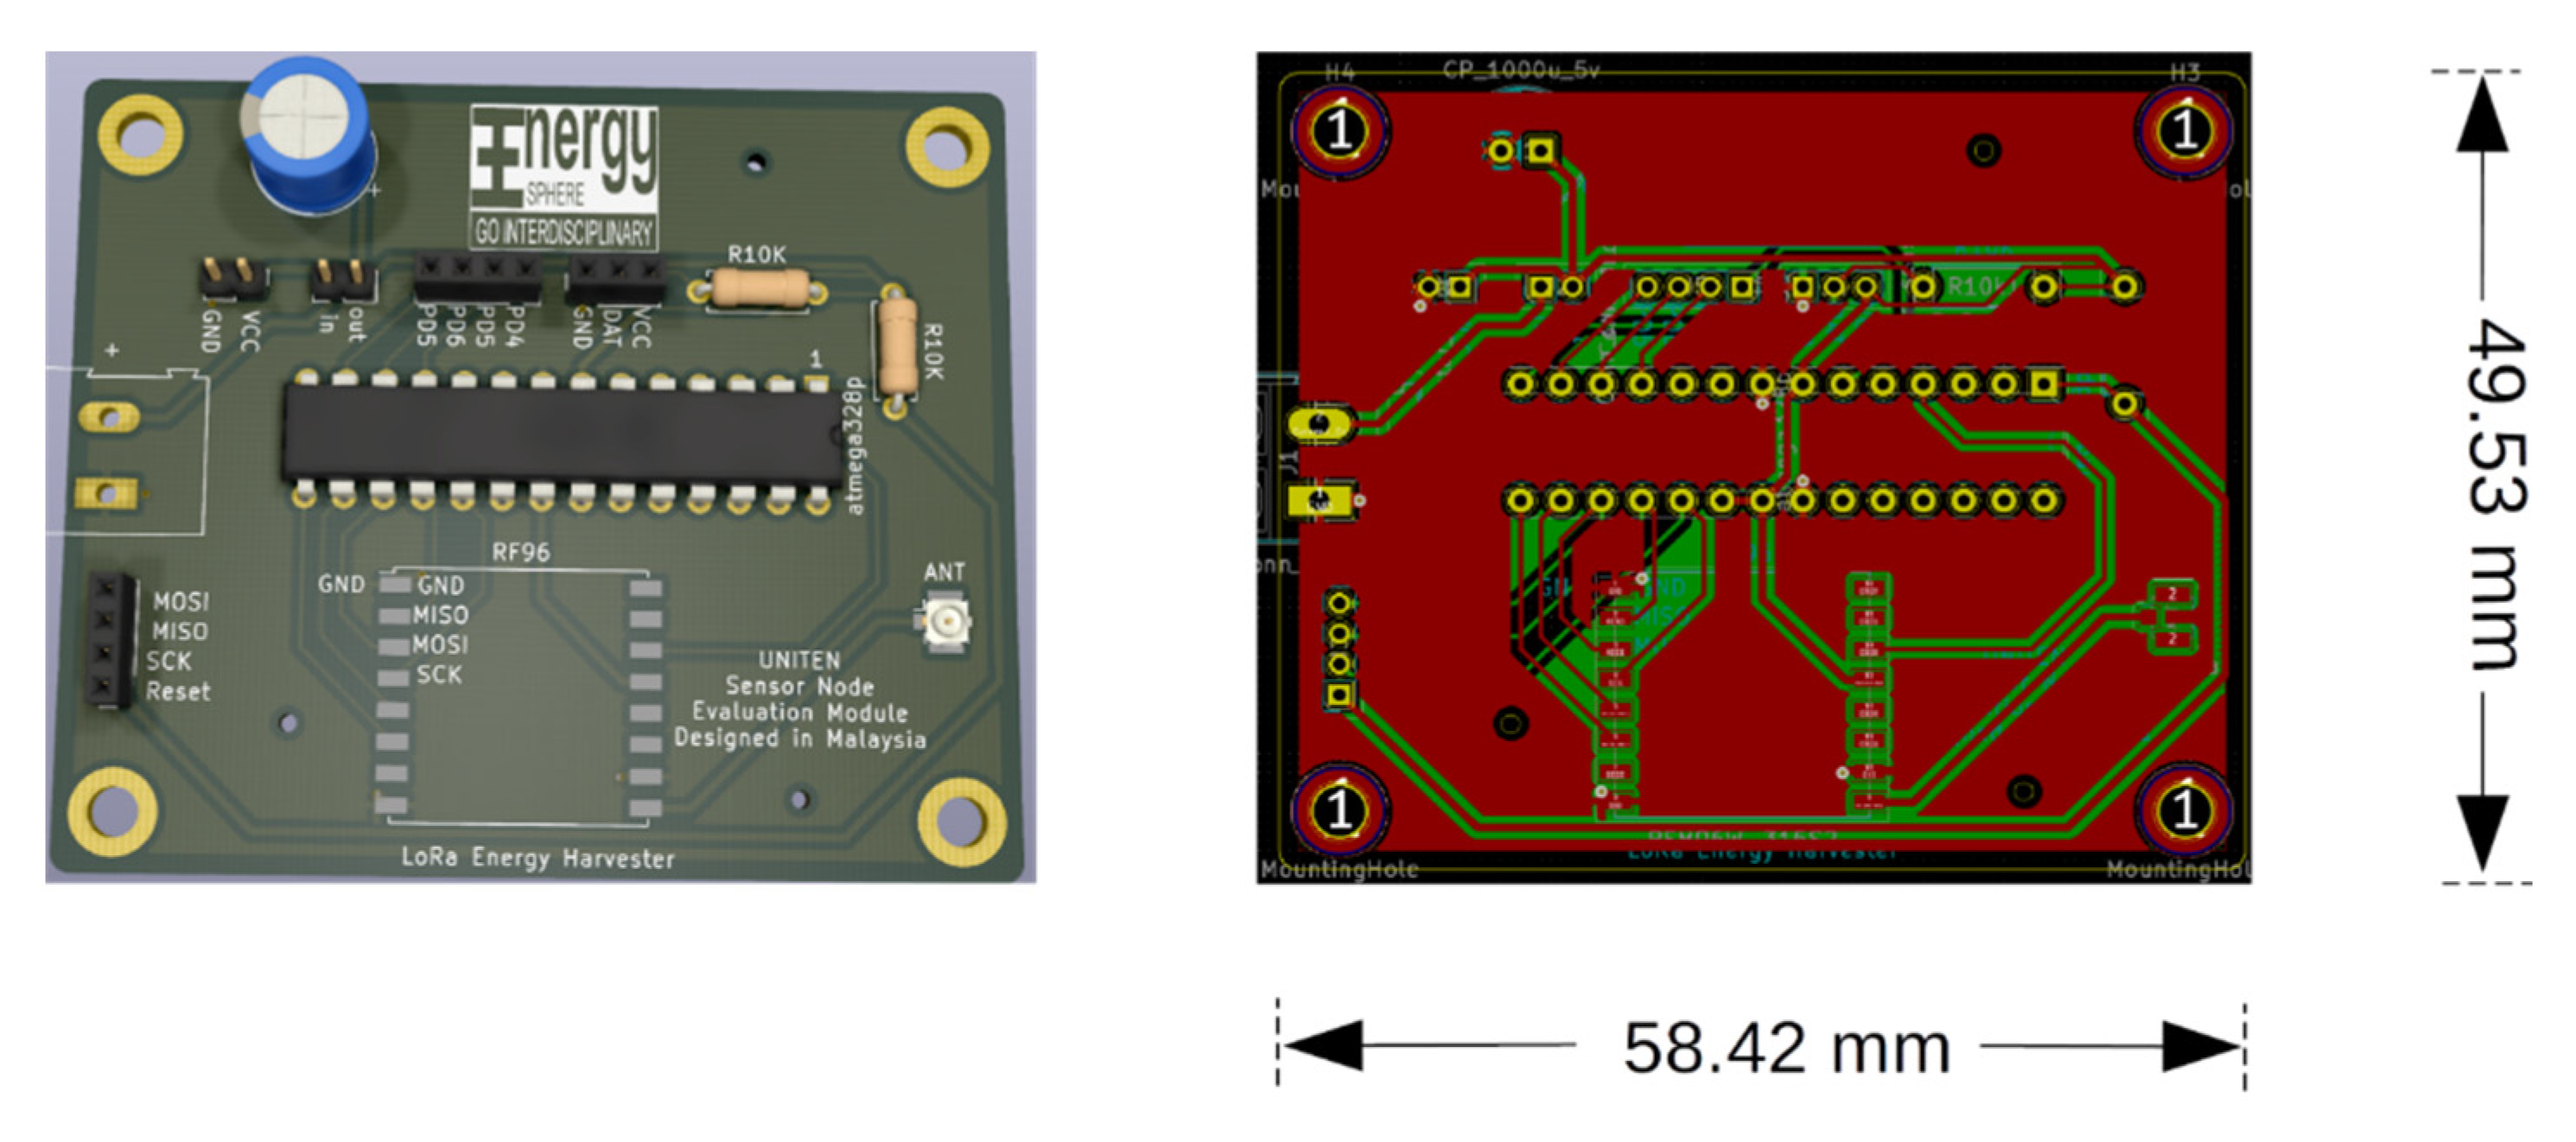
2.4. Wireless Sensor Unit
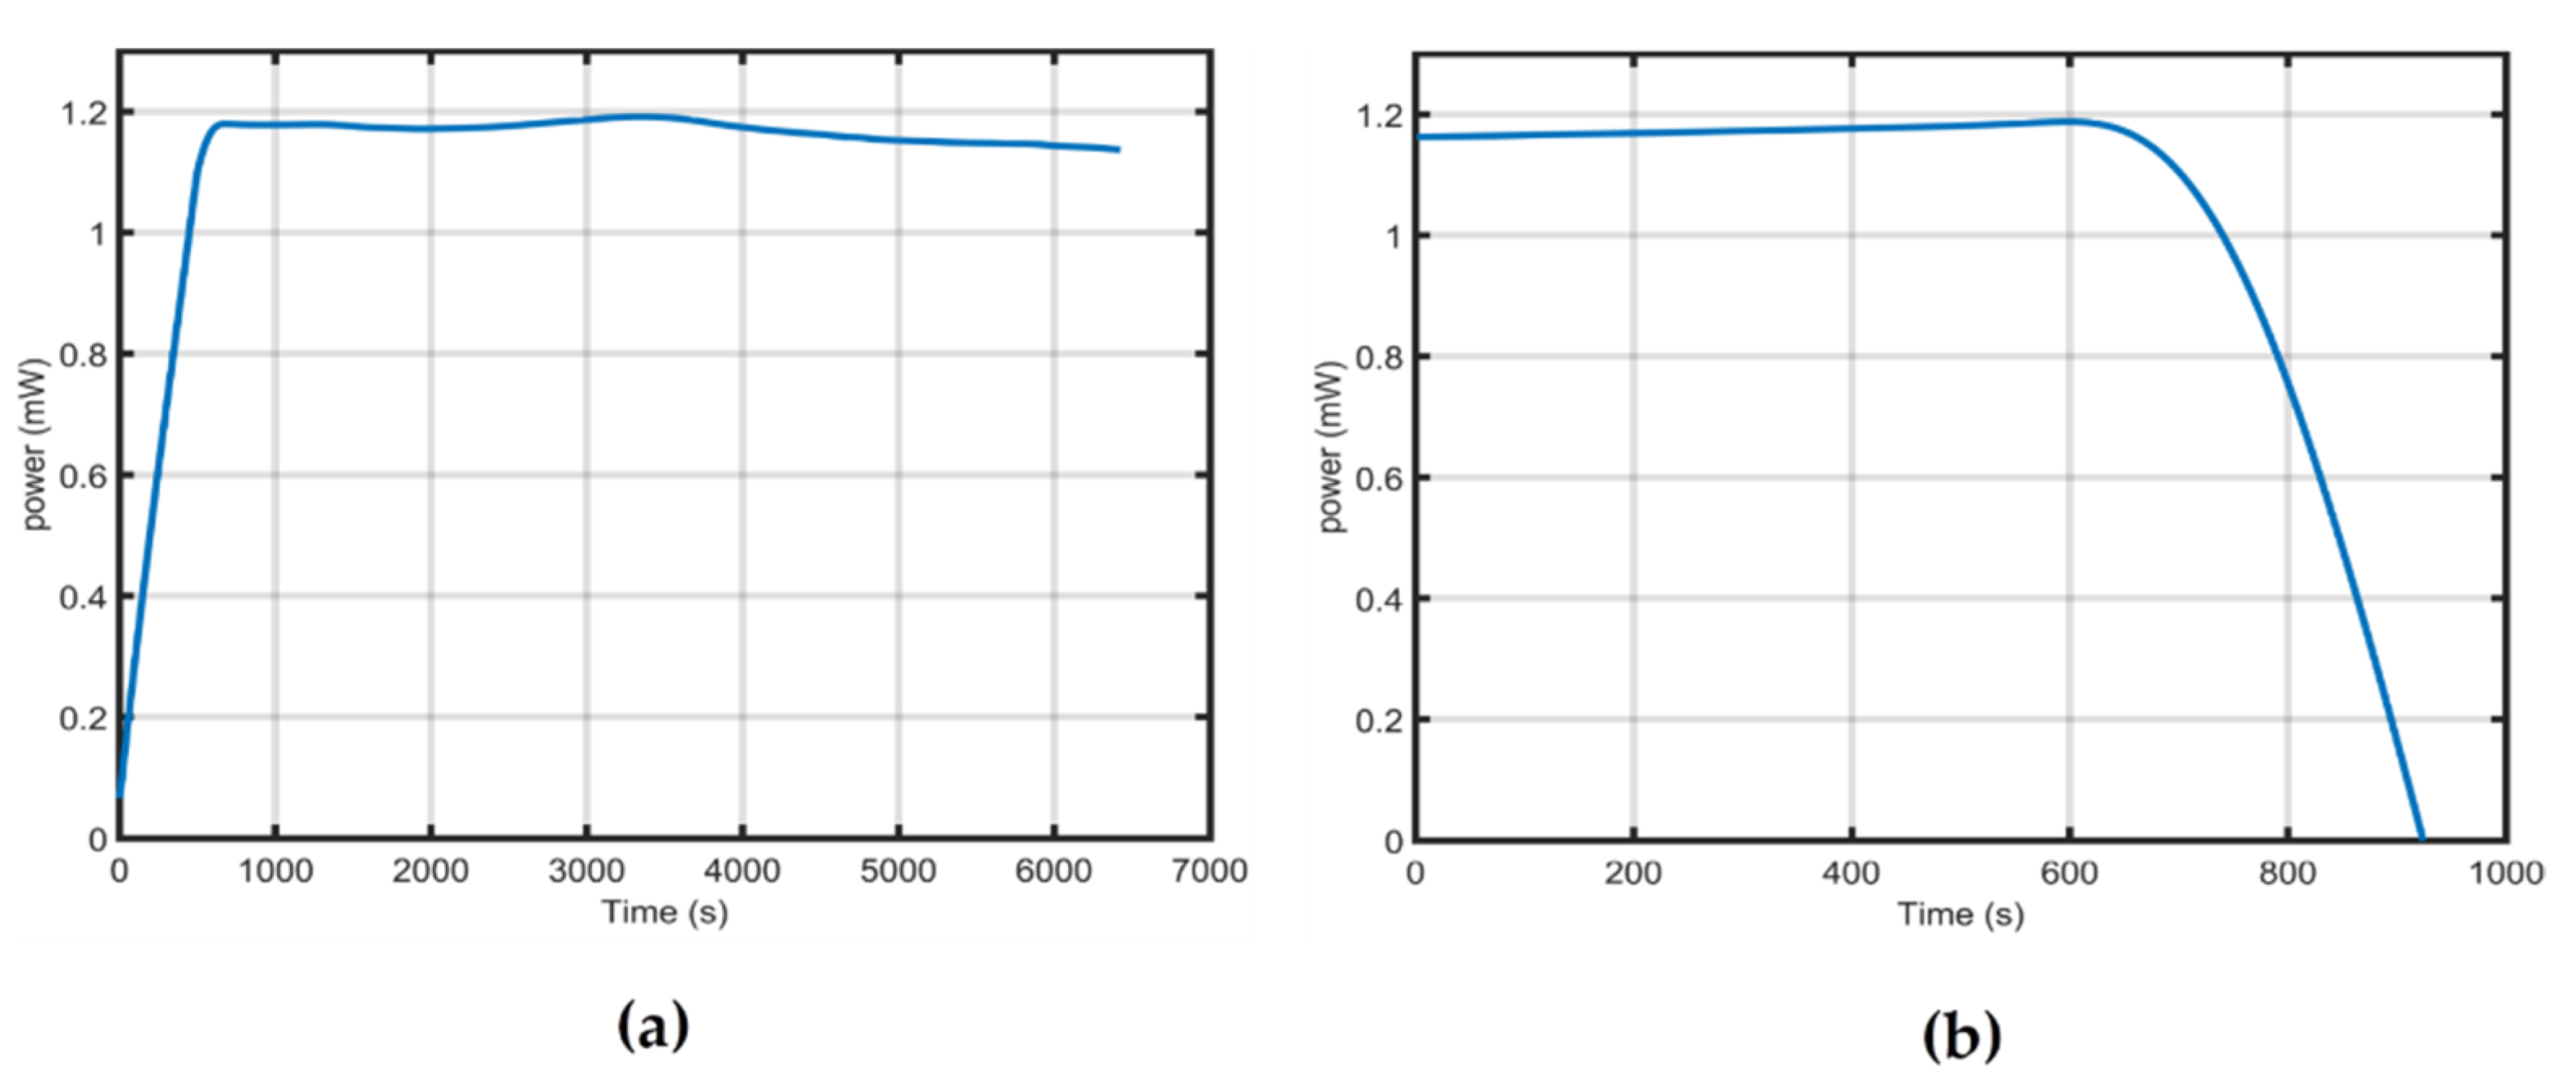
3. Results
4. Discussion
- Studying the feasibility of using different types of PV technologies;
- Using different MCUs that have long WDT time-out duration;
- Studying the impact of using lithium-ion capacitors to improve the self-discharging effect.
5. Conclusions
Author Contributions
Funding
Data Availability Statement
Acknowledgments
Conflicts of Interest
Appendix A


References
- Farooq, M.U.; Waseem, M.; Mazhar, S.; Khairi, A.; Kamal, T. A Review on Internet of Things (IoT). Int. J. Comput. Appl. 2015, 113, 1–7. [Google Scholar] [CrossRef]
- Bhuiyan, M.N.; Rahman, M.M.; Billah, M.M.; Saha, D. Internet of Things (IoT): A Review of Its Enabling Technologies in Healthcare Applications, Standards Protocols, Security, and Market Opportunities. IEEE Internet Things J. 2021, 8, 10474–10498. [Google Scholar] [CrossRef]
- Ghayvat, H.; Mukhopadhyay, S.; Gui, X.; Suryadevara, N. WSN- and IOT-based smart homes and their extension to smart buildings. Sensors 2015, 15, 10350–10379. [Google Scholar] [CrossRef] [Green Version]
- Lazarescu, M.T. Design of a WSN platform for long-term environmental monitoring for IoT applications. IEEE J. Emerg. Sel. Top. Circuits Syst. 2013, 3, 45–54. [Google Scholar] [CrossRef] [Green Version]
- Akyildiz, I.F.; Su, W.; Sankarasubramaniam, Y.; Cayirci, E. Wireless sensor networks: A survey. Comput. Netw. 2002, 38, 393–422. [Google Scholar] [CrossRef] [Green Version]
- Mahakud, R.; Rath, S.; Samantaray, M.; Sinha, B.; Priya, P.; Nayak, A.; Kumari, A. Energy Management in Wireless Sensor Network Using PEGASIS. Procedia Comput. Sci. 2016, 92, 207–212. [Google Scholar] [CrossRef] [Green Version]
- You, S.; Eshraghian, J.K.; Iu, H.C.; Cho, K. Low-power wireless sensor network using fine-grain control of sensor module power mode. Sensors 2021, 21, 3198. [Google Scholar] [CrossRef]
- Liya, M.L.; Aswathy, M. LoRa technology for Internet of Things(IoT): A brief Survey. In Proceedings of the 4th International Conference on I-SMAC (IoT in Social, Mobile, Analytics and Cloud) (I-SMAC), Palladam, India, 7–9 October 2020; pp. 128–133. [Google Scholar] [CrossRef]
- Saad, C.; Cheikh, E.A.; Mostafa, B.; Abderrahmane, H. Comparative Performance Analysis of Wireless Communication Protocols for Intelligent Sensors and Their Applications. 2014. Available online: www.ijacsa.thesai.org (accessed on 1 July 2022).
- Adi, P.D.P.; Kitagawa, A.; Prasetya, D.A.; Setiawan, A.B. A Performance of ES920LR LoRa for the Internet of Things: A Technology Review. In Proceedings of the 3rd East Indonesia Conference on Computer and Information Technology (EIConCIT), Surabaya, Indonesia, 9–11 April 2021; pp. 1–7. [Google Scholar] [CrossRef]
- Pötsch, A.; Haslhofer, F. Practical limitations for deployment of LoRa gateways. In Proceedings of the 2017 IEEE International Workshop on Measurement and Networking (M&N), Naples, Italy, 27-29 September 2017; pp. 1–6. [Google Scholar] [CrossRef]
- Mahmoud, M.S.; Mohamad, A.A.H. A Study of Efficient Power Consumption Wireless Communication Techniques/Modules for Internet of Things (IoT) Applications. Adv. Internet Things 2016, 6, 19–29. [Google Scholar] [CrossRef] [Green Version]
- Kjellby, R.A.; Cenkeramaddi, L.R.; Johnsrud, T.E.; Lotveit, S.E.; Jevne, G.; Beferull-Lozano, B.; Soumya, J. Self-powered IoT Device based on Energy Harvesting for Remote Applications. In Proceedings of the 2018 IEEE International Conference on Advanced Networks and Telecommunications Systems (ANTS), Indore, India, 16–19 December 2018. [Google Scholar] [CrossRef]
- He, H.; Li, T. Design of an indoor RF Energy Harvesting Module using Dual-Band Rectenna Array for IoT Applications. In Proceedings of the 2019 IEEE 4th Advanced Information Technology, Electronic and Automation Control Conference (IAEAC), Chengdu, China, 20–22 December 2019. [Google Scholar]
- Garg, N.; Garg, R. Energy Harvesting in IoT Devices: A Survey. In Proceedings of the 2017 International Conference on Intelligent Sustainable Systems (ICISS), Palladam, India, 7–8 December 2017; pp. 7–8. [Google Scholar]
- Li, B.; Hou, B.; Amaratunga, G.A.J. Indoor photovoltaics, The Next Big Trend in solution-processed solar cells. InfoMat 2021, 3, 445–459. [Google Scholar] [CrossRef]
- Oliveira, G.d.S.; de Oliveira, E.P.; da Silva, A.P.; Carvalho, C.C.M.d. Power quality of LED lamps. In Proceedings of the 2016 17th International Conference on Harmonics and Quality of Power (ICHQP), Belo Horizonte, Brazil, 16–19 October 2016; pp. 575–580. [Google Scholar] [CrossRef]
- Nair, A.K.; Arunraj; Kumar, N.; Ramya, J.C.; Kirubakaran, V. Performance analysis of LED and florescent lamps a case study of street lightning system. In Proceedings of the 2016 International Conference on Energy Efficient Technologies for Sustainability (ICEETS), Nagercoil, India, 7–8 April 2016; pp. 850–855. [Google Scholar] [CrossRef]
- Tan, J.; Yang, K.; Xia, M.; Yang, Y. Analysis of uniform illumination system with imperfect Lambertian LEDs. Opt. Appl. 2011, 41, 507–517. [Google Scholar]
- Wu, D.; Ghassemlooy, Z.; le Minh, H.; Rajbhandari, S.; Khalighi, M.A. Optimization of Lambertian order for indoor non-directed optical wireless communication. In Proceedings of the 2012 1st IEEE International Conference on Communications in China Workshops (ICCC), Beijing, China, 15–17 August 2012; pp. 43–48. [Google Scholar] [CrossRef] [Green Version]
- Song, S.; Elgezua, I.; Kobayashi, Y.; Fujie, M.G. Study on method to simulate light propagation on tissue with characteristics of radial-beam LED based on Monte-carlo method. In Proceedings of the 2013 35th Annual International Conference of the IEEE Engineering in Medicine and Biology Society (EMBC), Osaka, Japan, 3–7 July 2013; pp. 25–28. [Google Scholar] [CrossRef]
- Afonin, K.N.; Olisovets, A.Y.; Ryapolova, Y.V.; Soldatkin, V.S.; Starosek, D.G.; Tuev, V.I.; Hristyukov, V. LED lamp design optimizing on minimum non-uniformity of light intensity distribution in space. In Proceedings of the 2016 13th International Scientific-Technical Conference on Actual Problems of Electronics Instrument Engineering (APEIE), Novosibirsk, Russia, 3–6 October 2016; pp. 153–155. [Google Scholar] [CrossRef]
- Xu, Y.; Chang, Y.; Chen, G.; Lin, H. The research on LED supplementary lighting system for plants. Optik 2016, 127, 7193–7201. [Google Scholar] [CrossRef]
- Nasim, H.; Jamil, Y. Diode lasers: From laboratory to industry. Opt. Laser Technol. 2014, 56, 211–222. [Google Scholar] [CrossRef]
- Nayak, P.K.; Mahesh, S.; Snaith, H.J.; Cahen, D. Photovoltaic solar cell technologies: Analyzing the state of the art. Nat. Rev. Mater. 2019, 4, 269–285. [Google Scholar] [CrossRef]
- Dambhare, M.v.; Butey, B.; Moharil, S.v. Solar photovoltaic technology: A review of different types of solar cells and its future trends. J. Phys. Conf. Ser. 2021, 1913, 012053. [Google Scholar] [CrossRef]
- Mirzaei, M.; Mohiabadi, M.Z. A comparative analysis of long-term field test of monocrystalline and polycrystalline PV power generation in semi-arid climate conditions. Energy Sustain. Dev. 2017, 38, 93–101. [Google Scholar] [CrossRef]
- Nogueira, C.E.C.; Bedin, J.; Niedzialkoski, R.K.; de Souza, S.N.M.; Neves, J.C.M.d. Performance of monocrystalline and polycrystalline solar panels in a water pumping system in Brazil. Renew. Sustain. Energy Rev. 2015, 51, 1610–1616. [Google Scholar] [CrossRef]
- Ann, M.H.; Kim, J.; Kim, M.; Alosaimi, G.; Kim, D.; Ha, N.Y.; Seidel, J.; Park, N.; Yun, J.S.; Kim, J.H. Device design rules and operation principles of high-power perovskite solar cells for indoor applications. Nano Energy 2020, 68, 104321. [Google Scholar] [CrossRef]
- Zhang, Y.; Yi, H.; Iraqi, A.; Kingsley, J.; Buckley, A.; Wang, T.; Lidzey, D.G. Comparative indoor and outdoor stability measurements of polymer based solar cells. Sci. Rep. 2017, 7, 1305. [Google Scholar] [CrossRef]
- Biswas, S.; Kim, H. Solar cells for indoor applications: Progress and development. Polymers 2020, 12, 1338. [Google Scholar] [CrossRef]
- Tamrakar, R.; Gupta, A. A Review extraction of solar cell modelling parameters. Int. J. Innov. Res. Electr. Electron. Instrum. Control. Eng. 2015, 3, 55–60. [Google Scholar] [CrossRef]
- Apostolou, G.; Reinders, A.; Verwaal, M. Comparison of the indoor performance of 12 commercial PV products by a simple model. Energy Sci. Eng. 2016, 4, 69–85. [Google Scholar] [CrossRef] [Green Version]
- Bader, S.; Ma, X.; Oelmann, B. One-diode photovoltaic model parameters at indoor illumination levels—A comparison. Sol. Energy 2019, 180, 707–716. [Google Scholar] [CrossRef]
- Michael, P.R.; Johnston, D.E.; Moreno, W. A conversion guide: Solar irradiance and lux illuminance. J. Meas. Eng. 2020, 8, 153–166. [Google Scholar] [CrossRef]
- Jayakumar, H.; Raha, A.; Kim, Y.; Sutar, S.; Lee, W.S.; Raghunathan, V. Energy-efficient system design for IoT devices. In Proceedings of the 2016 21st Asia and South Pacific Design Automation Conference (ASP-DAC), Macao, China, 25–28 January 2016; pp. 298–301. [Google Scholar] [CrossRef]
- Abdelaal, M.; Theel, O. Power Management in Wireless Sensor Networks: Challenges and Solutions. In Proceedings of the IEEE and IFIP International Conference in central Asia on Internet (ICI 2013), Tashkent, Uzbekistan, 8–10 October 2013. [Google Scholar]
- Lin, L.; Tang, Z.; Tan, N.; Xiao, X. Power management in low-power MCUs for energy IoT applications. J. Sens. 2020, 2020, 8819236. [Google Scholar] [CrossRef]
- BQ25570EVM-206 Evaluation Board. TI.com. Available online: https://www.ti.com/tool/BQ25570EVM-206 (accessed on 25 December 2021).
- Kim, S.; Chou, P.H. Energy harvesting: Energy harvesting with supercapacitor-based energy storage. In Smart Sensors and Systems; Springer International Publishing: Cham, Switzerland, 2015; pp. 215–241. [Google Scholar] [CrossRef]
- Pasquier, A.d.; Plitz, I.; Menocal, S.; Amatucci, G. A comparative study of Li-ion battery, supercapacitor and nonaqueous asymmetric hybrid devices for automotive applications. J. Power Sources 2003, 115, 171–178. [Google Scholar] [CrossRef]
- Zhang, L.; Hu, X.; Wang, Z.; sun, F.; Dorrell, D.G. A review of supercapacitor modeling, estimation, and applications: A control/management perspective. J. Renew. Sustain. Energy Rev. 2018, 81, 1868–1878. [Google Scholar] [CrossRef]
- Mars, P. Using Supercapacitors in Energy Harvesting. 2017. Available online: https://www.powersystemsdesign.com/using-supercapacitors-in-energy-harvesting/31 (accessed on 27 December 2021).
- Devillers, N.; Jemei, S.; Péra, M.C.; Bienaimé, D.; Gustin, F. Review of characterization methods for supercapacitor modelling. J. Power Sources 2014, 246, 596–608. [Google Scholar] [CrossRef]
- ATmega328P | Microchip Technology. Available online: https://www.microchip.com/en-us/product/ATmega328P#document-table (accessed on 27 December 2021).
- RFM96 433/470Mhz RF Transceiver Module, Long Range Wireless Transceiver module _LoRa Long Range Transceiver Module | Hoperf. Available online: https://www.hoperf.com/modules/lora/RFM96.html (accessed on 27 December 2021).
- Sinha, A.; Chandrakasan, A. Dynamic power management in wireless sensor networks. IEEE Des. Test Comput. 2001, 18, 62–74. [Google Scholar] [CrossRef]
- Silva, A.; Liu, M.; Moghaddam, M. Power-management techniques for wireless sensor networks and similar low-power communication devices based on nonrechargeable batteries. J. Comput. Netw. Commun. 2012, 2012, 757291. [Google Scholar] [CrossRef]
- Stojčev, M.K.; Kosanović, M.R.; Golubović, L.R. Power management and energy harvesting techniques for wireless sensor nodes. In Proceedings of the 2009 9th International Conference on Telecommunication in Modern Satellite, Cable, and Broadcasting Services, Nis, Serbia, 7–9 October 2009; pp. 65–72. [Google Scholar] [CrossRef]
- Rokonuzzaman, M.; Mishu, M.K.; Amin, N.; Nadarajah, M.; Roy, R.; Rahman, K.; Buhari, A.; Binzaid, S.; Shakeri, M.; Pasupuleti, J. Self-sustained autonomous wireless sensor network with integrated solar photovoltaic system for internet of smart home-building (Ioshb) applications. Micromachines 2021, 12, 653. [Google Scholar] [CrossRef]
- Wang, A.; Mathúna, Ó.; Cian, S.; Wang, W.S.; Wang, N.; Hayes, M. Practical Wireless Sensor Networks Power Consumption Metrics for Building Energy Management Applications. 2011. Available online: https://cora.ucc.ie/handle/10468/557 (accessed on 1 July 2022).
- Kansal, A.; Hsu, J.; Zahedi, S.; Srivastava, M.B. Power Management in Energy Harvesting Sensor Networks. ACM Trans. Embed. Comput. Syst. 2007, 6, 32. [Google Scholar] [CrossRef]
- Lueders, M.; Eversmann, B.; Gerber, J.; Huber, K.; Kuhn, R.; Zwerg, M.; Schmitt-Landsiedel, D.; Brederlow, R. Architectural and circuit design techniques for power management of ultra-low-power MCU systems. IEEE Trans. Very Large Scale Integr. (VLSI) Syst. 2014, 22, 2287–2296. [Google Scholar] [CrossRef]
- Lamb, J.J.; Burheim, O.S. Lithium-ion capacitors: A review of design and active materials. Energies 2021, 14, 979. [Google Scholar] [CrossRef]


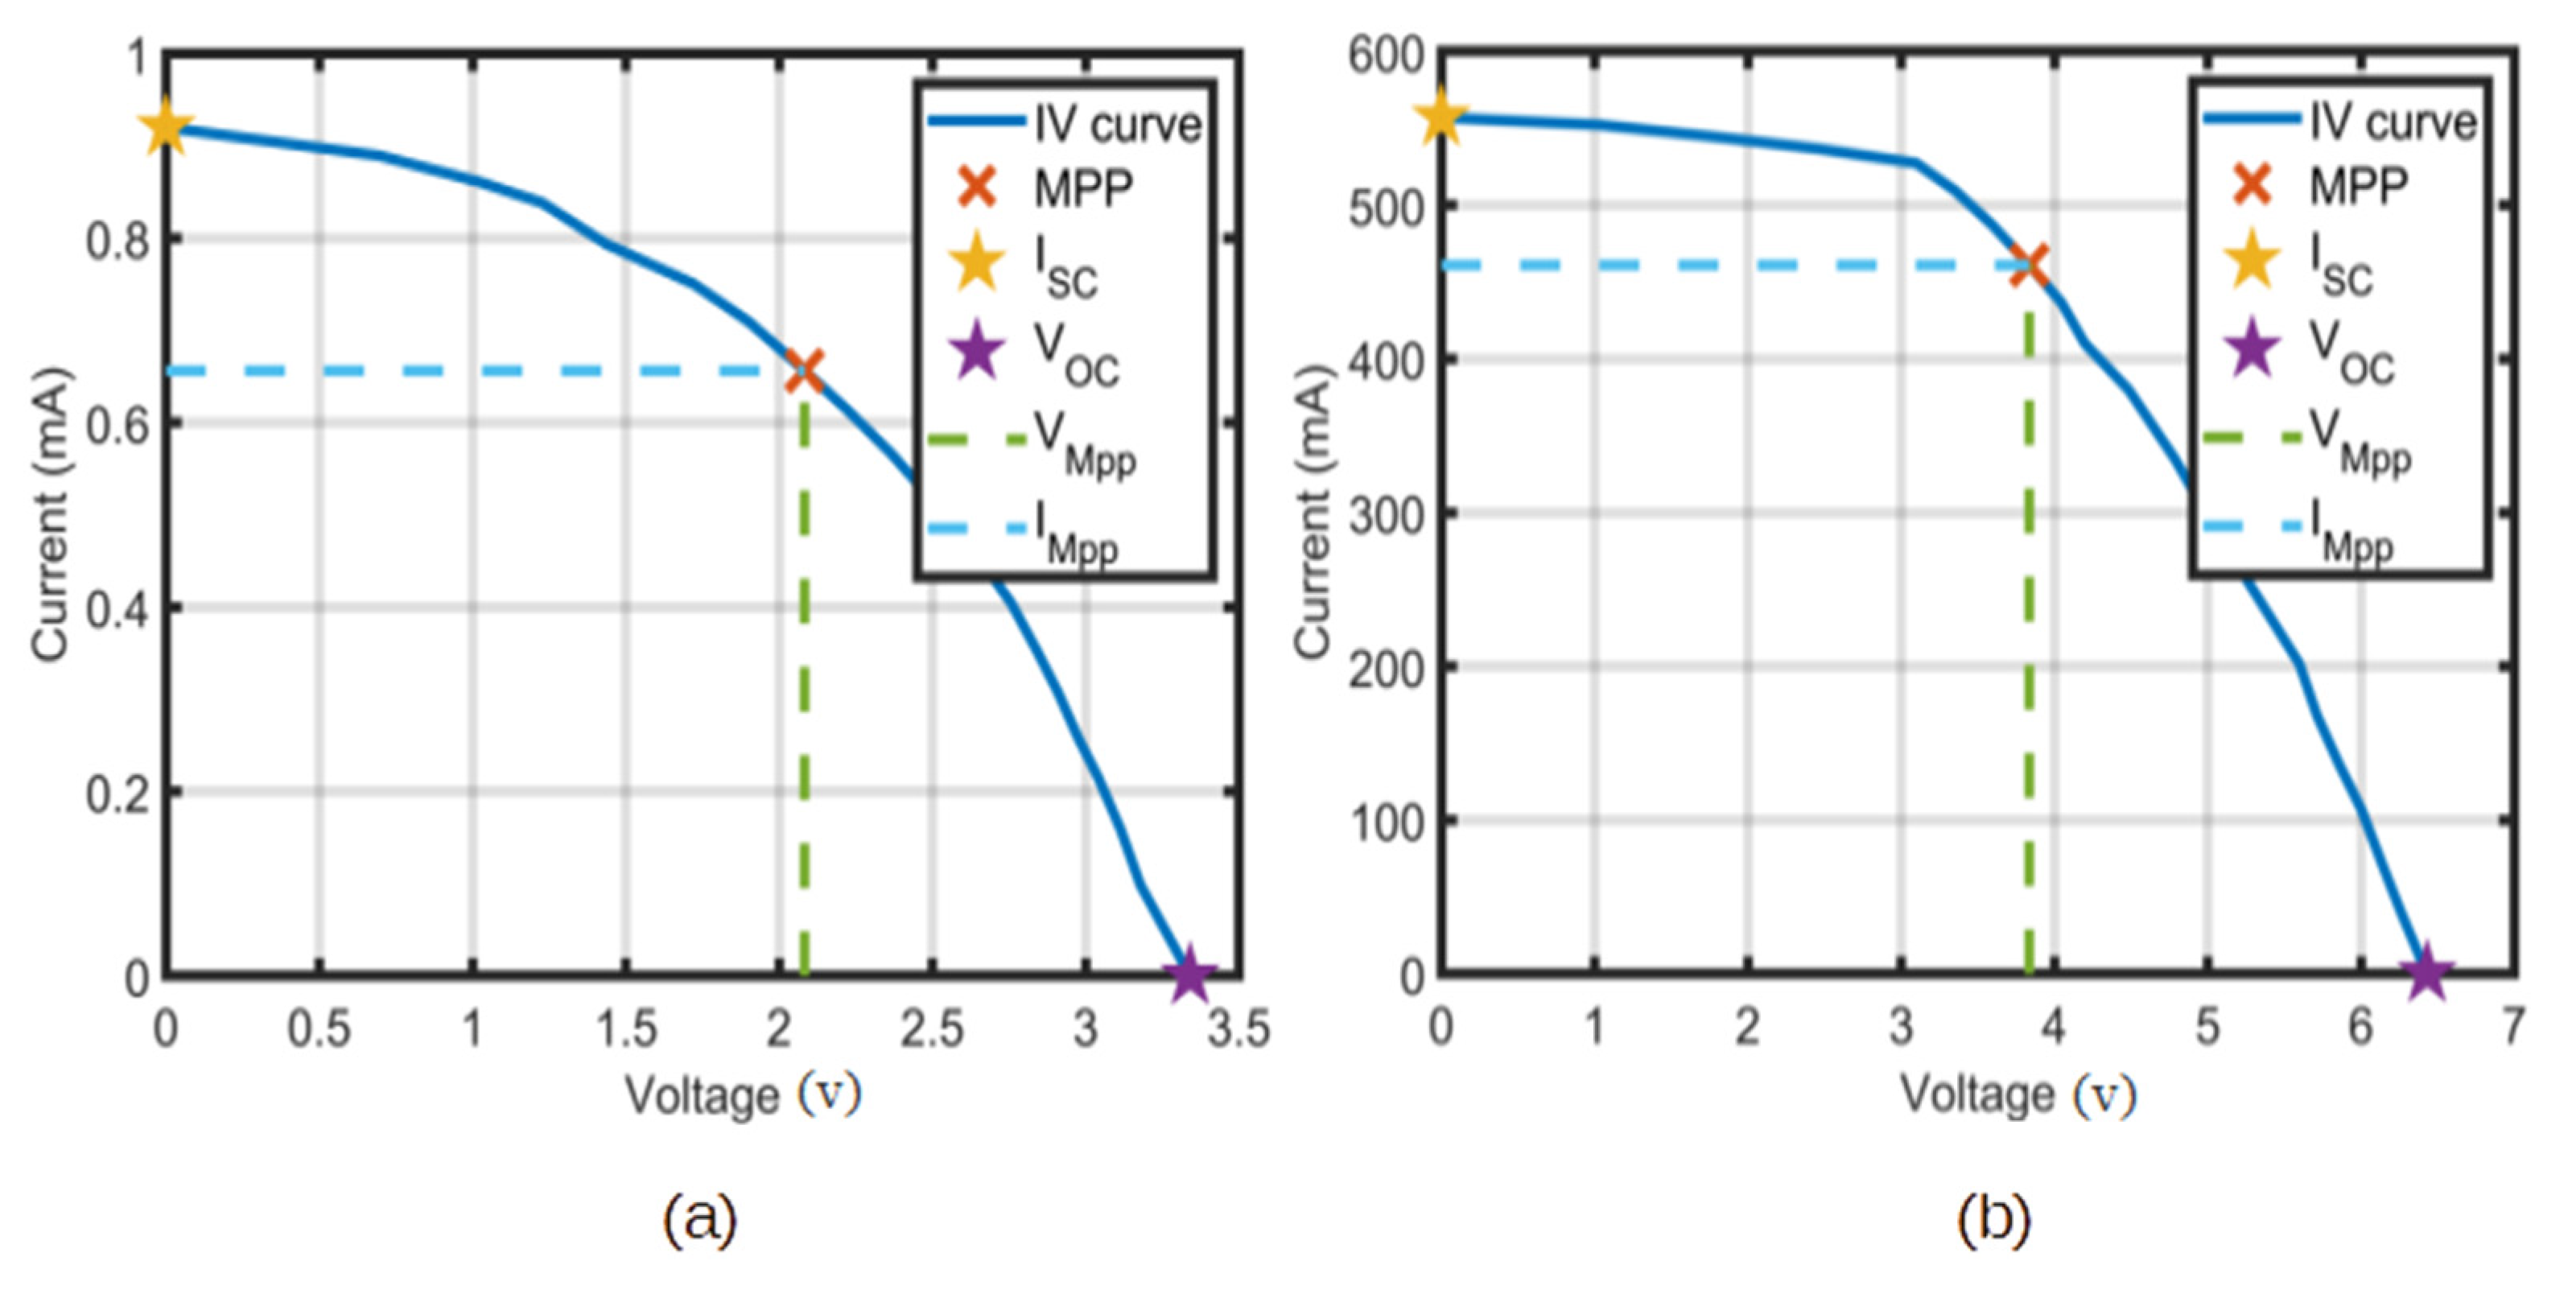
| ISC (mA) | VOC | VMPP | IMPP (mA) | MPP (mW) | |||
|---|---|---|---|---|---|---|---|
| Indoor | 25 | 0.98 | 3.34 | 1.977 | 0.707 | 1.4 | |
| Outdoor | 45.7 | 577 | 6.43 | 3.88 | 453.4 | 1760 | 6.654 |
| ATMEGA328P | RFM96W | DHT11 | |||||
|---|---|---|---|---|---|---|---|
| Operating Voltage (V) | 1.8–5.5 | 1.8–3.7 | 3–5.5 | ||||
| Current Consumption(mA) | Active | 0.2 | Sleep | 0.0002–0.001 | Measuring | 0.5–2.5 | |
| Power-down | 0.00010 | Idle | 0.0015 | Average | 0.2–1 | ||
| Power-save | 0.00074 | Standby | 1.6–1.8 | Standby | 0.01–0.15 | ||
| Receive | 11.47 (AVG) | ||||||
| Transmit | +20 dBm | 120 | |||||
| +17 dBm | 87 | ||||||
| +13 dBm | 29 | ||||||
| +7 dBm | 20 | ||||||
| µC Sleep Mode | MCU Internal Frequency (MHz) | ADC | Measured Power Consumption (µW) at Operation Mode | Measured Power Consumption (µW) at Sleep Mode | |
|---|---|---|---|---|---|
| Case 1 | Idle | 4 | On | 25,900 | 15,540 |
| Case 2 | Idle | 2 | On | 22,200 | 13,283 |
| Case 3 | Idle | 2 | Off | 22,090 | 12,395 |
| Case 4 | Idle | 1 | Off | 17,020 | 9990 |
| Case 5 | Power save | 1 | Off | 11,100 | 83 |
| Case 6 | Power down | 1 | Off | 11,100 | 21.09 |
| Reference | CI | PCO (mW) | MPP (mW) | Power Supporting Period (s) |
|---|---|---|---|---|
| Md. Rokonuzzaman et al. [50] | Wi-fi/Bluetooth | >200 | 500 | 95 |
| Ours | LoRa | 11.1 | 1.4 | 21,600 |
Publisher’s Note: MDPI stays neutral with regard to jurisdictional claims in published maps and institutional affiliations. |
© 2022 by the authors. Licensee MDPI, Basel, Switzerland. This article is an open access article distributed under the terms and conditions of the Creative Commons Attribution (CC BY) license (https://creativecommons.org/licenses/by/4.0/).
Share and Cite
Mahdi Elsiddig Haroun, F.; Mohamad Deros, S.N.; Ahmed Alkahtani, A.; Md Din, N. Towards Self-Powered WSN: The Design of Ultra-Low-Power Wireless Sensor Transmission Unit Based on Indoor Solar Energy Harvester. Electronics 2022, 11, 2077. https://doi.org/10.3390/electronics11132077
Mahdi Elsiddig Haroun F, Mohamad Deros SN, Ahmed Alkahtani A, Md Din N. Towards Self-Powered WSN: The Design of Ultra-Low-Power Wireless Sensor Transmission Unit Based on Indoor Solar Energy Harvester. Electronics. 2022; 11(13):2077. https://doi.org/10.3390/electronics11132077
Chicago/Turabian StyleMahdi Elsiddig Haroun, Fathi, Siti Noratiqah Mohamad Deros, Ammar Ahmed Alkahtani, and Norashidah Md Din. 2022. "Towards Self-Powered WSN: The Design of Ultra-Low-Power Wireless Sensor Transmission Unit Based on Indoor Solar Energy Harvester" Electronics 11, no. 13: 2077. https://doi.org/10.3390/electronics11132077