Article

LGMSU-Net: Local Features, Global Features, and Multi-Scale Features Fused the U-Shaped Network for Brain Tumor Segmentation

1
School of Control Science and Engineering, Shandong University, Jinan 250061, China
2
Department of General Surgery, Qilu Hospital of Shandong University, Jinan 250012, China
*
Author to whom correspondence should be addressed.
Electronics 2022, 11(12), 1911; https://doi.org/10.3390/electronics11121911
Submission received: 31 May 2022 / Revised: 15 June 2022 / Accepted: 16 June 2022 / Published: 19 June 2022
(This article belongs to the Special Issue Applications of Artificial Intelligence in Biomedicine)

Abstract

:
Brain tumors are one of the deadliest cancers in the world. Researchers have conducted a lot of research work on brain tumor segmentation with good performance due to the rapid development of deep learning for assisting doctors in diagnosis and treatment. However, most of these methods cannot fully combine multiple feature information and their performances need to be improved. This study developed a novel network fusing local features representing detailed information, global features representing global information, and multi-scale features enhancing the model’s robustness to fully extract the features of brain tumors and proposed a novel axial-deformable attention module for modeling global information to improve the performance of brain tumor segmentation to assist clinicians in the automatic segmentation of brain tumors. Moreover, positional embeddings were used to make the network training faster and improve the method’s performance. Six metrics were used to evaluate the proposed method on the BraTS2018 dataset. Outstanding performance was obtained with Dice score, mean Intersection over Union, precision, recall, params, and inference time of 0.8735, 0.7756, 0.9477, 0.8769, 69.02 M, and 15.66 millisecond, respectively, for the whole tumor. Extensive experiments demonstrated that the proposed network obtained excellent performance and was helpful in providing supplementary advice to the clinicians.

1. Introduction

The incidence of brain tumors is increasing in recent years [1]. As well, the median survival time of glioblastoma with the highest malignancy is only 14.6 months [2]. Brain tumor segmentation (BTS) technology is an essential basic step with many applications such as quantitative analysis and operational planning. However, the manual segmentation of brain tumors is difficult and time-consuming [3]. Accurate and automatic BTS technology is urgently needed to minimize human errors.
Automatic BTS methods can roundly fall into three categories [4], namely, atlas registration-based methods [5,6], machine learning-based methods with hand-crafted features [7,8,9], and deep learning-based methods with automatic end-to-end learned features [10,11,12]. Compared with the former two categories of methods which need prior knowledge or complex hand-crafted features, the third category of methods can directly learn knowledge from the given data and usually obtains better segmentation performance. Thus, the methods based on deep learning have become the research hotspot in the field of BTS.
In recent years, deep learning-based methods have greatly promoted the development of various fields of image analysis. Researchers are actively innovating network structures and data application methods to improve the performance of BTS methods by using deep learning. Some methods directly use the structure of UNet [11] for tasks such as feature extraction or classification [13,14]. Other methods [15,16,17] inspired by UNet optimize and improve the structure of UNet, such as changing the number of skip concatenations and the way of concatenation. The basic structure of the aforementioned models is a convolution kernel, which has a fixed size and is used to extract local features, thus helping the models learn detailed knowledge such as the contour and texture of the target, which is important for segmentation tasks, including BTS. In addition, their global features are often different due to different sizes, locations, and nature of brain tumors, even if the local features of brain images are similar. Therefore, global features are highly significant for the BTS task. Although repeating local operations can extract global features, the operation has several limitations, such as causing optimization difficulties and making multi-hop dependency modeling difficult. Adopting attention mechanisms is another popular way to extract global features, which has given significant boosts to various fields of vision. Thus, we applied an attention mechanism to extract global features in this study.
Wang et al. [18] introduced a nonlocal operation, computing the response at a position as a weighted sum of the features at all positions, which was similar to the method [19] called Transformer based on self-attention. An increasing number of studies [20,21] adopted Transformer architecture in convolutional neural networks (CNNs) to extract global features and fuse local features and global features to improve the performance of BTS. The self-attention was restricted to a small local area due to the high computation and large memory consumption of the Transformer, which limited the learning ability of the models using the Transformer in many cases. Recently, many efforts have been made to address this problem. Ho et al. [22] proposed the axial attention module (AAM) composing 2D self-attention into two 1D self-attentions to reduce the computation from O ( H 2 W 2 ) to O ( H W H W ) , where H and W represent the height and width of the input, respectively. Inspired by deformable convolution, Zhu et al. [23] introduced the deformable attention module (DAM), only focusing on a small set of key sampling points around a reference, and reduced the computation to O ( H W ) . Liu et al. [24] proposed the Swin Transformer, which calculated self-attention in non-overlapping local windows to reduce the memory consumption and improve computational efficiency. The UTNet model built by Gao et al. [25] projected key and value into low-dimensional features, which reduced the computation of traditional Transformer. Applying the modules improved based on Transformer, similar to the aforementioned modules to improve the performance of BTS and reduce the computation complexity, is useful and popular. Cao et al. [26] proposed Swin-Unet, which was a UNet-like pure Transformer for medical image segmentation. Valanarasu et al. [
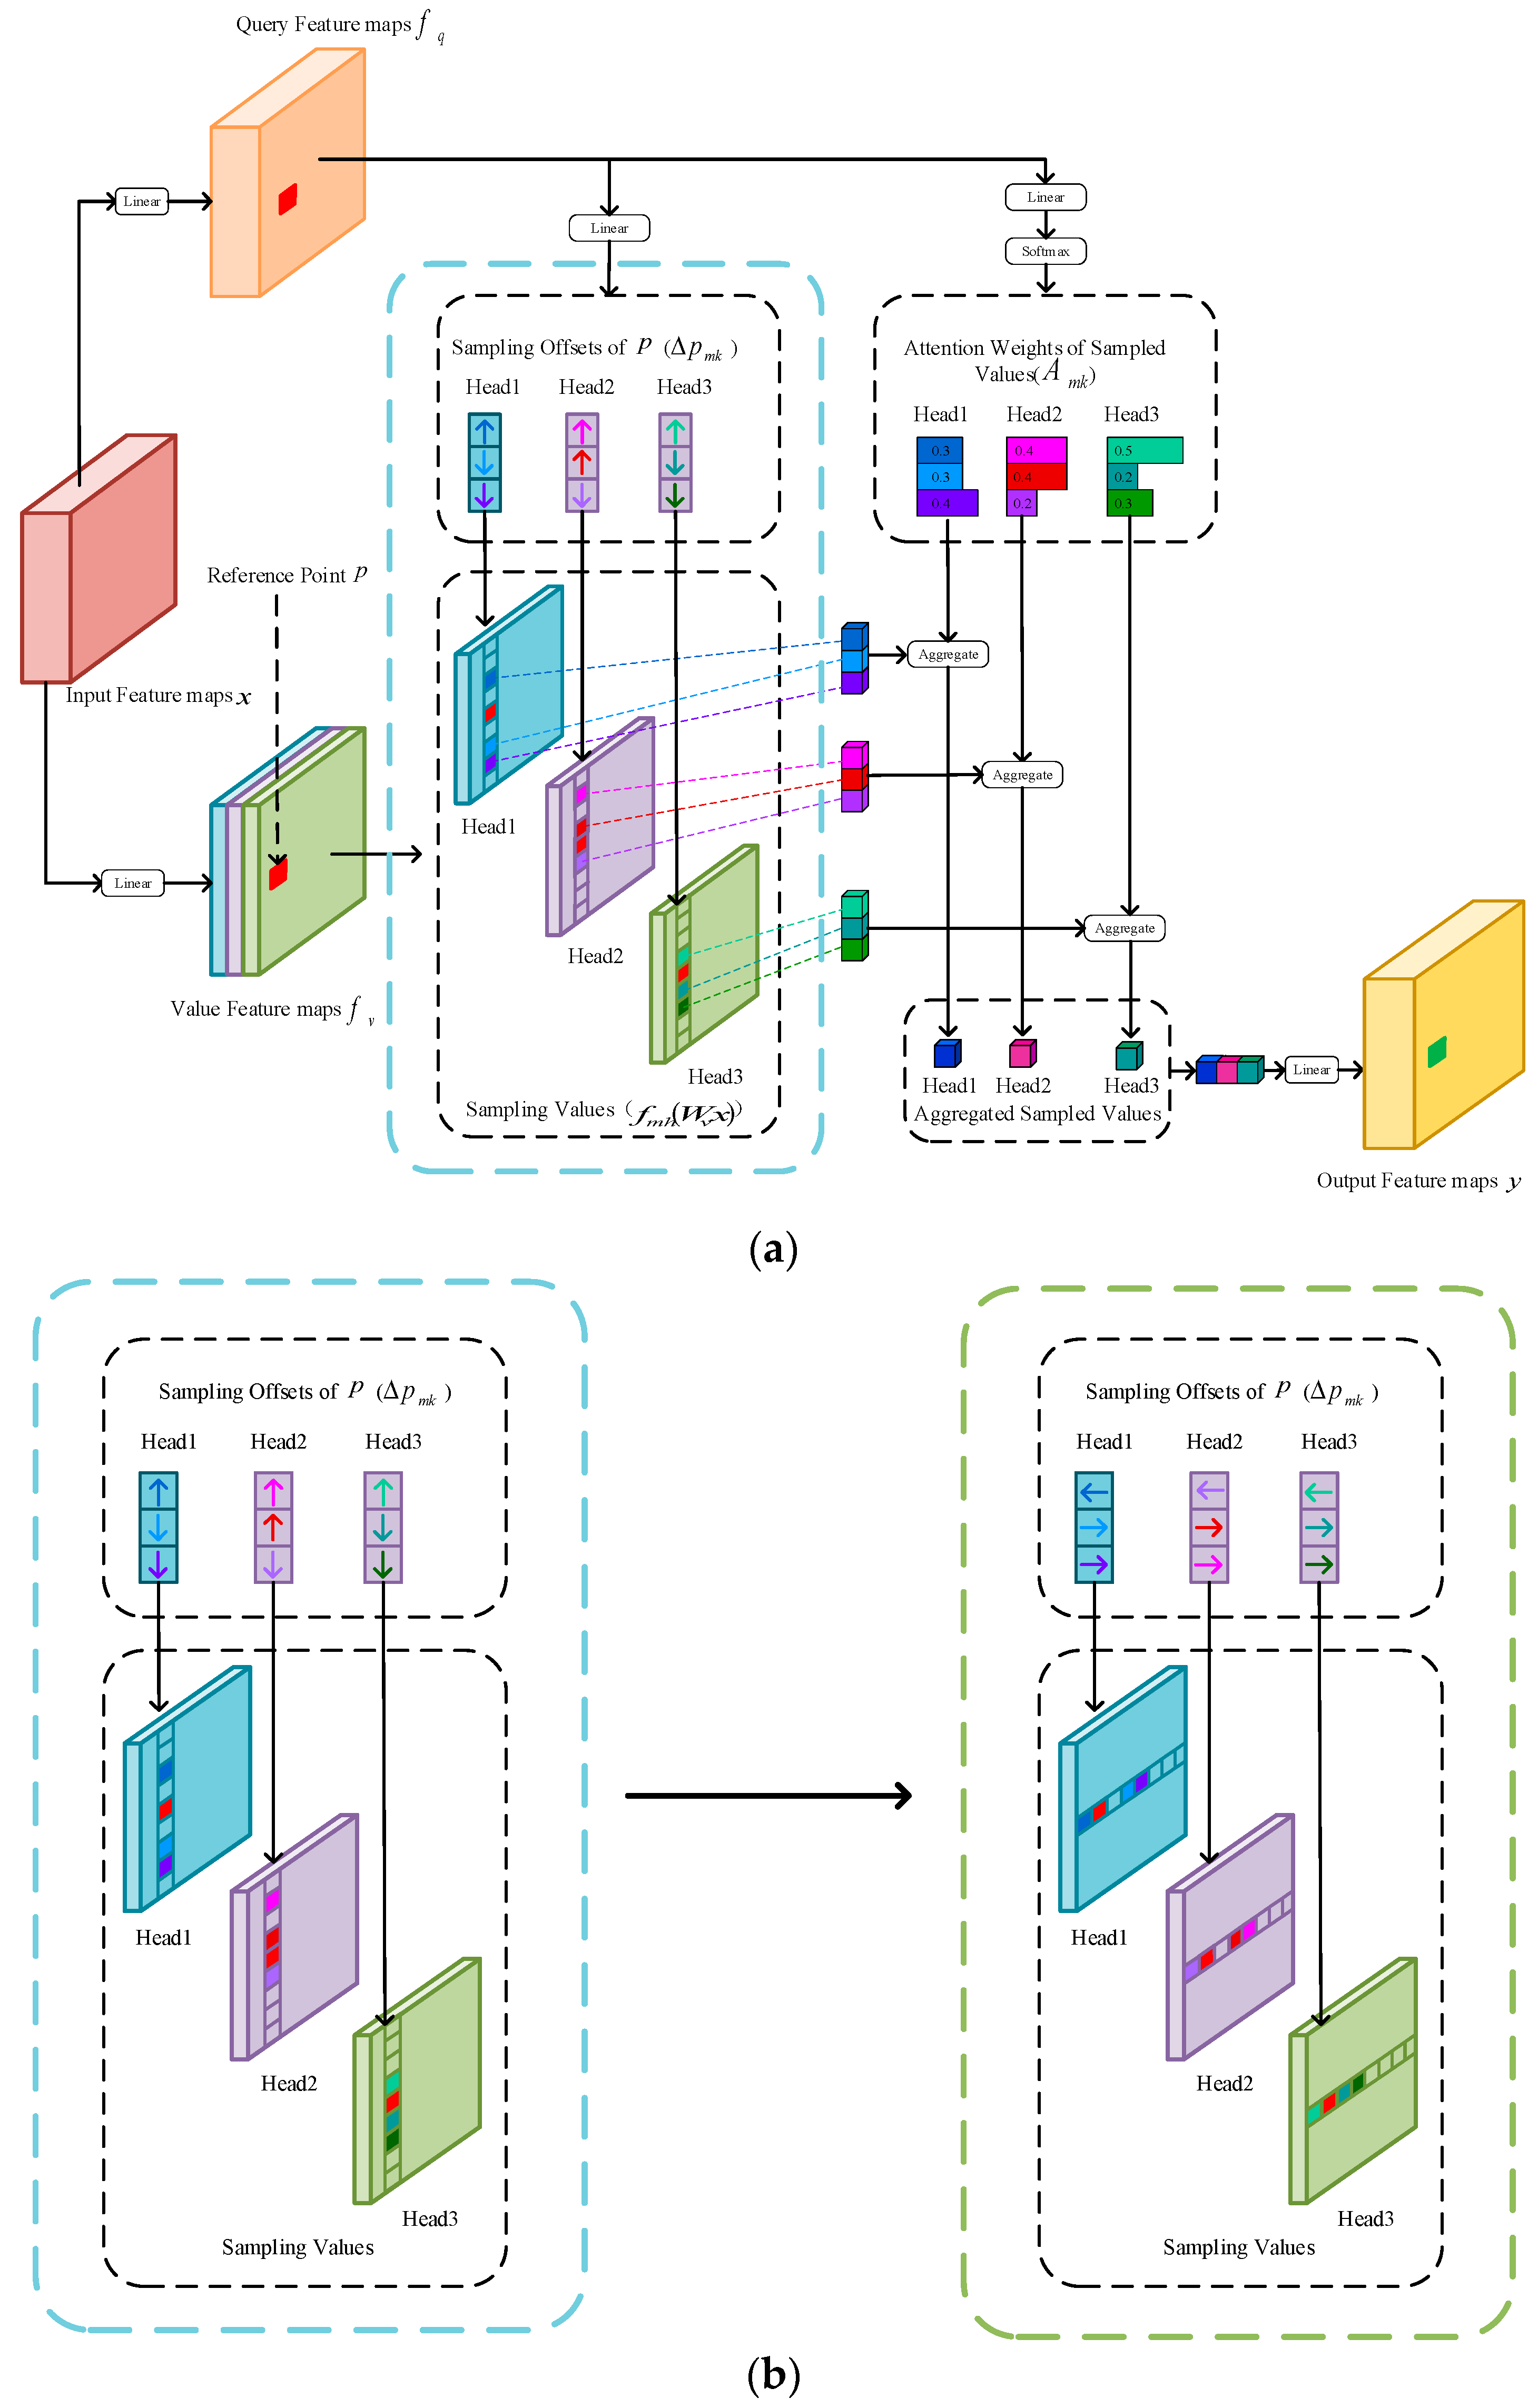
27] introduced a gated AAM adding a control mechanism in the self-attention module to segment medical images including brain images. Inspired by AAM and DAM, we assumed that selecting a small set of key sampling points on a certain axis of the feature map than selecting all points of the certain axis to compute the response at a position might be beneficial to use effective information and discard useless information. Meanwhile, finding relevant positions on a certain axis was easier to obtain the optimal solution than looking for relevant locations on the entire feature map. Thus, we proposed the axial-deformable attention (ADA) module, which sampled a small set of key points in a certain column or a certain row to extract global features, instead of using all points in a column or row like AAM or using points in all regions like DAM. Compared with other self-attention modules, the ADA module had lower computational complexity and more accurate performance.
However, many researchers employed convolution operations and self-attention mechanisms to fuse local and global features while ignoring multi-scale features that could effectively improve the robustness of the model [28,29], which were also essential for BTS. Therefore, we proposed a new network that fused local feature information extracted by convolution operations, global feature information extracted by ADA module, and multi-scale feature information obtained by multi-scale input (MSI) and multi-scale output (MSO) structures to enhance the robustness of the network, effectively improving the performance of BTS task.
This study introduced a novel U-shaped network fusing local features, global features, and multi-scale features (LGMSU-Net) to segment brain tumors. The main contributions of this study were as follows:
(1)
A new encoder-decoder network was proposed, which reasonably and effectively fused local features representing detailed information, global features representing global information, and multi-scale features enhancing the robustness of the network to significantly improve the performance of BTS with low computational complexity.
(2)
A novel self-attention module was designed to extract global features, named the ADA module. It sampled a small set of key points in a certain column or a certain row, which could achieve a more accurate performance of BTS with acceptable computation complexity.
(3)
Positional embeddings were proved in self-attention mechanism could accelerate convergence during training and slightly improve the BTS performance.
(4)
Extensive experiments had proved that the proposed network achieved excellent performance in the task of BTS, which meant that it would help clinicians to reduce the time spent in BTS tasks and improve the segmentation accuracy. Moreover, it also could be used as an auxiliary tool to provide suggestions on BTS tasks to help junior doctors improve their skills as soon as possible.
We introduce the LGMSU-Net architecture in Section 2. The experimental results of ablation experiments and contrast experiments are presented and discussed in Section 3. Finally, we conclude the work in Section 4.

2. Materials and Methods

In this section, we first introduced the LGMSU-Net architecture (as shown in Figure 1) and then detailed the proposed ADA module, which could extract global features reasonably and efficiently generate better predictions.

2.1. Network Architecture

As shown in Figure 1, the proposed LGMSU-Net added MSI structure on the left. Also, some convolution operations in the middle were replaced by ADA module, which was detailed in Section 2.2, and MSO structure was added on the right compared with UNet [11]. The network architecture was introduced from left to right as follows. The multi-scale features provided by the MSI structure were fused with the local features from convolution operations, as shown on the left side of Figure 1. In the middle of the model, the global feature extracted by ADA module integrated with the local feature extracted by convolution operation. Finally, the MSO structure applied local features from convolution operations to output the final result. The core idea of the model we proposed was to reasonably and effectively fuse local, global, and multi-scale features so as to improve the performance of BTS with acceptable computational complexity.
Inspired by a previous study [30], in the MSI structure, we applied average pooling to generate MSI, then used a 3 × 3 convolution to increase the number of input channels to the same number as the number of channels of the local features, and then combined them. Finally, the multi-scale features and local features were concatenated along the channel axis. We also used MSOs to accelerate convergence of training and fuse local features and multi-scale features on the decoding path. Specifically, we first applied upsampling technique to get a feature map with the same size as the original images and a 1 × 1 convolution kernel to reduce the dimension to one dimension, as represented in Figure 1. Then we connected the lower feature to the upper one, and adopted a 1 × 1 convolution kernel and sigmoid activation to get MSOs of the same size as the original images, namely four probability maps. Finally, we directly took the average of the four images, took 1 if it is greater than 0.5, and considered it as the tumor part, and took 0 as the other part, considered it as the non-tumor part, and got the segmentation result.

2.2. ADA Module for Extracting Global Features

ADA module contained two parts similar to AAM [22], namely, Vertical-DAM (VDAM) and Horizontal-DAM (HDAM). The VDAM mixed the information of some positions in a certain column to compute the response at a position in the same column while ignoring other columns, as shown in Figure 2a. Similarly, the HDAM mixed the information of some positions in a certain row to compute the response at a position in the same row while ignoring other rows. The response value of a certain position in the output feature maps of VDAM or HDAM could be obtained using the Formula (1). Figure 2c was the overall structure of the ADA module. Firstly, the input feature map was weighted by VDAM. Then, the original feature map and the VDAM-weighted feature map were added as the input of HDAM for horizontal attention weighting, and the final weighted feature map was obtained.
y ( x , P ) = W o C m = 1 M k = 1 K A m k · { [ f m h ( W v x ) ] ( P + Δ P m k ) }
where, m is the attention head, and M is the total head number which was set to 8 in this study. In a certain column or a certain row, k is the sampled key and K is the total sampled key number, which was 4 in this study. Δ P m k R M × K × W × H × 1 and A m k R M × K × W × H were both built via linear projection over the query feature maps obtained via linear projection over the input feature maps. A tensor T R M × K × W × H × 1 with all elements of 0 was designed, which was concatenated with Δ P m k in the last dimension through two different ways to build the tensor Δ P m k R M × K × W × H × 2 to the sample only in the vertical or horizontal direction, rather than in all regions similar to DAM. Δ P m k and A m k denote the sampling offset and attention weight of the sampling point in the attention head, respectively. A m k is operated by softmax function with range [0, 1]. As in DAM [23], the bilinear interpolation was used to solve the problem that P + Δ P m k was fractional. W v x obtains value feature maps f v R C × W × H and f m h ( ) represents dividing f v into M parts along the channel axis. C m = 1 M represents concatenating the outputs of all attention heads.
The ADA module we proposed saved O ( H W ) computation over the standard self-attention. The segmentation performances and analysis of the ADA module and other self-attention modules were presented in Section 3.2.

3. Experiments and Discussion

3.1. Dataset and Implementation Details

3.1.1. BraTS2018 Dataset

The dataset [31,32,33,34,35] used in this study is from the BraTS2018 challenge, and includes 285 3D brain magnetic resonance imaging (MRI) cases. Each case contains four MRI modalities (T1, T1c, T2, and FLAIR), which have been adjusted to the same size of 240 × 240 × 155. Thus, we extracted 44,175 axial slices of 240 × 240 pixels of every modality to train, validate and test the LGMSU-Net. As well, the split ratio of the training set, validation set, and test set is 7:1:2. In this work, we segmented the whole tumor region.

3.1.2. Preprocessing and Augmentation

The intensities in different modalities and patients are various, which will adversely affect the performance of BTS technology. We achieved intensity normalization by applying z-score transformation, i.e., by subtracting the mean and dividing by the standard deviation within brain regions on each slice. Moreover, during training, we randomly employed one of three data augmentation methods to process the slices, namely random rotations (Rotated 90 degrees clockwise or counterclockwise at random, or rotated along any of the three axes at random.), elastic deformation (The standard deviation of Gaussian kernel was 3, and the scale factor controlling the deformation strength was 15.), and gamma transform (The gamma factor was set to 2).

3.1.3. Implementation Details

The input to all the networks that we study in this work is a four-channel input consisting of a slice selected from each of the four MRI modalities. We utilized RMSprop optimizer with weight decay 10 8 , momentum 0.9 and learning rate 0.00001 to train all networks. The batch size was 4, the number of epochs was 40 and the learning rate would be reduced by a factor of 0.5 if the Dice score of the validation set had not been increased for four epochs. All hyperparameters used in the network were optimal parameters obtained through extensive experiments. Dice loss and binary cross-entropy loss functions were directly summed to form the loss function we used for backpropagation. Furthermore, to alleviate the overfitting problem, in addition to using data augmentation to increase the amount of data, we also applied dropout operations in the network. We adopted Pytorch and NVIDIA RTX 2080 Ti for all experiments.

3.2. Ablation Experiments

We used six metrics, namely Dice score, mean Intersection over Union (mIoU), Precision, Recall, number of parameters of a certain model (Params), and Inference time (The time, in milliseconds, taken to segment a slice), to evaluate BTS performance of networks we studied on the test set, with the checkpoint obtaining the highest Dice score on the validation set. In addition, we performed Wilcoxon signed-rank tests on the Dice Score metric following the method of [36] to confirm that our improvement was effective in a statistical sense. If the p-value was less than 0.05, it was considered statistically significant.
We first examined the impact of the number of ADA modules on the BTS performance of the proposed model without multi-input and multi-output. The experimental results were shown in Table 1. The table showed that the Dice score evaluation index of the model increased with the increase in the number of ADA modules until the number of ADA modules reached three. Therefore, we applied three ADA modules in our proposed model. The number of model parameters decreased and the inference time increased with the increase in the number of ADA modules. This was because we did not add an ADA module to the model but replaced some convolution operations with an ADA module, which revealed that an ADA module had fewer parameters than the replaced convolution operations, but required more computation.
Then, the effect of components in LGMSU-Net was explored and the experimental results were listed in Table 2. As seen in line 2 of Table 2, replacing some convolution operations in “BN“ with “ADA” significantly promoted BTS performance, revealing that fusing global features and local features could effectively improve the segmentation performance. Meanwhile, the number of parameters of the model in line 2 decreased but the inference time increased, which was consistent with the analysis of Table 1 that an ADA module had fewer parameters and more computation than the replaced convolution operations. Moreover, the use of positional embeddings in the study [27] slightly improved the BTS performance but greatly speeded up the training process, as shown in Figure 3. Specifically, in the early stage of training, the model with positional embeddings performed better and achieved the best validation result at the 22nd training epoch, while the model without positional embeddings achieved the best validation result until the 36th training epoch. Moreover, the separate use of MSI (line 4 of Table 2) and MSO (line 5 of Table 2) both improved the network performance, revealing that the multi-scale features were important for the BTS task. Further, the simultaneous application of the MSI and MSO, as shown in line 6 of Table 2, further improved the BTS performance. Finally, the number of increased parameters and inference time of all the components we used in LGMSU-Net were acceptable compared with the improved performance.
The results of the contrast experiments between the ADA module and other self-attention modules were summarized in Table 3, which obviously showed that the ADA module we proposed outperformed other popular self-attention modules for the BTS task, and the assumption mentioned in Introduction was proved. The visualizations of the input and output of different self-attention modules in the third layer of the model were plotted in Figure 4.
As shown in Figure 4, the heatmap of the output results of our proposed ADA module showed the strongest contrast between the brain tumor and the background region, and the contour position of the brain tumor was the clearest, which proved that the proposed ADA module was effective on the BTS task. To be specific, the outline, location, and size of brain tumors were not clear in the output heatmaps of Transformer and AAM modules and the output heatmap of SwinAM was composed of many windows after calculating the global attention in a sliding window. Although, the DAM module’s output heatmap was similar to that of ADA, the tumor region in the ADA module’s output heatmap was cleaner and more strongly contrasted with the background, which explained visually why our proposed ADA module worked better.

3.3. Contrast Experiments

To further evaluate the performance of the proposed model, we conducted contrast experiments between the proposed LGMSU-Net and seven other state-of-the-art methods, namely UNet [11], DeepLab v3+ [12], AttentionUnet [37], UNet3+ [16], TransBTS [20], Swin-Unet [26], and Unetr [38] to verify the feasibility and efficiency of LGMSU-Net and showed the experimental results in Table 4. As shown in the table, the UNet model achieved ideal segmentation performance for the BTS task. Although there were only slightly more parameters and inference time, the AttentionUnet significantly improved the BTS performance compared with UNet, which indicated that the attention mechanism was beneficial to the BTS task. UNet3+ and DeepLab v3+ both greatly increased the parameters and used multi-scale features. However, their segmentation results were worse than those of UNet, which proved that fusing multi-scale features and local features without careful design might damage the performance of models for the BTS task. TransBTS added four Transformer layers at the bottom compared with UNet, which greatly increased the parameters but only improved the performance a little. This showed the effectiveness of global features and also indicated that TransBTS did not use global features correctly. As shown in line 7 of Table 4, the Unetr whose encoding path without no convolution operations had the maximum number of parameters but the second to last result, which revealed that local features used to obtain detailed information played an essential role in the BTS task. Meanwhile, the worst segmentation performance for the BTS task was obtained using Swin-Unet, a pure Transformer with no convolution operations, which again implied that only extracting global features and ignoring local features were not feasible for the BTS task. Finally, the proposed LGMSU-Net, whose inference time was fast enough, was the highest in Dice score, mIoU, and Recall evaluation metrics and had the third-smallest number of parameters among all eight advanced models. The comparison of the experimental data in columns 6 and 7 in Table 4 showed that the recall indexes of all models were generally low. This may be due to the high false-negative rate caused by the large background area in the data.
The performance improvement of the proposed LGMSU-Net was mainly due to the improvement of the recall index, which indicated that the model effectively alleviated the problem of difficult segmentation due to large background proportions. We believed that the key to achieving excellent performance of the proposed LGMSU-Net in the BTS task was to reasonably and effectively integrate local features representing detailed information, global features representing the global information, and multi-scale features enhancing the robustness of the model.
Furthermore, we visualized the results of contrast experiments and showed that in Figure 5. It can be seen that compared to the ground-truth segmentation of brain tumors in the second row, our proposed model performed the best for different input images, both in terms of brain tumor location and contour (the third row), which was consistent with the above analysis.
Moreover, considering that noise in real-world biomedical images was a well-known problem that may reduce the accuracy of diagnosis, we added Gaussian noise to the input image to explore its impact on models’ performance.
As can be seen from Table 5, the performance of all models declined to varying degrees after noise was added. It can be seen from the drop value that the proposed model had the minimum drop value and optimal performance. We believed that this was because the proposed model combined various rich feature information, which enhanced the robustness of the model and enabled it to show better performance for different inputs.

3.4. Limitations

Although our proposed method achieved excellent performance on the BTS task, it also had some limitations. First, we conducted all experiments on 2D slices extracted from 3D data, thus discarding the information between slices, which may influence the performance of BTS. Second, M and K values in Formula (1) needed to be set manually, which increased the work and thus limited the learning ability of the model. Thirdly, it had not yet been applied in clinical practice, and it was not known what problems would arise in clinical practice.

4. Conclusions and Future Work

Since brain tumors were currently one of the most lethal diseases and different brain tumors may have the same or different shapes, textures, locations, or contours. Therefore, BTS was a task with low fault tolerance and high difficulty. In this paper, we proposed an accurate brain tumor automatic segmentation model that fused multiple feature information. The model we designed had the following advantages.
(1)
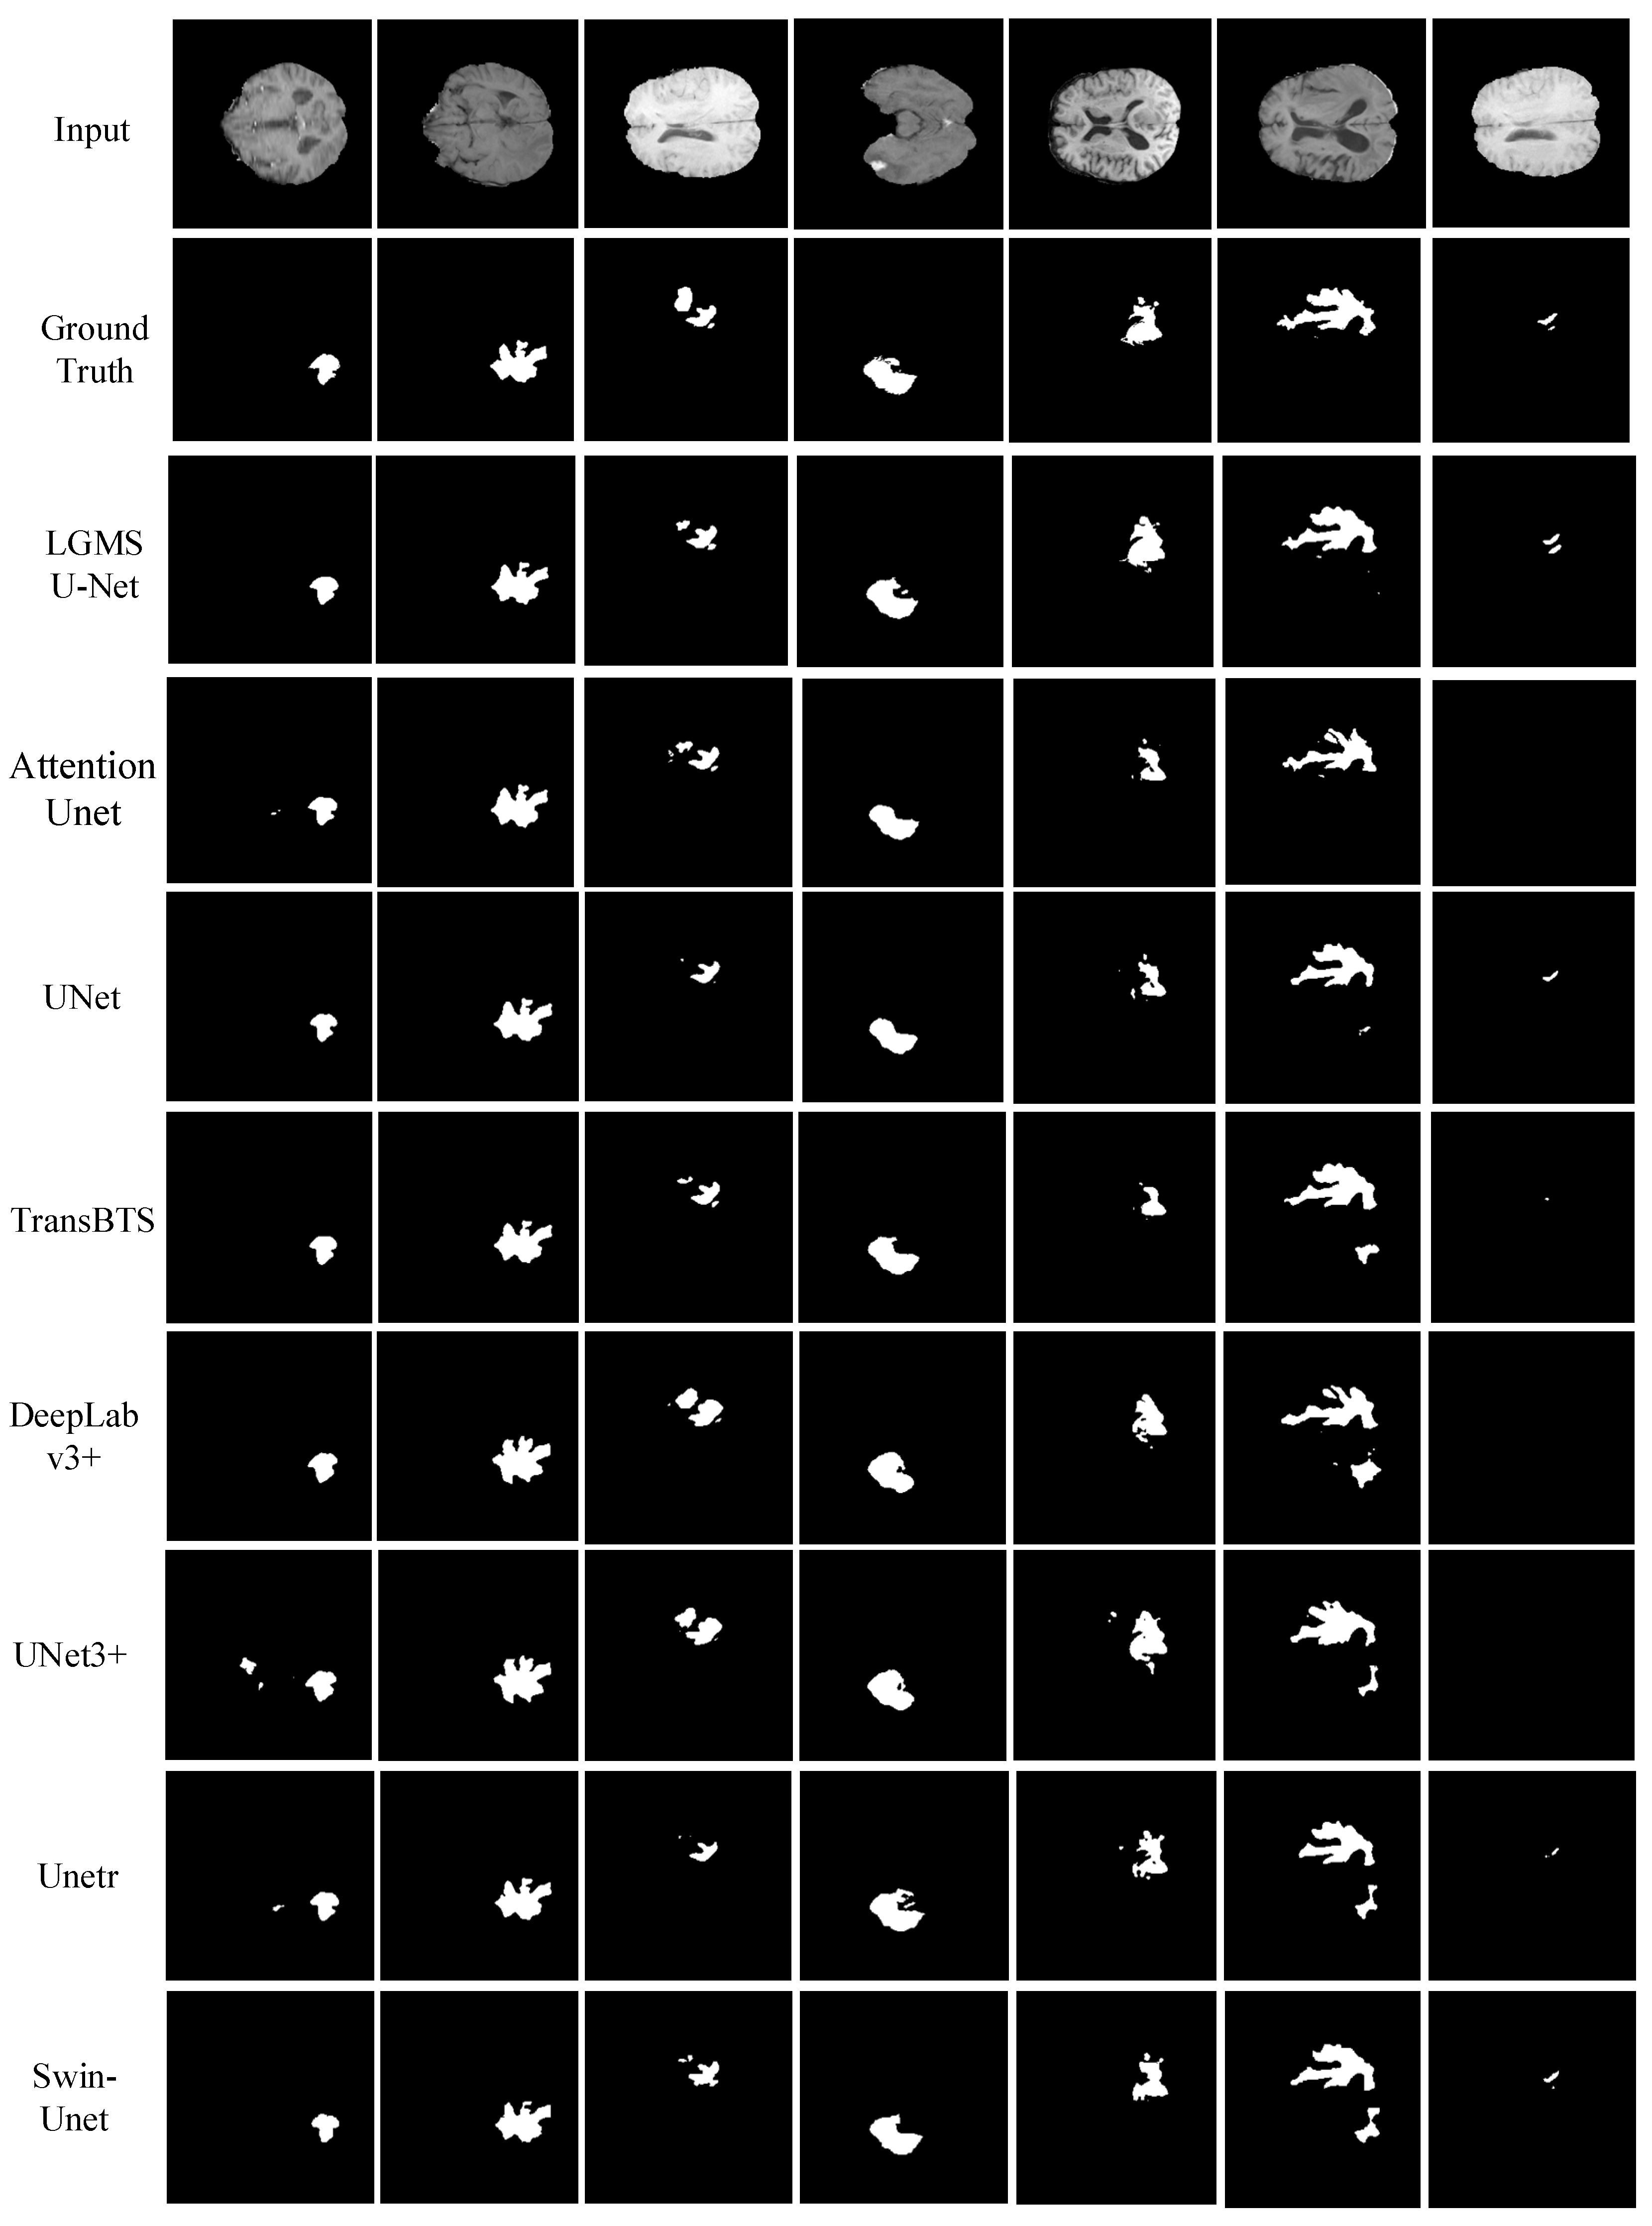
Our network extracted local detailed feature information through convolution operation, multi-scale feature information to enhance the robustness of the network through MSI and MSO, and global feature information through our proposed ADA module, and reasonably fused these features to segment brain tumors automatically and accurately on the Brats2018 dataset, which was superior to the seven state-of-the-art methods, as shown in Table 4 and Figure 5. Furthermore, our model was found to be the best robust among eight advanced BTS models by studying the effect of noise on model performance, as shown in Table 5.
(2)
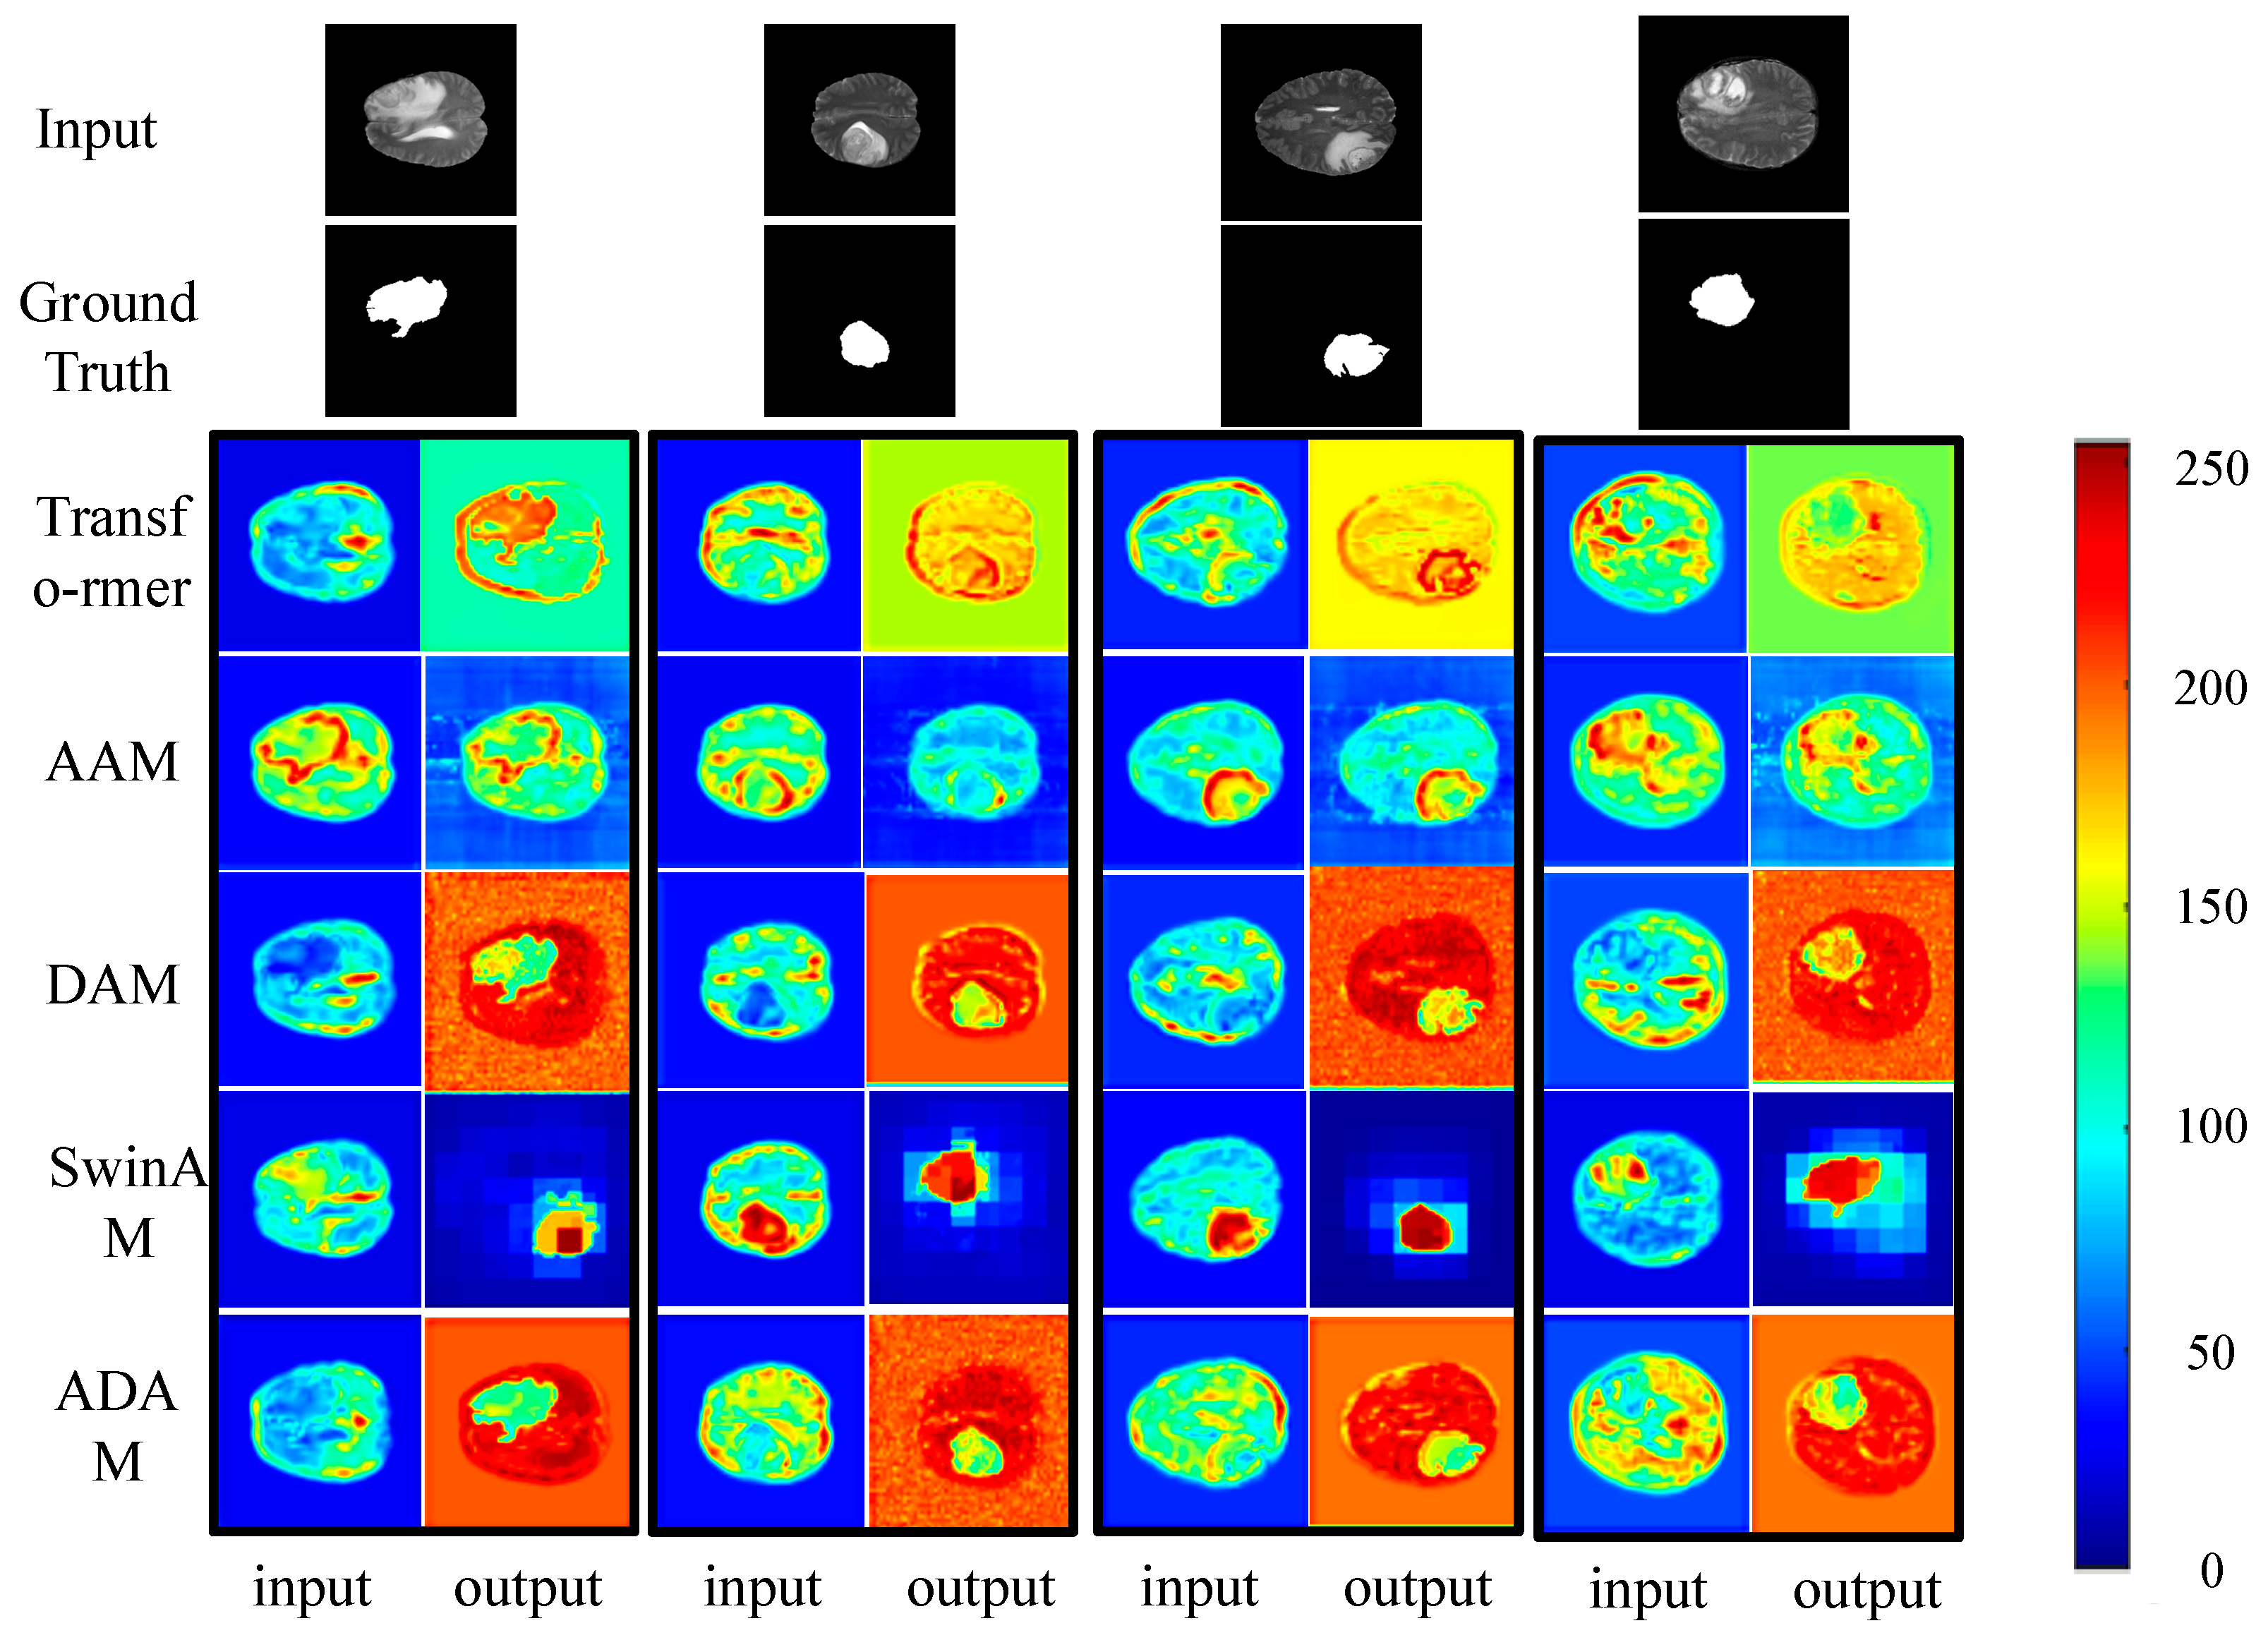
The ADA module we proposed was a novel and useful self-attention module for the BTS task. It sampled a small set of key points in a certain column or a certain row, which could achieve a more accurate performance of BTS with acceptable computation complexity, as shown in Table 3 and Figure 4.
(3)
Positional embeddings were proved in self-attention mechanism could accelerate convergence during training and slightly improve the BTS performance, as shown in Table 2 and Figure 3.
(4)
Extensive experiments had proved that the proposed network achieved excellent performance on the task of BTS, which meant that it would help clinicians to reduce the time spent in BTS tasks and improve the segmentation accuracy. Moreover, it also could be used as an auxiliary tool to provide suggestions on BTS tasks to help junior clinicians improve their skills as soon as possible.
In future work, we plan to design a 3D BTS model with a small number of parameters and memory footprint. In addition, finding ways to let the model learn the appropriate M and K values automatically to further improve the performance and usability of the model is also important. Moreover, inspired by [39], we will explore the image fusion algorithm to achieve a more accurate segmentation of brain tumors. Last but not least, we still need to further explore the practicality of our proposed method in clinical research.

Author Contributions

Methodology, X.P. and Y.W.; software, X.P. and Y.W.; validation, X.P., Y.W., F.L. and Z.Z.; formal analysis, X.P.; investigation, X.P. and F.L.; resources, Z.Z. and F.C.; writing—original draft preparation, X.P.; writing—review and editing, X.P. and Y.W.; funding acquisition, Z.Z. and F.C. All authors have read and agreed to the published version of the manuscript.

Funding

This study was funded by the National Key Research and Development Program of China under Grant 2019YFB1311300.

Data Availability Statement

The dataset can be downloaded from https://www.med.upenn.edu/sbia/brats2018/registration.html (accessed on 30 May 2022).

Conflicts of Interest

The authors declare no conflict of interest.

Abbreviation

OriginalAbbreviation
brain tumor segmentationBTS
multi-scale inputMSI
multi-scale outputMSO
convolutional neural networkCNN
axial attention moduleAAM
deformable attention moduleDAM
axial-deformable attentionADA
U-shaped network fusing local features, global features, and multi-scale featuresLGMSU-Net
Vertical-DAMVDAM
Horizontal-DAMHDAM
magnetic resonance imagingMRI
mean Intersection over UnionmIoU
parameters of a certain modelParams

References

  1. Işın, A.; Direkoğlu, C.; Şah, M. Review of MRI-based brain tumor image segmentation using deep learning methods. Procedia Comput. Sci. 2016, 102, 317–324. [Google Scholar] [CrossRef] [Green Version]
  2. Leng, Y.; Wang, X.; Liao, W.; Cao, Y. Radiomics in gliomas: A promising assistance for glioma clinical research. J. Cent. South Univ. Med. Sci. 2018, 43, 354–359. [Google Scholar] [CrossRef]
  3. Lorenzo, P.R.; Nalepa, J.; Bobek-Billewicz, B.; Wawrzyniak, P.; Mrukwa, G.; Kawulok, M.; Ulrych, P.; Hayball, M.P. Segmenting brain tumors from FLAIR MRI using fully convolutional neural networks. Comput. Methods Programs Biomed. 2019, 176, 135–148. [Google Scholar] [CrossRef] [PubMed]
  4. Chen, H.; Dou, Q.; Yu, L.; Qin, J.; Heng, P.A. VoxResNet: Deep voxelwise residual networks for brain segmentation from 3D MR images. NeuroImage 2018, 170, 446–455. [Google Scholar] [CrossRef]
  5. Doyle, S.; Vasseur, F.; Dojat, M.; Forbes, F. Fully automatic brain tumor segmentation from multiple MR sequences using hidden Markov fields and variational EM. In Proceedings of the NCI-MICCAI BraTS 2013, Nagoya, Japan, 22−26 September 2013; pp. 18–22. [Google Scholar]
  6. Wang, H.; Suh, J.W.; Das, S.R.; Pluta, J.B.; Craige, C.; Yushkevich, P.A. Multi-atlas segmentation with joint label fusion. IEEE Trans. Pattern Anal. Mach. Intell. 2013, 35, 611–623. [Google Scholar] [CrossRef] [Green Version]
  7. Moeskops, P.; Benders, M.J.; Chiţǎ, S.M.; Kersbergen, K.J.; Groenendaal, F.; de Vries, L.S.; Viergever, M.A.; Isgum, I. Automatic segmentation of MR brain images of preterm infants using supervised classification. NeuroImage 2015, 118, 628–641. [Google Scholar] [CrossRef]
  8. Bauer, S.; Nolte, L.; Reyes, M. Fully Automatic Segmentation of Brain Tumor Images Using Support Vector Machine Classification in Combination with Hierarchical Conditional Random Field Regularization. In Lecture Notes in Computer Science (including Subseries Lecture Notes in Artificial Intelligence and Lecture Notes in Bioinformatics); Springer: Berlin/Heidelberg, Germany, 2011; pp. 354–361. [Google Scholar] [CrossRef] [Green Version]
  9. Hassan, M.; Murtza, I.; Hira, A.; Ali, S.; Kifayat, K. Robust spatial fuzzy GMM based MRI segmentation and carotid artery plaque detection in ultrasound images. Comput. Methods Programs Biomed. 2019, 175, 179–192. [Google Scholar] [CrossRef]
  10. Long, J.; Shelhamer, E.; Darrell, T. Fully Convolutional Networks for Semantic Segmentation. In Proceedings of the IEEE Conference on Computer Vision and Pattern Recognition, Boston, MA, USA, 7–12 June 2015; pp. 3431–3440. [Google Scholar]
  11. Ronneberger, O.; Fischer, P.; Brox, T. U-Net: Convolutional Networks for Biomedical Image Segmentation. In International Conference on Medical Image Computing and Computer-Assisted Intervention; Springer: Cham, Switzerland, 2015; pp. 234–241. [Google Scholar]
  12. Chen, L.C.; Zhu, Y.; Papandreou, G.; Schroff, F.; Adam, H. Encoder-Decoder with Atrous Separable Convolution for Semantic Image Segmentation. In Proceedings of the European Conference on Computer Vision (ECCV), Munich, Germany, 8–14 September 2018; pp. 801–818. [Google Scholar]
  13. Kadry, S.; Damasevicius, R.; Taniar, D.; Rajinikanth, V.; Lawal, I.A. U-Net Supported Segmentation of Ischemic-Stroke-Lesion from Brain MRI Slices. In Proceedings of the Seventh International conference on Bio Signals, Images, and Instrumentation (ICBSII), Chennai, India, 25–27 March 2021. [Google Scholar]
  14. Maqsood, S.; Damasevicius, R.; Shah, F.M. An Efficient Approach for the Detection of Brain Tumor Using Fuzzy Logic and U-NET CNN Classification. In Computational Science and Its Applications (ICCSA 2021); Springer: Cham, Switzerland, 2021; pp. 105–118. [Google Scholar]
  15. Zhou, Z.; Siddiquee, M.M.R.; Tajbakhsh, N.; Liang, J. Unet++: A Nested U-Net Architecture for Medical Image Segmentation. In Deep Learning in Medical Image Analysis and Multimodal Learning for Clinical Decision Support; Springer: Cham, Switzerland, 2018; pp. 3–11. [Google Scholar]
  16. Huang, H.; Lin, L.; Tong, R.; Hu, H.; Zhang, Q.; Iwamoto, Y.; Han, X.; Chen, Y.-W.; Wu, J. UNet 3+: A Full-Scale Connected UNet for Medical Image Segmentation. In Proceedings of the ICASSP 2020–2020 IEEE International Conference on Acoustics, Speech and Signal Processing (ICASSP), Barcelona, Spain, 4–8 May 2020; pp. 1055–1059. [Google Scholar] [CrossRef]
  17. Yang, H.; Huang, W.; Qi, K.; Li, C.; Liu, X.; Wang, M.; Zheng, H.; Wang, S. CLCI-Net: Cross-level fusion and context inference networks for lesion segmentation of chronic stroke. In International Conference on Medical Image Computing and Computer-Assisted Intervention; Springer: Cham, Switzerland, 2019; pp. 266–274. [Google Scholar]
  18. Wang, X.; Girshick, R.; Gupta, A.; He, K. Non-Local Neural Networks. In Proceedings of the IEEE Conference on Computer Vision and Pattern Recognition (CVPR), Salt Lake City, UT, USA, 18–22 June 2018; pp. 7794–7803. [Google Scholar]
  19. Vaswani, A.; Shazeer, N.; Parmar, N.; Uszkoreit, J.; Jones, L.; Gomez, A.N.; Kaiser, Ł.; Polosukhin, I. Attention is All You Need. In Advances in Neural Information Processing Systems; Morgan Kaufmann Publishers Inc.: San Francisco, CA, USA, 2017; pp. 5998–6008. [Google Scholar]
  20. Wang, W.; Chen, C.; Ding, M.; Li, J.; Yu, H.; Zha, S. TransBTS: Multimodal Brain Tumor Segmentation Using Transformer. In International Conference on Medical Image Computing and Computer-Assisted Intervention; Springer: Cham, Switzerland, 2021; pp. 109–119. [Google Scholar]
  21. Chen, J.; Lu, Y.; Yu, Q.; Luo, X.; Adeli, E.; Wang, Y.; Lu, L.; Yuille, A.L.; Zhou, Y. Transunet: Transformers make strong encoders for medical image segmentation. arXiv 2021, arXiv:2102.04306. [Google Scholar]
  22. Ho, J.; Kalchbrenner, N.; Weissenborn, D.; Salimans, T. Axial attention in multidimensional transformers. arXiv 2019, arXiv:1912.12180. [Google Scholar]
  23. Zhu, X.; Su, W.; Lu, L.; Li, B.; Wang, X.; Dai, J. Deformable detr: Deformable transformers for end-to-end object detection. arXiv 2020, arXiv:2010.04159. [Google Scholar]
  24. Liu, Z.; Lin, Y.; Cao, Y.; Hu, H.; Wei, Y.; Zhang, Z.; Lin, S.; Guo, B. Swin transformer: Hierarchical vision transformer using shifted windows. arXiv 2021, arXiv:2103.14030. [Google Scholar]
  25. Gao, Y.; Zhou, M.; Metaxas, D.N. UTNet: A hybrid transformer architecture for medical image segmentation. In International Conference on Medical Image Computing and Computer-Assisted Intervention; Springer: Cham, Switzerland, 2021; pp. 61–71. [Google Scholar]
  26. Cao, H.; Wang, Y.; Chen, J.; Jiang, D.; Zhang, X.; Tian, Q.; Wang, M. Swin-Unet: Unet-like Pure Transformer for Medical Image Segmentation. arXiv 2021, arXiv:2105.05537. [Google Scholar]
  27. Xue, Y.; Xu, T.; Zhang, H.; Long, L.R.; Huang, X. SegAN: Adversarial Network with Multi-scale L1 Loss for Medical Image Segmentation. Neuroinformatics 2018, 16, 383–392. [Google Scholar] [CrossRef] [PubMed] [Green Version]
  28. Hao, J.; Li, X.; Hou, Y. Magnetic Resonance Image Segmentation Based on Multi-Scale Convolutional Neural Network. IEEE Access 2020, 8, 65758–65768. [Google Scholar] [CrossRef]
  29. Valanarasu, J.M.J.; Oza, P.; Hacihaliloglu, I.; Patel, V.M. Medical transformer: Gated axial-attention for medical image segmentation. In International Conference on Medical Image Computing and Computer-Assisted Intervention; Springer: Cham, Switzerland, 2021; pp. 36–46. [Google Scholar]
  30. Fu, H.; Cheng, J.; Xu, Y.; Wong, D.W.K.; Liu, J.; Cao, X. Joint optic disc and cup segmentation based on multi-label deep network and polar transformation. IEEE Trans. Med. Imaging 2018, 37, 1597–1605. [Google Scholar] [CrossRef] [PubMed] [Green Version]
  31. Menze, B.H.; Jakab, A.; Bauer, S.; Kalpathy-Cramer, J.; Farahani, K.; Kirby, J.; Burren, Y.; Porz, N.; Slotboom, J.; Wiest, R.; et al. The Multimodal Brain Tumor Image Segmentation Benchmark (BRATS). IEEE Trans. Med. Imaging 2015, 34, 1993–2024. [Google Scholar] [CrossRef] [PubMed]
  32. Bakas, S.; Akbari, H.; Sotiras, A.; Bilello, M.; Rozycki, M.; Kirby, J.; Freymann, J.B.; Farahani, K.; Davatzikos, C. Advancing the cancer genome atlas glioma MRI collections with expert segmentation labels and radionic features. Sci. Data 2017, 4, 170117. [Google Scholar] [CrossRef] [Green Version]
  33. Bakas, S.; Reyes, M.; Jakab, A.; Bauer, S.; Rempfler, M.; Crimi, A.; Shinohara, R.T.; Berger, C.; Ha, S.M.; Rozycki, M.; et al. Identifying the best machine learning algorithms for brain tumor segmentation, progression assessment, and overall survival prediction in the BRATS challenge. arXiv 2018, arXiv:1811.02629. [Google Scholar]
  34. Bakas, S.; Akbari, H.; Sotiras, A.; Bilello, M.; Rozycki, M.; Kirby, J.; Freymann, J.; Farahani, K.; Davatzikos, C. Segmentation Labels and Radiomic Features for the Pre-operative Scans of the TCGA-GBM collection. Cancer Imaging Arch. 2017, 4, 170117. [Google Scholar] [CrossRef]
  35. Bakas, S.; Akbari, H.; Sotiras, A.; Bilello, M.; Rozycki, M.; Kirby, J.; Freymann, J.; Farahani, K.; Davatzikos, C. Segmentation Labels and Radiomic Features for the Pre-operative Scans of the TCGA-LGG collection. Cancer Imaging Arch. 2017. [Google Scholar] [CrossRef]
  36. Wang, Y.L.; Zhao, Z.J.; Hu, S.Y.; Chang, F.L. CLCU-Net: Cross-level connected U-shaped network with selective feature aggregation attention module for brain tumor segmentation. Comput. Methods Programs Biomed. 2021, 207, 106154. [Google Scholar] [CrossRef] [PubMed]
  37. Oktay, O.; Schlemper, J.; Folgoc, L.L.; Lee, M.; Heinrich, M.; Misawa, K.; Mori, K.; McDonagh, S.; Hammerla, N.Y.; Kainz, B.; et al. Attention u-net: Learning where to look for the pancreas. arXiv 2018, arXiv:1804.03999. [Google Scholar]
  38. Hatamizadeh, A.; Tang, Y.; Nath, V.; Yang, D.; Myronenko, A.; Landman, B.; Roth, H.R.; Xu, D. Unetr: Transformers for 3d medical image segmentation. In Proceedings of the IEEE/CVF Winter Conference on Applications of Computer Vision, Waikoloa, HI, USA, 4–8 January 2022; pp. 574–584. [Google Scholar]
  39. Muzammil, S.R.; Maqsood, S.; Haider, S.; Damaševičius, R. CSID: A novel multimodal image fusion algorithm for enhanced clinical diagnosis. Diagnostics 2020, 10, 904. [Google Scholar] [CrossRef] [PubMed]
Figure 1. Proposed LGMSU-Net architecture. Numbers 64, 128, 256, and so on indicate the number of feature channels.
Electronics 11 01911 g001
Figure 2. (a) Illustration of VDAM. (b) Illustration of converting VDAM into HDAM. (c) Schematic diagram of the proposed ADA module.
Electronics 11 01911 g002aElectronics 11 01911 g002b
Figure 3. Comparison of model training performance with and without positional embeddings. The max evaluation during training was marked with a solid dot.
Electronics 11 01911 g003
Figure 4. Visualization of input and output of different self-attention modules. Each row presented a raw MRI scan, ground-truth, Transformer heatmaps, AAM heatmaps, DAM heatmaps, SwinAM heatmaps, and ADA module heatmaps, respectively.
Electronics 11 01911 g004
Figure 5. BTS results of seven state-of-the-art methods versus the proposed LGMSU-Net. The first row represented the visual image of the input image, the second row represented the ground-truth image of the brain tumor, and the third row represented the segmented brain tumor image through our proposed model, the remaining seven rows were the segmented images of the other seven advanced brain tumor segmentation models in Table 4.
Electronics 11 01911 g005
Table 1. “Number” in the table meant the number of ADA modules. All p-values in this table were obtained by comparing with line 3. Place ADA module from the lowest layer of the model. For example, “one” meant an ADA module was applied on the last layer, and “two” meant that an ADA module was placed on the last and penultimate layers. The best performance was shown in bold.
LineNumberDice Scorep-ValuemIoUPrecisionRecallParamsInference Time
1One0.84880.0210.73730.94100.846464.48 M9.73
2Two0.86300.0390.75900.95170.856963.48 M12.40
3Three0.86811.0000.76690.94240.867563.05 M14.30
4Four0.86730.0240.76570.94250.860460.31 M18.35
Table 2. Evaluation results of ablation experiments on the BraTS2018 dataset using six evaluation metrics. “BN” was the base network, namely, UNet; “ADA” was the axial-deformable attention module; “P” was positional embeddings; “MSI” was multi-scale input, and “MSO” was multi-scale output. The “+” of “BN + ADA” indicated that some convolution operations in the “BN” were replaced with “ADA,” and other plus signs indicated that the corresponding component was directly added to the original model. The “*” of “p-Value (*)” denoted the line of the model used for comparison, for example, “0.035(1)” in line 2 meant we performed Wilcoxon signed-rank test between “BN” in line 1 and “BN + ADA” in line 2. The best performance was shown in bold.
LineMethodDice Scorep-Value (*)mIoUPrecisionRecallParamsInference Time
1BN0.85091.000(1)0.74050.93780.863865.87 M8.83
2BN + ADA0.86790.035(1)0.76660.94300.866262.47 M14.09
3BN + ADA + P0.86810.504(2)0.76690.94240.867563.05 M14.30
4BN + ADA + P + MSI0.87320.017(3)0.77480.94470.874368.92 M15.06
5BN + ADA + P + MSO0.87010.009(3)0.77010.94630.872163.15 M15.02
6BN + ADA + P + MSI + MSO0.87350.039(4)0.77550.94770.876969.02 M15.66
Table 3. Ablation analysis on the BraTS2018 dataset for different self-attention modules using six evaluation metrics. “Transformer” was the classical self-attention module [19], “AAM” was the axial attention module, “DAM” was the deformable attention module, “SwinAM” was the Swin Transformer attention module, and “ADA” was the axial-deformable attention module proposed in this study. All p-Values in this table were obtained by comparing with the ADA (line 5). The best performance was shown in bold.
LineMethodDice Scorep-ValuemIoUPrecisionRecallParamsInference Time
1Transformer [19]0.87050.0290.77060.94070.874663.59 M14.27
2AAM [22]0.86830.0060.76720.94430.863468.00 M11.19
3DAM [23]0.86600.0150.76360.94300.868461.53 M10.53
4SwinAM [24]0.86800.0030.76670.93910.874972.36 M11.64
5ADA0.87351.0000.77540.94770.876969.02 M15.66
Table 4. Comparison of the proposed LGMSU-Net with seven state-of-the-art methods. All p-Values in this table were obtained by comparing with LGMSU-Net (line 8). The best performance was shown in bold.
LineMethodDice Scorep-ValuemIoUPrecisionRecallParamsInference Time
1UNet [11]0.85090.0070.74040.90780.853865.87 M8.83
2AttentionUnet [37]0.86480.0310.76180.92650.855768.54 M10.53
3UNet3+ [16]0.84460.0040.73100.94950.7425102.96 M19.54
4DeepLab v3+ [12]0.84820.0060.73640.95460.7596153.92 M6.75
5TransBTS [20]0.85600.0090.74820.92660.8493118.00 M10.04
6Swin-Unet [26]0.82120.0010.69660.89030.8251138.22 M19.11
7Unetr [38]0.83850.0030.72190.88450.8484170.31 M12.06
8LGMSU-Net0.87351.0000.77540.94770.876969.02 M15.66
Table 5. Performance comparison of the proposed LGMSU-Net and seven state-of-the-art methods under the influence of noise. The best performance was shown in bold.
LineMethodDice Score (No Noise)Dice Score (Noise)Drop Value
1UNet [11]0.85090.81100.0399
2AttentionUnet [37]0.86480.84550.0193
3UNet3+ [16]0.84460.80380.0408
4DeepLab v3+ [12]0.84820.81230.0359
5TransBTS [20]0.85600.82490.0311
6Swin-Unet [26]0.82120.79570.0255
7Unetr [38]0.83850.81210.0264
8LGMSU-Net0.87350.86030.0132
Publisher’s Note: MDPI stays neutral with regard to jurisdictional claims in published maps and institutional affiliations.

