Article

Electromechanical Coupling and Application of High-Frequency Communication Antenna Channel Capacity

1
Key Laboratory of Electronic Equipment Structure Design, Ministry of Education, Xidian University, Xi’an 710071, China
2
School of Information and Control Engineering, Xi’an University of Architecture and Technology, Xi’an 710055, China
3
China Electronics Technology Group Corporation No. 38 Research Institute, Hefei 230088, China
4
Shaanxi Huanghe Group Co., Ltd., Xi’an 710005, China
5
The 54th Research Institute of China Electronics Technology Group Corporation, Shijiazhuang 050081, China
6
The 29th Research Institute of China Electronics Technology Group Corporation, Chengdu 610036, China
*
Authors to whom correspondence should be addressed.
Electronics 2022, 11(12), 1857; https://doi.org/10.3390/electronics11121857
Submission received: 15 April 2022 / Revised: 8 June 2022 / Accepted: 9 June 2022 / Published: 11 June 2022
(This article belongs to the Topic Antennas)

Abstract

:
The next-generation communication base station antennas represented by phased array antennas are towards high frequency, high gain, high density, and high pointing accuracy. The influence of mechanical structure factors on communication system channel quality is obviously increasing, and the electromechanical coupling problem is becoming more prominent. To effectively guarantee the realization of 5G/6G communication in complex working environments and accelerate the commercial process of future communication systems, an electromechanical coupling channel capacity model is established in comprehensive consideration of the positional shift, attitude deflection, and temperature change of the communication base station phased array antennas. It can be used to rapidly evaluate the communication index degradation of RF devices within the heating environment. Moreover, a sensitivity model of the electric field strength and array antenna channel capacity to the random position error of each element is constructed. The influence of the random positioning error of each element on the communication indicators is analyzed and compared under different working conditions. The simulation results show that the proposed model can effectively provide a theoretical basis and guiding role for the design and manufacture of high-frequency array base station antennas.

1. Introduction

Commercial wireless communications have evolved from simple voice systems to advanced mobile broadband multimedia systems since the 1980s [1,2,3,4,5]. If the mobile phone is considered to be the main innovative carrier in the 1G to the 4G era [6], then the development of 4G to 5G/6G has brought countless new application directions to various industries. The 5G/6G network would emerge as an important part of modern communication [7]. A large number of millimeter-wave spectra accompanied with 5G/6G key technologies, including beamforming technology [8,9], massive multiple-input multiple-output (MIMO) technology [10,11,12,13], and full-spectrum access [14,15], will present new prospects for future wireless communication.
The 5G/6G base station antenna represented by a phased array antenna is developing toward high frequency, high gain, high density, and high pointing accuracy [16]. This has emphasized the influence and constraints of mechanical structural factors on the channel quality and capacity [17] of communication systems and increased the prominence of the electromechanical coupling problem [18]. This can be a bottleneck, restricting the performance improvement of communication systems. The basic goal of 5G/6G technology is to achieve higher coverage at a lower cost. The channel capacity indicators are directly consistent with the client’s growing interest in faster and higher information rates. Therefore, it is necessary to link the problem of electromechanical-thermal coupling of the 5G/6G base station phased array antennas with the channel capacity of the communication system. Furthermore, the influence mechanism of the channel quality of the base station antenna communication system should be studied to provide a theoretical basis for improving the channel quality of 5G/6G and even the high-frequency communication system of the next generation.
In recent years, there has been an increasing amount of research on the channel capacity of communication systems and some papers have linked channel capacity with antenna indicators. Ref. [19] used probabilistic interval analysis method to calculate the infimum and supremum of the electrical performance of linear phased arrays under element amplitude and phase errors, which can be used to the tolerance analysis of the channel capacity and reliability of base station antennas efficiently. Ref. [20] reconstructed the theoretical model of channel capacity and analyzed the influence of antenna geometry, including antenna array configuration (linear, circular, and rectangular arrays), beam arrival angle, and elemental correlation on channel capacity. The results showed that the array configuration has an important impact on the channel capacity for small-size array antennas. Ref. [21] stated the influence of the vehicle antenna directivity index (beamwidth) on the vehicle communication transmission characteristics (delay, Doppler spread, and channel capacity). It was concluded that the beamwidth on the horizontal plane can affect the received power (noise ratio) of the antenna, which would later affect the channel capacity of the system. The above studies analyzed the relationship between the structural parameters and channel capacity, but did not study the influence of structural parameter variation caused by complex environments on channel capacity, which means that few people associated the electromechanical coupling problem of the antenna with the change in channel capacity for analysis. In addition, the electromechanical coupling theory of active phased array antennas has been extensively studied. In [22], the effects of the structure displacement and thermal deformation of an active phased array antenna (APAA) on electromagnetic (EM) performance were analyzed. The electromagnetic coupling model of the APAA was established and the accuracy of the model was verified. Ref. [23] established the coupling relationship between the EM performance of the antenna and the structural distortion, as well as the random errors of the APAA. In [24], an EM statistical model of the array antenna coupling structure was proposed from the perspective of electromechanical coupling. The EM performance of the antenna, which exhibited saddle-shaped distortion and random position error, was evaluated using a planar array. It can be seen that these studies mainly focused on the influence of structural deformation on the EM performance of the base station antenna. They do not link the electrical performance to important indicators of the base station antenna, such as channel capacity. That is, it does not study the coupling analysis of structure error and base station antenna electrical performance. Furthermore, as the base station antenna rapidly develops toward high frequencies, the electromechanical coupling problem of the antenna can become increasingly prominent and the constraint of antenna structure on communication quality can become clearer.
Meanwhile, unlike traditional base station antennas, 5G/6G antennas use beam forming and beam tracking technologies to “customize” the signals for end-users [25]. Only when all elements are arranged strictly in the design position can the ideal high-gain, high-directivity beam be obtained. However, owing to the structural errors generated in the manufacturing, processing, and installation of the antenna element, the actual position of the element will inevitably deviate from the ideal position, resulting in degraded system communication performance. Furthermore, because the base station array antenna usually works in the millimeter-wave band, which is advantageous for reducing the size of the antenna element and the components in the array, making it easier for the entire communication system to be active, higher requirements are proposed for the installation accuracy of the array element position. This is because even minor installation errors are likely to be of the same order as the working wavelength, which will have a significant influence on the antenna’s EM performance and channel quality. Therefore, it is necessary to quantitatively study the sensitivity of the 5G/6G communication system performance to the random position error of the antenna elements in the x, y and z directions, respectively.
Therefore, the coupling relationship between the structural factors of base station active phased array antennas and the channel capacity was studied, and the influence of factors including the element position offset, pointing deflection, and feed error caused by thermal power consumption of RF devices on the communication quality was analyzed comprehensively. Moreover, the sensitivity model of the electric field strength and channel capacity of the array antenna to the random position error of the elements is also constructed.

2. Electromechanical Coupling Modeling of Channel Capacity

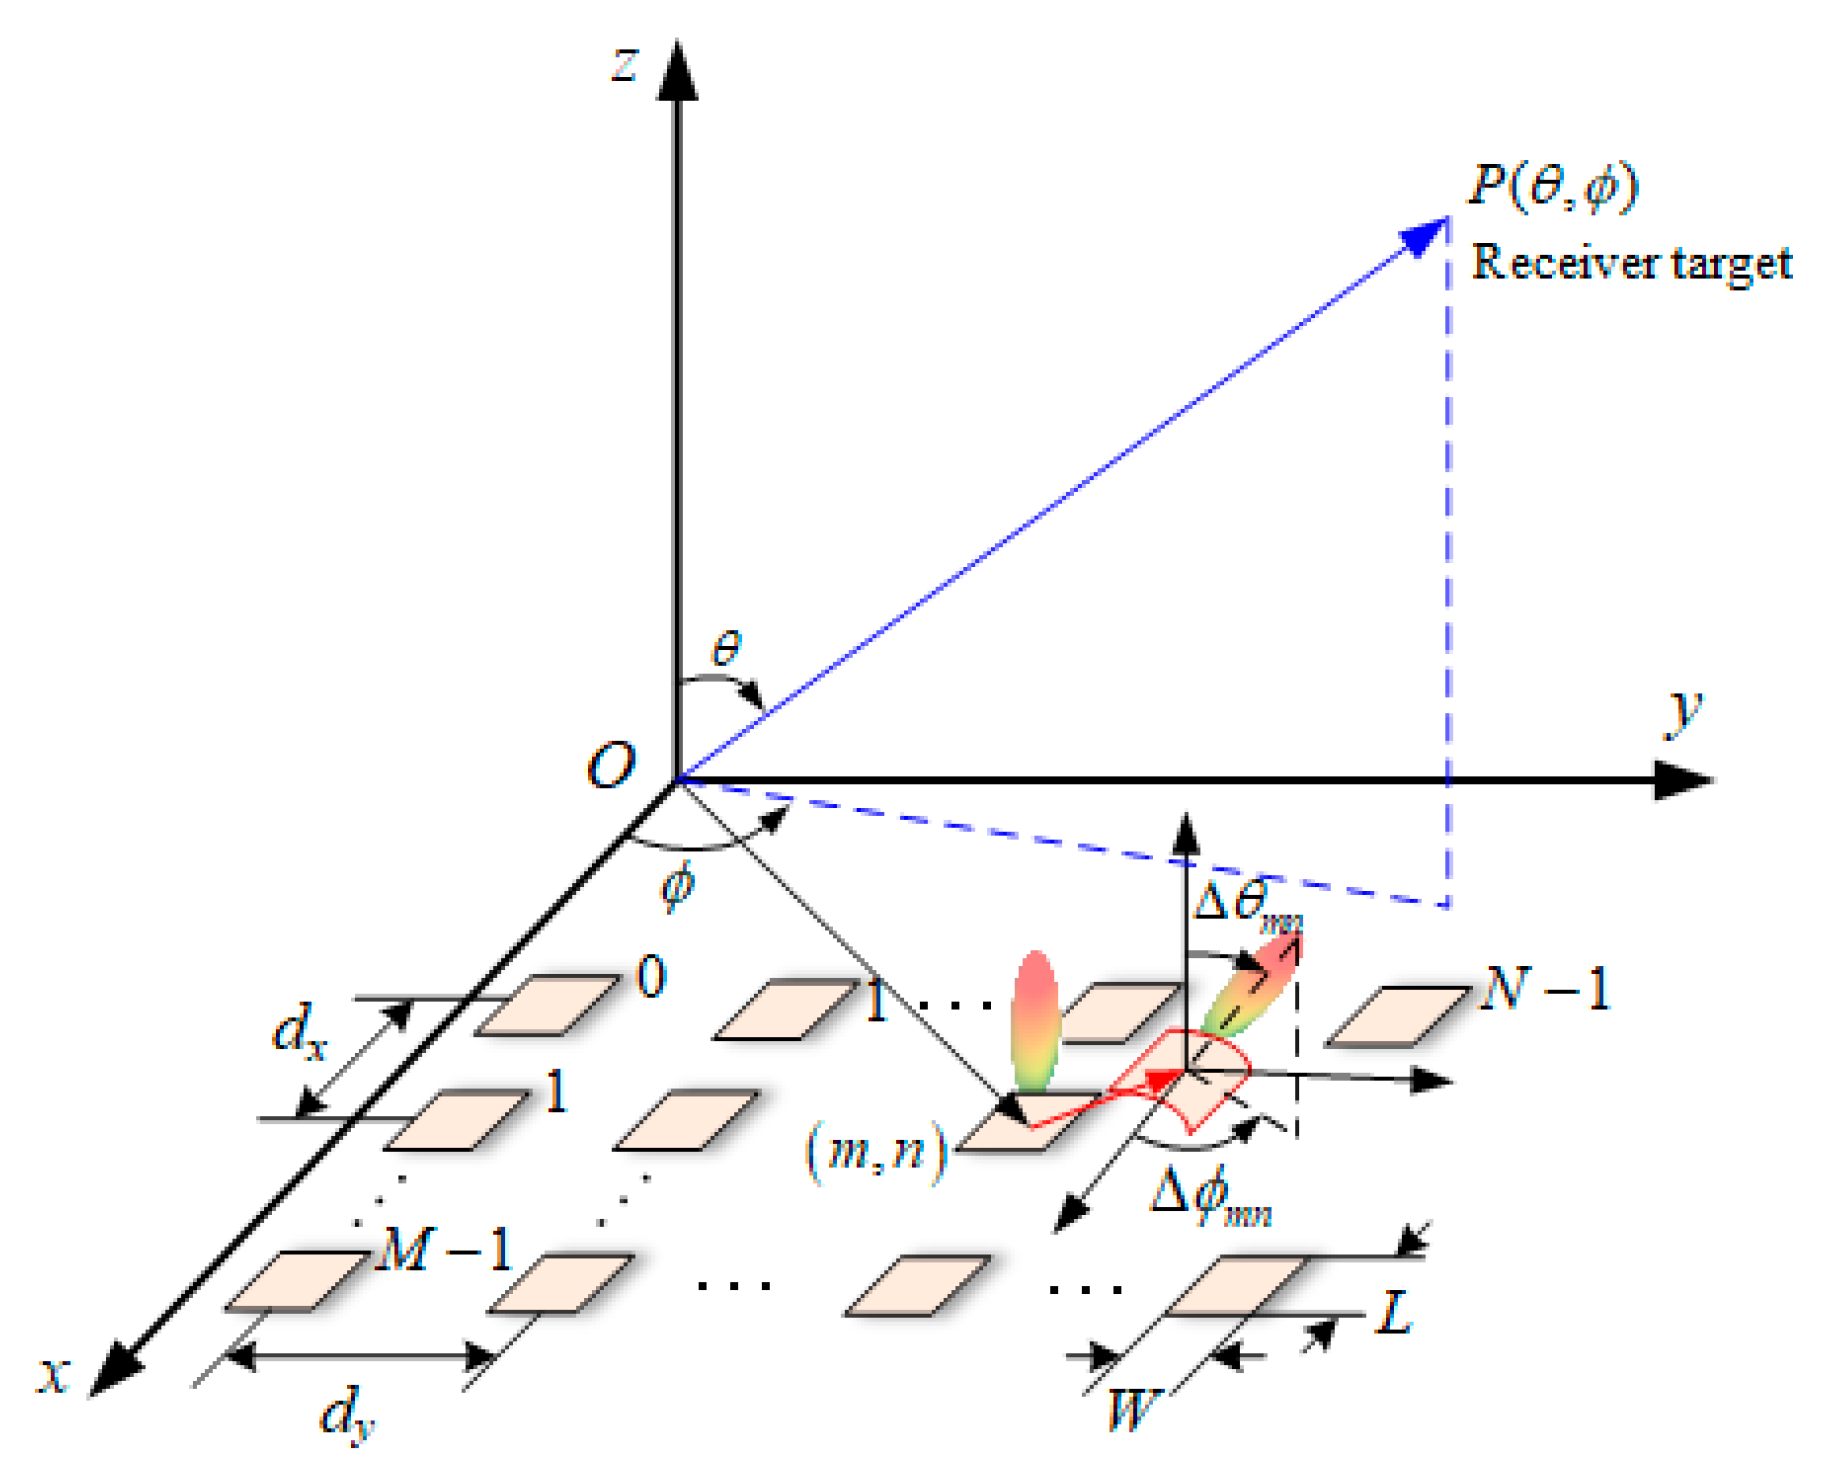
2.1. Establishment of Electromechanical Coupling Model of Channel Capacity

As shown in Figure 1, a 5G/6G base station phased array antenna is arranged in an equidistant rectangular grid, with a total of M×N array elements. The spaces between the elements along the x- and y-axes are d x and d y , respectively, and the maximum beam direction is ( θ 0 , ϕ 0 ) . The direction cosine of the target direction ( θ , ϕ ) at the receiving end can be expressed with respect to the coordinate axis as ( c o s α x , c o s α y , c o s α z ) , shown in Equation (1), so the direction cosine of the maximum base station transmitting beam pointing direction can be expressed as ( u 0 , v 0 , w 0 ) = ( c o s α x 0 , c o s α y 0 , c o s α z 0 ) .
{ u = c o s α x = s i n θ c o s ϕ v = c o s α y = s i n θ s i n ϕ w = c o s α z = c o s θ
During the working process, the element position offset and pointing deflection can be caused by structural distortion, manufacturing, and assembly error of the elements, where the positional offset of the ( m , n )   ( 0 m M 1 , 0 n N 1 ) element is assumed as ( Δ x m n , Δ y m n , Δ z m n ) and the pointing deflection is ( Δ θ m n , Δ ϕ m n ) , as shown in Figure 1. In addition, the feeding errors of elements can be generated owing to the thermal power consumption of a large number of electronic devices in T/R modules, where the normalized amplitude error and phase error can be expressed as Δ A m n ( T ) and Δ φ m n ( T ) , respectively.
Based on the electromechanical coupling model [22], the pattern function of the 5G/6G base station phased array antenna under the influences of structural distortion, manufacturing, thermal power consumption, and assembly error of the elements is expressed as below when neglecting the mutual coupling between the array elements.
F B S ( θ , ϕ ) = m = 0 M 1 n = 0 N 1 f m n ( θ Δ θ m n , ϕ Δ ϕ m n ) I m n [ 1 + Δ A m n ( T ) ] e x p { j [ k ( m d x u + n d y v ) + Δ Φ m n + Δ φ m n ( T ) ] }
where I m n = A m n e x p ( j φ m n ) is the initial excitation current of the ( m , n ) element, A m n and φ m n are the amplitude and phase, respectively, Δ Φ m n is the far-field spatial phase change caused by the offset between the ( m , n ) element and the ( 0 , 0 ) element, as expressed in (3), f m n ( θ Δ θ m n , ϕ Δ ϕ m n ) is the pattern of the element itself, as expressed in (4), k = 2 π / λ is the wave propagation constant, and λ is the wavelength of the base station phased array antenna.
Δ Φ m n = k [ ( Δ x m n Δ x 0 , 0 ) ( u u 0 ) + ( Δ y m n Δ y 0 , 0 ) ( v v 0 ) + ( Δ z m n Δ z 0 , 0 ) w ]
{ f m n ( θ , ϕ ) = c o s ϕ f ( θ , ϕ ) c o s θ s i n ϕ f ( θ , ϕ ) f ( θ , ϕ ) = s i n c ( k W 2 s i n θ s i n ϕ ) c o s ( k L 2 s i n θ c o s ϕ )
The pointing deflection angle ( Δ θ m n , Δ ϕ m n ) can be found by the following step. First, assume that the surface equation of the entire base station antennas after deformation can be expressed by z = f ( x , y ) . Then, the normal vector of the tangent plane at the point of an element on the surface can be expressed by l m n = ± ( z x , z y , 1 ) . The relationship between the direction cosine of the normal vector l m n and its angle ( Δ θ m n , Δ ϕ m n ) with respect to the coordinate axis can be obtained as follows.
{ c o s | Δ θ m n | = 1 1 + ( f ( x , y ) / x ) 2 + ( f ( x , y ) / y ) 2 c o s | Δ ϕ m n | = | f ( x , y ) / x | s i n | Δ θ m n | 1 + ( f ( x , y ) / x ) 2 + ( f ( x , y ) / y ) 2
In the communication downlink, a 5G/6G base station phased array antenna is used as the transmitting antenna. Channel noise is inevitable in the transmitting process, usually assumed to be additive white Gaussian noise (AWGN) in communication systems. AWGN is very representative and widely used as it is the most important and common noise and interference model in communication channels. The Shannon capacity formula gives the maximum achievable capacity (transmission bit rate) of a given channel in which the noise characteristics, operating bandwidth, and other indicators are known [26]. Assume that the operating bandwidth of the channel is B (Hz) and the signal-to-noise ratio at the receiving end is SNR, the maximum amount of information C (in bps) that the channel can carry is
C = B × l o g 2 ( 1 + S N R ) = B × l o g 2 ( 1 + 10 l g P R B N 0 )
where the SNR is used to evaluate the performance measurement characteristics of the communication system, representing the ratio between the signal of the channel output (meaningful information) and the background noise power, and N 0 is the AWGN power spectral density (W/Hz). Channel environments and transmission distance are different in the analysis of actual problems, but a certain value can always be given in a specific condition. Therefore, N 0 is often treated as a measurable constant when calculating the noise performance of a communication system.
According to the equivalent circuit principle of the receiving antenna, the receiving power of the antenna is
P R = | E ( θ , ϕ ) | 2 F R 2 ( θ , ϕ ) 240 π k 2 G R γ R c o s 2 ( ξ )
where E ( θ , ϕ ) is the electric field strength of the incoming wave at the receiving antenna, F R ( θ , ϕ ) is the normalized pattern function of the receiving antenna, G R is the gain of the receiving antenna, γ R is the matching coefficient at the receiving end, representing the matching degree between the receiving antenna and the load, and γ R = 1 when the receiving antenna and the load for the conjugate match, c o s ( ξ ) is the polarization matching factor. ξ = 0 and c o s ( ξ ) = 1 when it is polarization matching.
According to Poynting vector method, the radiative power flux density of the transmitting antenna in the far field area is
S ( θ , ϕ ) = 1 2 E ( θ , ϕ ) × H ( θ , ϕ ) * = | E ( θ , ϕ ) | 2 240 π
Meanwhile, the radiative power flux density can also be expressed as
S ( θ , ϕ ) = U ( θ , ϕ ) r 2 = U M F T , B S 2 ( θ , ϕ ) r 2 = P T G T , B S F T , B S 2 ( θ , ϕ ) γ T 4 π r 2
where U M is the radiation intensity in the maximum radiation direction of the transmitting antenna, G T , B S is the gain of the transmitting antenna, F T , B S ( θ , ϕ ) = F B S | F B S | max is the normalized electric field strength pattern function of the transmitting antenna, P T is the input power of the feeding device at the transmitting end, and γ T is the efficiency of the feed system at the transmitting end. γ T = 1 in an ideal situation.
According to (8) and (9), it can be determined that
| E ( θ , ϕ ) | 2 = 60 P T G T , B S F T , B S 2 ( θ , ϕ ) γ T r 2
Then, the received power of the array antenna can be obtained by substituting (10) into (7), as follows:
P R = λ 2 16 π 3 r 2 P T G R F R 2 ( θ , ϕ ) γ R G T , B S F T , B S 2 ( θ , ϕ ) γ T c o s 2 ( ξ )
Finally, substituting (11) into (6), the coupling relationship between the channel capacity and the EM performance of the transmitting phased array antenna can be obtained as follows, which can be used to describe the influence mechanism of the structural and feed errors caused by the thermal power of RF devices on the communication system channel quality in 5G/6G base station phased array antennas. In addition, it is assumed that the transmitting and receiving antennas are both under an ideal matching state and that the receiving antenna works in the ideal condition; therefore, the electromechanical-thermal coupling problem of the receiving antenna is not considered.
C = B × l o g 2 ( 1 + 10 l g λ 2 γ T γ R P T G R F R 2 ( θ , ϕ ) 16 π 3 r 2 B N 0 G T , B S F T , B S 2 ( θ , ϕ ) )

2.2. Sensitivity Model Establishment of Array Element Position

Based on the established electromechanical-thermal coupling model of the 5G/6G base station phased array antenna, the sensitivity calculation model of the electric field strength and channel capacity to the position error of the array element is obtained by separately solving the partial derivatives of the two technical indicators to the array element position. The model can be used to demonstrate the influence of the array element position error on the communication technical indicators. The random position error of the array element is very small. Thus, it has an unobvious influence on the array factor pattern, whereas the array element pattern can be considered unchanged, so the change of the array element pattern is not taken into consideration in the sensitivity calculation model. The electromechanical-thermal coupling model of the 5G/6G base station phased array antenna in Equation (2) can be simplified to
f a ( θ , ϕ ) = m = 0 M 1 n = 0 N 1 I m n e x p { j k [ ( m d x + Δ x m n Δ x 0 , 0 ) ( u u 0 ) + ( n d y + Δ y m n Δ y 0 , 0 ) ( v v 0 ) + ( Δ z m n Δ z 0 , 0 ) w ] } = m = 0 M 1 n = 0 N 1 I m n e x p { j k [ ( x m n Δ x 0 , 0 ) ( u u 0 ) + ( y m n Δ y 0 , 0 ) ( v v 0 ) + ( z m n Δ z 0 , 0 ) w ] }
The partial derivatives of the array factor pattern function f a ( θ , ϕ ) to the actual position ( x m n , y m n , z m n ) of the antenna element ( m , n ) are as follows:
f a ( θ , ϕ ) x m n = | I m n | j k ( u u 0 ) e x p { j k [ ( u u 0 ) ( x m n Δ x 0 , 0 ) + ( v v 0 ) ( y m n Δ y 0 , 0 ) + w ( z m n Δ z 0 , 0 ) ] }
f a ( θ , ϕ ) y m n = | I m n | j k ( v v 0 ) e x p { j k [ ( u u 0 ) ( x m n Δ x 0 , 0 ) + ( v v 0 ) ( y m n Δ y 0 , 0 ) + w ( z m n Δ z 0 , 0 ) ] }
f a ( θ , ϕ ) z m n = | I m n | j k w e x p { j k [ ( u u 0 ) ( x m n Δ x 0 , 0 ) + ( v v 0 ) ( y m n Δ y 0 , 0 ) + w ( z m n Δ z 0 , 0 ) ] }
According to the above, the sensitivity matrix of the electric field strength of the base station antenna array factor to the ( m , n ) position error of the array element is
S m n f a = [ f a ( θ , ϕ ) x m n , f a ( θ , ϕ ) y m n , f a ( θ , ϕ ) z m n ]
Then, by combining the sensitivity values in the x , y , and z directions of all the antenna elements according to the array arrangement, the sensitivity matrix of the array electric field strength factor to all the element positional errors can be obtained.
Similarly, the partial derivative of the channel capacity C to the actual position ( x m n , y m n , z m n ) of the array element can be obtained as follows:
C x m n = 20 B [ 1 + 10 l g α f a 2 ( θ , ϕ ) ] l n 2 f a ( θ , ϕ ) l n 10 f a ( θ , ϕ ) x m n
C y m n = 20 B [ 1 + 10 l g α f a 2 ( θ , ϕ ) ] l n 2 f a ( θ , ϕ ) l n 10 f a ( θ , ϕ ) y m n
C z m n = 20 B [ 1 + 10 l g α f a 2 ( θ , ϕ ) ] l n 2 f a ( θ , ϕ ) l n 10 f a ( θ , ϕ ) z m n
where the parameter α is α = λ 2 γ T γ R P T G R F R 2 ( θ , ϕ ) G T , B S 16 π 3 r 2 B N 0 .
The sensitivity matrix of the channel capacity to the position error of the ( m , n ) array element can be obtained as
S m n C = [ C x m n , C y m n , C z m n ]
The performance of the communication indicators is mainly related to the main-lobe area of the transmitting and receiving beams. Thus, ( θ , ϕ ) in the above two sensitivity matrices are selected to choose the main-lobe area of the base station antenna.

3. Simulation Analysis and Discussion

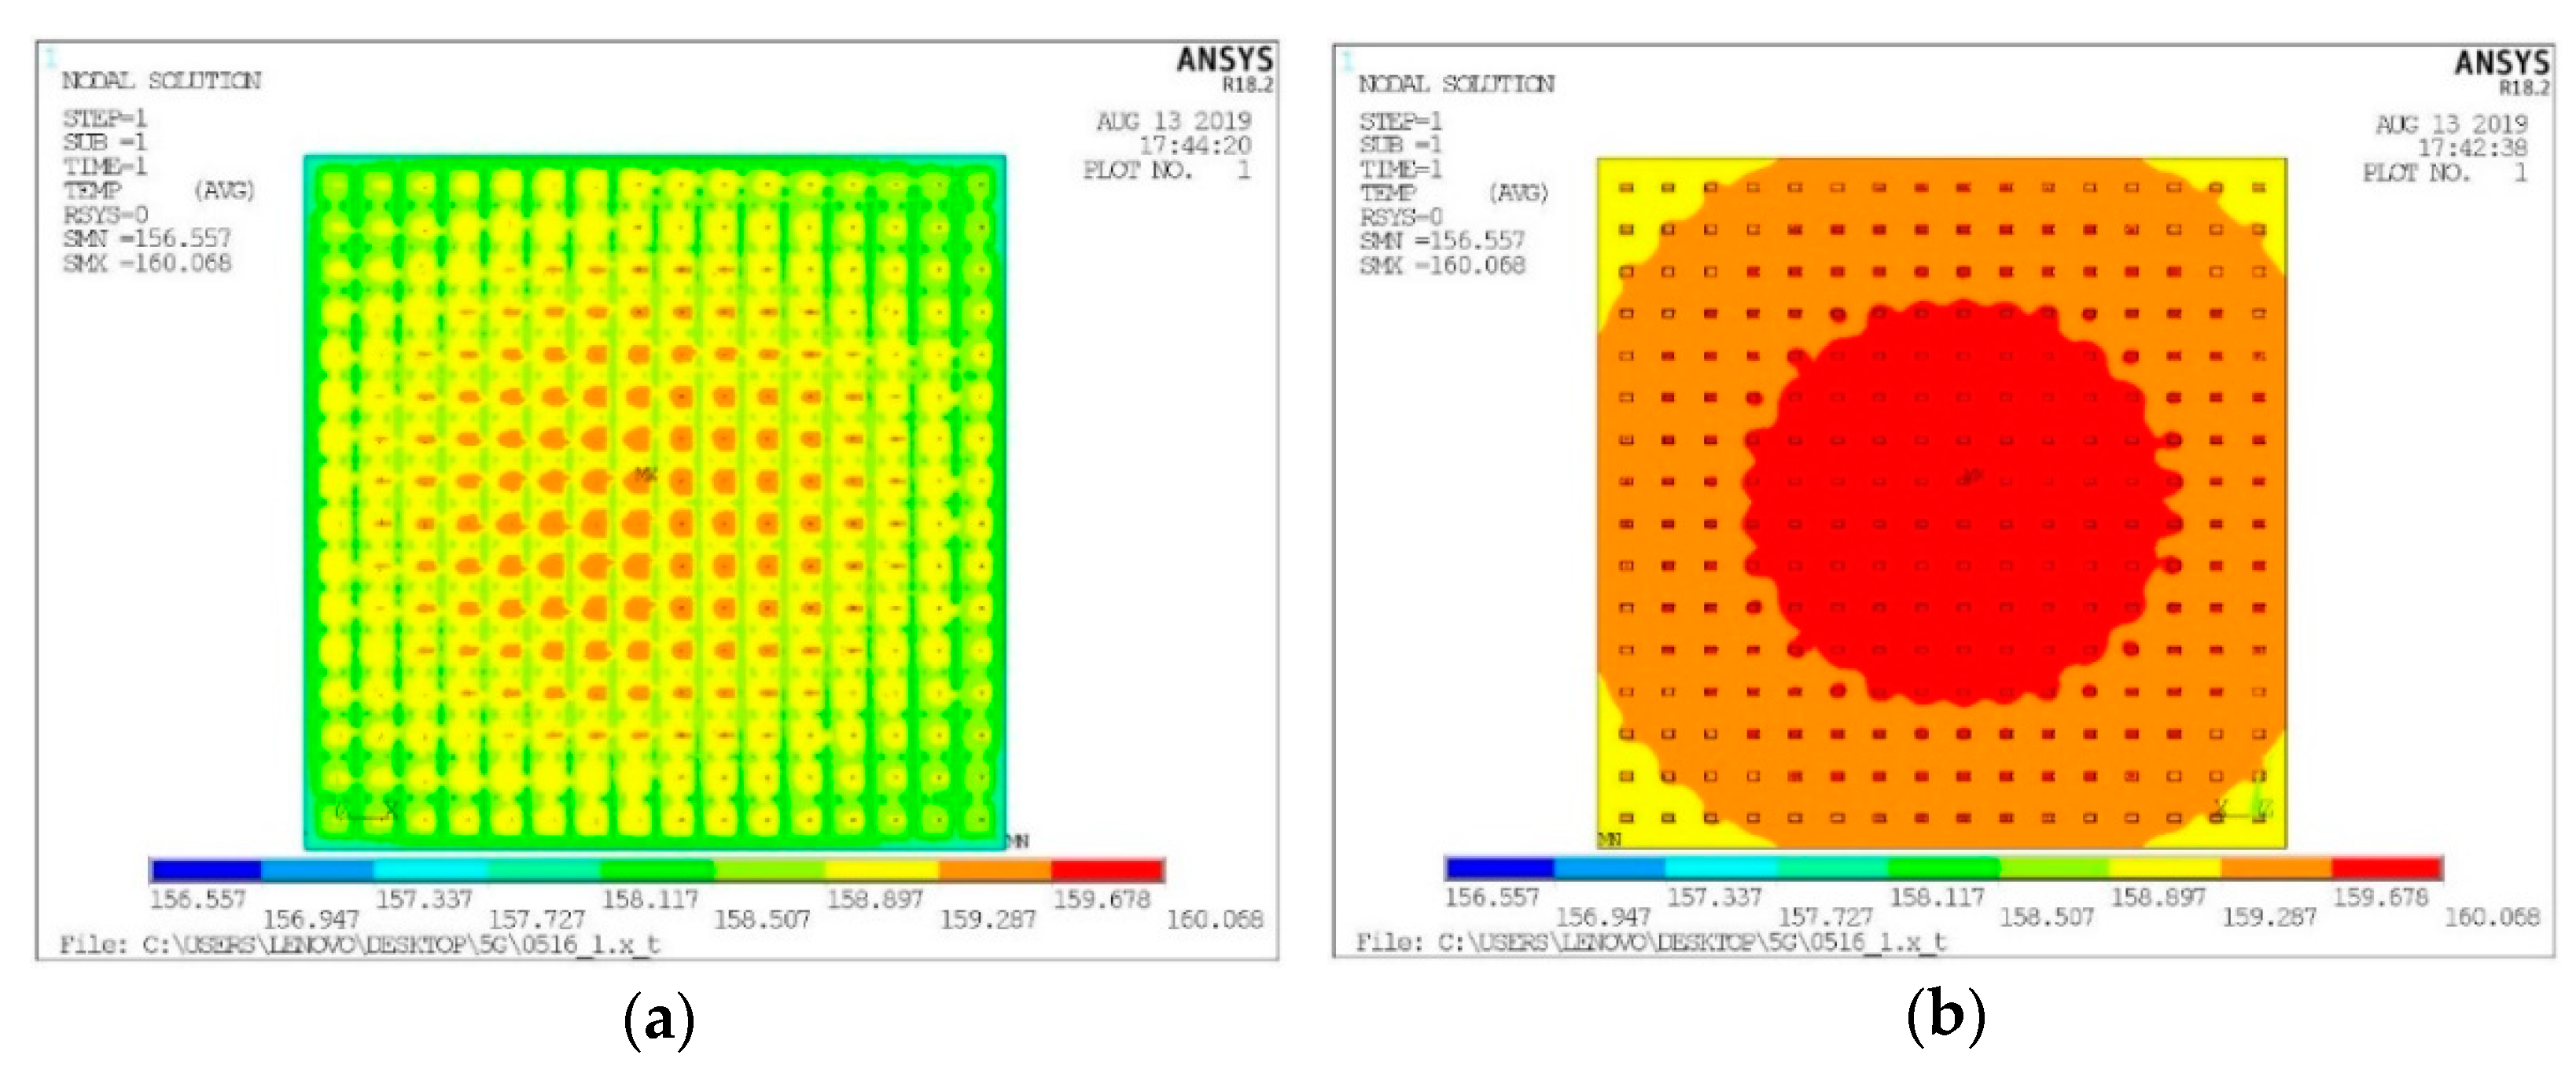
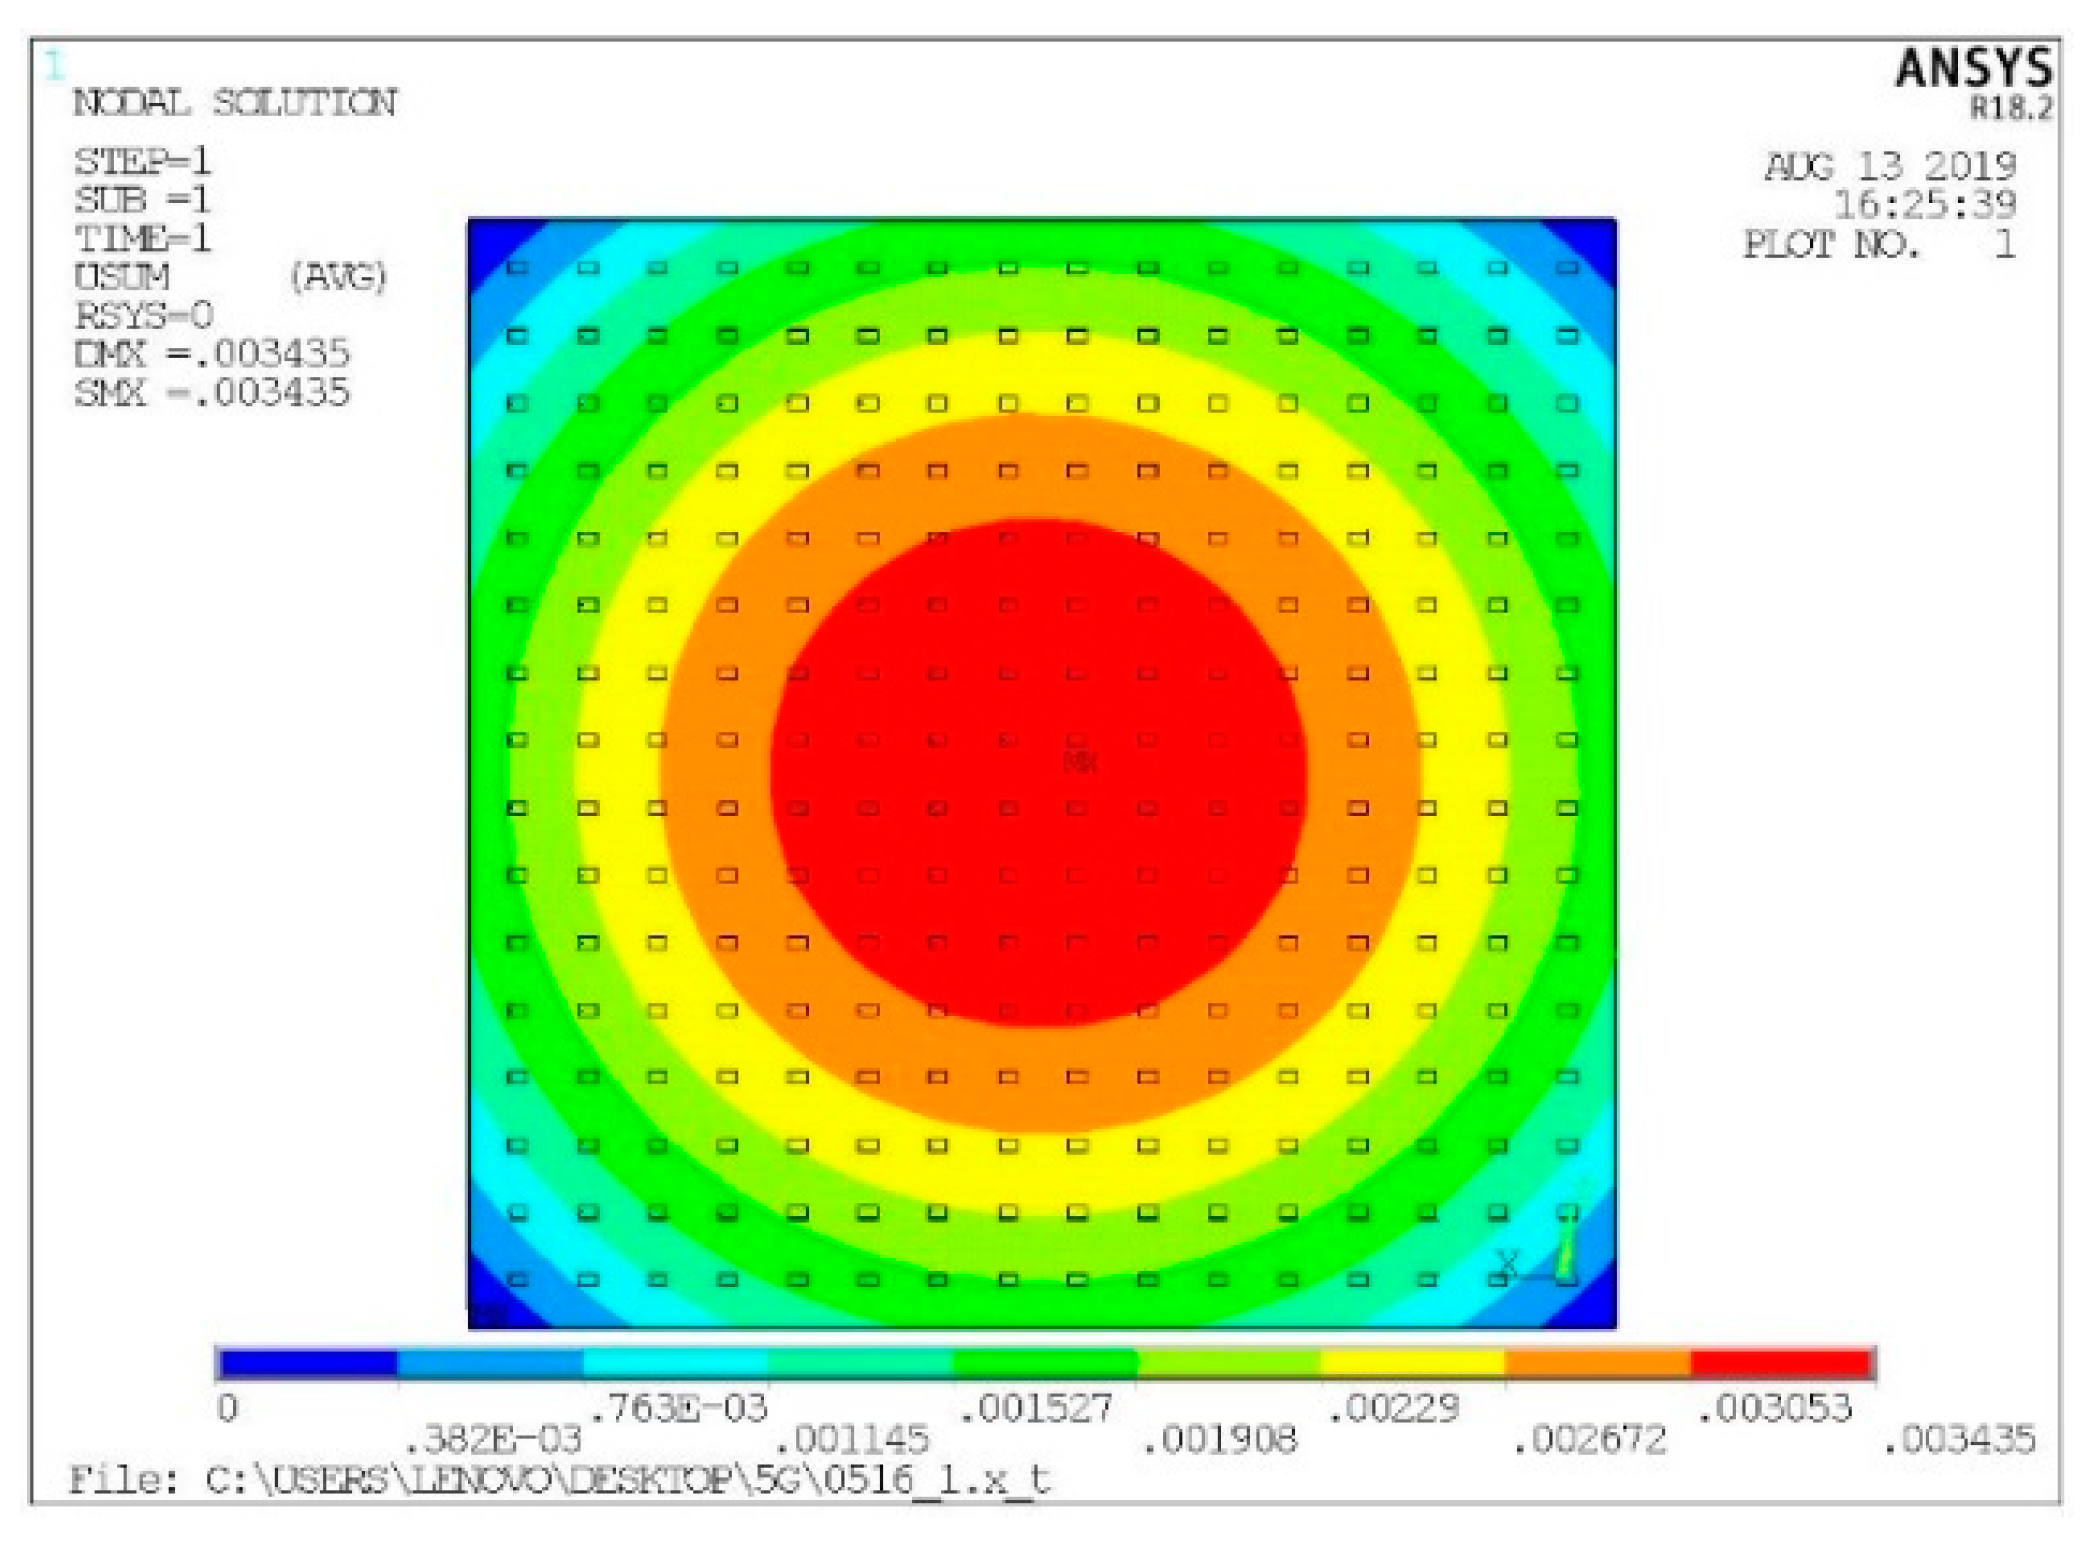
3.1. Analysis and Discussion of Electromechanical Coupling Model of Channel Capacity

A 5G/6G array antenna model of the communication base station was built with 256 array elements, where the rectangular microstrip patch antenna is used as the element, and the interval between each element is λ / 2 . The frequency of the antenna is 28 GHz. The structural parameters of the array element are shown in Table 1, where the structural parameters of the array element have been optimized at the specified frequency 28 GHz.
The base station ambient temperature is 25 ℃. The thermal power dissipation of a RF chip on the antenna array is 40mW, and the convective heat transfer coefficient of the array antenna is 1.2 W/(m2·K). In addition, according to the working conditions of the base station, the four corners of the antenna array are fully constrained, and the thermal simulation is conducted in ANSYS. The temperature fields of the base station array antenna are shown in Figure 2.
It can be seen that the temperature of the front and back of the array antenna gradually decreases from the center to the surroundings in the temperature field distribution and is vertically and horizontally symmetrical. The overall maximum temperature is at the center of the surface of the RF device. Only linear strain exists during thermal expansion while the shear strain is zero. Hence, thermal deformation can be regarded as the node displacement caused by temperature loads. The temperature field distribution of the array is then used as the load of the structural displacement field analysis to obtain the thermal deformation. Meanwhile, the interpolation algorithm is used to add temperature data to the grid nodes meshed by ANSYS. The ANSYS simulation results of the thermal deformation of the array antenna structure are shown in Figure 3. The deformation of the entire surface is approximately symmetrical about the center, which is consistent with the distribution of the thermal deformation caused by the symmetric temperature distribution. The maximum displacement occurs in the z -axial direction at the central area of the surface, and the maximum position offset is 3.435 mm.
By extracting the node displacement of the finite element model of the base station array antenna after deformation, the surface fitting is performed in MATLAB, and the surface fitting equation can be expressed as
f ( x , y ) = 3.426 0.004323 x 0.004586 y 0.001003 x 2 + 4 . 894 e - 06 x y 0.001034 y 2
According to the electromechanical-thermal coupling model of the base station phased array antenna, the EM performances of the base station antenna before and after thermal deformation are calculated using MATLAB. All of the elements have the same amplitude and phase (when the antenna works in an unscanned state). The E-plane ( ϕ = 0 ° ) and H-plane ( ϕ = 90 ° ) power pattern of the base station array antennas, before and after the thermal deformation during EM performance, are shown in Figure 4. The main EM performance parameters of the base station antenna are shown in Table 2.
It can be learned from Figure 4 and Table 2 that:
  • The gain of the base station array antenna decreases because of the thermal deformation, and the gain loss can reach 0.94 dB.
  • The uplift amount of SLL shows a trend of increasing from the far field to the near field in both E-plane ( ϕ = 0 ) and H-plane ( ϕ = 90 ), reaching a maximum of 1.36 dB.
  • The maximum direction of the base station array antenna on the E-plane and H-plane has an offset of 0.02° and 0.03°, respectively. The reason is that the thermal deformation of the array antenna is approximately symmetrical.
To further evaluate the change in the channel capacity, the SNR of the base station antenna system is set to 30 dB under the ideal working situation. The ratio of SNR (Equation (22)) before and after deformation can be obtained by combining Equation (6) and Equation (7). Meanwhile, the ratio of channel capacity (Equation (23)) before and after deformation can be obtained from Equation (6). Then, the ratio of SNR and the channel capacity before and after structural deformation and feed error are 80.52 % and 93.92 %, respectively. The channel capacity value is rounded to 3 Gbps under the ideal working situation, for the convenience of subsequent calculations. Thus, the peak rate of the channel is lost by approximately 3 × 1024 × (1 − 93.92%)=186.8 Mbps when the EM performance of the base station array antenna is degraded.
S N R d e f o r m e d S N R i d e a l = G T , B S , d e f o r m e d F T , B S , d e f o r m e d 2 ( θ , ϕ ) G T , B S , i d e a l F T , B S , i d e a l 2 ( θ , ϕ )
C d e f o r m e d C i d e a l = B · l o g 2 ( 1 + S N R d e f o r m e d ) B · l o g 2 ( 1 + S N R i d e a l )

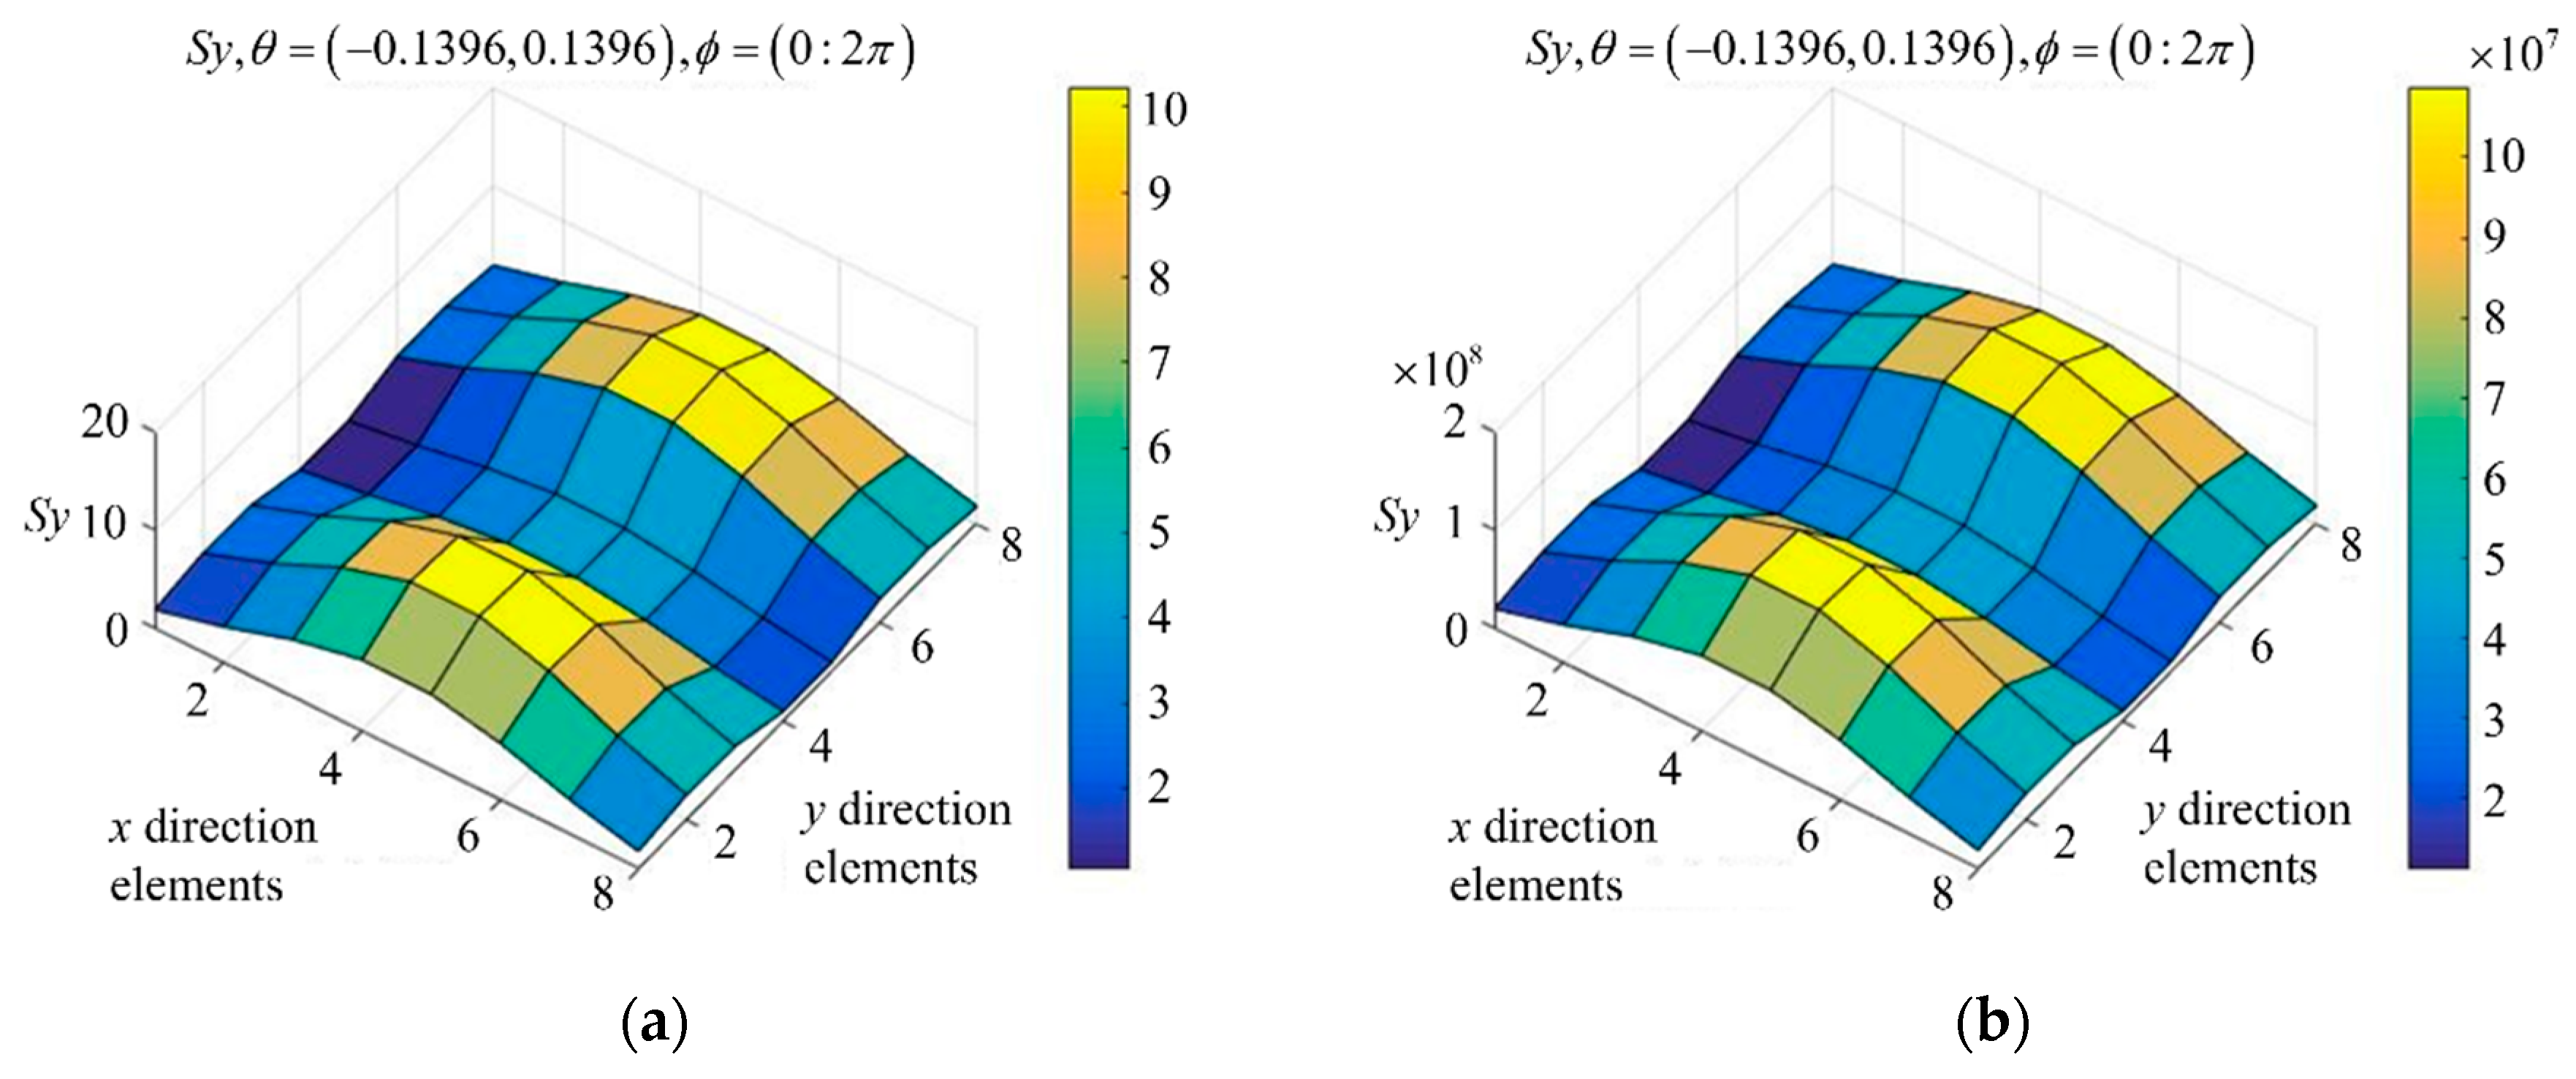
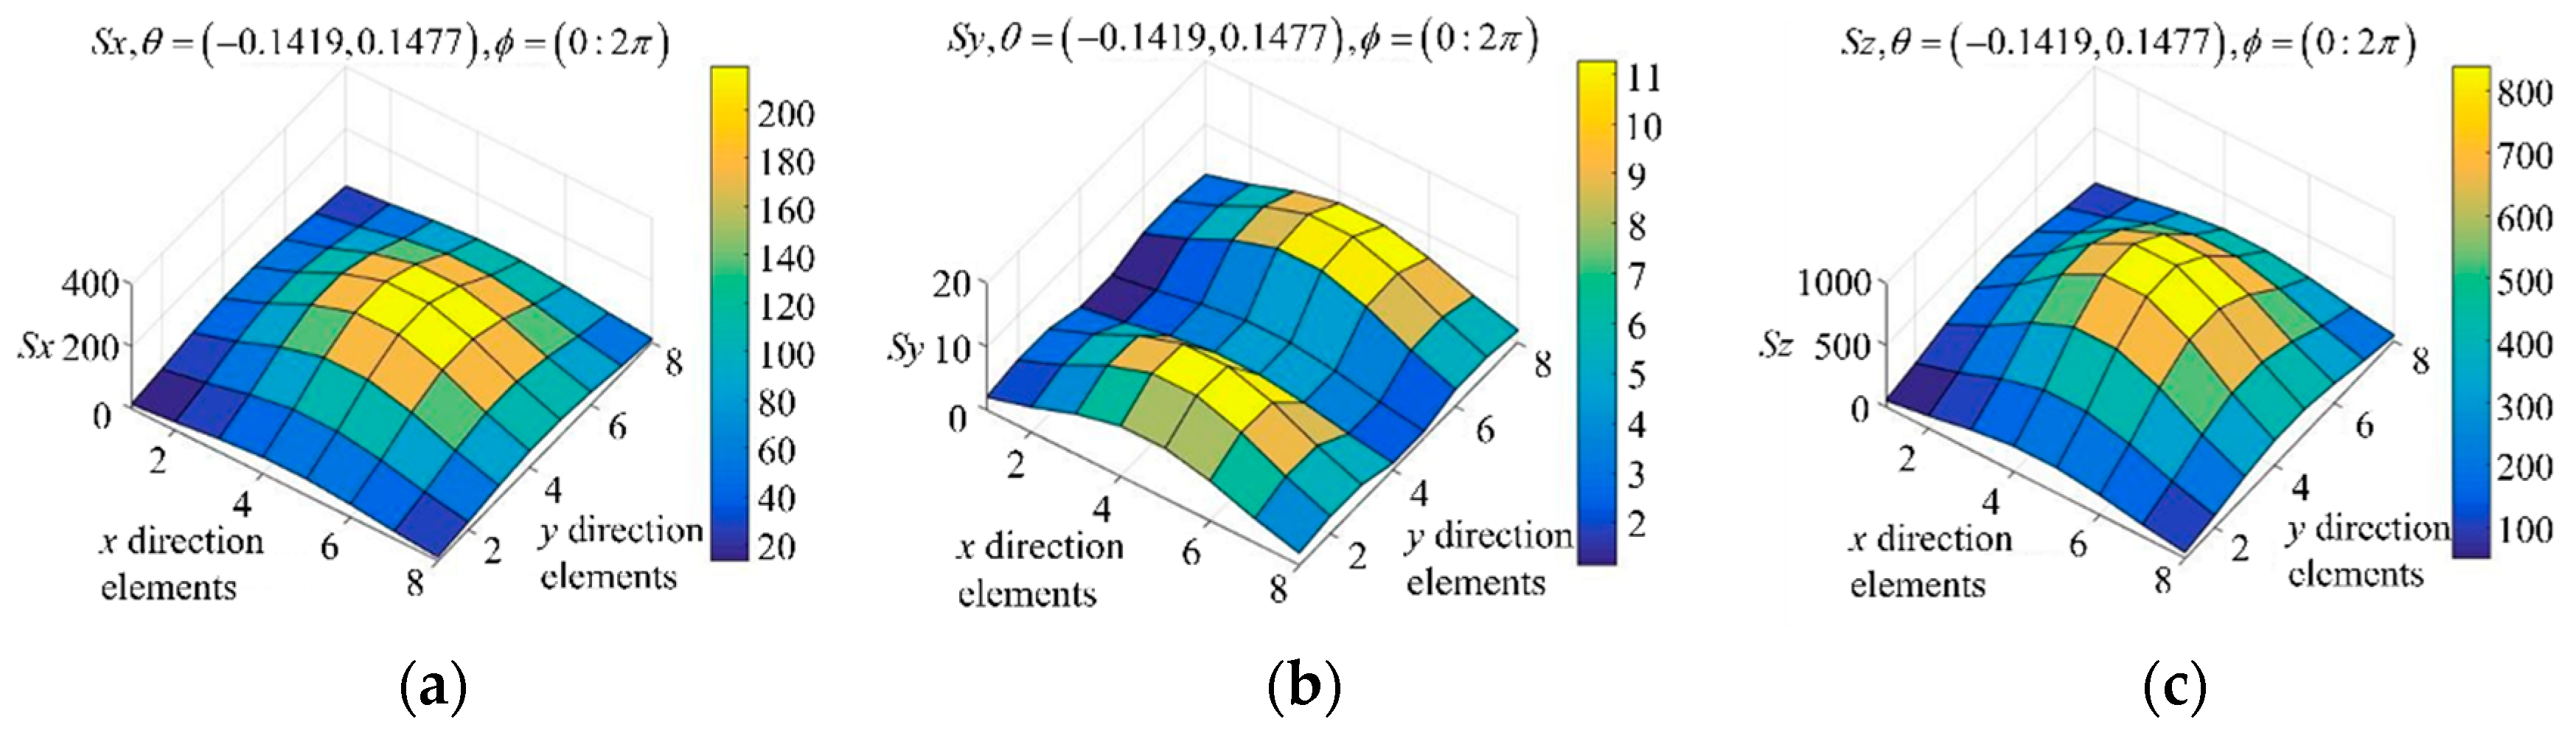
3.2. Analysis and Discussion of Sensitivity Model of Array Element Position

The 5G/6G base station phased array antenna model mentioned above is used as an example, and the excitation amplitude obeys Taylor’s weighted distribution. The main-lobe area of the far field pattern is selected as θ ( 0.1396 , 0.1396 ) and ϕ ( 0 , 2 π ) , respectively. The sensitivity numerical distribution of the array factor electric field strength and channel capacity to the random position error of the antenna elements can be obtained, as shown in Figure 5, Figure 6 and Figure 7.
It can be determined from Figure 5, Figure 6 and Figure 7 that:
  • The sensitivity of the electric field strength of the array factor and channel capacity to the random position error in the z-axis direction is much greater than the sensitivity in the x- and y-axis directions, indicating that the tolerance design of the array elements in the z-axis direction should be more strictly controlled during manufacturing and installation.
  • The random position error in the x- and y-axis directions has approximately the same effect on these two technical indicators and the influence on the sensitivity distribution is similar (rotating by almost 90°) and having a certain periodicity along the x- and y-axes, respectively.
  • From the sensitivity of the random position error in the z-axis direction, it can be seen that the sensitivity value shows a decreasing trend from the central to the edge area, indicating that the tolerance design of the central area of the array in the z-axis direction should be stricter than the edge area.
  • For the random position error in the same direction, although the sensitivity distribution of the electric field strength is similar to that of channel capacity, the magnitude of the latter is far above the former, indicating that the influence of the same random position error on the channel capacity is much greater than the influence on the array electric field strength.
In the process of beam matching between the transmitting beam of the actual base station antenna and the receiving beam of the user-end, the most optimal beam direction of the user-end is likely not the direction (0°,0°) of the transmitting beam. Therefore, it is necessary to further analyze the sensitivity of the communication performance indicators to the random position error in x , y , z directions under the situation where the beam is in scanning state. The base station is usually sectored into multiple parts. In the 5G era, a single macro base station usually has 6 sectors, which is superior to the traditional 3-sector honeycomb structure, for it allows the communication system to make full use of spatial multiplexing technology to provide additional system service capacity. It is assumed that the base station is a 6-sector antenna structure. The sensitivity of the array factor electric field strength to the random position error of the array element in the x , y , and z directions in the ϕ = 0 plane and ϕ = 90 plane when the base station antenna pattern scans θ ( 30 , 30 ) are shown in Figure 8, Figure 9, Figure 10 and Figure 11. In addition, it can be seen from Figure 5, Figure 6 and Figure 7 that the sensitivity distribution of the channel capacity and electric field strength to the random position error are similar. Therefore, only the electric field strength of the array factor is selected for analysis.
It can be learned from Figure 8, Figure 9, Figure 10 and Figure 11 that:
  • The sensitivity of the electric field strength of the array factor and channel capacity to the random position error in the z-axis direction is much greater than the sensitivity in the x- and y-axis directions, indicating that the tolerance design of the array elements in the z-axis direction should be more strictly controlled during manufacturing and installation.
  • The random position error in the x- and y-axis directions has approximately the same effect on these two technical indicators and the influence on the sensitivity distribution is similar (rotating by almost 90°) and having a certain periodicity along the x- and y-axes, respectively.
  • With an increase in the scanning angle, the sensitivity value in the z-direction does not exhibit an obvious change but still increases gradually.
  • With the increasing of the scanning angle, the sensitivity value in the z-direction does not have an obvious change, but still increases gradually.
In summary, from the simulation of the influence of thermal deformation on the electric field strength and channel capacity and the simulation of the sensitivity of these two technical indicators to the random error of elements, it can be demonstrated that:
  • The EM performance of the base station array antenna will degrade when the antenna structure undergoes thermal deformation and feed error, thereby causing a loss in the channel capacity of the communication system to a certain degree.
  • The random error of the element position has a significant influence on the performance of the 5G/6G communication system. The sensitivity of the two technical indicators of electric field strength and channel capacity are different from the random error of the element position. The channel capacity is much more sensitive to random errors.
  • When the beam is in the scanning state, as the scanning angle increases, the sensitivity of the channel capacity and the electric field strength to the random error of the element position in all three directions increases gradually.

4. Conclusions

Owing to the evolution directions of activeness, integration, and miniaturization of the base station phased array antenna system, electromechanical–thermal coupling is gradually becoming a major challenge in the process of commercializing 5G/6G communications. Therefore, this paper effectively coordinates the coupling relationship between the design of various disciplines from the viewpoint of electromechanical coupling and interdisciplinarity, taking into consideration the complex working environment of base stations. The relationship between the field coupling of the structural displacement field, temperature field, and electromagnetic field of the 5G/6G base station phased array antenna is studied, and the sensitivity distribution characteristics of the channel capacity of the antenna electric field strength against element position under different working circumstances are quantitatively evaluated. The work done in this paper could provide a theoretical basis for electromechanical coupling design and control technology to promote the commercialization and development of high-quality communication systems for the next generation.

Author Contributions

Conceptualization, Y.Y., Y.W. (Yan Wang) and C.W.; methodology, Y.Y., Y.W. (Yan Wang) and C.W.; software, Y.Y. and B.H.; validation, Y.Y. and X.H.; formal analysis, B.H. and P.L.; investigation, Z.W., K.Y., M.W. and G.L.; data curation, Y.W. (Yang Wu); writing—original draft preparation, Y.Y. and X.H.; writing—review and editing, Y.Y., Y.W. and B.H.; supervision, Z.W. and Y.W. (Yang Wu); project administration, Y.W. (Yan Wang) and C.W.; funding acquisition, Y.W. (Yan Wang) and C.W. All authors have read and agreed to the published version of the manuscript.

Funding

This research was funded by National Natural Science Foundation of China under grant number 51975447 and 52105272, the National Defense Basic Scientific Research Program of China under grant number JCKY2021210B007, the Scientific Research Program Funded by Shaanxi Provincial Education Department under No. 21JK0721, and Youth Innovation Team of Shaanxi Universities under No. 201926.

Institutional Review Board Statement

Not applicable.

Informed Consent Statement

Not applicable.

Data Availability Statement

Not applicable.

Conflicts of Interest

Authors declare no conflict of interest.

References

  1. Iqbal, A.; Smida, A.; Abdulrazak, L.F.; Saraereh, O.A.; Mallat, N.K.; Elfergani, I.; Kim, S. Low-Profile Frequency Reconfigurable Antenna for Heterogeneous Wireless Systems. Electronics 2019, 8, 976. [Google Scholar] [CrossRef]
  2. Wang, F.; Duan, Z.; Wang, X.; Zhou, Q.; Gong, Y. High Isolation Millimeter-Wave Wideband MIMO Antenna for 5G Communication. Int. J. Antennas Propag. 2019, 2019, 4283010. [Google Scholar] [CrossRef]
  3. Yang, X.; Matthaiou, M.; Yang, J.; Wen, C.-K.; Gao, F.; Jin, S. Hardware-Constrained Millimeter-Wave Systems for 5G: Challenges, Opportunities, and Solutions. IEEE Commun. Mag. 2019, 57, 44–50. [Google Scholar] [CrossRef]
  4. Ur-Rehman, M.; Abbasi, Q.H.; Rahman, A.; Khan, I.; Chattha, H.T.; Matin, M.A. Millimetre-Wave Antennas and Systems for the Future 5G. Int. J. Antennas Propag. 2017, 2017, 6135601. [Google Scholar] [CrossRef]
  5. Agiwal, M.; Roy, A.; Saxena, N. Next Generation 5G Wireless Networks: A Comprehensive Survey. IEEE Commun. Surv. Tut. 2016, 18, 1617–1655. [Google Scholar] [CrossRef]
  6. Neog, P.; Bera, R. Multi-standard radio for 2G to 5G. In Proceedings of the 2017 2nd International Conference on Telecommunication and Networks (TEL-NET), Noida, India, 10–11 August 2017; pp. 1–5. [Google Scholar] [CrossRef]
  7. Ali, H.; Ren, X.-C.; Bari, I.; Bashir, M.A.; Hashmi, A.M.; Khan, M.A.; Majid, S.I.; Jan, N.; Tareen, W.U.K.; Anjum, M.R. Four-Port MIMO Antenna System for 5G N79 Band RF Devices. Electronics 2021, 11, 35. [Google Scholar] [CrossRef]
  8. Roh, W.; Seol, J.-Y.; Park, J.; Lee, B.; Lee, J.; Kim, Y.; Cho, J.; Cheun, K.; Aryanfar, F. Millimeter-Wave Beamforming as an Enabling Technology for 5G Cellular Communications: Theoretical Feasibility and Prototype Results. IEEE Commun. Mag. 2014, 52, 106–113. [Google Scholar] [CrossRef]
  9. Smolders, A.B.; Dubok, A.; Tessema, N.M.; Chen, Z.; Al Rawi, A.; Johannsen, U.; Bressner, T.; Milosevic, D.; Gao, H.; Tangdiongga, E. Building 5G Millimeter-Wave Wireless Infrastructure: Wide-Scan Focal-Plane Arrays with Broadband Optical Beamforming. IEEE Antennas Propag. Mag. 2019, 61, 53–62. [Google Scholar] [CrossRef]
  10. Khan, J.; Ullah, S.; Tahir, F.A.; Tubbal, F.; Raad, R. A Sub-6 GHz MIMO Antenna Array for 5G Wireless Terminals. Electronics 2021, 10, 3062. [Google Scholar] [CrossRef]
  11. Kim, K.J.; Choi, K.J.; Lee, S.R.; Kim, K.S. Multi-User Massive MIMO for next-Generation WLAN Systems. Electron. Lett. 2015, 51, 792–794. [Google Scholar] [CrossRef]
  12. Ojaroudi Parchin, N.; Jahanbakhsh Basherlou, H.; Alibakhshikenari, M.; Ojaroudi Parchin, Y.; Al-Yasir, Y.I.; Abd-Alhameed, R.A.; Limiti, E. Mobile-Phone Antenna Array with Diamond-Ring Slot Elements for 5G Massive MIMO Systems. Electronics 2019, 8, 521. [Google Scholar] [CrossRef]
  13. Oliveri, G.; Gottardi, G.; Massa, A. A New Meta-Paradigm for the Synthesis of Antenna Arrays for Future Wireless Communications. IEEE Trans. Antennas Propag. 2019, 67, 3774–3788. [Google Scholar] [CrossRef]
  14. Andrews, J.G.; Buzzi, S.; Choi, W.; Hanly, S.V.; Lozano, A.; Soong, A.C.; Zhang, J.C. What Will 5G Be? IEEE J. Sel. Areas Commun. 2014, 32, 1065–1082. [Google Scholar] [CrossRef]
  15. Chen, Y.; Jian, R.; Ma, S.; Mohadeskasaei, S.A. A Research for Millimeter Wave Patch Antenna and Array Synthesis. In Proceedings of the 26th Wireless and Optical Communication Conference (WOCC), Newark, NJ, USA, 7–8 April 2017; pp. 1–5. [Google Scholar] [CrossRef]
  16. Przesmycki, R.; Bugaj, M.; Nowosielski, L. Broadband Microstrip Antenna for 5G Wireless Systems Operating at 28 GHz. Electronics 2020, 10, 1. [Google Scholar] [CrossRef]
  17. Anselmi, N.; Rocca, P.; Feuchtinger, S.; Biscontini, B.; Barrera, A.M.; Massa, A. Optimal Capacity-Driven Design of Aperiodic Clustered Phased Arrays for Multi-User MIMO Communication Systems. IEEE Trans. Antennas Propag. 2022. [Google Scholar] [CrossRef]
  18. Comisso, M.; Palese, G.; Babich, F.; Vatta, F.; Buttazzoni, G. 3D Multi-Beam and Null Synthesis by Phase-Only Control for 5G Antenna Arrays. Electronics 2019, 8, 656. [Google Scholar] [CrossRef]
  19. Rocca, P.; Anselmi, N.; Benoni, A.; Massa, A. Probabilistic Interval Analysis for the Analytic Prediction of the Pattern Tolerance Distribution in Linear Phased Arrays with Random Excitation Errors. IEEE Trans. Antennas Propag. 2020, 68, 7866–7878. [Google Scholar] [CrossRef]
  20. Crișan, N.; Cremene, L.C. Rewriting MIMO Channel Capacity for Antenna Configuration Comparison. Carpathian J. Electron. Comput. Eng. 2015, 8, 31–34. [Google Scholar]
  21. Ando, N.; Fujimoto, M. Effect of Directivity of On-Vehicle Antenna on Spread and Channel Capacity. In Proceedings of the International Symposium on Antennas and Propagation (ISAP), Busan, Korea, 23–26 October 2018; pp. 1–2. [Google Scholar]
  22. Wang, C.S.; Duan, B.Y.; Zhang, F.S.; Zhu, M.B. Coupled Structural-Electromagnetic-Thermal Modelling and Analysis of Active Phased Array Antennas. IET Microw. Antennas Propag. 2010, 4, 247–257. [Google Scholar] [CrossRef]
  23. Wang, C.; Kang, M.; Wang, W.; Duan, B.; Lin, L.; Ping, L. On the Performance of Array Antennas with Mechanical Distortion Errors Considering Element Numbers. Int. J. Electron. 2017, 104, 462–484. [Google Scholar] [CrossRef]
  24. Wang, C.; Wang, Y.; Yang, X.; Gao, W.; Jiang, C.; Wang, L.; Zhang, Y.; Wang, M. Effect of Randomness in Element Position on Performance of Communication Array Antennas in Internet of Things. Wirel. Commun. Mob. Comput. 2018, 2018, 6492143. [Google Scholar] [CrossRef]
  25. Obara, T.; Inoue, Y.; Aoki, Y.; Suyama, S.; Lee, J.; Okumurav, Y. Experiment of 28 GHz Band 5G Super Wideband Transmission Using Beamforming and Beam Tracking in High Mobility Environment. In Proceedings of the 27th Annual International Symposium on Personal, Indoor, and Mobile Radio Communications (PIMRC), Valencia, Spain, 4–8 September 2016; pp. 1–5. [Google Scholar] [CrossRef]
  26. Shannon, C.E. A Mathematical Theory of Communication. Bell Syst. Tech. J. 1948, 27, 379–423. [Google Scholar] [CrossRef]
Figure 1. A 5G/6G base station phased array antenna.
Electronics 11 01857 g001
Figure 2. Temperature field of base station array antenna: (a) Antenna element surface; (b) RF device surface.
Electronics 11 01857 g002
Figure 3. Thermal deformation of base station array antenna.
Electronics 11 01857 g003
Figure 4. Temperature field of base station array antenna: (a) Antenna element surface; (b) RF device surface.
Electronics 11 01857 g004
Figure 5. Sensitivity distribution in the x direction: (a) electric field strength of array factor; (b) channel capacity.
Electronics 11 01857 g005
Figure 6. Sensitivity distribution in the y direction: (a) electric field strength of array factor; (b) channel capacity.
Electronics 11 01857 g006
Figure 7. Sensitivity distribution in the z direction: (a) electric field strength of array factor; (b) channel capacity.
Electronics 11 01857 g007
Figure 8. Sensitivity distribution of random position error in ϕ = 0 plane with scanning angle θ = 15 : (a) x direction; (b) y direction; (c) z direction.
Electronics 11 01857 g008
Figure 9. Sensitivity distribution of random position error in ϕ = 0 plane with scanning angle θ = 30 : (a) x direction; (b) y direction; (c) z direction.
Electronics 11 01857 g009
Figure 10. Sensitivity distribution of random position error in ϕ = 90 plane with scanning angle θ = 15 : (a) x direction; (b) y direction; (c) z direction.
Electronics 11 01857 g010
Figure 11. Sensitivity distribution of random position error in ϕ = 90 plane with scanning angle θ = 30 : (a) x direction; (b) y direction; (c) z direction.
Electronics 11 01857 g011
Table 1. Structural parameters of the array element.
Antenna StructureStructural ParametersVariablesValues (mm)
Microstrip antennaLength L d 3.43
Width W d 3.55
SubstrateThickness h s 0.20
Length L s = 2 L d 6.85
Width W s = 2 W d 7.10
Feeder positionDistance L 1 0.52
Table 2. Parameter variation of base station phased array antenna.
Electrical Performance Parameter ϕ = 0 ° ϕ = 90 °
Ideal
Situation
After
Deformation
Ideal
Situation
After
Deformation
Gain loss/dB0−0.940−0.94
Maximum pointing direction/°00.0200.03
The first SLL on the left/dB−13.28−11.92−13.78−12.53
The first SLL change on the left/dB0+1.360+1.25
The first SLL on the right/dB−13.28−11.92−13.78−12.53
The first SLL change on the right/dB0+1.360+1.25
The second SLL on the left/dB−17.91−17.69−19.42−19.24
The second SLL change on the left/dB0+0.220+0.18
The second SLL on the right/dB−17.91−17.69−19.42−19.24
The second SLL change on the right/dB0+0.220+0.18
The third SLL on the left/dB−20.95−21.06−24.12−24.14
The third SLL change on the left/dB0−0.110−0.02
The third SLL on the right/dB−20.95−21.06−24.12−24.14
The third SLL change on the left/dB0−0.110−0.02
(PS: “+” means increase, and “−” means decrease).
Publisher’s Note: MDPI stays neutral with regard to jurisdictional claims in published maps and institutional affiliations.

