
A Formal Modeling and Verification Scheme with an RNN-Based Attacker for CAN Communication System Authenticity

Abstract
:1. Introduction
2. Design Principle
2.1. Recurrent Neural Network
2.2. Formal Method
3. The Proposed VACB Model
3.1. Modeling of the FMA-RNN
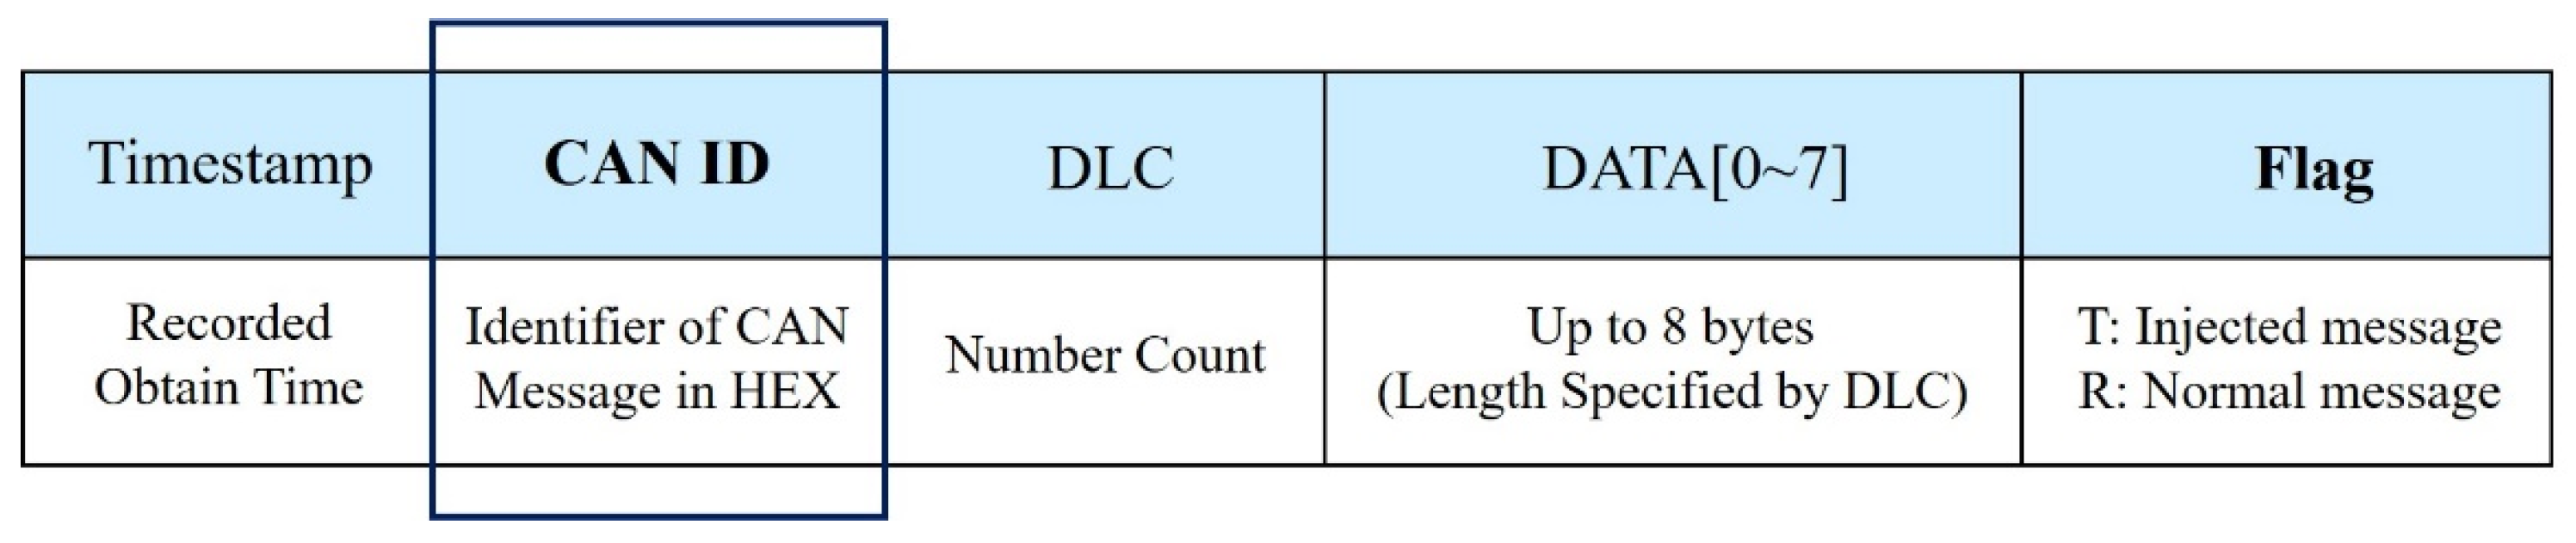
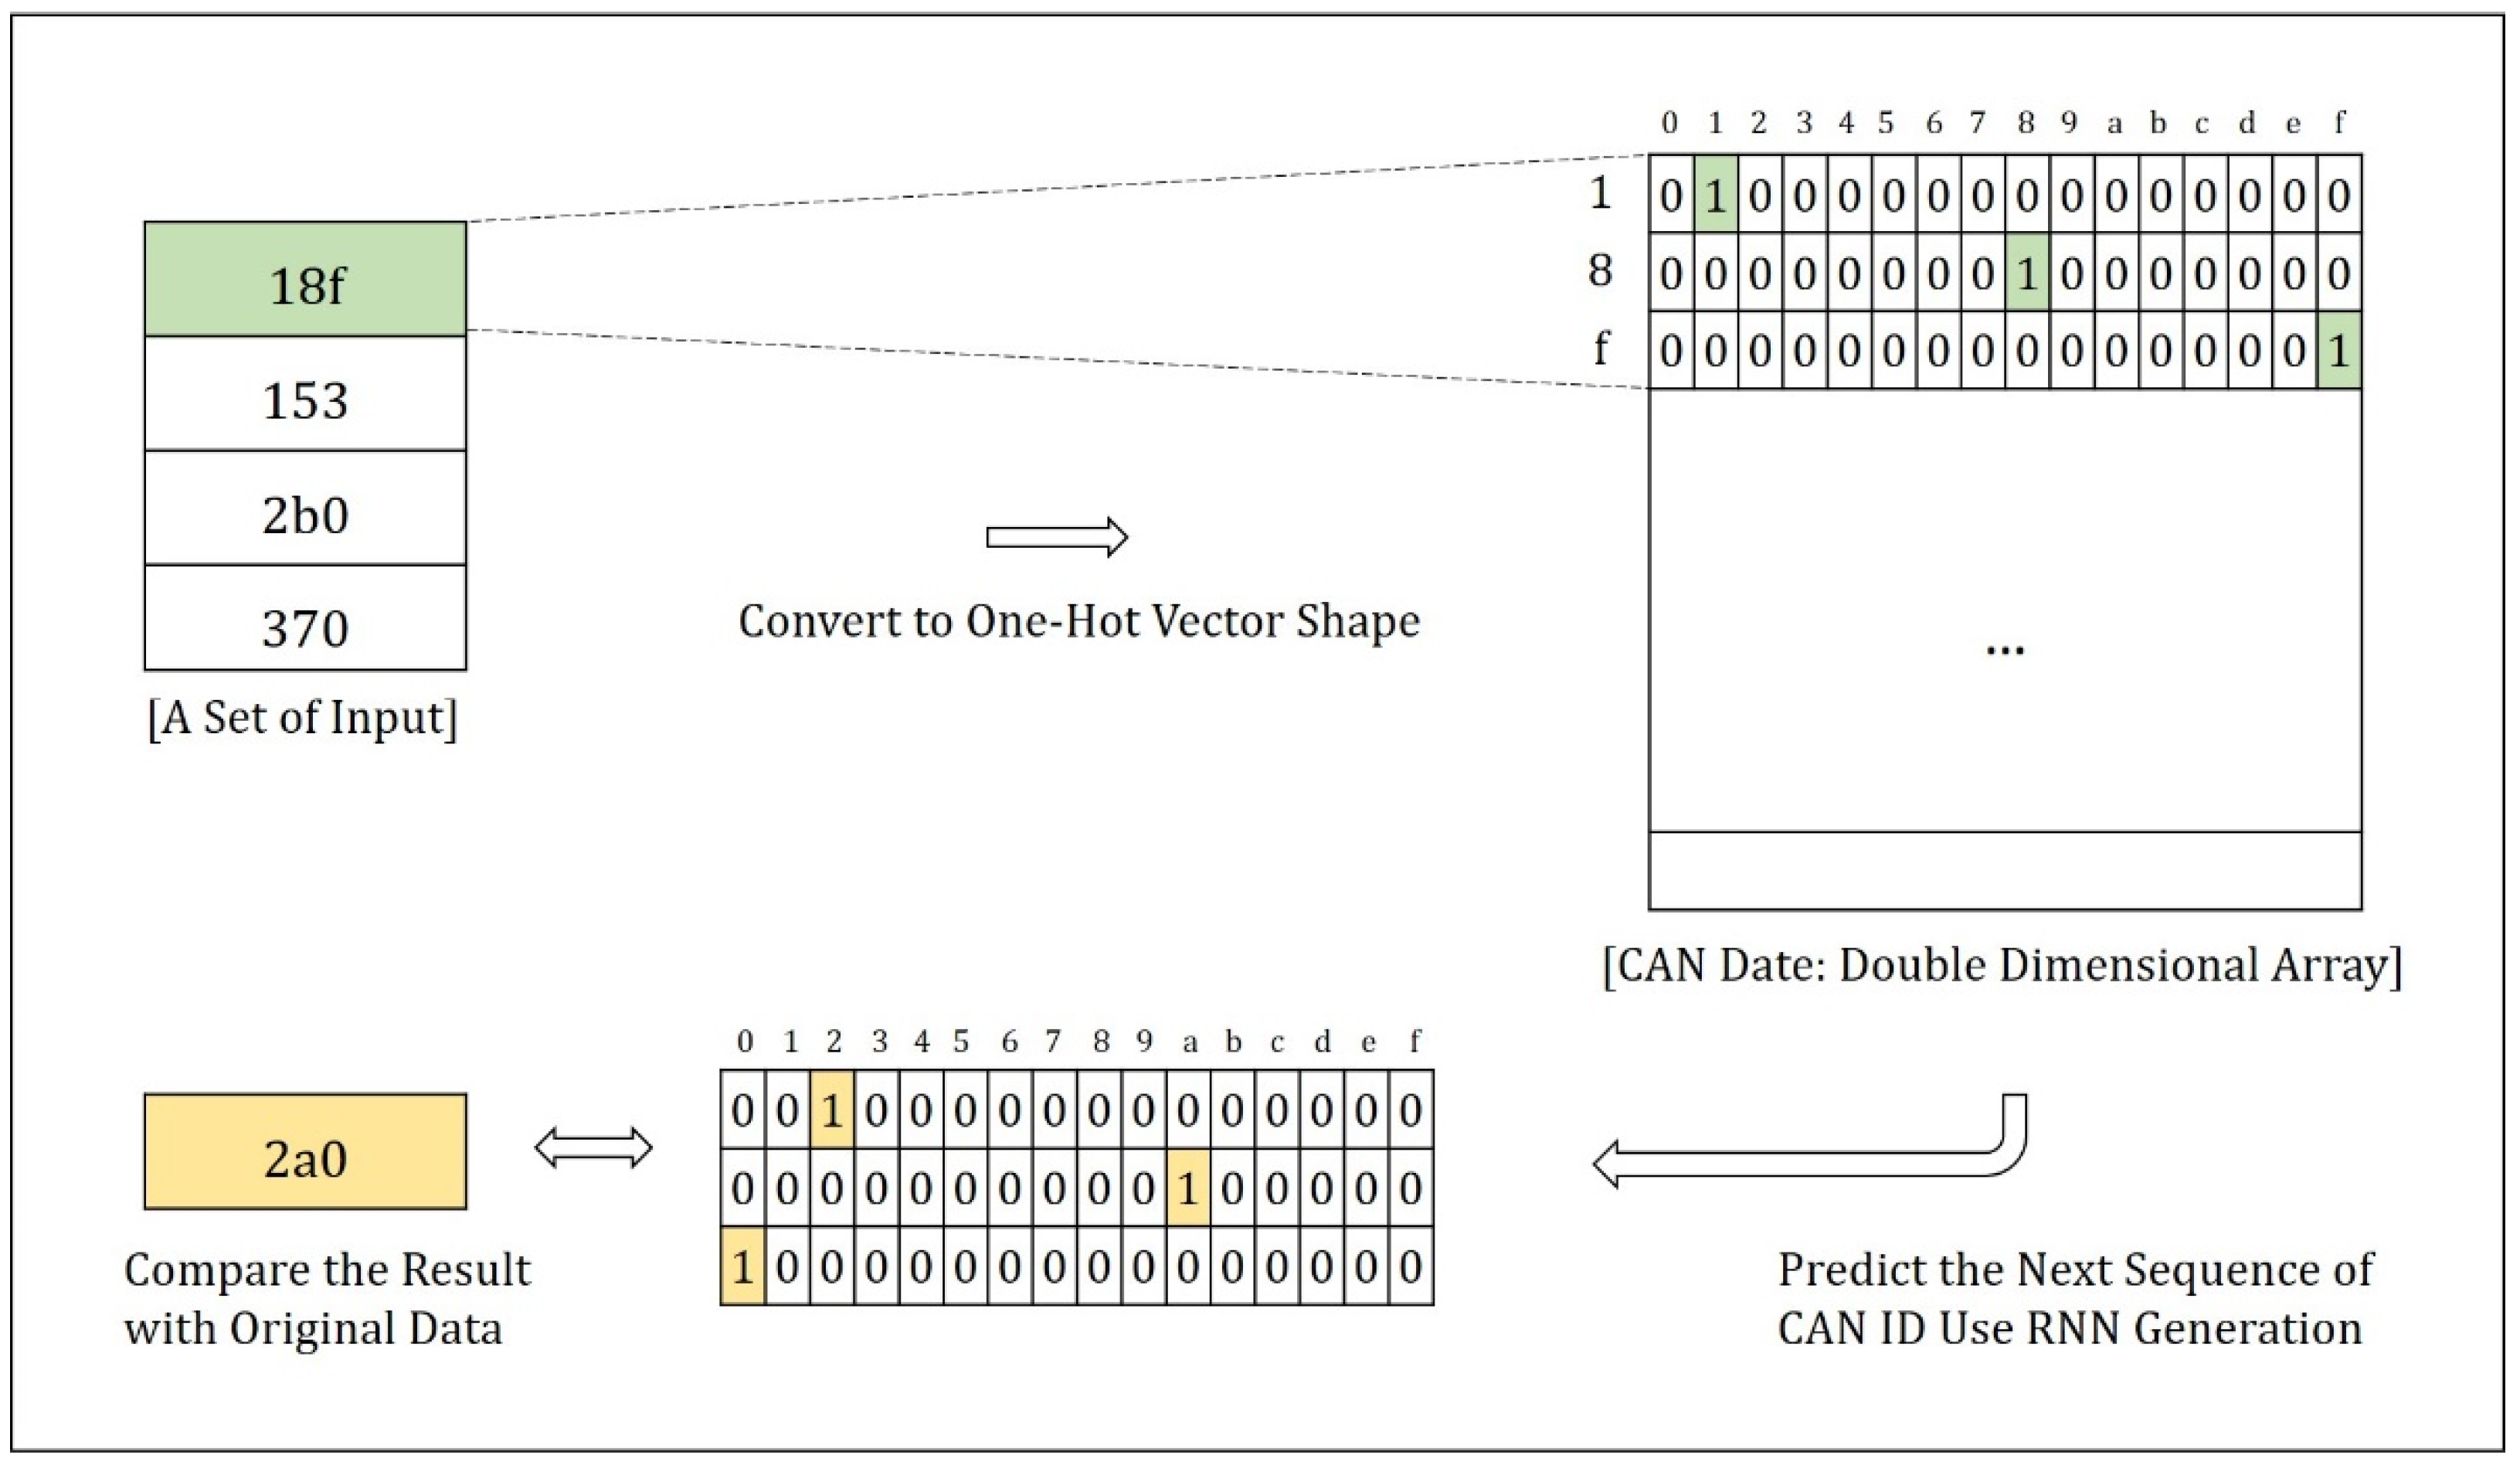
3.1.1. Data Set Preprocessing
3.1.2. Train Strategy of the RNN
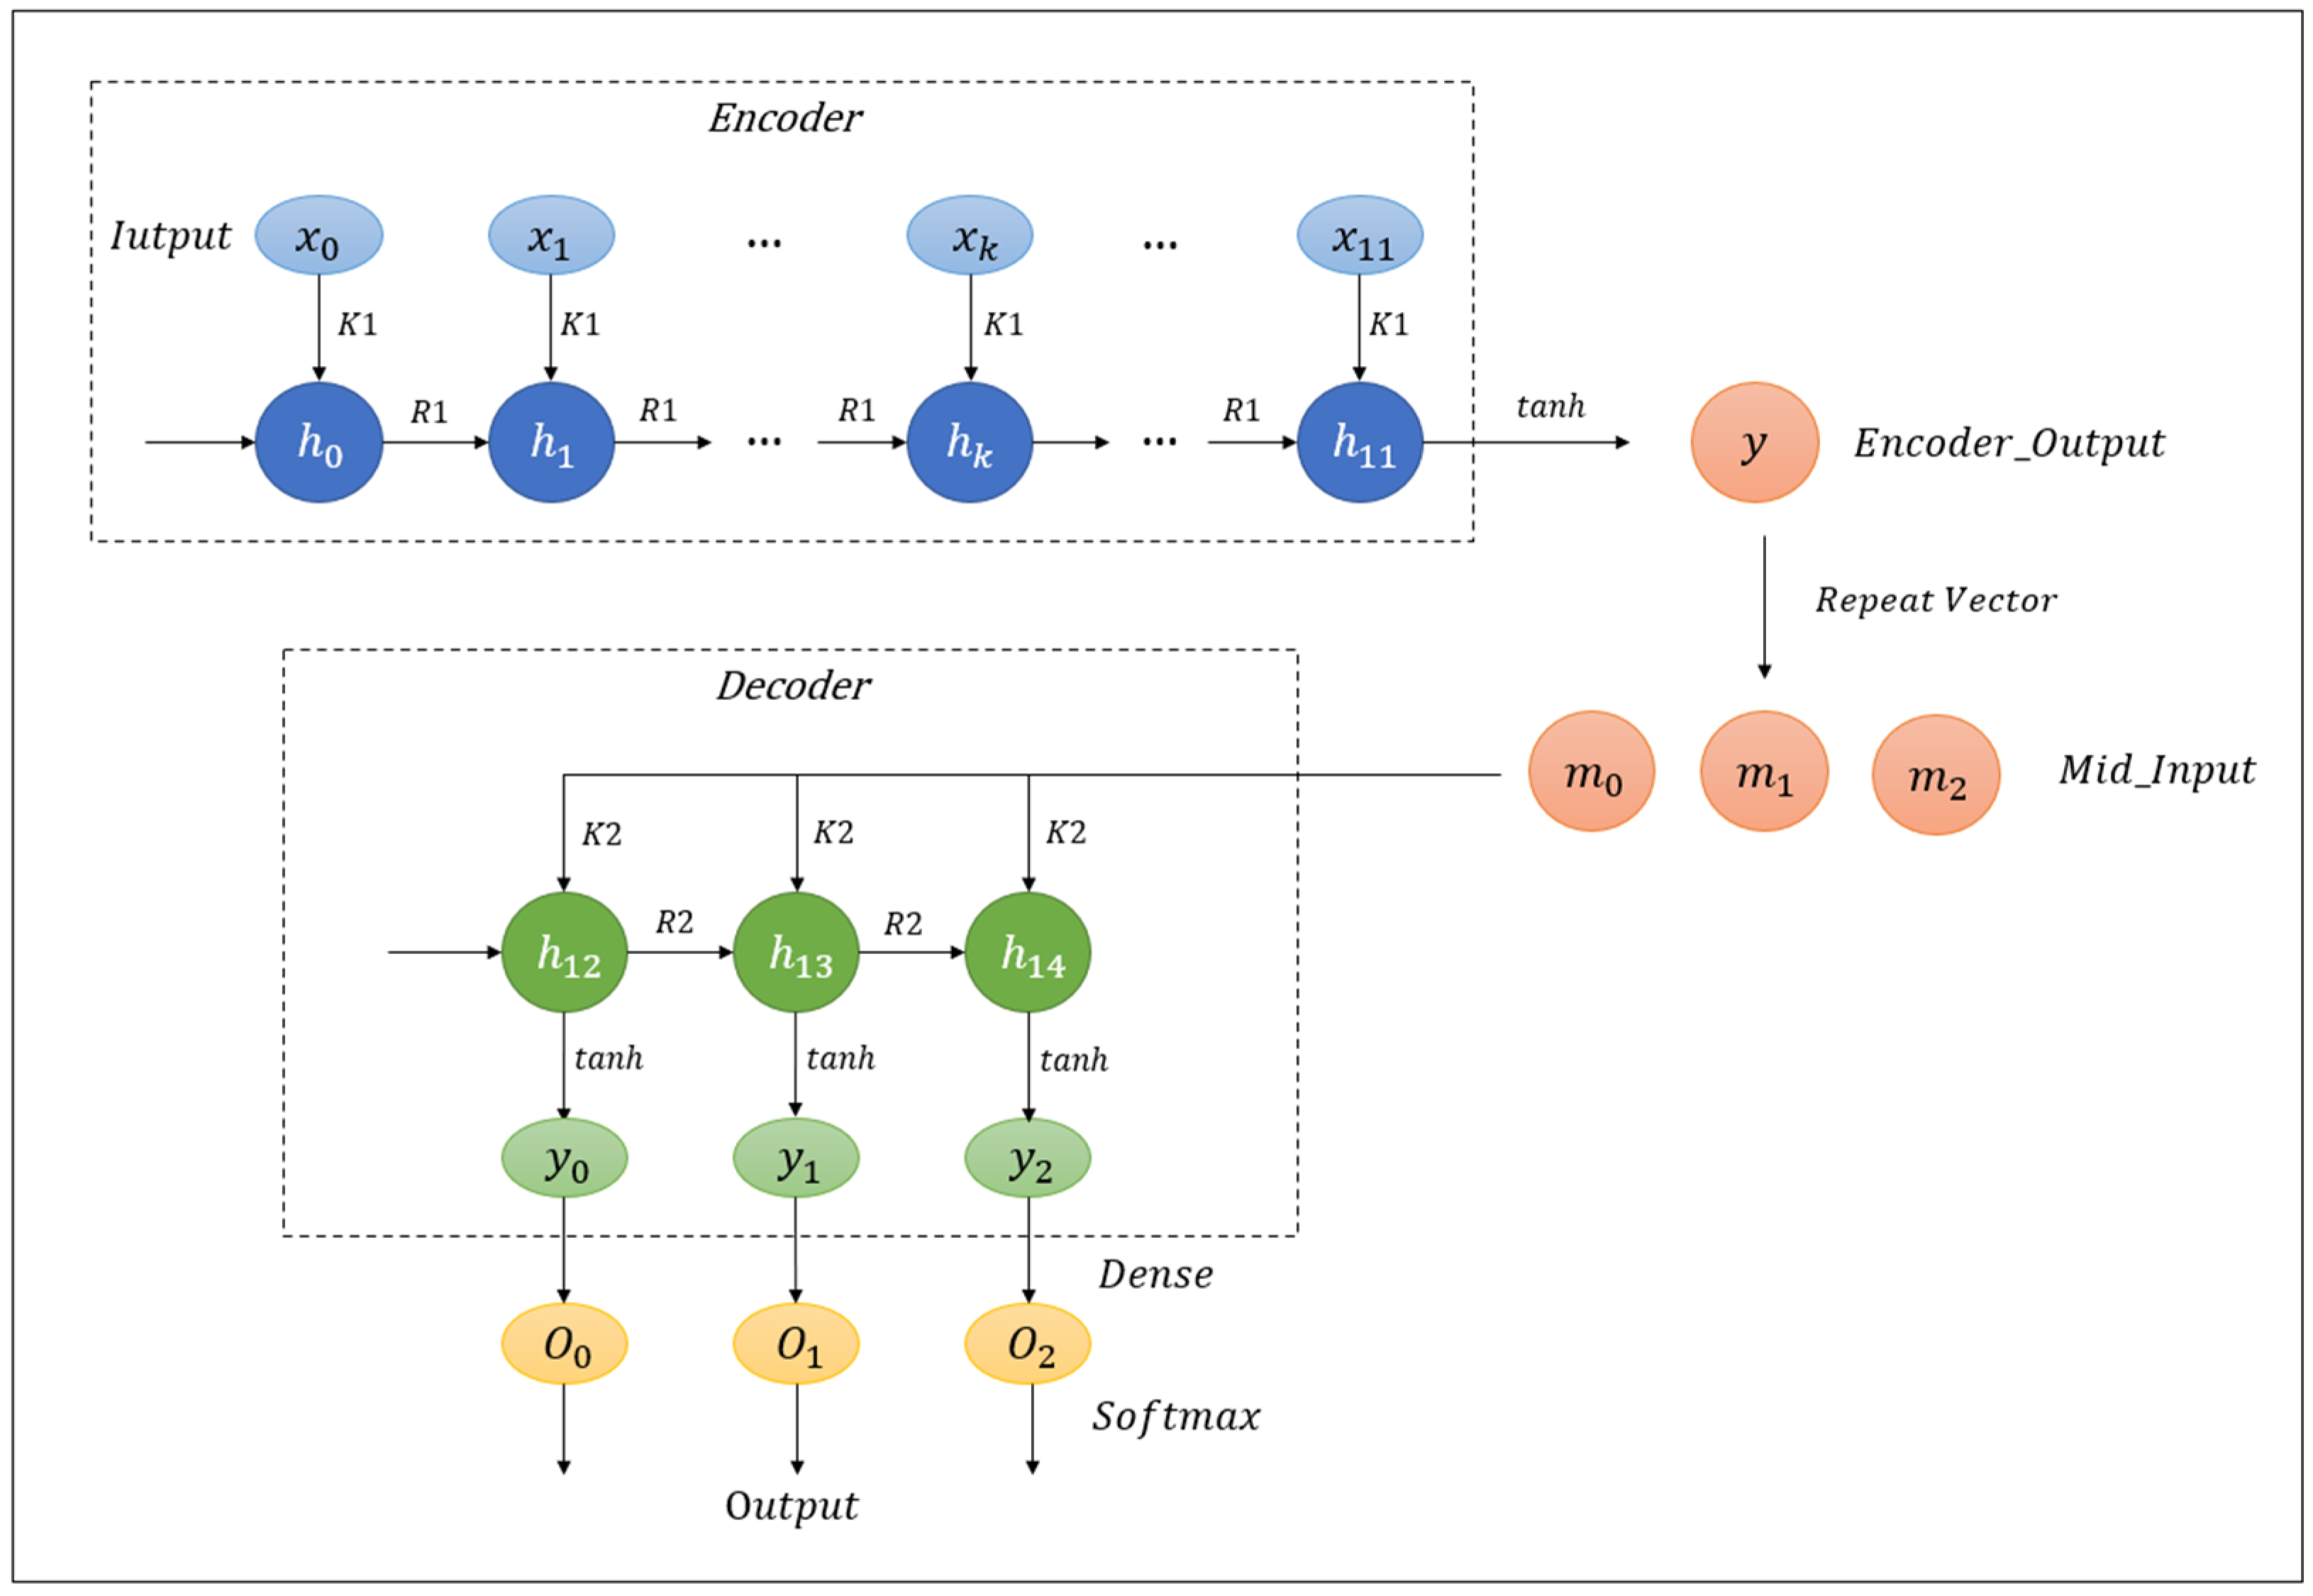
- Encoding: The encoder consists of 12 timesteps that process the 12 CAN ID sequences of the input in turn. The output of each timestep depends on both the current input and the previously hidden layer output; K1 is the weight matrix from the input layer to the hidden layer, and R1 is the weight matrix from the hidden layer to the output layer. The activation function is tanh, and the output is a 1 × 8 coding matrix.
- Decoding: According to the decoding layer design, the encoded features are copied into a sequence with a timing of 3 as the input of the decoding layer. The decoder contains 3 timesteps, and the activation function for each layer is tanh. Meanwhile, the output at each step is used as both the output of the current timestep and the input to the hidden layer at the next timestep.
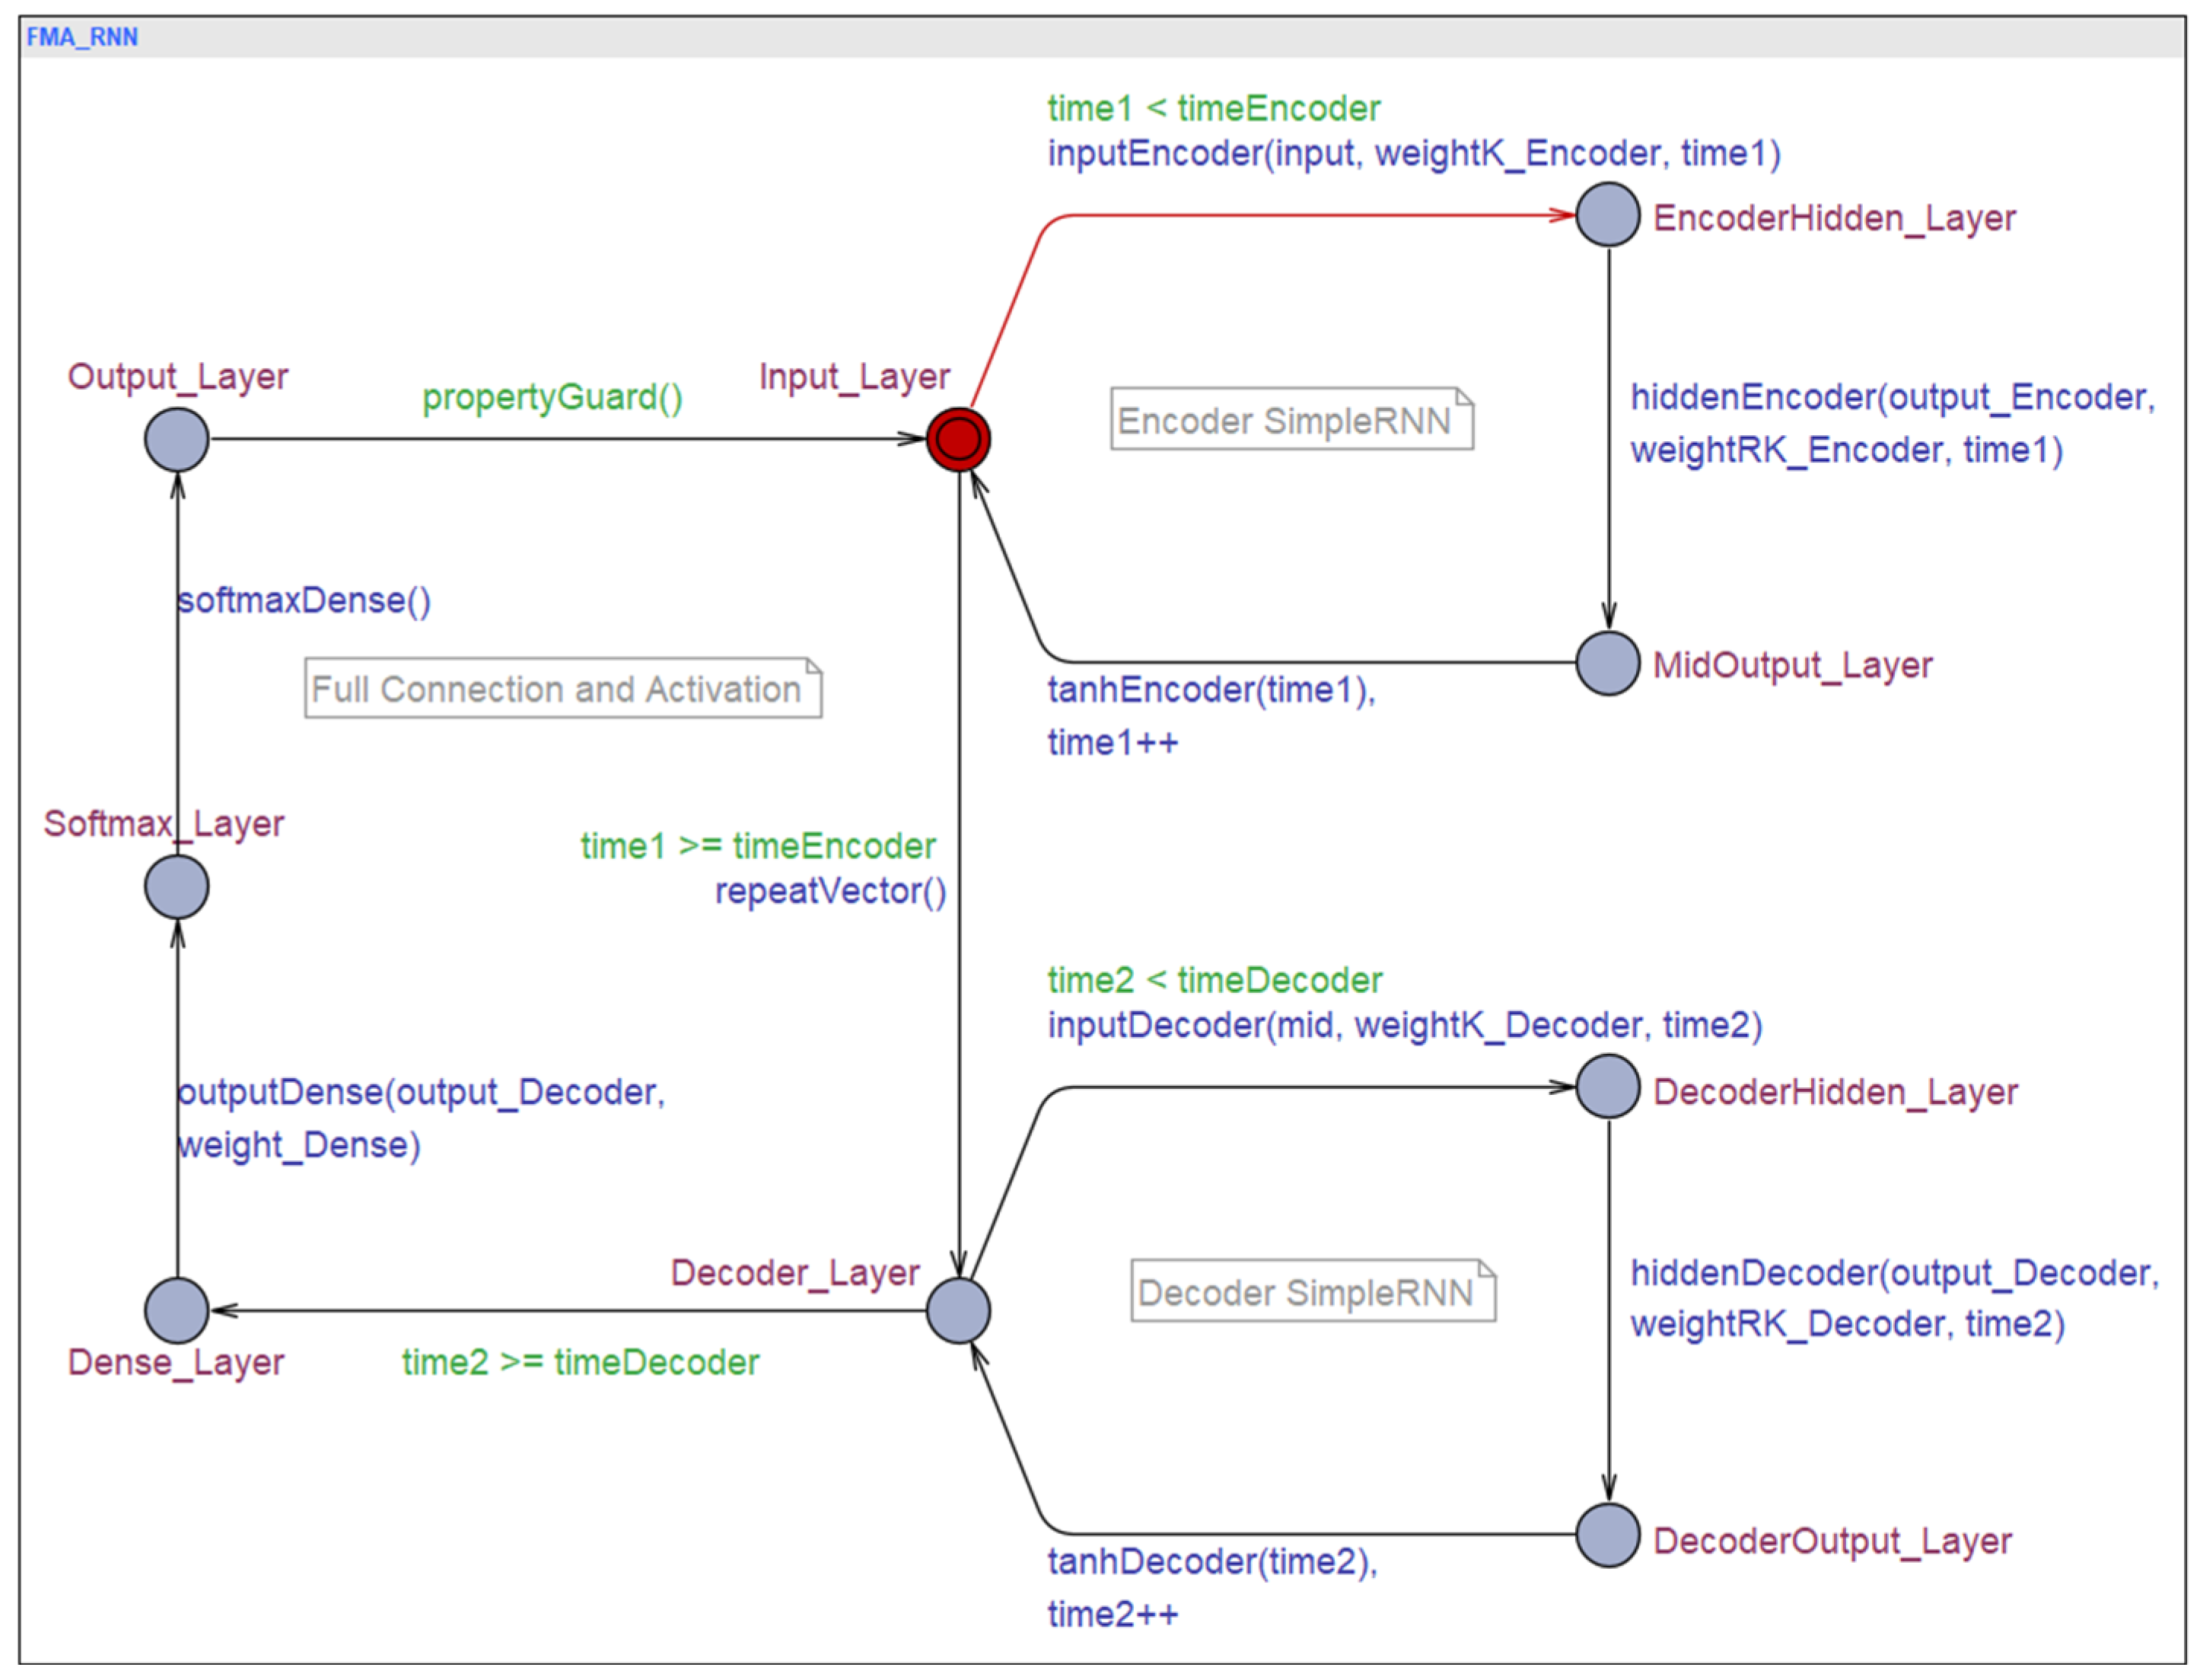
3.1.3. Model Transformation
| Algorithm 1 Convert the RNN Model to Timed Automata |
| Input: Time round of RNN: ; the weight of RNN: ; the bias of RNN: list of layers for L = 〈 Activation function of RNN F = 〈. |
| Output: Abstract automaton of RNN |
| 1: |
| 2: for index i of layers do |
| 3: if L[i] is encoder or decoder layer then |
| 4: for time round of RNN do |
| 5: |
| 6: |
| 7: |
| 8: end for |
| 9: end if |
| 10: if L[i] is activation layer then |
| 11: |
| 12: end if |
| 13: end for |
| 14: |
| 15: return FMA-RNN |
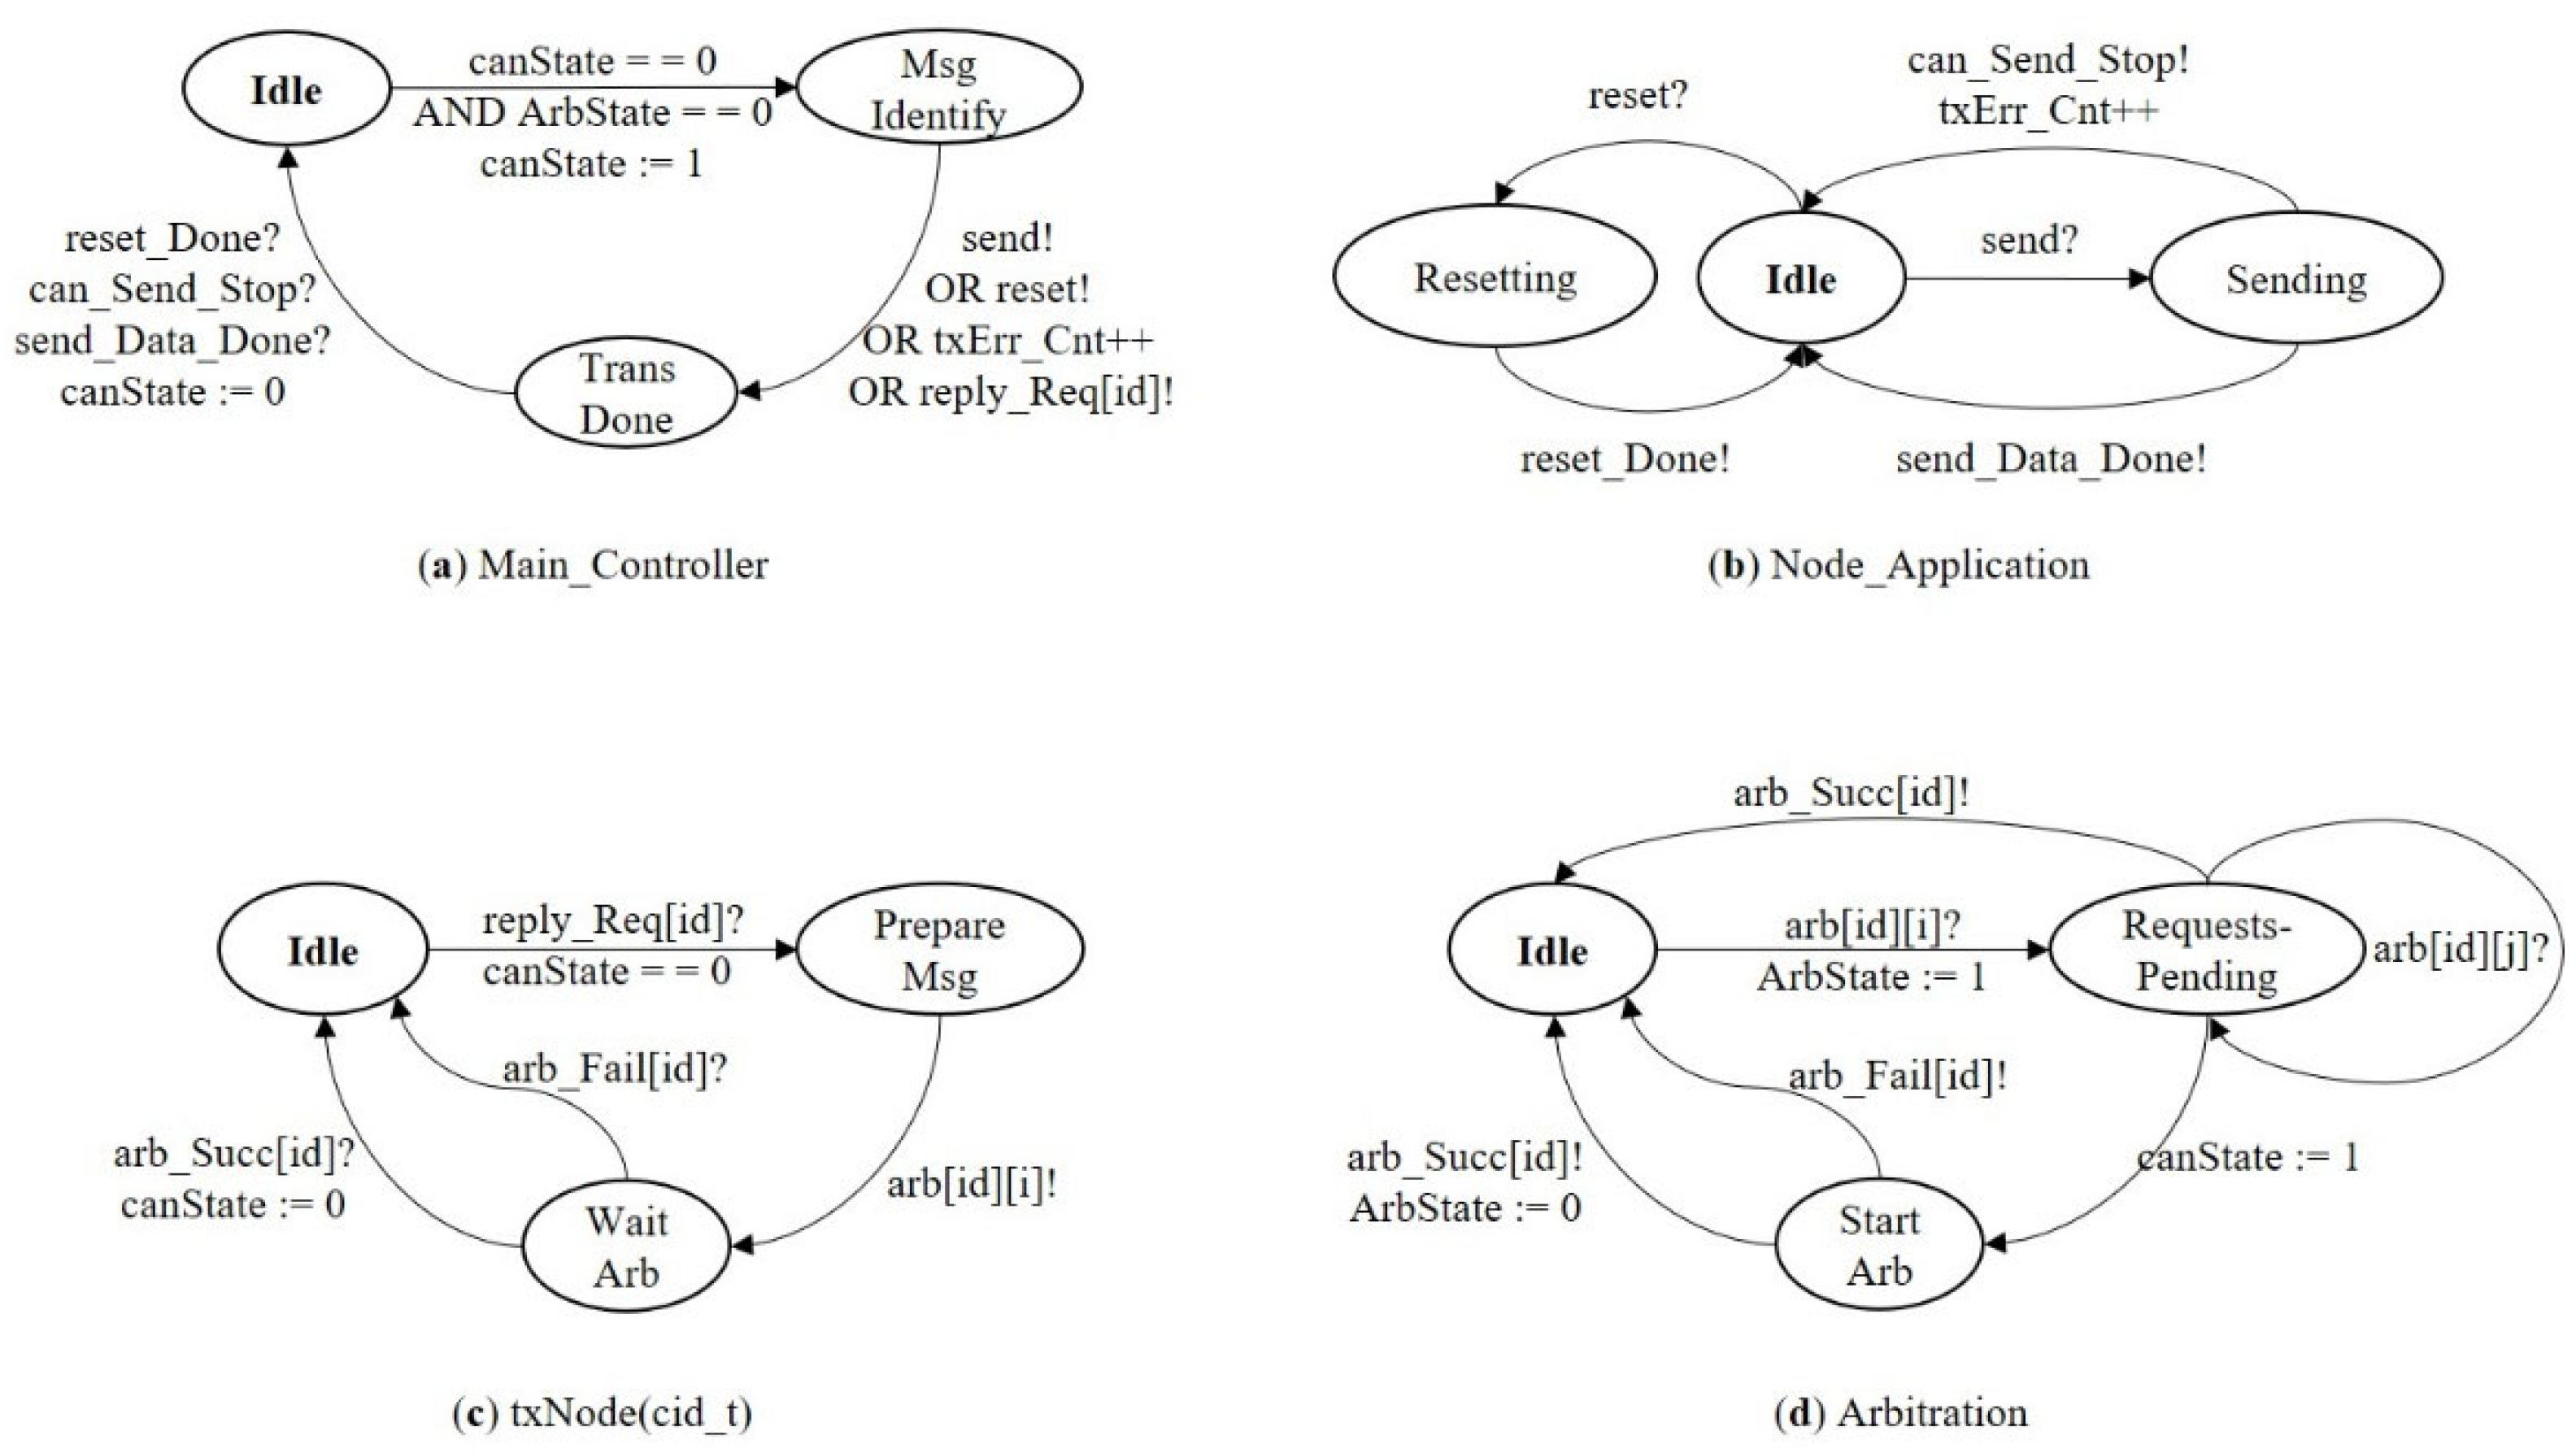
3.2. Modeling of the CAN Bus System
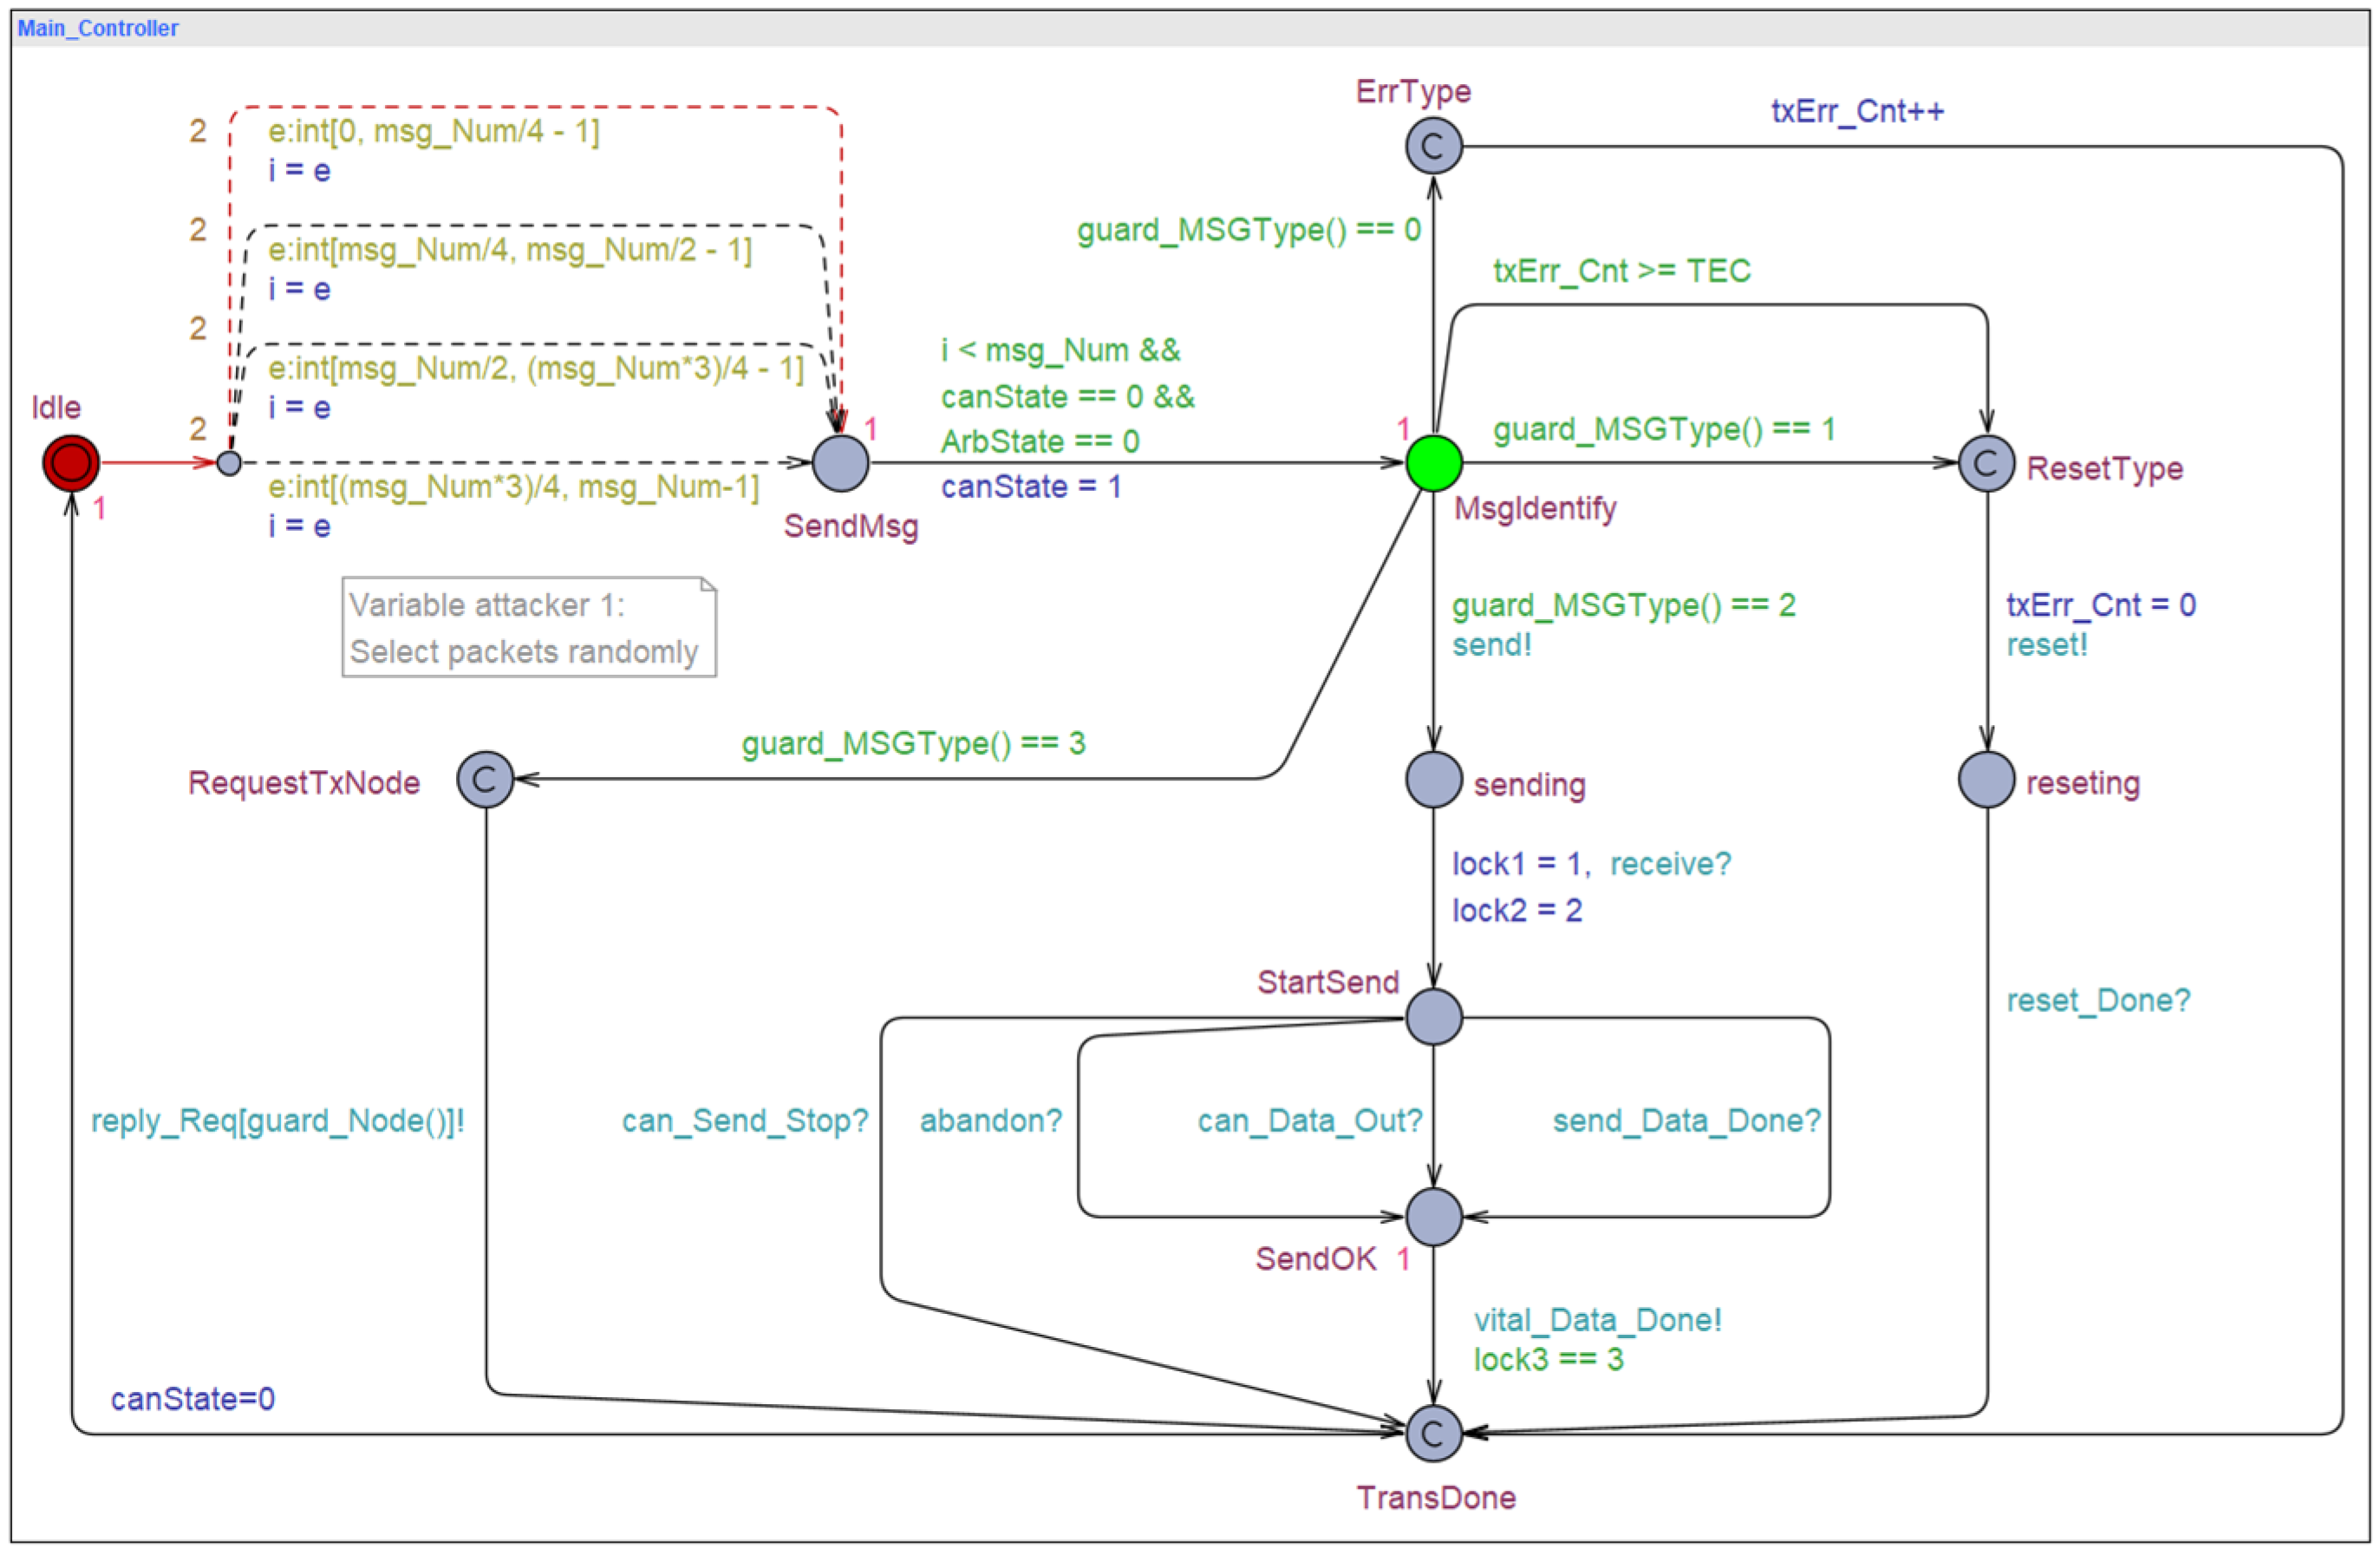
3.2.1. Master Controller
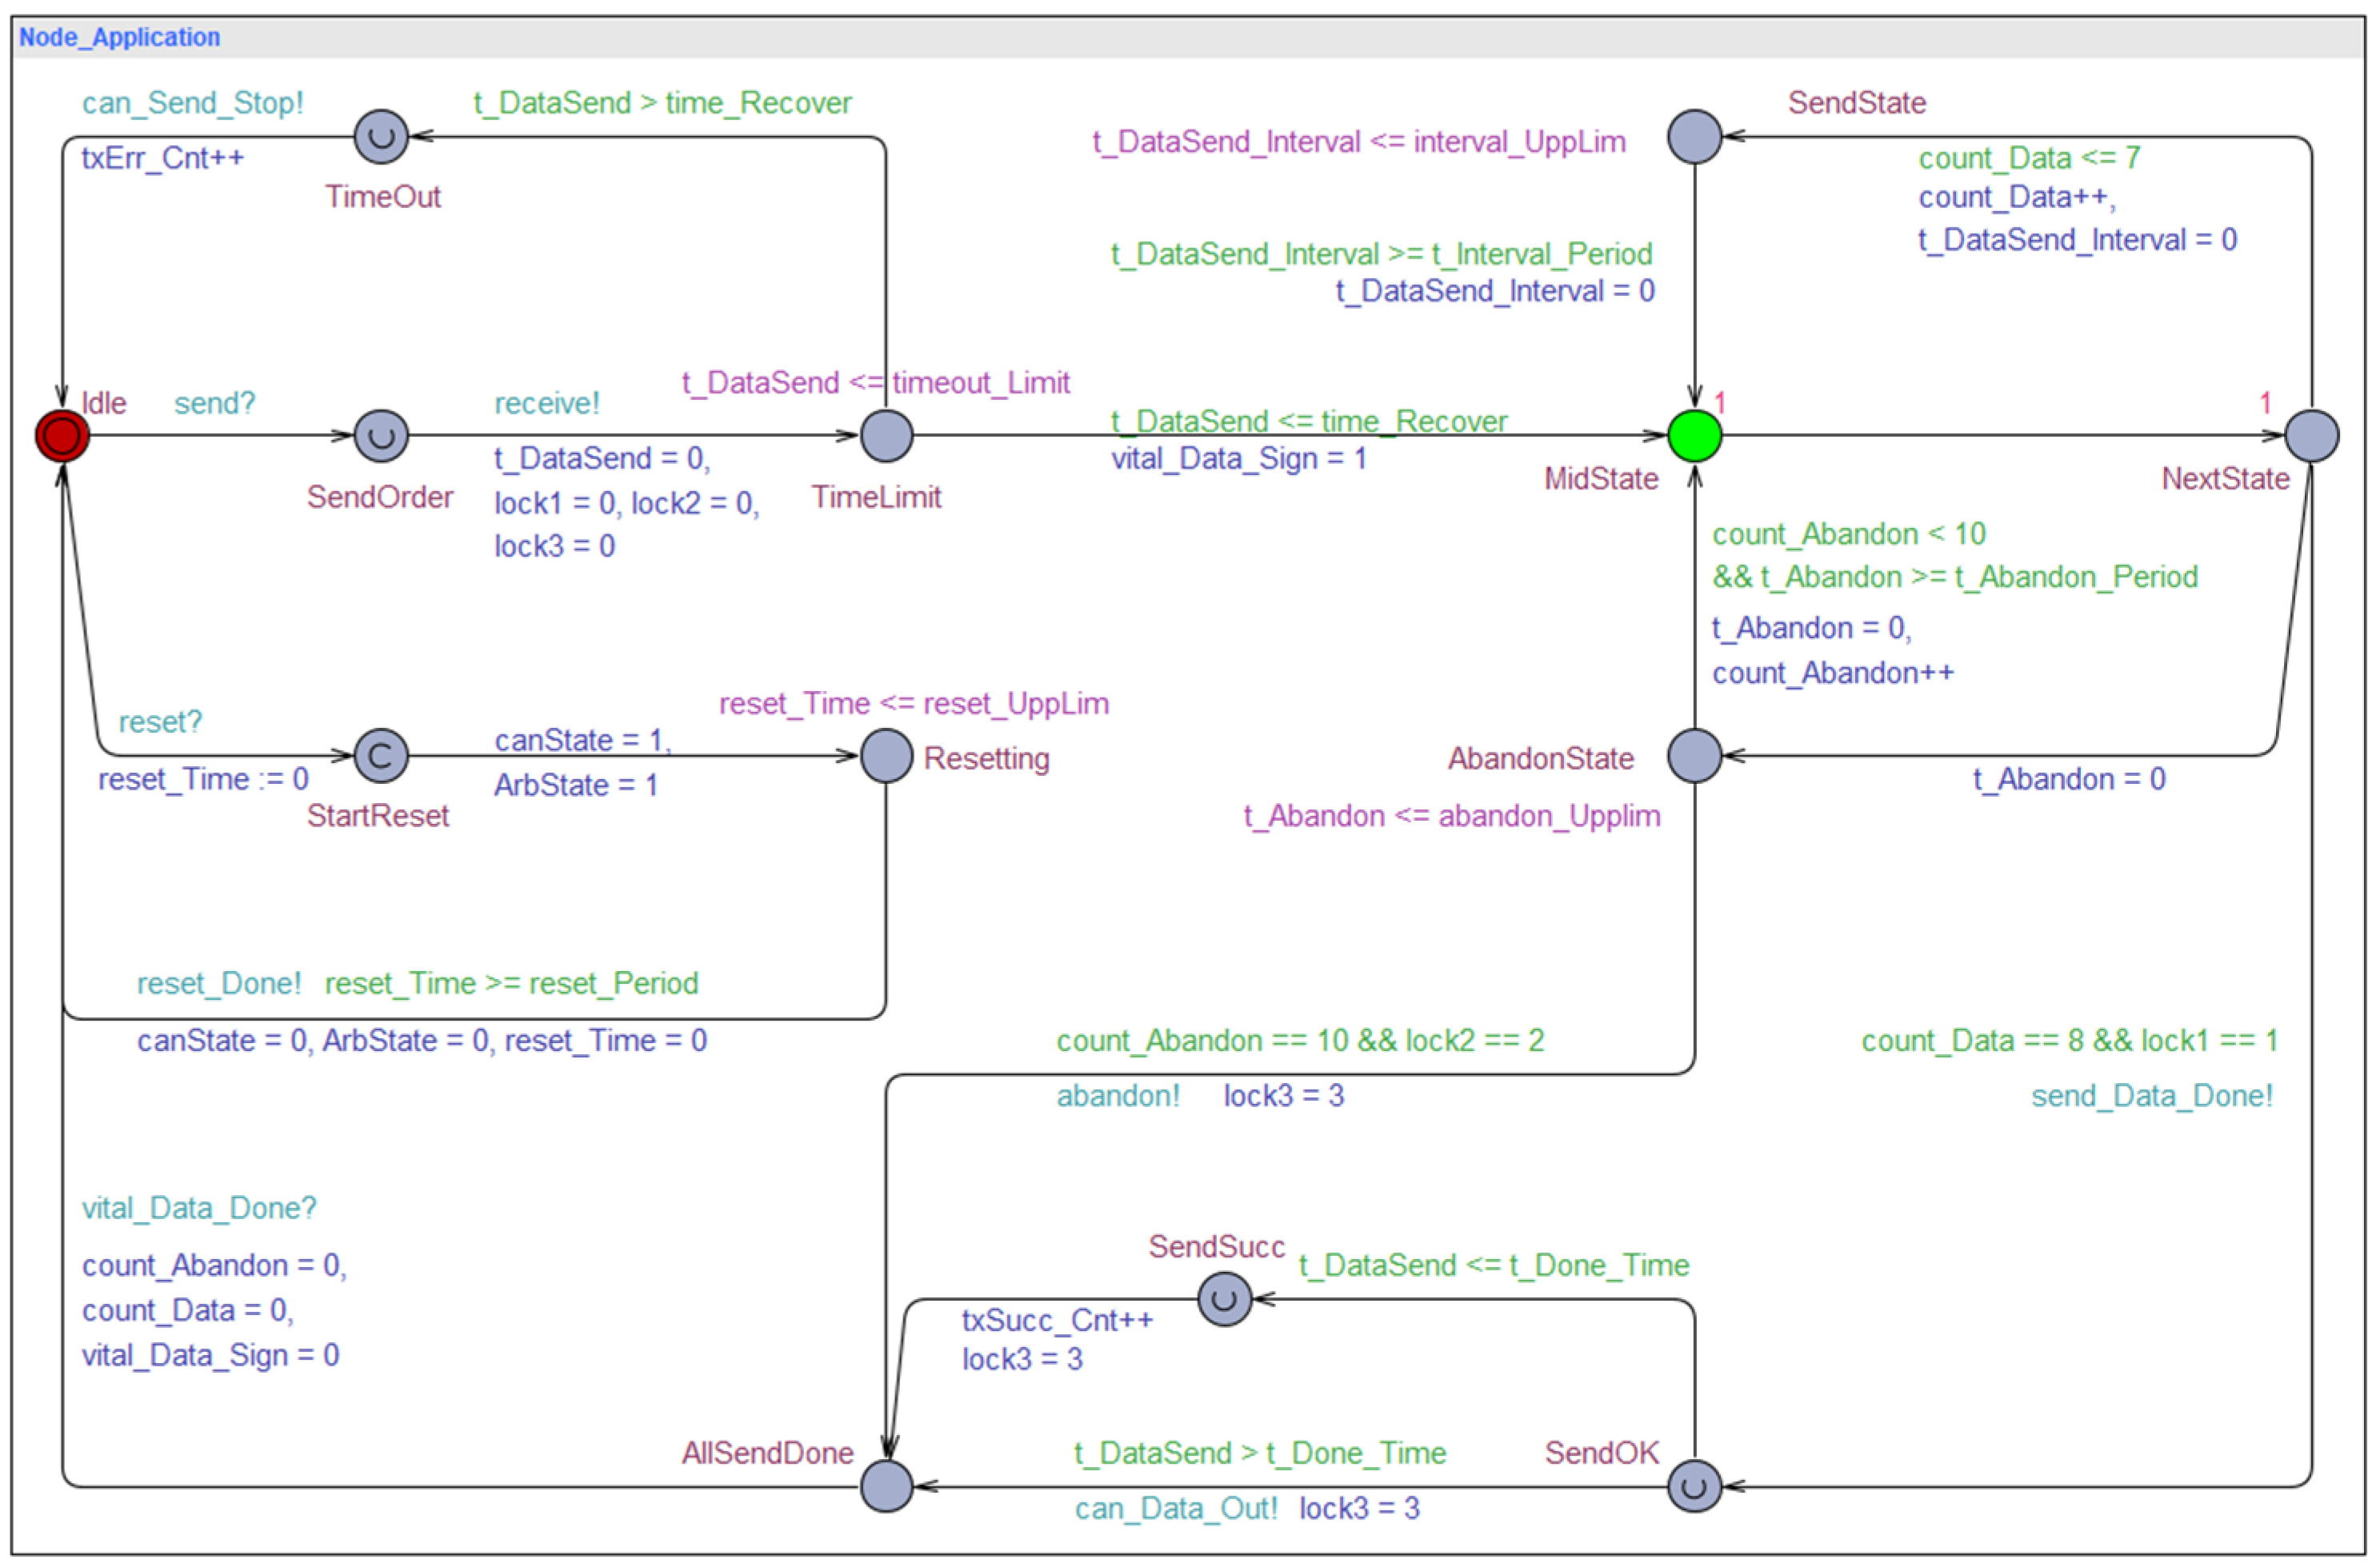
3.2.2. The Application Layer of the CAN Bus
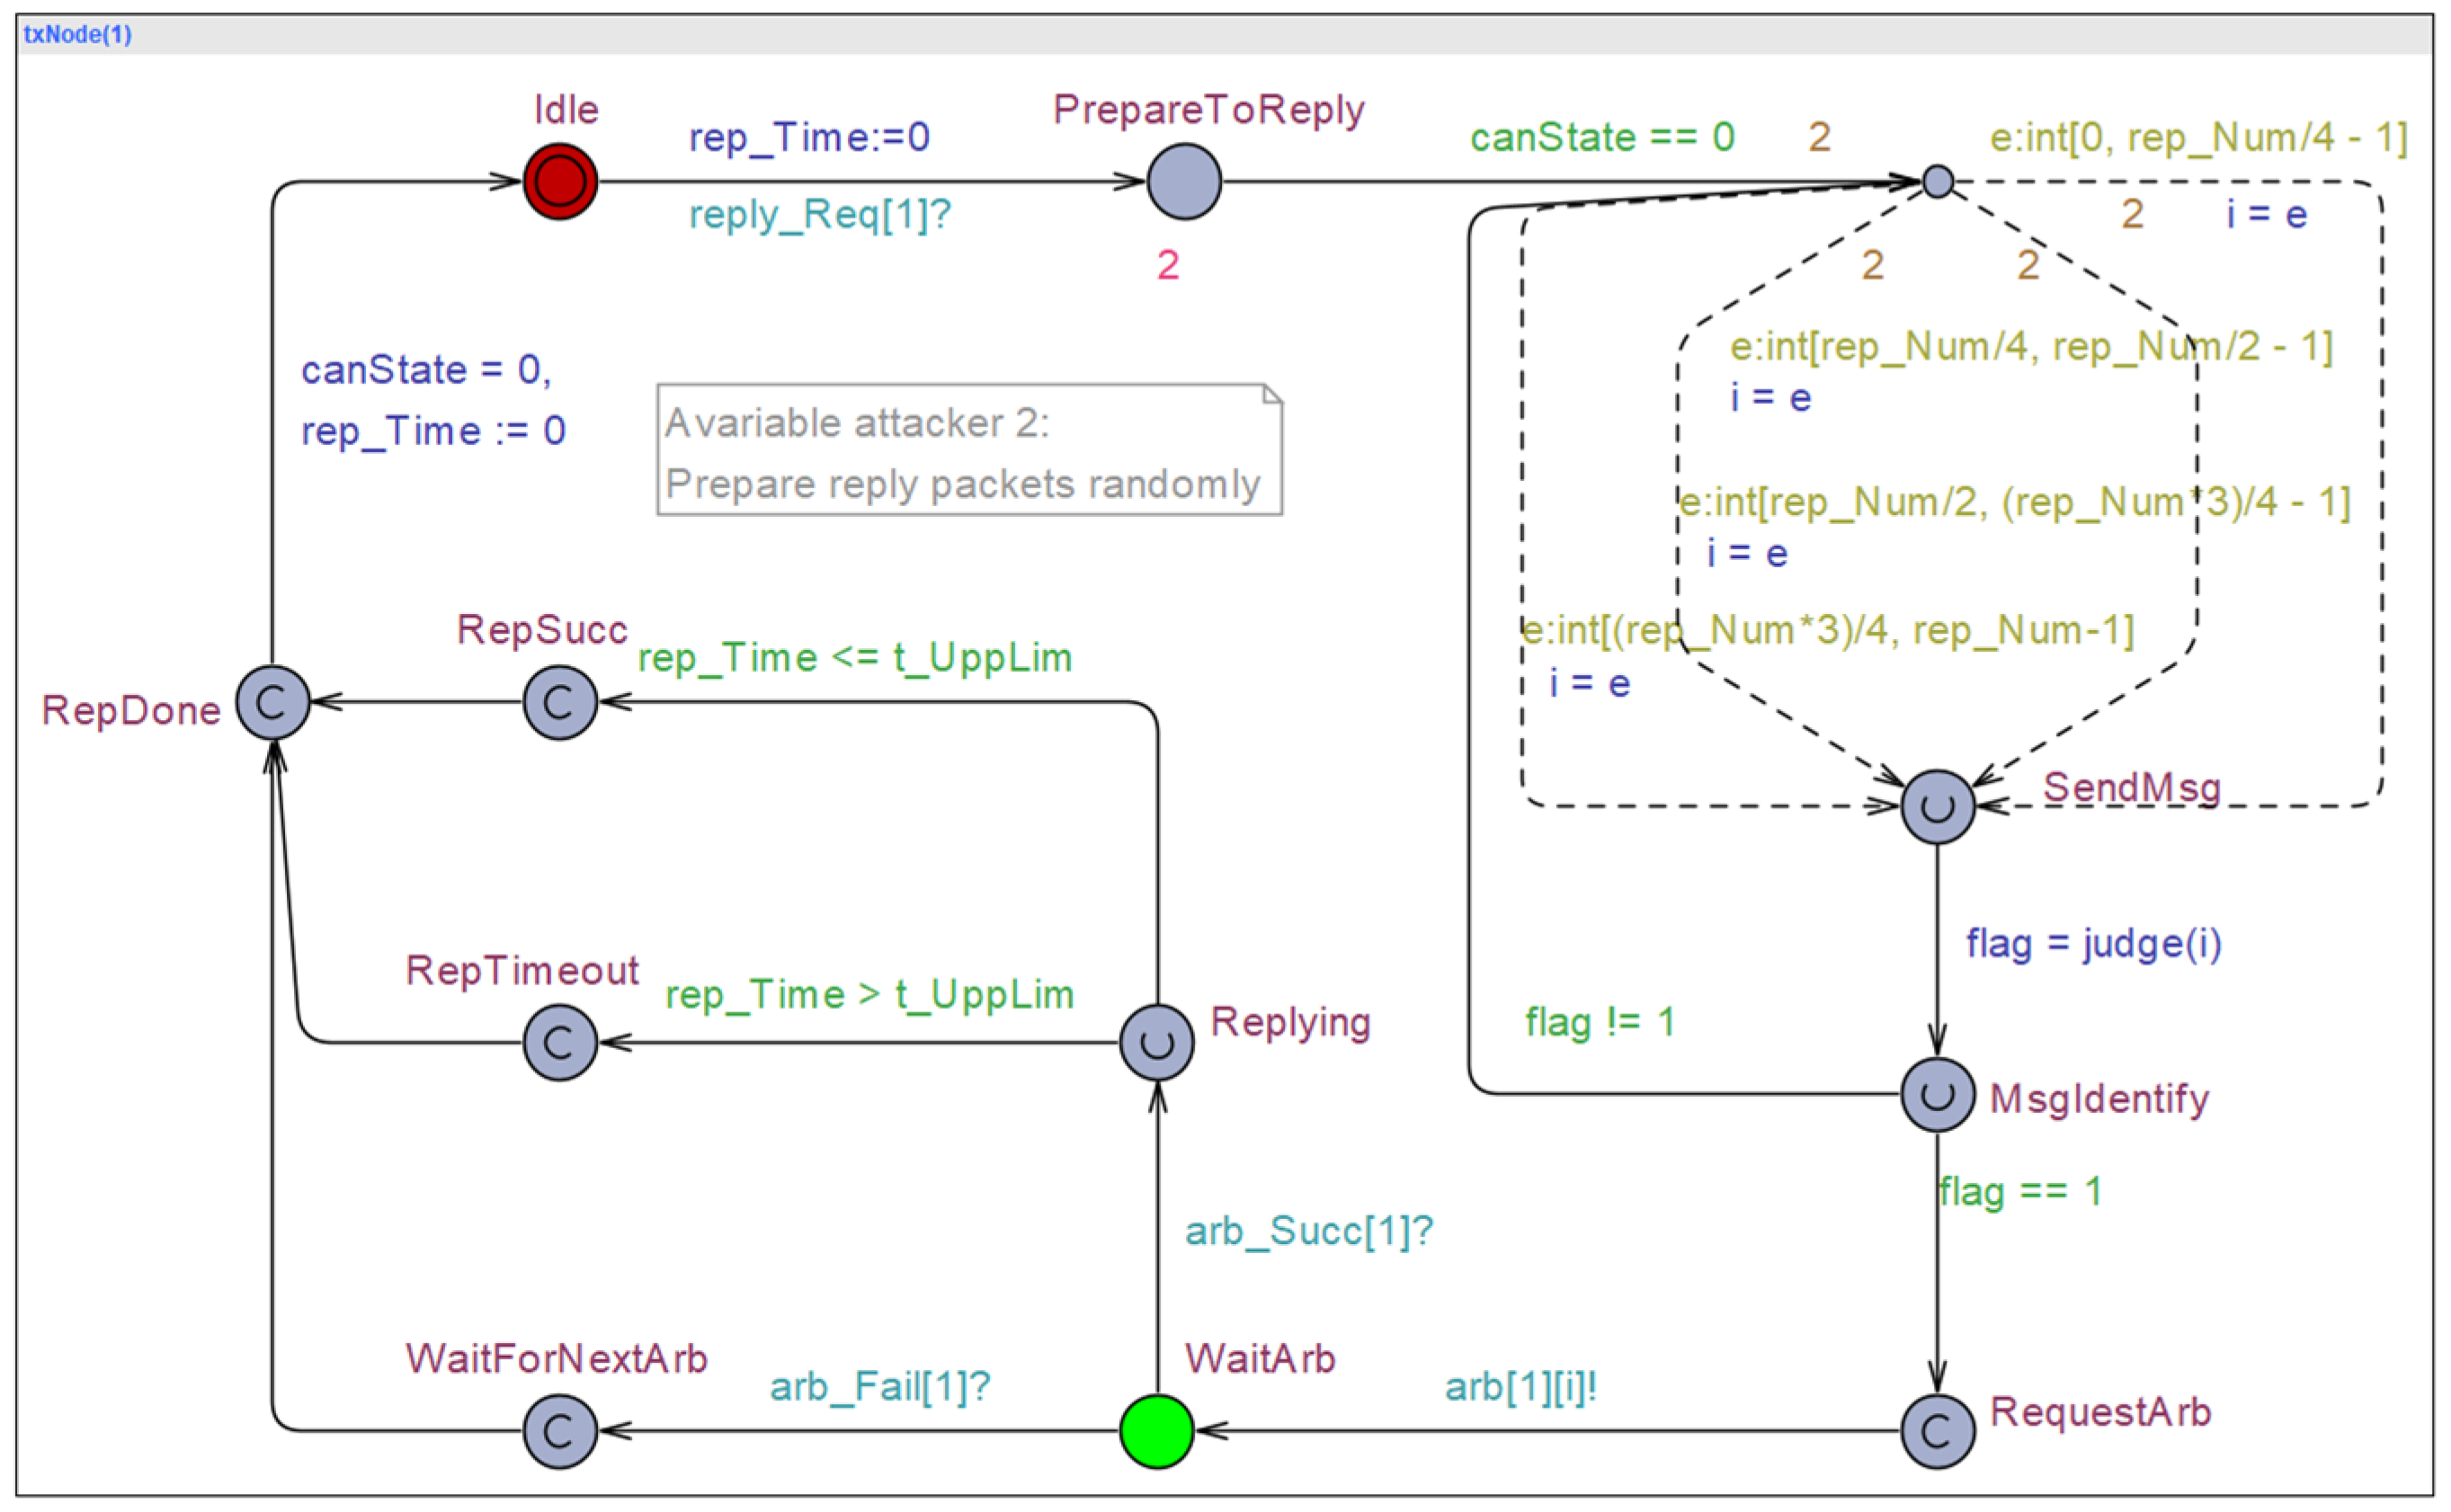
3.2.3. Subordinate Transmit Node
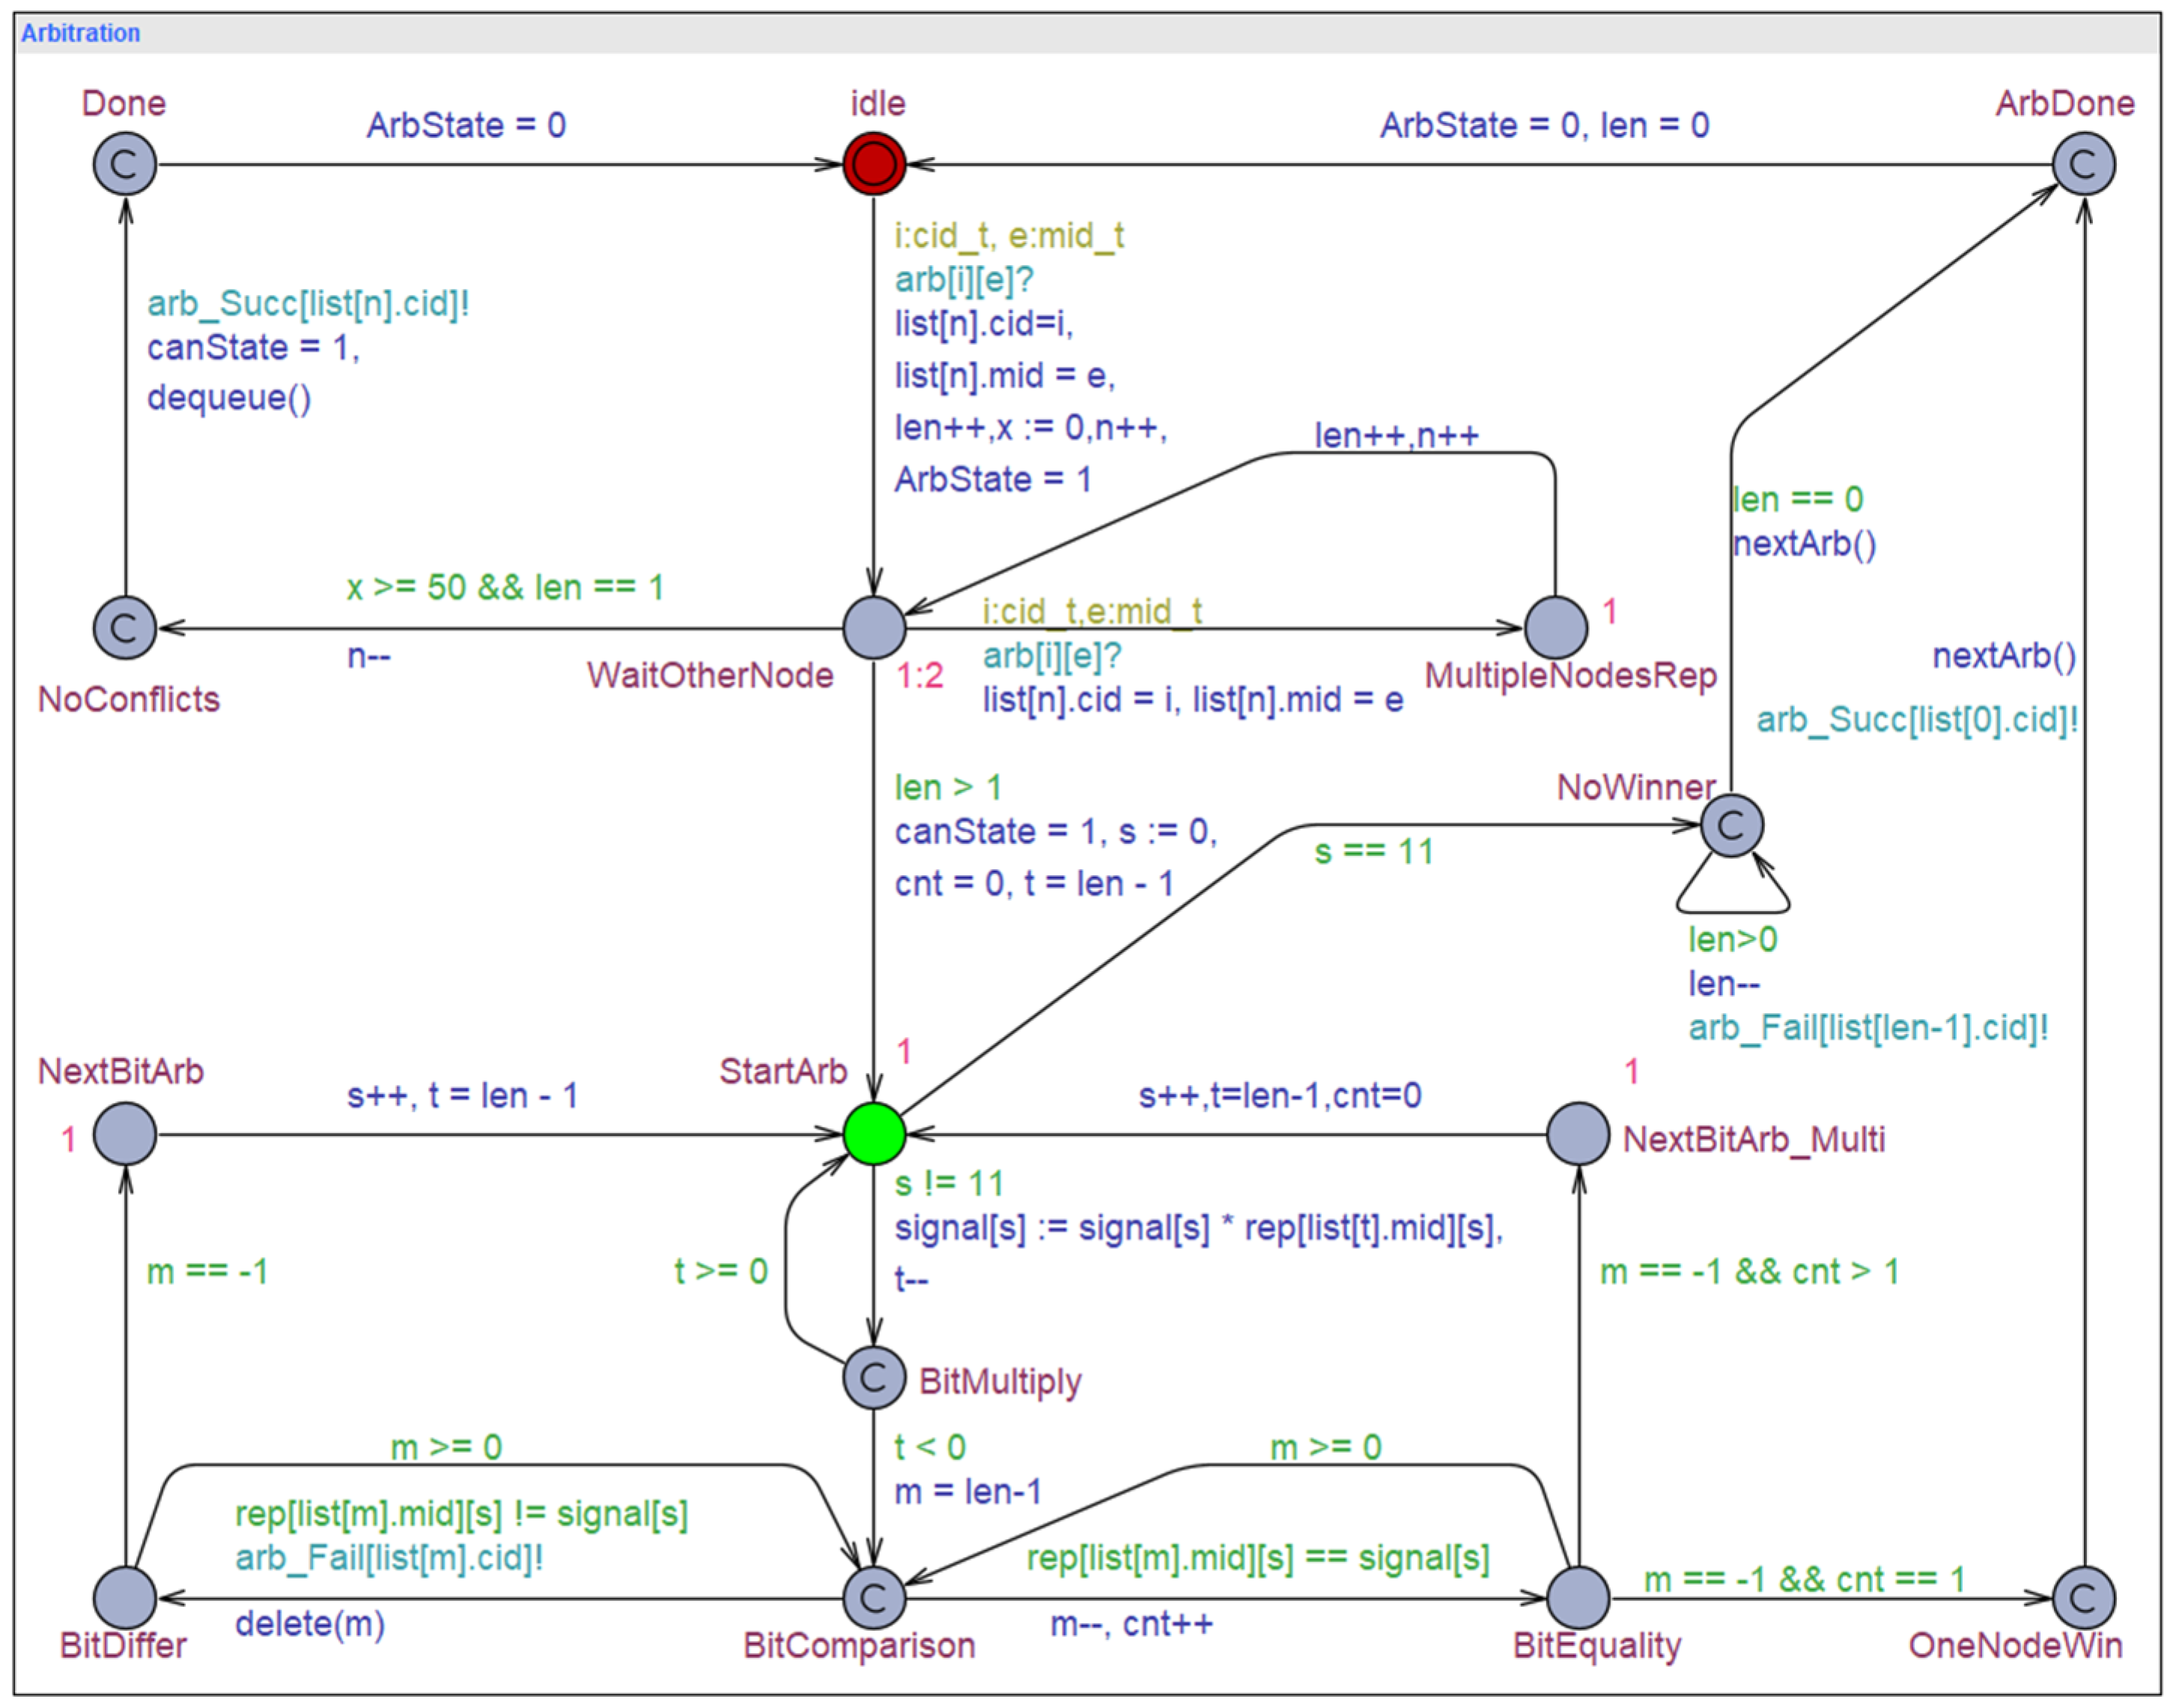
3.2.4. Arbiter Model
4. Model Verification and Result Analysis
4.1. Verification of Basic Functions
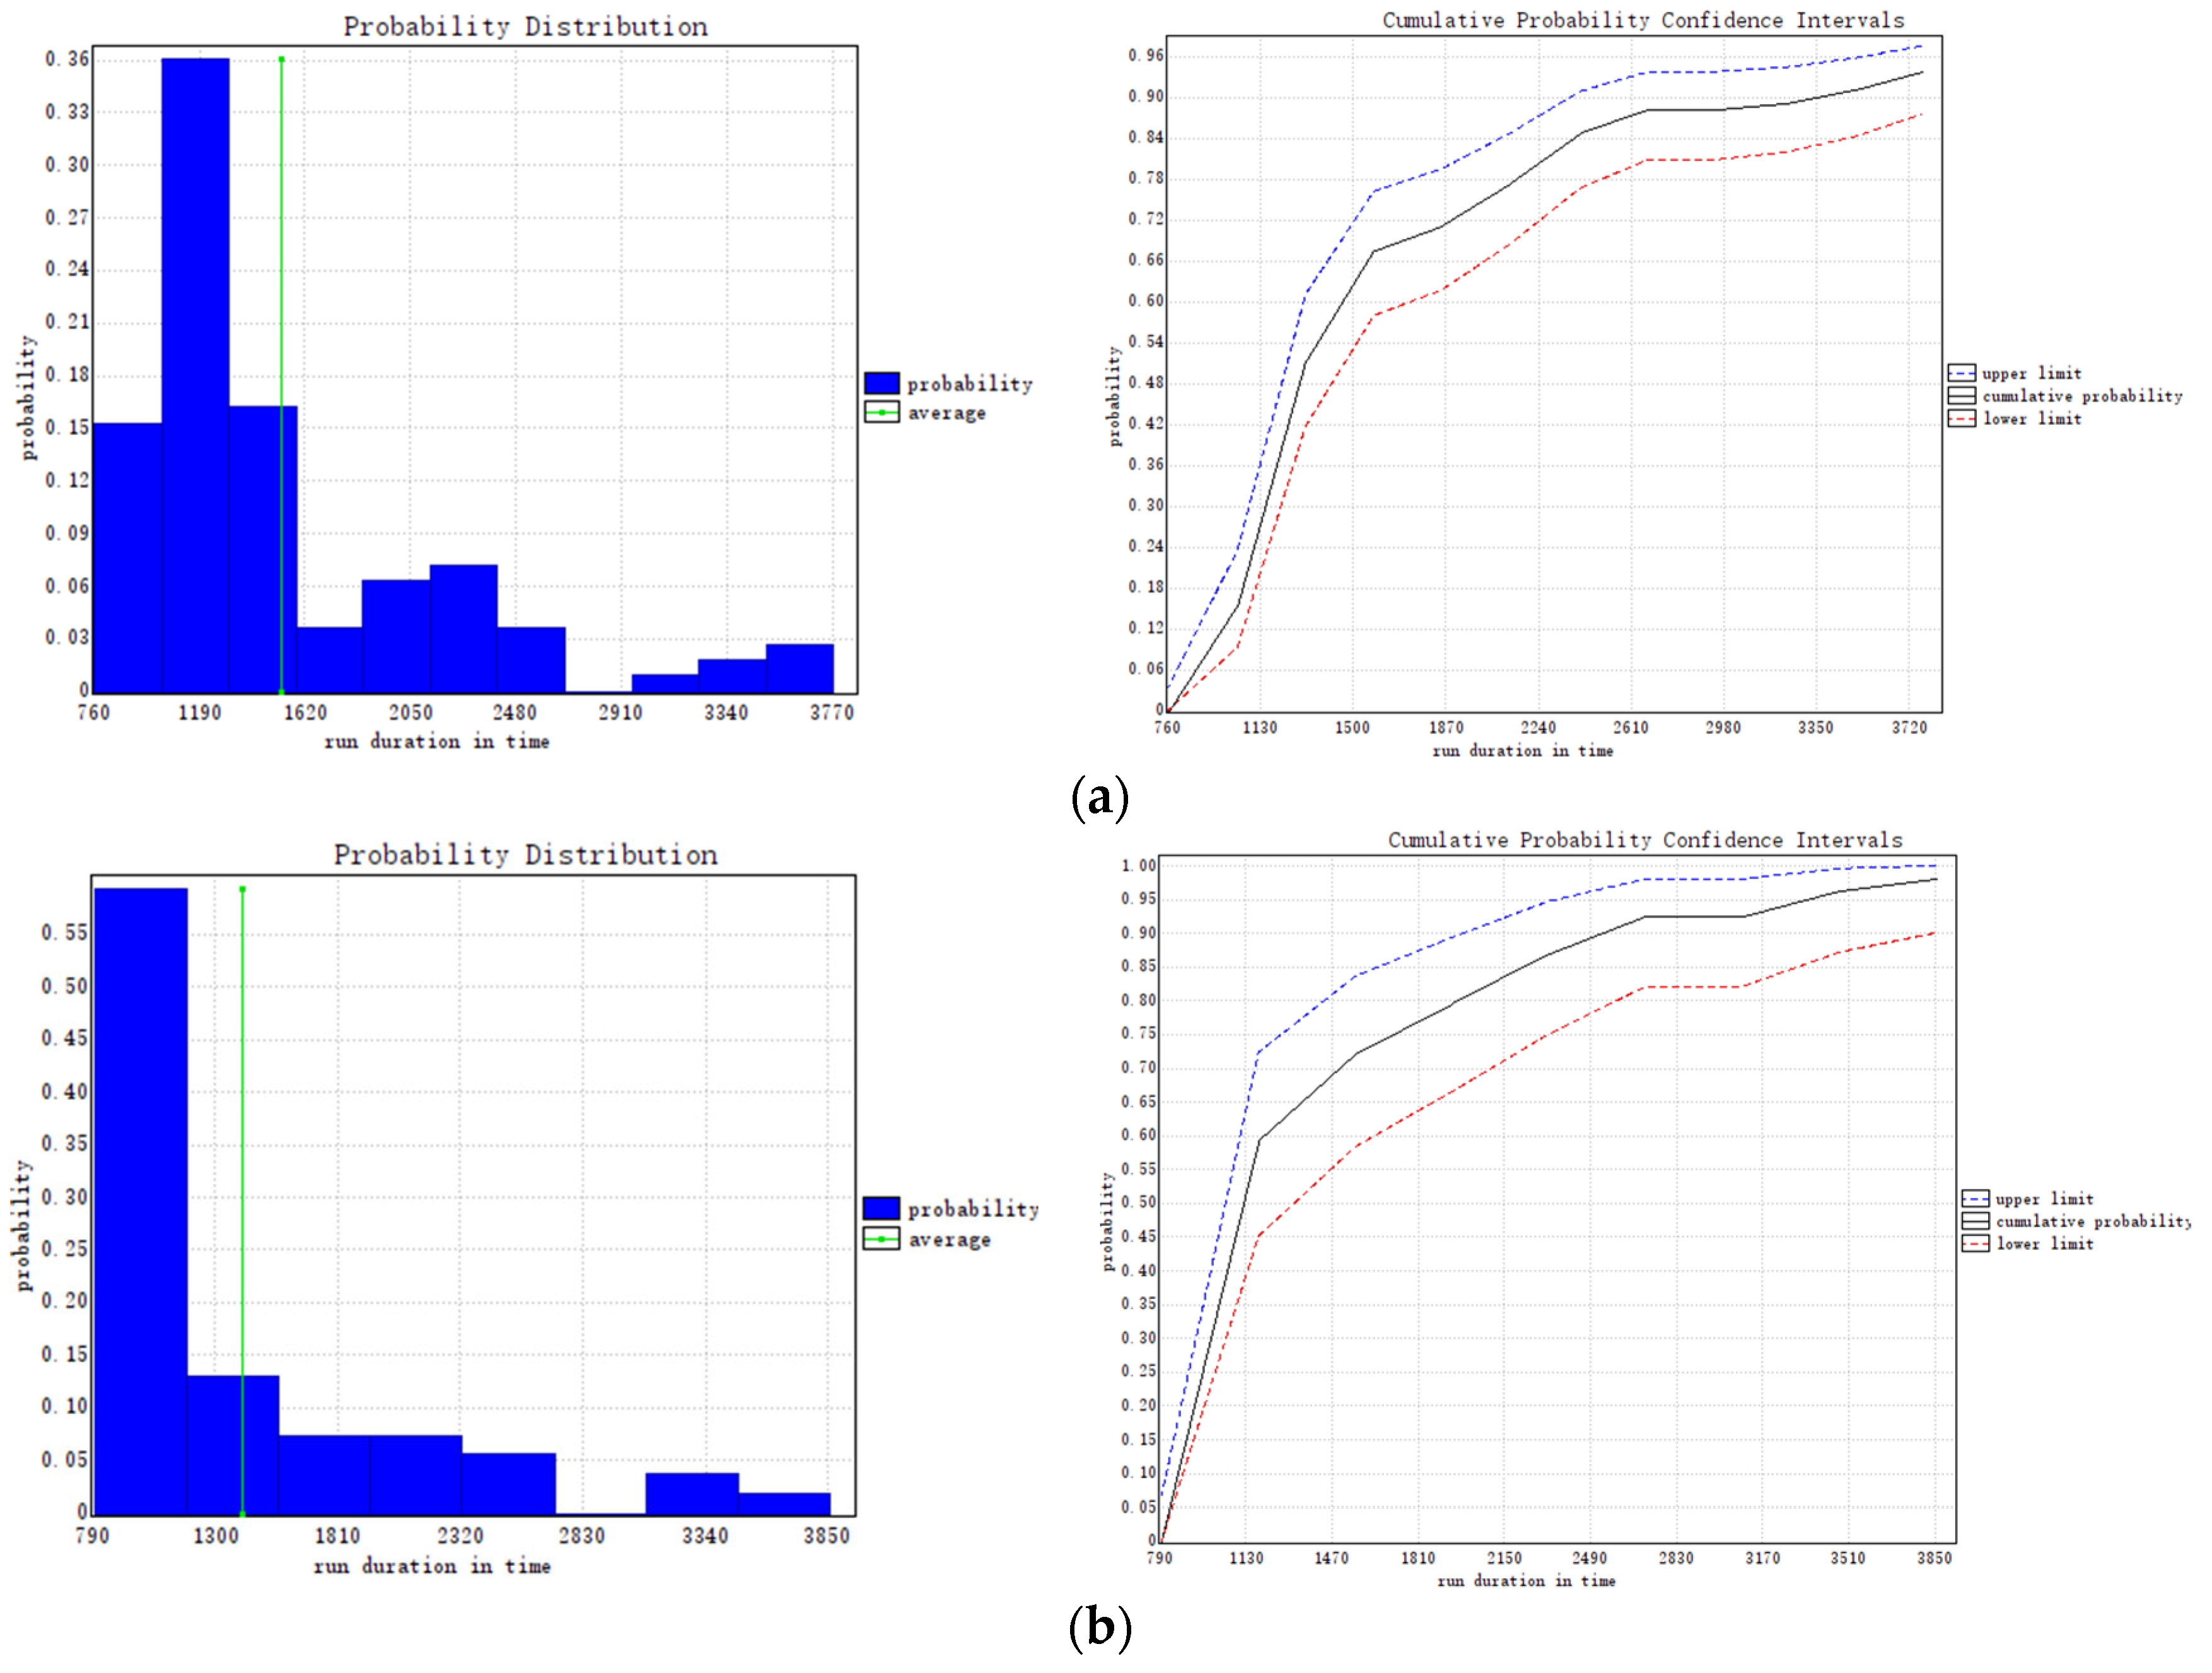
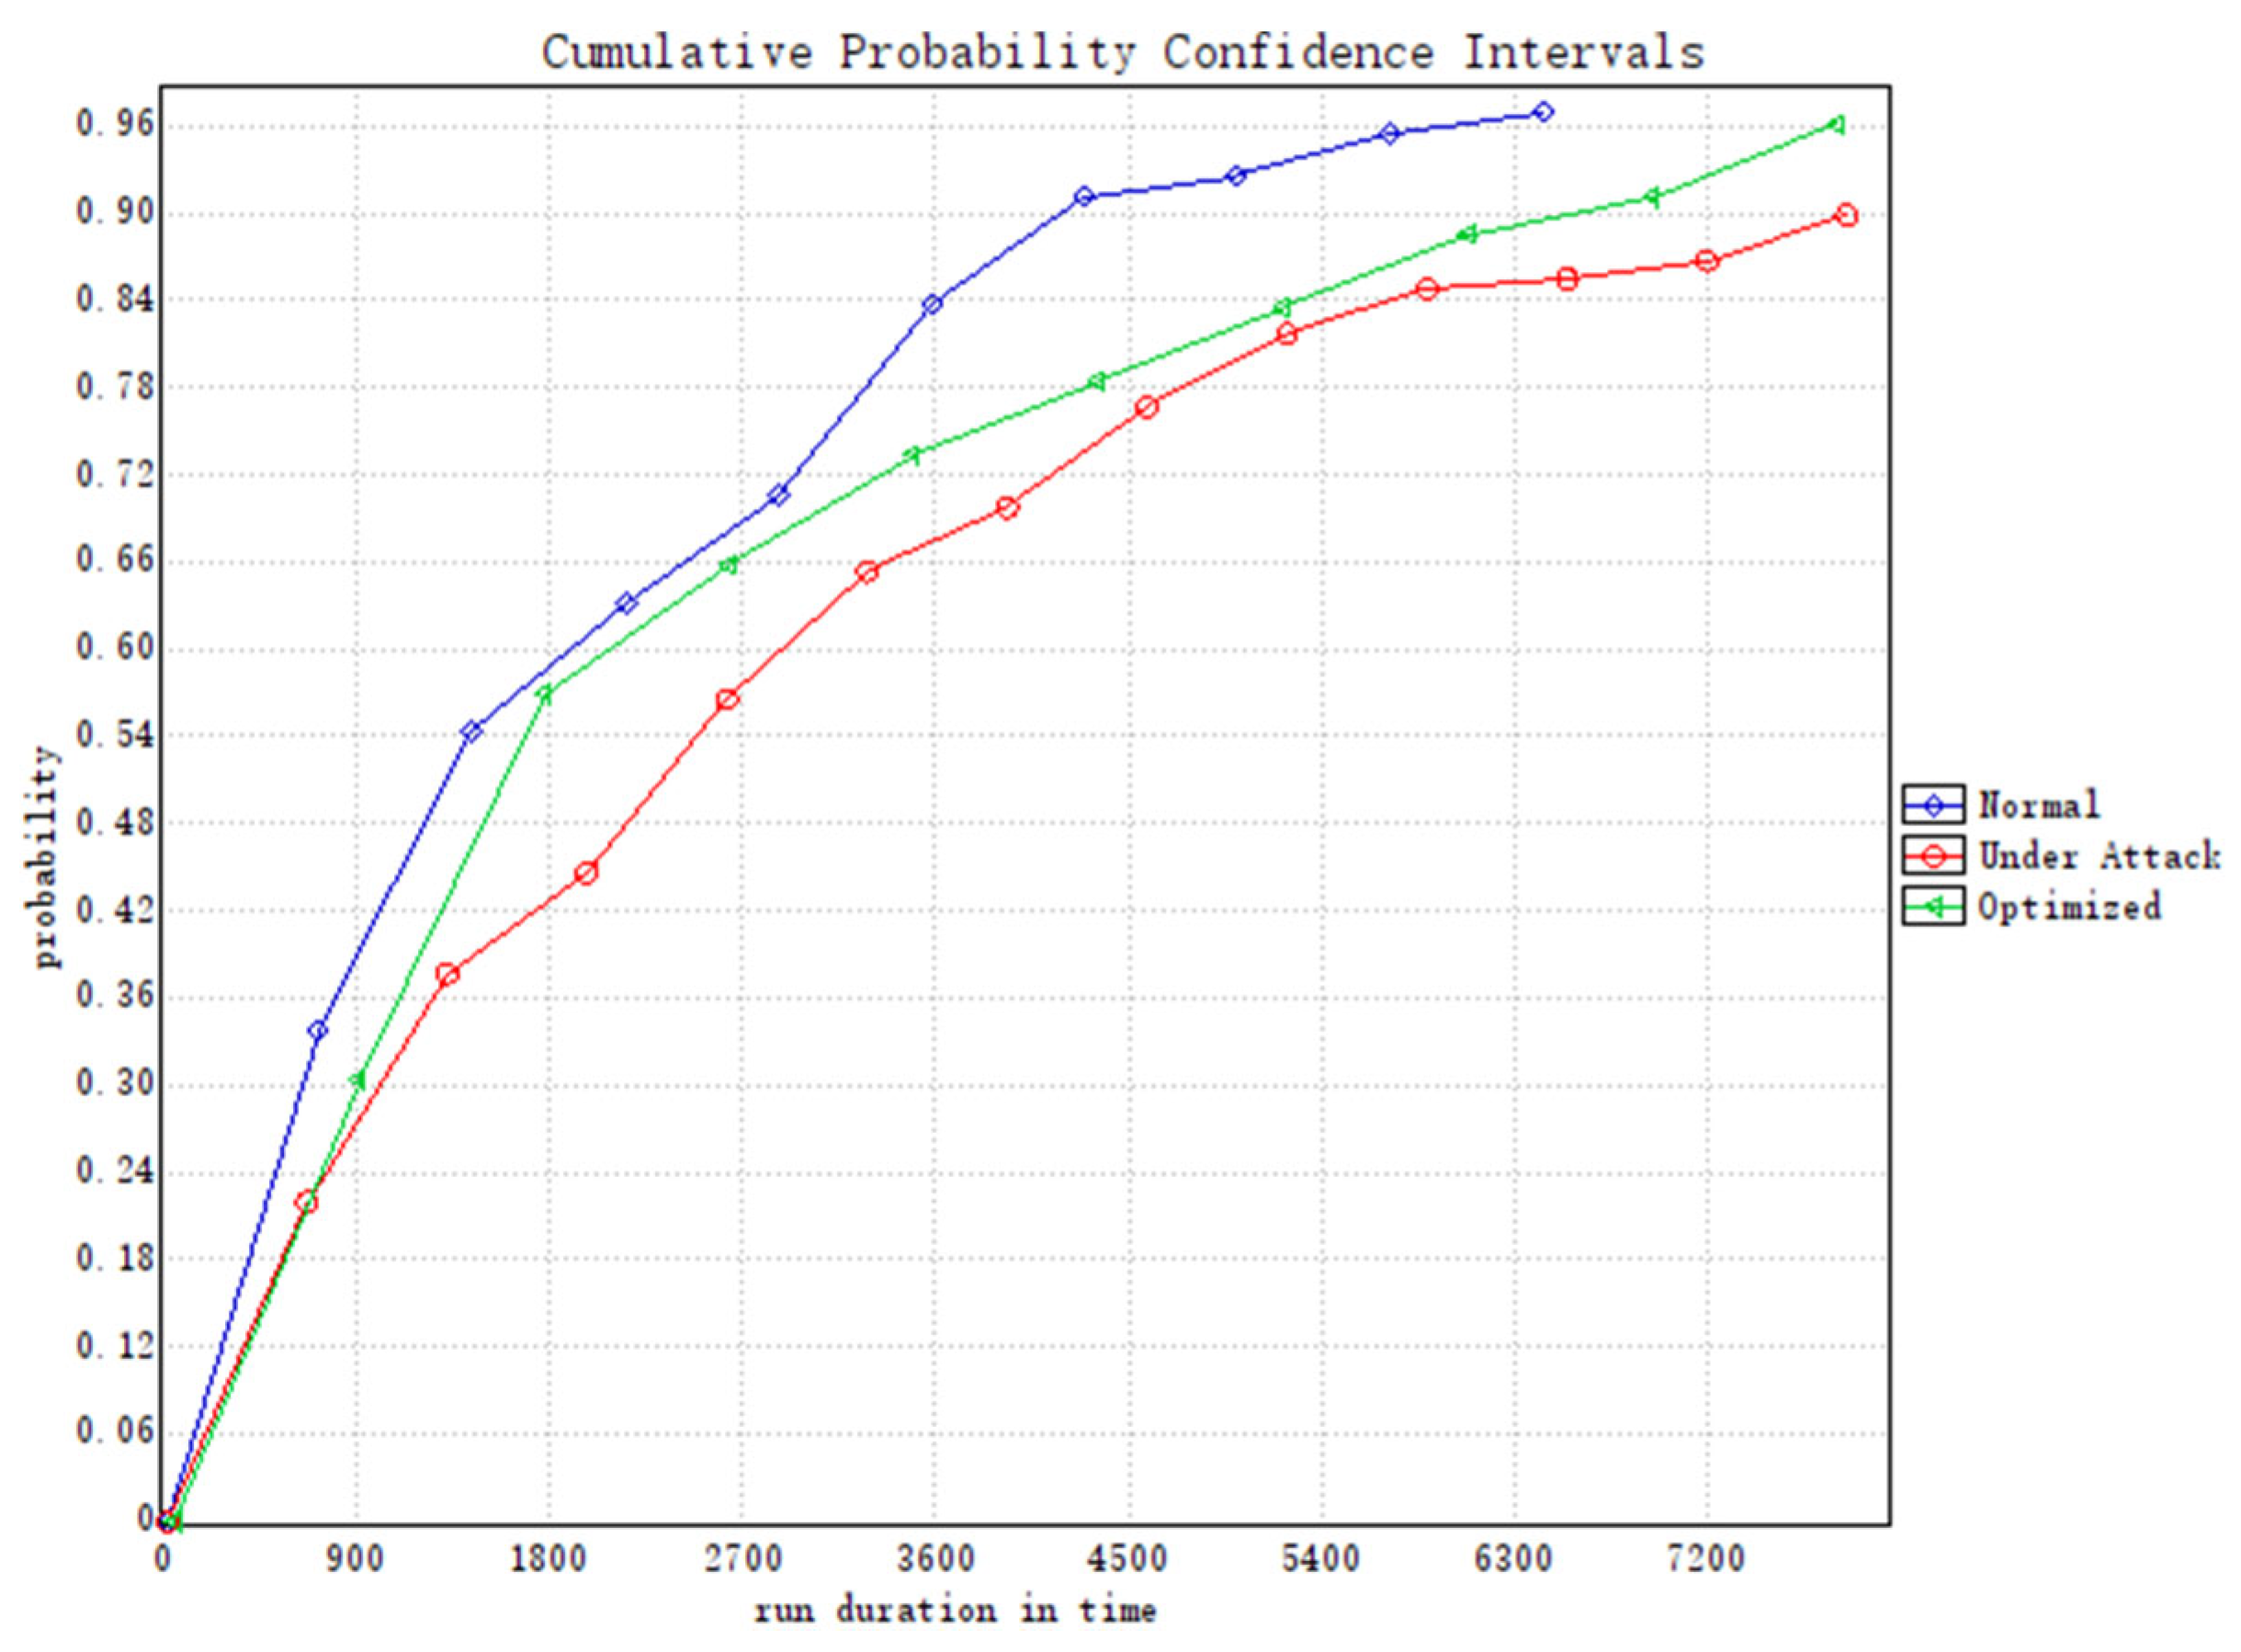
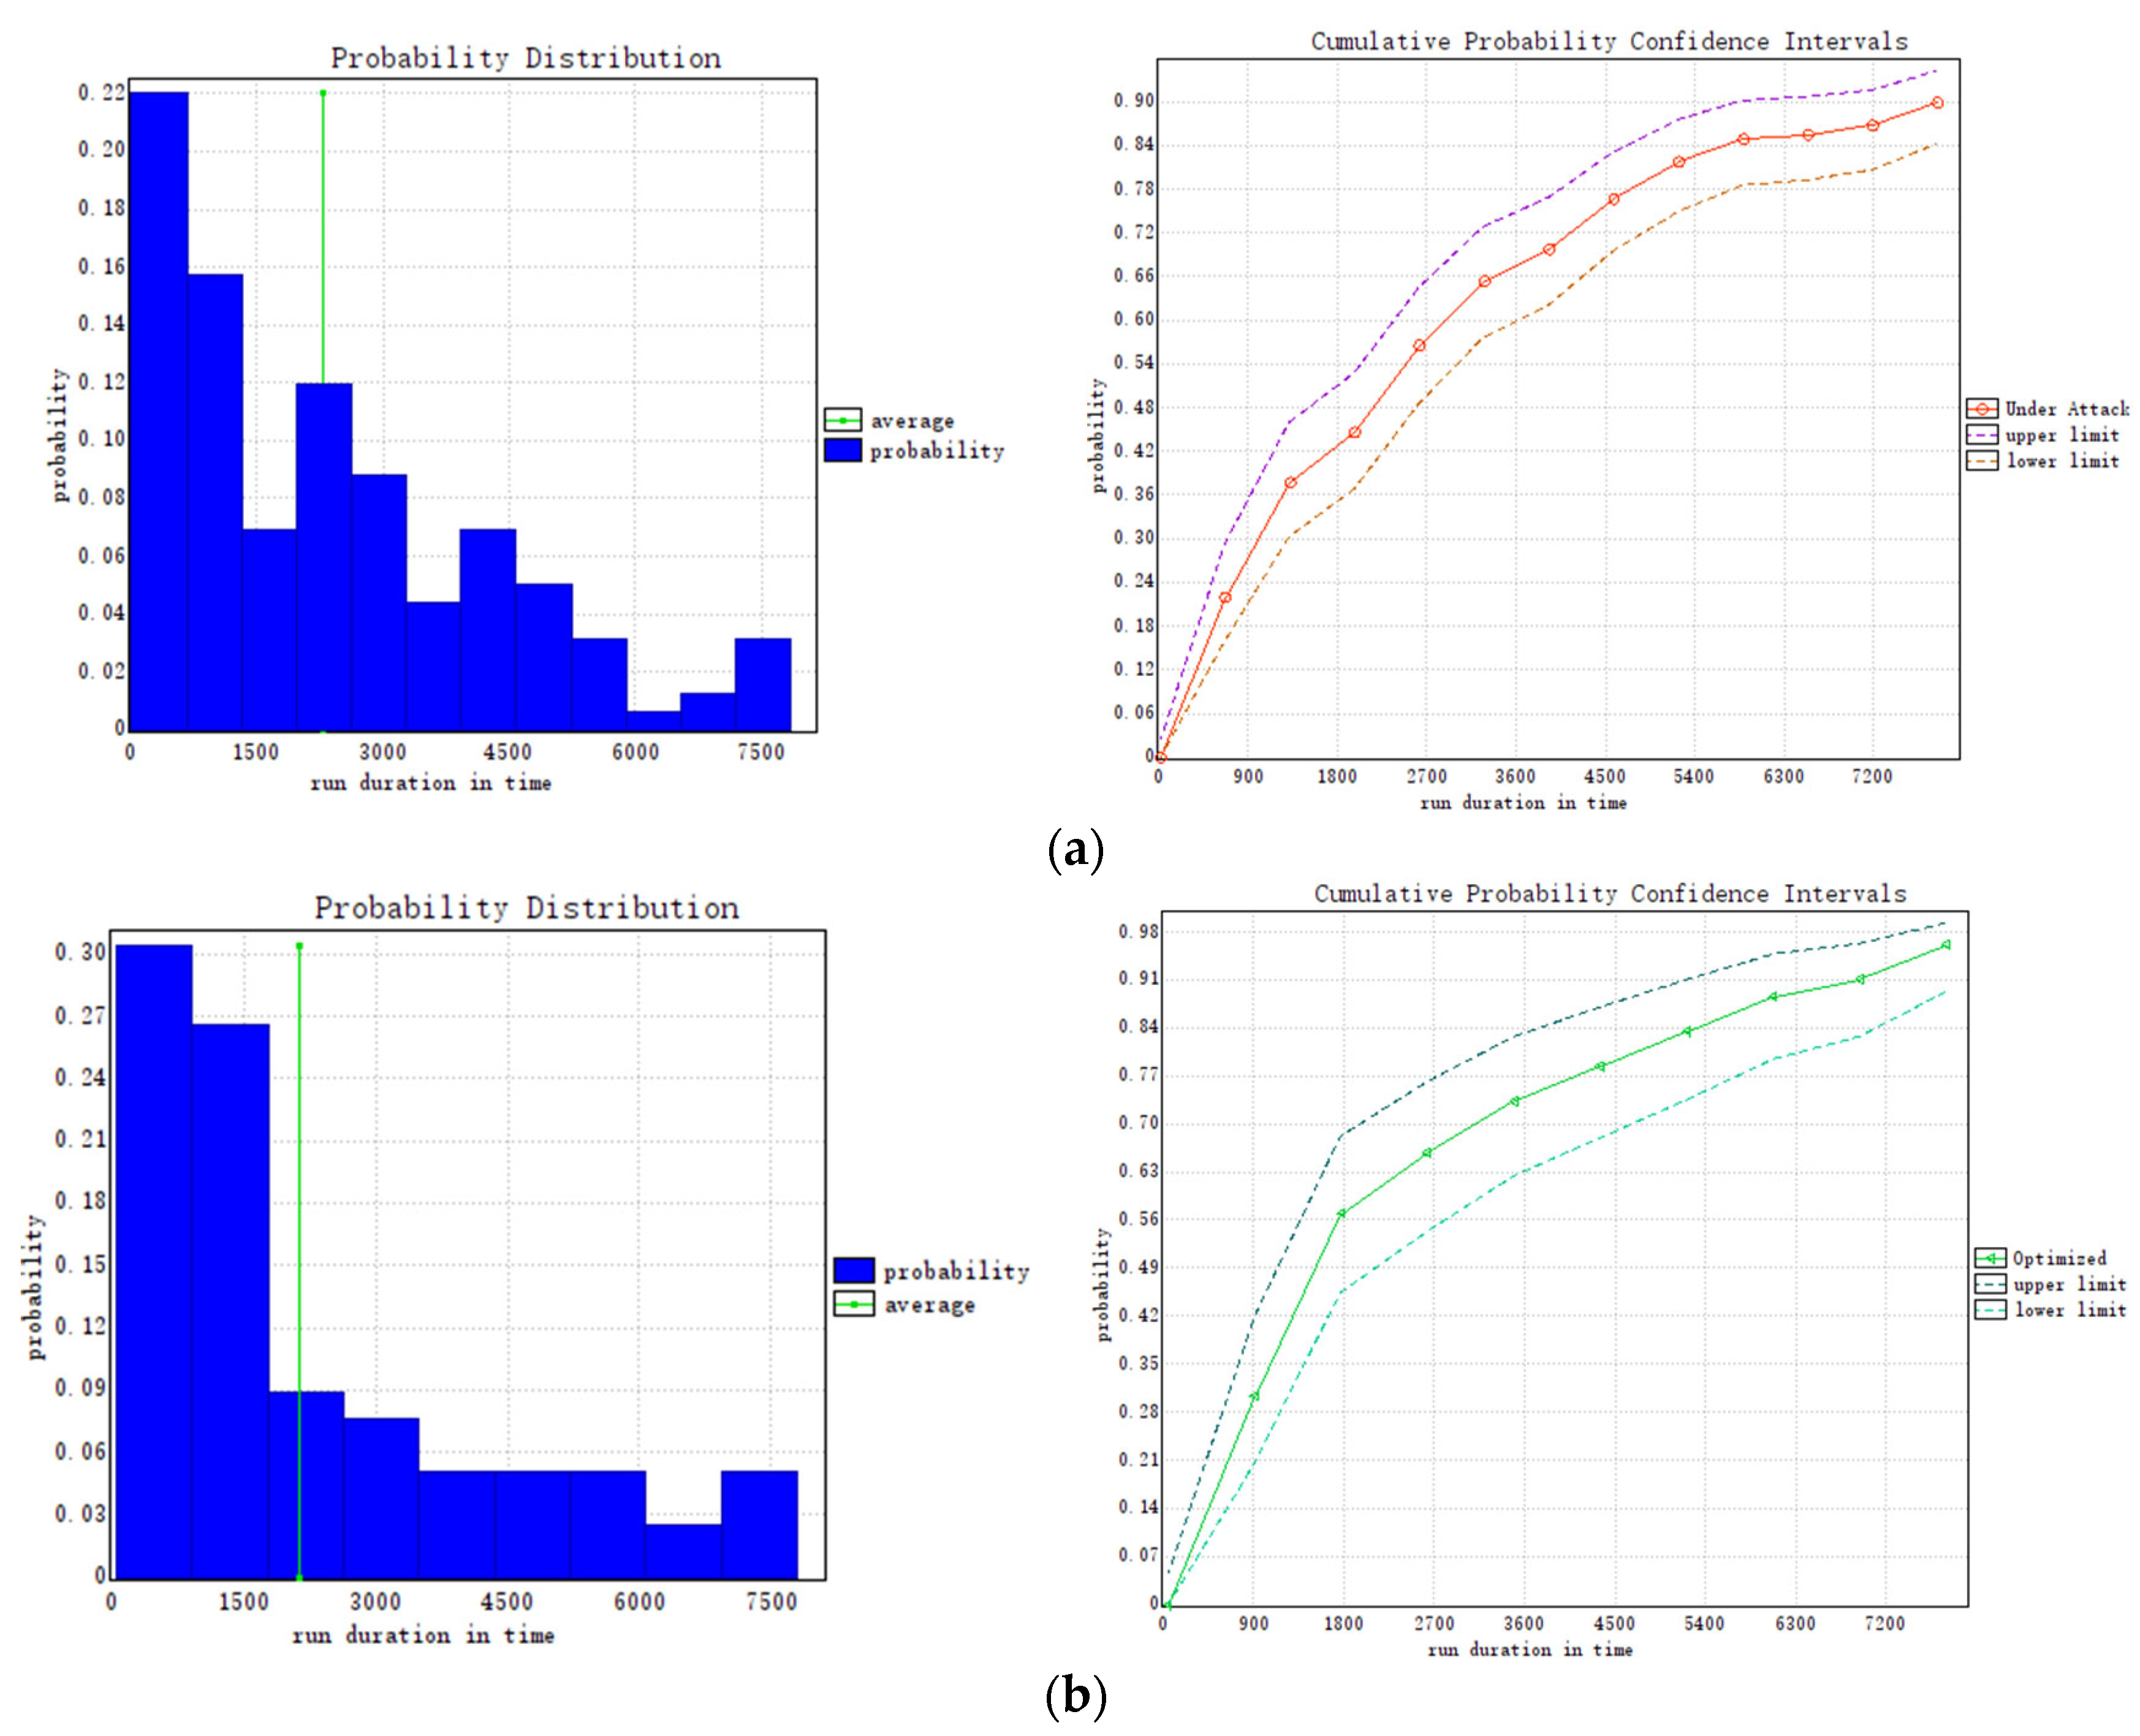
4.2. Anti-Attack Performance Analysis of the VACB Model
- Normal
- Under Attack
- Optimized
5. Conclusions
Author Contributions
Funding
Institutional Review Board Statement
Informed Consent Statement
Data Availability Statement
Conflicts of Interest
Nomenclature
| Abbreviations | |
| CAN | Controller Area Network |
| RNN | Recurrent Neural Network |
| VACB | The variable attacker with the CAN bus system |
| FMA-RNN | A formal modeling attacker using RNN |
| TA | Timed Automata |
| ATG | Attack Traffic Generation |
| GAN | Generative Adversarial Network |
| CPS | Cyber-Physical Systems |
| TEC | Transmit Error Counter |
| ACK | Acknowledge character |
| DoS | Denial of Service |
| ID | Identifier |
| DNNs | Deep Neural Network |
| CTL | Computation Tree Logic |
| Symbols | |
| Input at moment t | |
| Memory information at moment t | |
| Output at moment t | |
| K1 | Weight matrix from the input layer to the hidden layer of encoder |
| R1 | Weight matrix from the hidden layer to the output layer of encoder |
| y | Output matrix of encoder |
| Midbeam matrix between encoder and decoder | |
| K2 | Weight matrix from the input layer to the hidden layer of decoder |
| R2 | Weight matrix from the hidden layer to the output layer of decoder |
| True label value of the input at moment t | |
| Model predicted value | |
| canState | CAN bus state |
| ArbState | Arbitration state |
| txErr_Cnt | Transmission error count on the CAN bus |
| MSGType | CAN network message type |
| t_DataSend_Interval | Clock of data frame sending |
| t_Interval_Period | Interval between composite frames |
| t_Done_Time | Message’s maximum sending time |
| interval_UppLim | Maximum interval time between frames |
| t_DataSend | Clock of data transmission |
| time_Recover | Minimum time of the CAN bus recovery |
| reset_Time | Clock of the CAN bus resetting |
| reset_Period | Reset time of the CAN bus |
| rep_Time | Clock of the txNode(i) replying |
| t_UppLim | Upper limit of the reply time from the slave node |
| txNode(i) | Slave node on the CAN bus |
| msg[i][j] | CAN network packets |
| rep[i][j] | Reply Message Array |
| signal[i] | Signal flag bit on the CAN bus |
| arb[i][e] | Arbitration message e released by node i |
| list[n] | List of arbitration node |
References
- Thomas, J.; Davis, A.; Samuel, M.P. Integration-In-Totality: The 7th System Safety Principle Based on Systems Thinking in Aerospace Safety. Aerospace 2020, 7, 149. [Google Scholar] [CrossRef]
- Meng, Z.; Tang, T.; Wei, G.; Yuan, L. Analysis of ATO System Operation Scenarios Based on UPPAAL and the Operational Design Domain. Electronics 2021, 10, 503. [Google Scholar] [CrossRef]
- Clarke, E.M.; Wing, J.M. Formal Methods: State of the Art and Future Directions. ACM Comput. Surv. 1996, 28, 626–643. [Google Scholar] [CrossRef]
- Krakora, J.; Hanzalek, Z. Timed Automata Approach to CAN Verification. IFAC Proc. 2004, 37, 147–152. [Google Scholar] [CrossRef]
- Wang, R.; Guan, Y.; Li, X.; Zhang, R. Formal verification of CAN bus in cyber physical system. In Proceedings of the 2020 IEEE 20th International Conference on Software Quality, Reliability and Security Companion (QRS-C), Macau, China, 11–14 December 2020; pp. 249–255. [Google Scholar]
- Rodriguez-Navas, G.; Proenza, J.; Hansson, H. An UPPAAL model for formal verification of master/slave clock synchronization over the controller area network. In Proceedings of the 6th IEEE International Workshop on Factory Communication Systems, Torino, Italy, 28–30 June 2006. [Google Scholar]
- Pan, C.; Guo, J.; Zhu, L.; Shi, J.; Zhu, H.; Zhou, X. Modeling and Verification of CAN Bus with Application Layer Using UPPAAL. Electron. Notes Theor. Comput. Sci. 2014, 309, 31–49. [Google Scholar] [CrossRef] [Green Version]
- Meng, Y.; Li, X.J.; Guan, Y.; Wang, R.; Zhang, J. Modeling and verification for robot joint bus communication system. Ruan Jian Xue Bao/J. Softw. 2018, 29, 1699–1715. (In Chinese) [Google Scholar]
- Kim, J.H.; Jo, H.J.; Lee, I. Model Checking Resiliency and Sustainability of In-Vehicle Network for Real-Time Authenticity. Appl. Sci. 2021, 11, 1068. [Google Scholar] [CrossRef]
- Taylor, A.; Leblanc, S.; Japkowicz, N. Anomaly detection in automobile control network data with long short-term memory networks. In Proceedings of the 2016 IEEE International Conference on Data Science and Advanced Analytics (DSAA), Montreal, QC, Canada, 17–19 October 2016; pp. 130–139. [Google Scholar]
- Tanksale, V. Intrusion detection for controller area network using support vector machines. In Proceedings of the 2019 IEEE 16th International Conference on Mobile Ad Hoc and Sensor Systems Workshops (MASSW), Monterey, CA, USA, 4–7 November 2019; pp. 121–126. [Google Scholar]
- Song, H.M.; Woo, J.; Kim, H.K. In-Vehicle Network Intrusion Detection Using Deep Convolutional Neural Network. Veh. Commun. 2020, 21, 100198. [Google Scholar] [CrossRef]
- Seo, E.; Song, H.M.; Kim, H.K. GIDS: GAN based intrusion detection system for in-vehicle network. In Proceedings of the 2018 16th Annual Conference on Privacy, Security and Trust (PST), Belfast, Ireland, 28–30 August 2018; pp. 1–6. [Google Scholar]
- Koscher, K.; Czeskis, A.; Roesner, F.; Patel, S.; Kohno, T.; Checkoway, S.; McCoy, D.; Kantor, B.; Anderson, D.; Shacham, H. Experimental security analysis of a modern automobile. In Proceedings of the 2010 IEEE Symposium on Security and Privacy, Oakland, CA, USA, 16–19 May 2010; pp. 447–462. [Google Scholar]
- Huang, T.; Zhou, J.; Bytes, A. ATG: AN attack traffic generation tool for security testing of in-vehicle CAN bus. In Proceedings of the 13th International Conference on Availability, Reliability and Security, Hamburg, Germany, 27–30 August 2018; pp. 1–6. [Google Scholar]
- Hayward, J.; Tomlinson, A.; Bryans, J. Adding cyberattacks to an industry-leading can simulator. In Proceedings of the 2019 IEEE 19th International Conference on Software Quality, Reliability and Security Companion (QRS-C), Sofia, Bulgaria, 22–26 July 2019; pp. 9–16. [Google Scholar]
- Ring, M.; Dallmann, A.; Landes, D.; Hotho, A. IP2Vec: Learning similarities between IP addresses. In Proceedings of the 2017 IEEE International Conference on Data Mining Workshops (ICDMW), New Orleans, LA, USA, 18–21 November 2017; pp. 657–666. [Google Scholar]
- Ring, M.; Schlör, D.; Landes, D.; Hotho, A. Flow-Based Network Traffic Generation Using Generative Adversarial Networks. Comput. Secur. 2019, 82, 156–172. [Google Scholar] [CrossRef] [Green Version]
- Li, Y.; Liu, T.; Jiang, D.; Meng, T. Transfer-learning-based network traffic automatic generation framework. In Proceedings of the 2021 6th International Conference on Intelligent Computing and Signal Processing (ICSP), Xi’an, China, 9–11 April 2021; pp. 851–854. [Google Scholar]
- Cheng, Q.; Zhou, S.; Shen, Y.; Kong, D.; Wu, C. Packet-Level Adversarial Network Traffic Crafting Using Sequence Generative Adversarial Networks. arXiv 2021, arXiv:2103.04794v1. [Google Scholar]
- Rumelhart, D.E.; Hinton, G.E.; Williams, R.J. Learning Representations by Back-Propagating Errors. Nature 1986, 323, 533–536. [Google Scholar] [CrossRef]
- Hyötyniemi, H. Turing Machines Are Recurrent Neural Networks. Proc. STEP 1996, 96, 13–24. [Google Scholar]
- Manès, V.J.M.; Han, H.; Han, C.; Cha, S.K.; Egele, M.; Schwartz, E.J.; Woo, M. The Art, Science, and Engineering of Fuzzing: A Survey. IEEE Trans. Softw. Eng. 2019, 47, 2312–2331. [Google Scholar] [CrossRef] [Green Version]
- Behrmann, G.; David, A.; Larsen, K.G. A Tutorial on Uppaal 4.0; Aalborg University, Department of Computer Science: Aalborg, Denmark, 2006. [Google Scholar]
- Alur, R.; Dill, D.L. A Theory of Timed Automata. Theor. Comput. Sci. 1994, 126, 183–235. [Google Scholar] [CrossRef] [Green Version]
- Kang, E.-Y.; Mu, D.; Huang, L. Probabilistic verification of timing constraints in automotive systems using UPPAAL-SMC. In Proceedings of the International Conference on Integrated Formal Methods, Maynooth, Ireland, 3–4 September 2018; pp. 236–254. [Google Scholar]
- Lu, Y.; Sun, W.; Bai, G.; Sun, M. DeepAuto: A first step towards formal verification of deep learning systems. In Proceedings of the International Conference on Software Engineering and Knowledge Engineering, SEKE, Pittsburgh, PA, USA, 1–10 July 2021; Volume 2021, pp. 172–176. [Google Scholar]
- Tindell, K.; Burns, A.; Wellings, A.J. Calculating Controller Area Network (CAN) Message Response Times. Control Eng. Pract. 1995, 3, 1163–1169. [Google Scholar] [CrossRef]


| Attack Free | Dos | Fuzzy | Gear | RPM | ||
|---|---|---|---|---|---|---|
| Accuracy | 77.09% | 74.68% | 63.79% | 71.87% | 69.38% | |
| Precision | class 0 | 80.01% | 75.75% | 64.68% | 74.78% | 78.16% |
| class 1 | 77.79% | 81.04% | 74.20% | 81.05% | 67.47% | |
| class 2 | 87.97% | 88.73% | 80.86% | 91.36% | 83.21% | |
| class 3 | 68.26% | 63.13% | 65.03% | 60.95% | 63.73% | |
| class 4 | 72.78% | 67.77% | 64.64% | 67.29% | 71.52% | |
| class 5 | 69.63% | 66.52% | 69.77% | 66.03% | 66.19% | |
| class 6 | 83.12% | 83.37% | 81.26% | 86.72% | 56.30% | |
| class 7 | 86.29% | 83.36% | 77.00% | 75.34% | 74.71% | |
| class 8 | 92.79% | 89.93% | 80.99% | 89.77% | 66.33% | |
| class 9 | 85.85% | 84.17% | 80.87% | 83.01% | 64.03% | |
| class a | 97.28% | 91.19% | 90.86% | 94.23% | 89.45% | |
| class b | 88.48% | 84.20% | 79.75% | 77.70% | 77.92% | |
| class c | 74.01% | 74.88% | 90.87% | 63.79% | 47.97% | |
| class d | 88.09% | 89.41% | 82.92% | 56.68% | 76.46% | |
| class e | 94.39% | 94.35% | 75.43% | 82.60% | 52.14% | |
| class f | 83.14% | 97.24% | 86.95% | 73.01% | 44.15% | |
| average | 83.12% | 82.20% | 77.89% | 76.52% | 67.48% |
| UPPAAL | Description |
|---|---|
| msg_Num | Number of messages |
| msg[i][j] | Double dimensional array of CAN network packets |
| rep[i][j] | Reply message array |
| typedef cid_t | Custom types: txNode with id I; values are between 0 and N-1 |
| typedef mid_t | Message with id e; values are between 0 and msg_Num-1 |
| signal[i] | Initial signal flag bit on the CAN bus |
| canState | Predicate to indicate whether CAN bus is occupied or not |
| ArbState | Predicate to indicate whether arbitration is going on or not |
| arb[i][e] | Arbitration message e released by node i |
| t_UppLim | Upper limit of the reply time from the slave node |
| t_Done_Time | Maximum message sending time |
| txErr_Cnt | Transmission error count on the CAN bus |
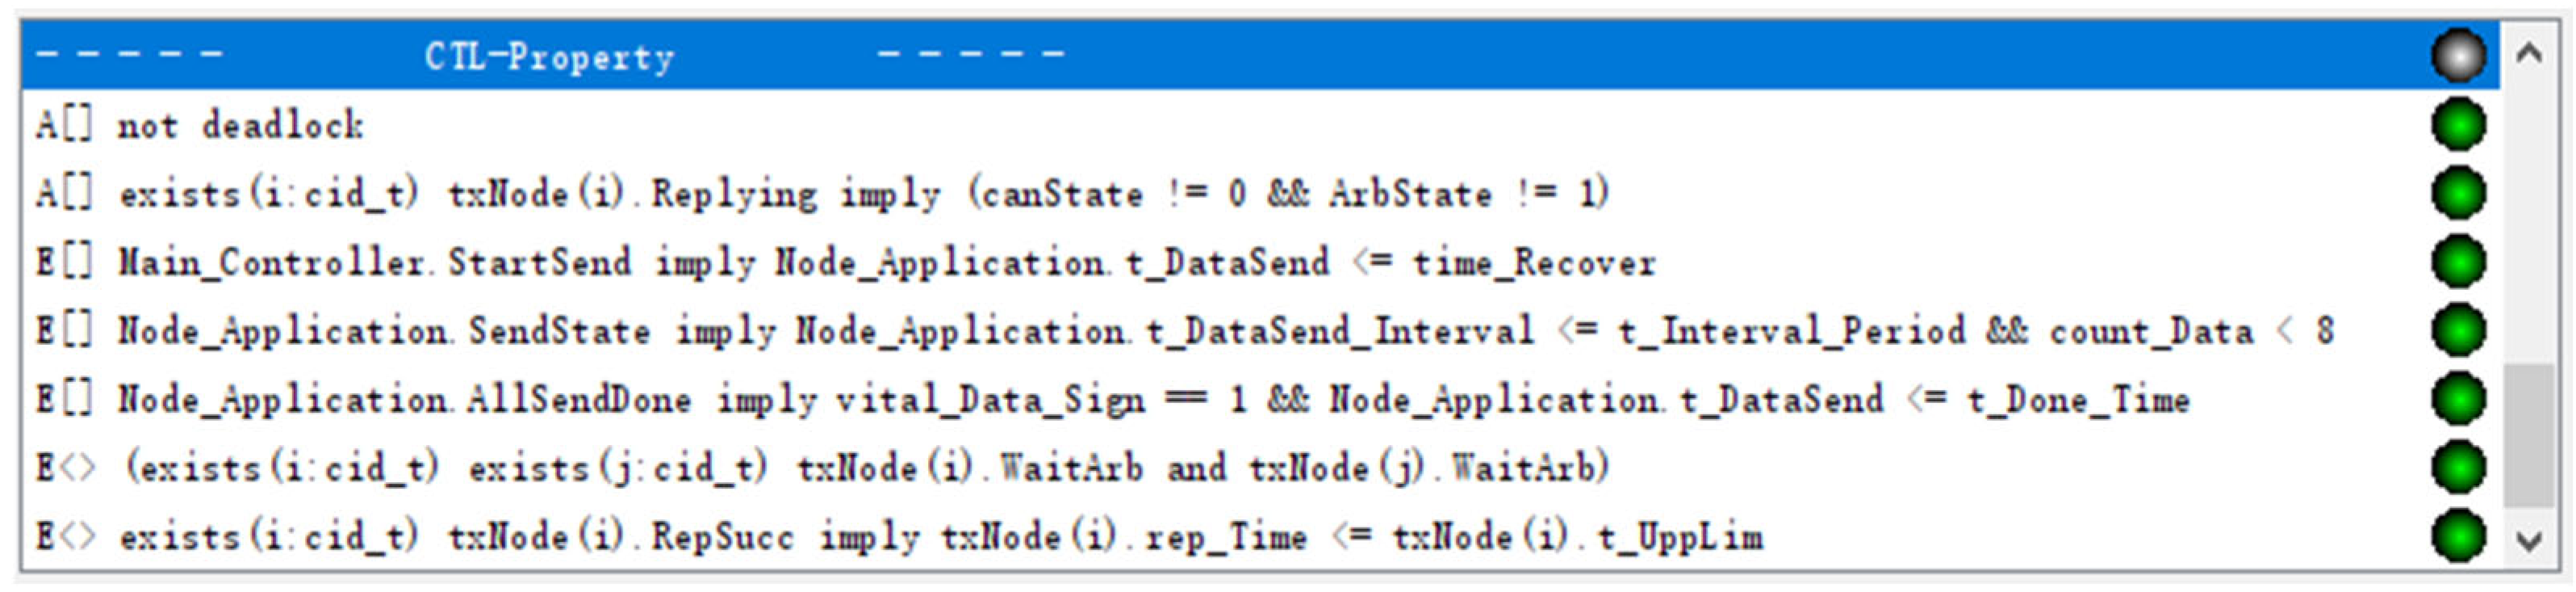
| No. | Verification Formula | Description |
|---|---|---|
| 1 | A[ ] not deadlock | No deadlock in the integrated model |
| 2 | A[] exists(i:cid_t) txNode(i).Replying imply (canState!= 0 && ArbState!= 1) | CAN bus is occupied and arbitration is over when any slave node is in response |
| 3 | E[] Main_Controller.StartSend imply Node_Application.t_DataSend <= time_Recover | Main controller message sent no more than time_Recover time units |
| 4 | E[] Node_Application.SendState imply Node_Application. t_DataSend_Interval <= t_Interval_Period && count_Data < 8 | The number of consecutive messages sent by the main controller meets the demand limit |
| 5 | E[] Node_Application.AllSendDone imply vital_Data_Sign == 1 && Node_Application.t_DataSend <= t_Done_Time | The node can complete the sending of all messages within the specified time |
| 6 | E<> (exists(i:cid_t) exists(j:cid_t) txNode(i).WaitArb and txNode(j).WaitArb) | Correctness of arbitration function in multi-node transfer conflict |
| 7 | E<> exists(i:cid_t) txNode(i).RepSucc imply txNode(i).rep_Time <= txNode(i).t_UppLim | Subordinate node can complete the response within the specified time |
| Type | Variable | Description | Value |
|---|---|---|---|
| Timing Constraints | wait_Period | Time the other node waits to arbitration | |
| time_Recover | Minimum time of the CAN bus recovery | ||
| reset_Period | Reset time of the CAN bus | ||
| t_Interval_Period | Interval between composite frames | ||
| interval_UppLim | Maximum interval time between frames | ||
| t_Done_Time | Message’s maximum sending time | ||
| t_UppLim | Upper limit of the reply time from the slave node | ||
| Number | Slave Node | Number of the slave node on the CAN bus | 4, 8, 16 |
| msg_Num, rep_Num | Number of CAN messages | 8, 16, 32 | |
| txErr_Cnt | Threshold of TEC | 90 | |
| Rate on Location | PrepareToReply | Exponential rate to the location PrepareToReply | (1 + id)/N*N, 1 |
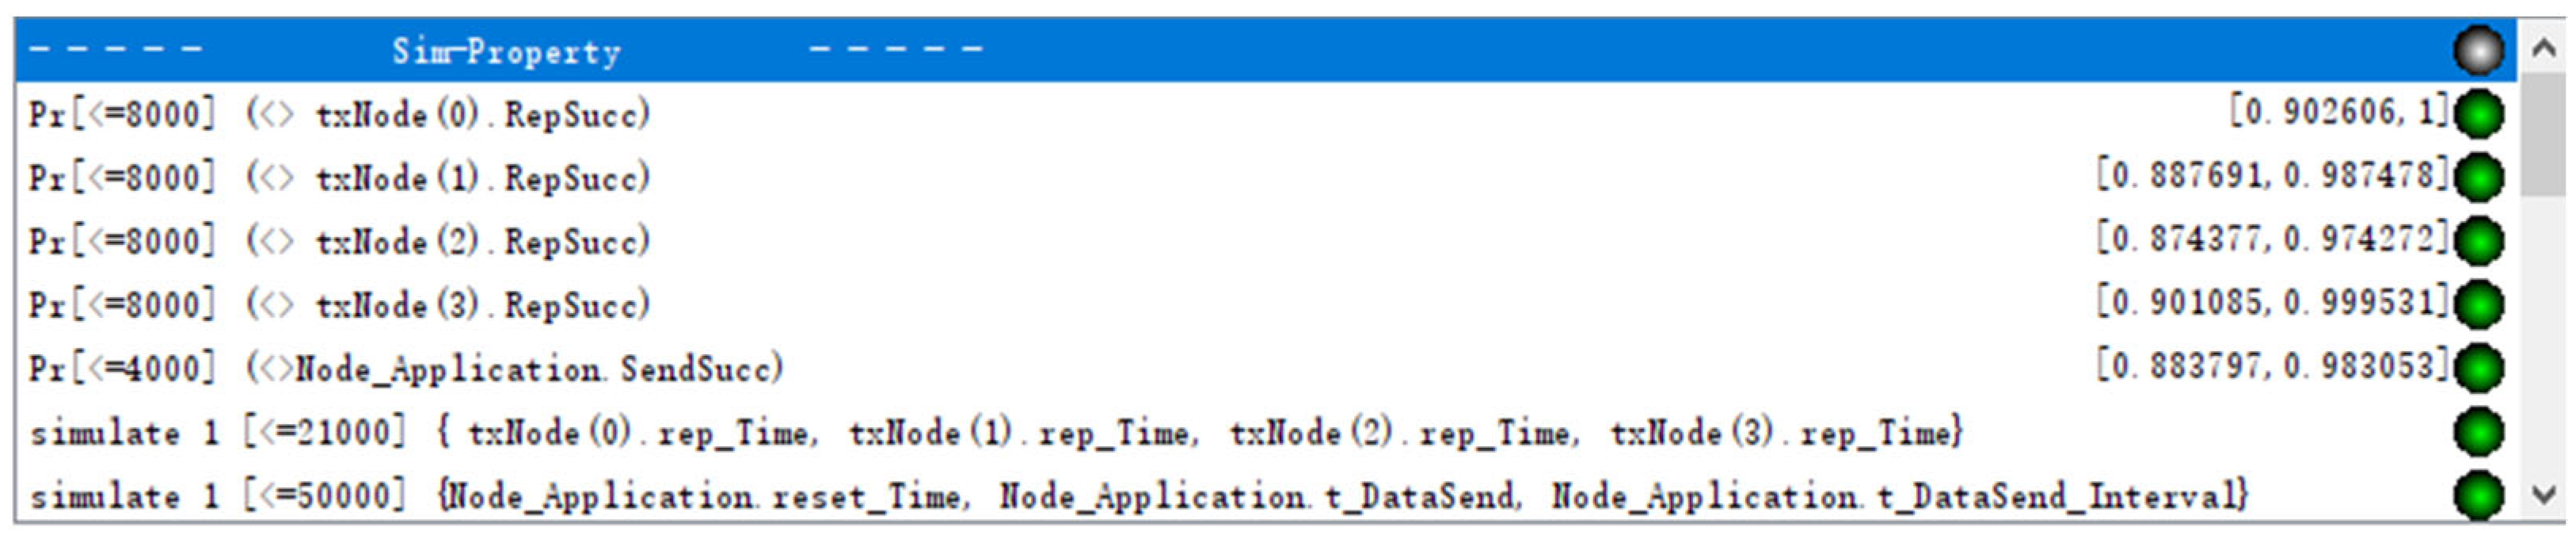
| No. | Simulation Formula | Description |
|---|---|---|
| 1 | simulate 1 [<=2000] {Node_Application.reset_Time, Node_Application.t_DataSend} | Simulation of the CAN bus application layer bus reset recovery time and transmission time |
| 2 | Pr[<=4000] (<>Node_Application.SendSucc) | Probability of reaching the successful sending location SendSucc |
| 3 | Pr[<=8000] (<> txNode(1).RepSucc) | Probability of a slave node reaching the successful response location RepSucc |
| Normal CAN Packets | Under FMA-RNN | Optimized (Under FMA-RNN) | ||
|---|---|---|---|---|
| Transmission Accuracy | Node_Application. SendSucc | [0.893009, 0.992099] | [0.874377, 0.974272] | [0.901085, 0.999531] |
| Successful Response Rate | txNode(0).RepSucc | [0.902606, 1] | [0.87865, 0.978536] | [0.896085, 1] |
| txNode(1).RepSucc | [0.897759, 0.996418] | [0.841731, 0.94138] | [0.894061, 0.993924] | |
| txNode(2).RepSucc | [0.874377, 0.974272] | [0.831933, 0.931764] | [0.870781, 0.970278] | |
| txNode(3).RepSucc | [0.870781, 0.970278] | [0.816972, 0.916916] | [0.866689, 0.966276] |
Publisher’s Note: MDPI stays neutral with regard to jurisdictional claims in published maps and institutional affiliations. |
© 2022 by the authors. Licensee MDPI, Basel, Switzerland. This article is an open access article distributed under the terms and conditions of the Creative Commons Attribution (CC BY) license (https://creativecommons.org/licenses/by/4.0/).
Share and Cite
Wang, Y.; Zhou, Q.; Zhang, Y.; Zhang, X.; Du, J. A Formal Modeling and Verification Scheme with an RNN-Based Attacker for CAN Communication System Authenticity. Electronics 2022, 11, 1773. https://doi.org/10.3390/electronics11111773
Wang Y, Zhou Q, Zhang Y, Zhang X, Du J. A Formal Modeling and Verification Scheme with an RNN-Based Attacker for CAN Communication System Authenticity. Electronics. 2022; 11(11):1773. https://doi.org/10.3390/electronics11111773
Chicago/Turabian StyleWang, Yihua, Qing Zhou, Yu Zhang, Xian Zhang, and Jiahao Du. 2022. "A Formal Modeling and Verification Scheme with an RNN-Based Attacker for CAN Communication System Authenticity" Electronics 11, no. 11: 1773. https://doi.org/10.3390/electronics11111773