Article

Diagnostic Evaluation of Policy-Gradient-Based Ranking

1
Faculty of Library, Information and Media Science, University of Tsukuba, 1-2 Kasuga, Tsukuba 305-8550, Japan
2
School of Computer Science and Technology, Dalian University of Technology, No. 2 Linggong Road, Ganjingzi District, Dalian 116024, China
3
Faculty of Engineering, University of Tokushima, 2-1 Minami Josanjima, Tokushima 770-8506, Japan
*
Author to whom correspondence should be addressed.
Electronics 2022, 11(1), 37; https://doi.org/10.3390/electronics11010037
Submission received: 18 November 2021 / Revised: 15 December 2021 / Accepted: 20 December 2021 / Published: 23 December 2021
(This article belongs to the Topic Machine and Deep Learning)

Abstract

:
Learning-to-rank has been intensively studied and has shown significantly increasing values in a wide range of domains, such as web search, recommender systems, dialogue systems, machine translation, and even computational biology, to name a few. In light of recent advances in neural networks, there has been a strong and continuing interest in exploring how to deploy popular techniques, such as reinforcement learning and adversarial learning, to solve ranking problems. However, armed with the aforesaid popular techniques, most studies tend to show how effective a new method is. A comprehensive comparison between techniques and an in-depth analysis of their deficiencies are somehow overlooked. This paper is motivated by the observation that recent ranking methods based on either reinforcement learning or adversarial learning boil down to policy-gradient-based optimization. Based on the widely used benchmark collections with complete information (where relevance labels are known for all items), such as MSLRWEB30K and Yahoo-Set1, we thoroughly investigate the extent to which policy-gradient-based ranking methods are effective. On one hand, we analytically identify the pitfalls of policy-gradient-based ranking. On the other hand, we experimentally compare a wide range of representative methods. The experimental results echo our analysis and show that policy-gradient-based ranking methods are, by a large margin, inferior to many conventional ranking methods. Regardless of whether we use reinforcement learning or adversarial learning, the failures are largely attributable to the gradient estimation based on sampled rankings, which significantly diverge from ideal rankings. In particular, the larger the number of documents per query and the more fine-grained the ground-truth labels, the greater the impact policy-gradient-based ranking suffers. Careful examination of this weakness is highly recommended for developing enhanced methods based on policy gradient.

1. Introduction

Learning-to-rank has long been studied, with applications spanning across many fields, such as web search, dialogue systems, and computational biology [1]. In this paper, we focus on the field of document retrieval. Following the Cranfield experimental paradigm, a large number of queries are provided. Each query is associated with a set of documents to be ranked, for which the standard relevance labels are also included. Each query–document pair is represented through a feature vector. The desired scoring model (or function) assigns a score to each document, then a ranked list of documents can be obtained by sorting the documents in descending order of scores. In general, the document with the highest score is assigned a rank of 1. In other words, the rank position of a document represents its relevance with respect to the query. The metrics, such as average precision (AP) and normalized discounted cumulative gain (nDCG) [2], are adopted to measure the performance. The information retrieval (IR) community has experienced a flourishing development of learning-to-rank methods, such as pointwise methods [3,4,5], pairwise methods [6,7,8,9], and listwise methods [10,11,12,13,14,15,16,17,18,19,20,21].
Recently, due to the breakthrough successes of neural network-based models, significant efforts [22,23,24,25,26,27,28,29,30,31,32,33,34,35,36] have been made in exploring how to deploy popular techniques, such as reinforcement learning and adversarial learning, to solve ranking problems (we refer the reader to Section 2 for a brief overview). Despite the successes achieved by the aforementioned studies, fundamental research questions remain open. First, armed with these popular techniques, most studies tend to show how effective a new method is. A comprehensive comparison of methods and an in-depth analysis of their deficiencies are somehow overlooked. Second, in the context of web search, the previous methods [22,26,30,32] are evaluated over small datasets. As a result, this makes it difficult to gain a solid understanding of the pros and cons of these techniques in solving ranking problems, which may hinder research progress in developing further improved ranking models. In view of the fact that the aforesaid techniques are bound to attract more attention moving forward, the aforementioned shortcomings motivated us to conduct a diagnostic evaluation of the newly proposed ranking methods based on popular techniques, such as reinforcement learning and adversarial learning. We have empirically found that these methods boil down to policy-gradient-based optimization. Hereafter, we refer to these methods as policy-gradient-based ranking. The main contributions of this paper are summarized as follows:
(1) Regarding adversarial learning-to-rank, we propose how to perform listwise adversarial ranking. By filling this gap, we are able to comprehensively investigate the effectiveness of adversarial learning-to-rank by comparing pointwise, pairwise, and listwise adversarial ranking methods.
(2) Although the newly proposed ranking methods are based on either reinforcement learning or adversarial learning, we uniformly view them as policy-gradient-based ranking. From this viewpoint, we analytically identify the differences, connections, and weaknesses of policy-gradient-based ranking methods.
(3) Based on widely used benchmark collections, such as MSLRWEB30K and Yahoo-Set1, we experimentally compare a wide range of representative methods spanning popular techniques, such as reinforcement learning and adversarial learning, to conventional ranking models. The experimental results echo our theoretical analysis and show that: (1) Policy gradient-based ranking methods are inferior to conventional ranking methods, such as ListMLE, LambdaRank, and LambdaMART. The failures are largely attributable to the gradient estimation based on sampled rankings that significantly diverge from ideal rankings. (2) The larger the number of documents per query and the more fine-grained the ground-truth labels, the greater the impact policy-gradient-based ranking suffers.
The remainder of the paper is structured as follows: In Section 2, we survey prior studies on learning-to-rank, especially the recent methods based on policy gradient. In Section 3, we outline the mathematical formulation of the Cranfield learning-to-rank paradigm. In Section 4, we present representative ranking models based on policy gradient and discuss their differences and weaknesses. In Section 5, we introduce the experimental setup. A series of experiments is discussed in Section 6. We conclude the paper in Section 7.

2. Related Work

Learning-to-rank refers to a broad range of approaches that aim to tackle ranking problems using machine learning techniques. In this section, we limit the related work to method- based neural networks and further distinguish them into neural conventional learning-to-rank, neural learning-to-rank, BERT-based learning-to-rank, and policy-gradient-based ranking.
Conventional learning-to-rank approaches can be classified into three categories: pointwise, pairwise, and listwise. The key distinctions are the underlying hypotheses, loss functions, and the input and output spaces. The typical pointwise approaches include regression-based [3], classification-based [37], and ordinal regression-based algorithms [4,5]. The loss functions of these algorithms are defined on the basis of each individual document. The pairwise approaches concern the relative order between two documents. The goal of learning is to maximize the number of correctly ordered document pairs. The assumption is that the optimal ranking of documents can be achieved if all document pairs are correctly ordered. Towards this end, many representative methods have been proposed [6,7,8,38,39]. The listwise approaches take all the documents associated with the same query in the training data as the input. In particular, there are two types of loss functions when performing listwise learning. For the first type, the loss function is related to a specific evaluation metric (e.g., nDCG [2] and expected reciprocal rank (ERR) [40]). Due to the non-differentiability and non-decomposability of the commonly used metrics, the methods of this type either try to optimize the upper bounds as surrogate objective functions [10,11,12] or approximate the target metric using some smooth functions [13,14,15]. For the second type, the loss function is not explicitly related to a specific evaluation metric. The loss function reflects the discrepancy between the predicted ranking and the ground-truth ranking. Example algorithms include [17,18,20]. Although no particular evaluation metrics are directly involved and optimized here, it is possible that the learned ranking function can achieve good performance in terms of evaluation metrics. We refer the reader to the following studies [41,42] for a detailed review. In view of the successful applications of deep learning and the availability of well-maintained libraries for efficient development of deep learning techniques (e.g., PyTorch and TensorFlow), it has become a popular choice to use deep neural networks as the basis to construct a scoring function when evaluating the above conventional learning-to-rank approaches, which are referred to as neural conventional learning-to-rank (NC-LTR) hereafter. We note that this is also our choice in this work.
Inspired by the recent advances in neural networks [43] and their wide applications, such as computer vision [44,45,46] and natural language processing [47,48], there has been significant interest in designing end-to-end ranking models based on neural networks [48,49,50,51,52,53], which are referred to as neural learning-to-rank (N-LTR). For example, the ranking models, such as DSSM [49] and CDSSM [50], map both queries and documents into the same semantic space based on deep neural networks. The relevance score between a query and a document is assumed to be proportional to the cosine similarity between their corresponding vectors in the semantic space. The follow-up studies [48,51,52,53,54] look into the inherent characteristics of information retrieval. The DRMM model by Guo et al. [51] takes into account more factors, such as query term importance, exact matching signals, and diverse matching requirement. The methods such as [48,52,53] first look at the local interactions between two texts, then design different network architectures to learn more complicated interaction patterns for relevance matching. We refer the reader to [55,56] for an overview of N-LTR models.
Coming after the above N-LTR methods is the “BERT revolution” for text ranking. There are a number of studies [57,58,59] that explore how to fine-tune the bidirectional encoder representations from transformers (BERT) model [47] to advance the ranking performance, e.g., for the passage re-ranking task based on MS MARCO. To reconcile efficiency and contextualization, ColBERT [60] is proposed by introducing a late interaction architecture that independently encodes the query and the document. In this paper, we focus on datasets consisting of feature vectors and refer the reader to the study in [61] for a comprehensive overview of BERT-based learning-to-rank.
Recently, significant efforts [22,23,24,25,26,27,28,29,30,31,32,33,34,35,36] have been made to develop new methods by deploying popular techniques, such as reinforcement learning and adversarial learning, to solve ranking problems, where policy gradient is a core component during the optimization process. For example, Wei et al. [22] formulated the construction of a document ranking system as a sequential decision-making process based on the Markov decision process (MDP). Zou et al. [23] further explored the effectiveness of multi-agent MDP, where the mutual interactions among documents were incorporated in the ranking process. In order to achieve better gradient estimation, Xu et al. [28] proposed the pairwise policy gradient algorithm, in which the gradients are determined using pairwise comparisons of two document lists sampled within the same query. Yao et al. [29] investigated the potential value in deploying reinforcement learning for personalized searches. Singh and Joachims [26] focused on the problem of exposure fairness in rankings, where optimization still relies on policy gradient. Inspired by the generative adversarial networks (GAN) [45] and its variants, Wang et al. [30] proposed IRGAN, which extends the GAN framework to learn a scoring function in an adversarial manner. Subsequent studies [32] generate more difficult adversarial negative examples from the adversarially sampled negative examples. Different from the aforementioned studies, He et al. [31] explored how to add adversarial perturbations to model parameters so as to enhance the robustness of a recommender model and thus improve its generalization performance. Further studies [33,34,35] investigated the effectiveness of adversarial optimization in image searches. Regarding learning-to-rank based on adversarial learning, we are not aware of any listwise approaches to date. As a result, this makes it difficult to fully understand the effectiveness of adversarial learning-to-rank. For example, a natural question might be the effect of listwise sampling (rather than pointwise or pairwise sampling) on performance. Moreover, given different kinds of methods based on either reinforcement learning or adversarial learning, there is no work that uniformly compares these methods and thoroughly investigates their deficiencies. Our work aims to fill this gap by conducting a comprehensive comparison and an in-depth analysis of policy-gradient-based ranking methods.

3. Cranfield Learning-to-Rank

In this section, we formulate the learning-to-rank problem by following the Cranfield paradigm. Let Q and D be the query space and the document space, respectively. We use Φ : Q × D Z R d to denote the mapping function for generating a feature vector for a document under a specific query context, where Z represents the d-dimensional feature space. We use T R to denote the space of the ground-truth labels each document receives. Thus, for each query, we have a list of document feature vectors x = ( x 1 , , x m ) X Z m and a corresponding list y * = ( y 1 * , , y m * ) Y T m of ground-truth labels. The subscript i, like x i or y i * , denotes the i-position in the list. In practice, we get independently and identically distributed (i.i.d) samples S = { ( x j , y j * ) } j = 1 N from an unknown joint distribution P ( · , · ) over X × Y . A ranking of π on m documents x = ( x 1 , , x m ) is defined as a permutation of x . π ( i ) / π ( x i ) yields the rank position of the i-th document within x . π 1 ( k ) yields the index within x of the document at rank position k, where π 1 ( π ( i ) ) = i or π 1 ( π ( x i ) ) = i . Since we are interested in sorting documents in descending order according to their relevance, we think of higher positions with smaller rank values as being more favorable. An ideal ranking (denoted as π ^ ) refers to the optimal ranking of documents that are sorted according to their real relevance to the query under consideration. We note that there are multiple ideal rankings for a query when we use graded relevance labels due to label ties. We use f θ : x R m with parameters θ to denote the real-value scoring function, which assigns each document a score. In the following, we will omit θ if the context provides sufficient clarity. The scores of the documents associated with the same query, i.e.,  y = f ( x ) = ( f ( x 1 ) , f ( x 2 ) , , f ( x m ) ) , are used to sort the documents.
Commonly, we measure the quality of ranking documents for a query using f with a loss function of R ( f ( x ) , y * ) . We would like to learn the optimal scoring function over a hypothesis space F of ranking functions that can minimize the expected risk as below:
min f F ( f ) = min f F X × Y R ( f ( x ) , y * ) d P ( x , y * )
Unfortunately, ( f ) is intractable to optimize directly and the joint distribution is unknown, so instead we appeal to the empirical risk minimization method to approximate the expected risk as follows:
min f F ˜ ( f ; S ) = min f F 1 N j = 1 N R ( f ( x j ) , y j * )
Given the above general framework, different formulations of the loss function yield different ranking methods. Next we show ListMLE which is highly relevant to policy-gradient-based ranking.

ListMLE

In ListMLE [18], the training objective is to maximize the likelihood of observing the ideal ranking with respect to each query:
R L i s t M L E ( f ( x ) , y * ) = log P ( π ^ | x , θ ) = log i = 1 m exp ( f ( x π ^ 1 ( i ) ) ) b = i m exp ( f ( x π ^ 1 ( b ) ) )
P ( π ^ | x , θ ) represents the probability of observing the optimal ranking, which is formulated based on the Plackett–Luce model [62]. During optimization, π ^ can be obtained according to the standard labels. For graded relevance labels with ties, the authors randomly selected one ideal ranking when there were multiple ideal rankings.

4. Policy-Gradient-Based Ranking

In this section, we detail a number of recently published methods for ranking [22,23,26,30,32], where policy gradient is a key component during the optimization process. Furthermore, we show how to perform adversarial learning-to-rank in a listwise manner. Finally, we reveal the differences and connections among policy-gradient-based ranking methods.

4.1. Expected Utility

This class of methods [14,26,63,64] focuses on maximizing the expected utility of rankings. An alternative minimization formulation can be given as:
R E U ( f ( x ) , y * ) = E π P θ ( π | q ) [ M ( π , y * ) ] ,
where P θ ( π | q ) denotes the distribution of all rankings with respect to q, defined by the scoring function f with parameters θ . M denotes the utility of π . The common choices for M are ranking metrics ()such as average precision) nDCG, and ERR. Note that computing the gradient w.r.t. θ over the expectation in Equation (4) is intractable, since the space of rankings is exponential in cardinality. To overcome this issue, there are two types of methods. The first type [14,64] casts Equation (4) into individual document–rank distributions. In this work, we focus on the second type [26,63], which rely on policy gradient, which is referred to as ExptUtility. Specifically, the score function estimator [65] makes use of the identity θ p ( z ) = p ( z ) θ log p ( z ) , and the gradient (also known as policy gradient) can be derived as follows:
θ E π P θ ( π | q ) [ M ( π , y * ) ] = E π P θ ( π | q ) [ θ log P θ ( π | q ) M ( π , y * ) ] 1 K k = 1 K θ log P θ ( π k | q ) M ( π k , y * )
Namely, the gradient of the expected value of the metric over rankings sampled from P θ ( π | q ) can be derived as the expectation of the gradient of the log probability of each sampled ranking multiplied by the metric value of the corresponding ranking. For the last step, the gradient is computed using the Monte–Carlo approximation, where π k represents the k-th sample ranking.
Taking the recent work by Singh and Joachims [26] as an example, they formulate P θ ( π | q ) based on the Plackett–Luce model. Compared with ListMLE, the key difference is that it involves a sampling process. Specifically, the sampling of π is conducted using the following sequential process: First, the probability of selecting a document x k to the first rank position is proportional to exp ( f ( x k ) ) i = 1 m exp ( f ( x i ) ) . Second, once the first document is selected, the second document to fill the next rank position will be selected from the remaining documents in the same way. Third, the process repeats until m documents are selected. We refer to this sampling process as PL-sampling.

4.2. Reinforcement Learning-to-Rank

According to the MDPRank method [22], the process of document ranking can be viewed as a Markov Decision Process (MDP). Specifically, for a query q, a document ranking can be obtained via sequential decision making. At the beginning, the system is set as s 0 = [ 0 , X 0 ] . Namely, the initial state is represented as the step zero and the set of all candidate documents ( | X 0 | = m , where m is the ranking size). At each time step t, the agent receives the state s t = [ t , X t ] . Based on the policy P ( a t | s t ; θ ) , the agent takes an action a t by selecting a document x from X t and placing the document at position t. As a result, the agent receives an immediate reward r t . The long-term return at time step t is defined as the accumulative reward, G t = i = 1 m t γ i 1 r t + i , where γ is the discount rate, and r is defined as the gain value of the selected document according to the metric nDCG. Thus G t essentially corresponds to the discounted cumulative gain (DCG) value. Then, the process moves to the next step t + 1 , and the state becomes s t + 1 = [ t + 1 , X t + 1 ] = [ t + 1 , X t \ { x } ] . The process is repeated until all of the candidate documents are ranked. Due to space constraints, for a detailed description of MDPRank, we refer the reader to the work [22].
The core of policy P ( a t | s t ; θ ) is a scoring function with parameters θ . It quantifies the probability of selecting a document x i from X t as exp ( f ( x i ) ) x j X t exp ( f ( x j ) ) . In other words, the construction of document ranking boils down to Plackett–Luce-flavored sequence generation, namely PL-sampling. Finally, the learning objective is formulated as maximizing the expected long term return from the beginning:
J ( θ ) = E π P θ ( π | q ) [ G ( π ) ]
where G ( π ) denotes the long-term return of the sampled ranking, namely G ( π ) = t = 1 m γ t 1 r t . According to the REINFORCE algorithm [65], the gradient can be derived as follows:
θ J ( θ ) = γ t G t θ log P ( a t | s t ; θ )
A closer look at Equation (5) and Equation (7) reveals that both ExptUtility and MDPRank rely on the same sampling process. Although ExptUtility uses the same weight (i.e., the metric value) for all documents within the sampled ranking, the MDPRank method differes from it in that it weights each document based on the position-specific long-term return (i.e., DCG of the truncated ranking starting from the selected document) when we set γ = 1 .

4.3. Adversarial Learning to Rank

Prior studies [30,32] explored how to perform adversarial learning-to-rank in either a pointwise or pairwise manner, which showed promising results. However, how to perform adversarial learning-to-rank in a listwise manner remains open. To cope with this issue, we formulated the process of learning-to-rank as a game between two opponents: a generator and a discriminator. The generator aims to generate (or select) rankings that look like the ground-truth ranking, which may fool the discriminator. On the other hand, the discriminator aims to make a clear distinction between the ground-truth rankings and the ones generated by its opponent generator. A general adversarial learning-to-rank framework can be given as:
J G * , D * = min θ max ϕ j = 1 N E π P t r u e ( π | q j ) [ log D ϕ ( π | q j ) ] + E π P θ ( π | q j ) [ log ( 1 D ϕ ( π | q j ) ) ]
where the generator G is denoted by P θ ( π | q j ) and aims to minimize the objective. On one hand, the generator fits the true distribution over all possible rankings π P t r u e ( π | q ) . On the other hand, it randomly generates rankings in order to fool the discriminator. The discriminator is denoted by D ϕ ( π | q j ) , which estimates the probability of a ranking being either the ground-truth ranking or not. The objective of the discriminator is to maximize the log-likelihood of correctly distinguishing the ground-truth ranking from artificially generated rankings.

4.3.1. Generator Optimization

Given the currently optimized discriminator, we learn the generator via performing the minimization of Equation (8):
θ * = min θ j = 1 N E π P t r u e ( π | q j ) [ log D ϕ ( π | q j ) ] + E π P θ ( π | q j ) [ log ( 1 D ϕ ( π | q j ) ) ] = min θ j = 1 N E π P θ ( π | q j ) [ log ( 1 D ϕ ( π | q j ) ) ]
A closer look at Equation (9) reveals that log ( 1 D ϕ ( π | q j ) ) is usually of a large magnitude due to the fact that the probability of a ranking being correctly ordered (i.e., D ϕ ( π | q j ) ) is not always zero. As a result, the training process may become unstable, which was also pointed out by Wang et al. [30]. To cope with this issue, we dropped the logarithm operation, and Equation (9) was rewritten as
θ * = min θ j = 1 N E π P θ ( π | q j ) [ 1 D ϕ ( π | q j ) ]
To optimise Equation (10), we appealed to the aforementioned policy gradient again, namely:
θ E π P θ ( π | q j ) [ 1 D ϕ ( π | q j ) ] = E π P θ ( π | q j ) [ θ log P θ ( π | q j ) · ( 1 D ϕ ( π | q j ) ) ] 1 K k = 1 K θ log P θ ( π k | q j ) · ( 1 D ϕ ( π k | q j ) )
Essentially, the core of the generator is designed to be a scoring function f θ , with parameters θ , which defines a distribution over the space of possible rankings for the query under consideration. Following previous methods [30,32], instead of generating new document feature vectors, we cast the generation of rankings for a query as sampling from said distribution. Since we focused on how to learn effective scoring functions, we decided to leave the case of generating new feature vectors to future studies. Based on the Plackett–Luce model [62], we formulated the probability of observing the ranking π as
P θ ( π | q j ) = i = 1 m exp ( f θ ( x π 1 ( i ) ) ) b = i m exp ( f θ ( x π 1 ( b ) ) )
In other words, the generation of π follows the aforementioned PL-sampling process. Inspired by the work of Bruch et al. [66], we resorted to the Gumbel–Softmax trick [67,68] in order to enhance the efficiency of sampling rankings with f θ . Specifically, we associated an i.i.d sample drawn from G u m b e l ( 0 , 1 ) with each document for the query under consideration (i.e., g = g 1 , . . . , g m for x = x 1 , . . . , x m ). We then sorted y ^ = g + f θ ( x ) in a decreasing order. The corresponding re-ranking of x was regarded as a sample ranking of the generator. In practice, this means we can sample a full ranking as quickly as we can sort m documents, which translates to a computational complexity of O ( m log m ) [69].

4.3.2. Discriminator Optimization

Given the ground-truth rankings and the ones sampled with the current generator P θ * ( π | q j ) , the optimal parameters for the discriminator can be obtained as follows:
ϕ * = max ϕ j = 1 N E π P t r u e ( π | q j ) [ log D ϕ ( π | q j ) ] + E π P θ * ( π | q j ) [ log ( 1 D ϕ ( π | q j ) ) ]
Analogous to the generator, the core of the discriminator is again designed to be a scoring function f ϕ with parameters ϕ . The formulation of discriminator again builds upon the aforementioned Plackett–Luce model, and the probability of observing the given ranking π is formulated as
D ϕ ( π | q j ) = i = 1 m exp ( f ϕ ( x π 1 ( i ) ) ) b = i m exp ( f ϕ ( x π 1 ( b ) ) )
Algorithm 1 shows the overall structure of the proposed listwise adversarial learning-to-rank method, where the generator and discriminator are trained alternately. Just like other adversarial ranking methods, the complexity of listwise adversarial learning-to-rank depends heavily on the number of iterations. Given the predefined number of iterations B, the computational complexity is O ( B · K · m log m ) . Specifically, K · m log m corresponds to the complexity of generating K sample rankings, which is a common part of the aforementioned policy-gradient-based ranking methods, such as ExptUtility and MDPRank. Given the above listwise adversarial ranking method, it became possible to comprehensively investigate the effectiveness of adversarial learning-to-rank by comparing pointwise, pairwise, and listwise methods and exploring the possible causes for their deficiencies.
Algorithm 1 Listwise adversarial learning-to-rank.
1:
Initialize generator and discriminator with random weights;
2:
while c o u n t e p o c h _ t h r e s h o l d do
3:
   for d-steps do
4:
     Train discriminator with Equation (13) based on the rankings generated with the current generator and the rankings derived from ground-truth labels;
5:
   end for
6:
   for g-steps do
7:
     Generate K sample rankings with the generator, then update the parameters with Equation (11).
8:
   end for
9:
    c o u n t ++;
10:
end while

4.4. Theoretical Analysis

So far, we have elaborated different types of policy-gradient-based ranking methods. Looking at Equations (5), (7), and (11), we can observe that the key difference is the method used to weight each individual document within the sampled ranking. Specifically, ExptUtility uses the same weight (i.e., the metric value) for each document within the sampled ranking. MDPRank weights each document based on the position-specific long-term return (i.e., DCG of the truncated ranking starting from the selected document) when we set γ = 1 . Adversarial (pointwise, pairwise, listwise) methods rely on a learned discriminator. However these methods are not mutually exclusive. A common core component is that the gradient of the expected value over the distribution of rankings is derived from the expectation of the gradient of the log probability of each sampled ranking multiplied by a scalar. The gradient computation is further approximated using Monte Carlo sampling. In order to perform optimization based on Stochastic Gradient Descent (SGD), the formulation of ranking distribution based on Plackett–Luce model is a popular choice, since it has an analytical form and the sampling process is easy to implement.
From this viewpoint, it is not hard to prove that policy-gradient-based ranking suffers from the following weaknesses. First, the PL-sampling process is performed sequentially by assigning the positions from the top to the bottom. Document ranking is typified by having a small number of relevant document and a large number of non-relevant documents, which is illustrated in Table 1. Therefore, there is a high probability of selecting either non-relevant or less-relevant documents to sit in the top positions. Take the query from MSLRWEB30K (query-id: 631, label distribution: 0:96, 1:31, 2:3, 3:2, 4:1), for example, the probability of selecting a highly relevant document (i.e., with a label of 4) is rather small. As a result, the sampled rankings significantly diverge from the ideal ranking. Second, by taking alternative views on the estimating parameters of the distribution based on Plackett–Luce model, such as Minorize-Maximization [70] and Rank-Breaking [71,72], the estimated relevance of a document x i is proportional to counts of pairwise comparisons that x i “beat” other documents (i.e., x i is selected at a higher position). It is worth noting that there are a large number of queries differing from each other, and the sampled rankings commonly include many incorrectly ranked document pairs (contradicting the standard order). It is rarely possible that the optimization can converge to the optimal scoring function. Third, policy-gradient-based methods suffer from instability of gradient estimates. Though a number of recent methods [73,74,75] are proposed to ease this problem to some extent, it remains an open challenge.

5. Experimental Setup

In this section, we describe the experimental setup. We first introduce the data collection and the method of evaluation. We then describe the configuration of each method to be evaluated.

5.1. Datasets

In our experiments, three widely used benchmark datasets for learning-to-rank are adopted, namely MSLRWEB30K (https://www.microsoft.com/en-us/research/project/mslr/), Yahoo-Set1 (https://webscope.sandbox.yahoo.com/catalog.php?datatype=c), and MQ2008 (https://www.microsoft.com/en-us/research/project/letor-learning-rank-information-retrieval/). Each dataset consists of feature vectors extracted from query–document pairs along with relevance judgment labels. Take MSLRWEB30K, for example, where relevance judgments are obtained from a retired labeling set of a commercial web search engine (Microsoft Bing), which selects 5 values from 0 (irrelevant) to 4 (perfectly relevant). The features are those widely used in the research community, such as inverse document frequency (IDF), inlink number, and dwell time. For more detailed information, e.g., the feature description, we refer readers to the overview papers [76,77]. The basic statistics of each dataset are listed in Table 1. It is worth noting that ranking data is typically long-tailed. The non-relevant documents account for the largest ratio, the number of relevant documents becomes rather small with the increase in relevance level.
We use nDCG to measure performance, which takes into account both rank position and relevance level. We report the results with different cutoff values of 1, 3, 5, 10, 20, and 50 to show the performance of each method at different positions. We observe that the results in terms of nERR are consistent with nDCG, which have not been included in this paper due to space constraints.
Given the above datasets, we used the training data to learn the ranking model, used the validation data to select the hyper parameters based on nDCG@5, and used the testing data for evaluation. For MSLRWEB30K, we note that previous studies [66,78,79] just used a single fold (i.e., Fold1) for their experimental evaluations. To reduce the possible impact of overfitting on performance comparison based on MSLRWEB30K and MQ2008, we used all five folds and performed a 5-fold cross validation in this work. In particular, the dataset was randomly partitioned into five equal-sized subsets. In each fold, three subsets were used as the training data, the remaining two subsets as the validation data and the testing data, respectively. Finally, we reported the ranking performance based on the averaged evaluation scores across the five folds. For all the training data, we filter out the "dumb" queries with no relevant documents and limited the minimum number of documents per query to 10.

5.2. Model Configuration

In this work, a number of representative approaches were adopted as follows: Firstly, RankNet [6], LambdaRank [20], ListNet [17], ListMLE [18], and WassRank [21] were used to represent the conventional approaches. Secondly, LambdaMART [16] (the tree-based variant of LambdaRank) was empirically shown to be the state-of-the-art approach based on the technique of a gradient boosting decision tree (GBDT). We use the implementation included in LightGBM [80], which is referred to as LambdaMART(GBM). Thirdly, IRGAN [30] and MDPRank [22] are used to represent the ranking methods based on adversarial learning and reinforcement learning, respectively. Meanwhile, FAIR-PG-RANK [26] (used to represent ExptUtility) was also compared without fairness constraints.
We implemented and trained all the involved approaches (except LambdaMART) using PyTorch v1.6, where one Nvidia Titan RTX GPU with 24 GB memory is used (the main source code for reproducing our experimental results is available via: https://github.com/wildltr/ptranking). We used the L2 regularization with a decay rate of 1 × 10 3 and the Adam optimizer with a learning rate of 1 × 10 3 . We used a simple feed-forward neural network as the basis to construct the scoring function, where the size of a hidden layer was set to 100. To reduce the possible impact of an arbitrary setting, we explored multiple combinations with respect to the following settings: (1) different activation functions: ReLU, GELU, (2) the number of layers: {1, 5}, and (3) whether to apply an activation function in the last layer or not. As an example, R4.L refers to the fact that ReLU was used in the first four layers, and the last layer was linear without using any activation function. Given the raw features per query–document pair, these were normalized using the z-score method at a query level. We further use batch normalization between consecutive layers.
For ListNet, the ranking loss was computed based on the top-1 approximation as in the original paper [17]; namely, each element of the probability vector represents the probability of the corresponding document being ranked at the top-1 position. For WassRank, the suggested parameter configuration by [21] was used. Following the methods set out in [66], for LambdaMART(GBM), the parameters were set as: a learning rate of 0.05 , a num_leaves measurement of 400, a min_data_in_leaf measurement of 50, and a min_sum_hessian_in_leaf measurement set to 200. We used nDCG@5 (nDCG@1 for MQ2008) to select the best models for validation sets by fixing the early stopping round to 200 for up to 1000 trees. For both MDPRank and ExptUtility, the size of a sample ranking was set as 10. For each query, the number of sampled rankings was set to 1, since we observed that the performance would be impacted by a larger value, such as 3 or 5. For IRGAN, the pointwise and pairwise versions were denoted as an IRGAN-Point and an IRGAN-Pair, respectively. Analogously, the proposed listwise version was denoted as a IRGAN-List. For all methods, the inner loop for training both generator and discriminator was set to 1:1. The temperature was set to 1.0 . For the IRGAN-Point and the IRGAN-Pair, the number of sampled documents or document pairs was tested with 5 and 10, respectively. For the IRGAN-List, the size of a sample ranking was set to 10, the number of sampled rankings was tested with 1 and 5, respectively. For the adversarial ranking method, we reported the performances of the generator and the discriminator. For example, the IRGAN-List-5-D refers to the discriminator with 5 sample rankings per query, the IRGAN-Pair-10-G refers to the generator with 10 sample document pairs per query.

6. Results and Analysis

In Table 2, Table 3 and Table 4, we show the overall performance of the involved approaches in each dataset, respectively. Additionally, we conducted a statistical significance test based on the paired t-test, with p < 0.01 . Within each table, the best result among all methods is indicated in bold, where ∗ indicates that the performance is significantly different from the best result in bold. Among policy-gradient-based ranking methods, the best result is underlined, where † indicates that the performance was significantly different from the underlined best result.
In the following, we first detail how effective the policy-gradient-based ranking methods were. Then, we compare the performance between conventional ranking methods and policy-gradient-based ranking methods. Particularly, we shed new light on the possible reasons for the inferior performance of policy-gradient-based ranking methods. Finally, we conducted an examination of the training process, which enabled us to get a better understanding of the potential limitation of policy-gradient-based ranking.

6.1. Performances of Policy-Gradient-Based Ranking Methods

First, we will examine the performance of each adversarial ranking approach in Table 2, Table 3 and Table 4. Not surprisingly, it can be observed that the generator and the discriminator are competitive opponents. For the IRGAN-List and the IRGAN-Pair, the discriminator shows better performance than the generator. However, for the IRGAN-Point, the generator outperforms the discriminator. Indeed, Wang et al. [30] showed the same results for the IRGAN-Pair and the IRGAN-Point. By comparing the best performance achieved by either the generator or the discriminator, we can see that: the IRGAN-List outperforms the IRGAN-Pair and the IRGAN-Point on Yahoo-Set1 and MQ2008, but shows inferior performance to the IRGAN-Pair on MSLRWEB30K. The best explanation for this is that the IRGAN-List takes into account the total order relationship among all documents associated with the same query. This effect resembles the advantage of traditional listwise approaches over other two categories of pointwise and pairwise approaches [15,17,18,81].
Next we jointly examined the performances of policy-gradient-based ranking methods, namely IRGAN (including pointwise, pairwise and listwise), ExptUtility, and MDPRank. We can observe that: ExptUtility shows the worst performance across three datasets. IRGAN-List and MDPRank achieve similar results on Yahoo-Set1 and MQ2008, MDPRank significantly outperforms ExptUtility, IRGAN-Point, IRGAN-Pair, and IRGAN-List on MSLRWEB30K. This demonstrates that the weighting scheme matters significantly when developing a policy-gradient-based ranking method.

6.2. Policy-Gradient-Based Ranking Methods versus Conventional Ranking Methods

We will first examine the performances of conventional learning-to-rank approaches in Table 2, Table 3 and Table 4, namely LambdaMART(GBM), RankNet, LambdaRank, ListNet, ListMLE, and WassRank. We can observe that: (1) LambdaMART(GBM) achieves significantly better performance than other approaches on MSLRWEB30K and Yahoo-Set1, which is consistent with previous studies [21,79,82]. The main reasons are that: Firstly, the objective optimized by LambdaMART is a coarse upper bound of nDCG [79]; benefiting from GBDT in the form of an ensemble of weak prediction models and the algorithmic and engineering optimizations of LightGBM, LambdaMART(GBM) shows more promising results. Secondly, the neural network-based approaches (i.e., RankNet, LambdaRank, ListNet, ListMLE, and WassRank) rely upon different loss functions and show different performance levels. For a greater discussion of the subtle differences among adopted loss functions, we refer the reader to the studies [21,79], since it is not the focus of this work. Surprisingly, LambdaMART(GBM) slightly underperforms RankNet and WassRank on MQ2008. The likeliest explanation for this is that the parameters of LambdaMART(GBM) are not fine-tuned yet. Due to the differences among datasets, the parameters achieving good performance on MSLRWEB30K and Yahoo-Set1 do not transfer effectively to MQ2008. According to the latest work by Qin et al. [83], neural network-based approaches can perform competitively well with LambdaMART(GBM), where a number of strategies are deployed, such as feature transformation, data augmentation, and listwise context. Due to time constraints, we leave it for future studies to test the effectiveness of these strategies.
Now, we focus on investigating the effectiveness of policy-gradient-based ranking by comparing it with the conventional learning-to-rank approaches. An examination of Table 2, Table 3 and Table 4 reveals that: (1) Policy gradient-based ranking methods show significantly inferior performance, especially on MSLRWEB30K and Yahoo-Set1. These results show inconsistency with prior studies [22,23,26,30,32], and validate our concerns about policy-gradient-based ranking. The main reasons are that: On one hand, the optimization of policy-gradient-based ranking is conducted over sampled rankings, which commonly include non-relevant or less relevant documents in top positions. On the other hand, policy gradient inherently suffers from instability of gradient estimate. Given the low-quality sampled rankings, the gradient estimate would be further impacted. A direct comparison with ListMLE clearly demonstrates the weaknesses of policy-gradient-based ranking. Though ListMLE also formulates the distribution of rankings based on the Plackett–Luce model, it performs optimization over randomly selected ideal rankings rather than sampled rankings, which avoids the weaknesses of policy-gradient-based ranking. Another interesting observation is that the performance gap in MQ2008 between policy-gradient-based ranking methods and conventional learning-to-rank approaches is small. The most probable reason is existence of the dataset differences shown in Table 1. First, MSLRWEB30K and Yahoo-Set1 rely on more fine-grained relevance labels, namely { 0 , 1 , 2 , 3 , 4 } , whereas MQ2008 uses less fine-grained relevance labels, namely { 0 , 1 , 2 } . Second, in MQ2008, the size of ranking is relatively small. Due to these differences, policy-gradient-based ranking on MSLRWEB30K and Yahoo-Set1 suffers more from the high probability of selecting either non-relevant or less-relevant documents for the top positions. In other words, the larger the number of documents per query and the more fine-grained the ground-truth labels, the higher the impact policy-gradient-based ranking suffers.
Finally, we note that for the implementation of neural network-based scoring function, factors such as activation function and number of layers greatly affect the performance of a specific model. This reveals that an arbitrary neural network setting does not transfer effectively across different models. Thus, careful examinations of these factors are highly recommended in the development and evaluation of neural network-based ranking methods.

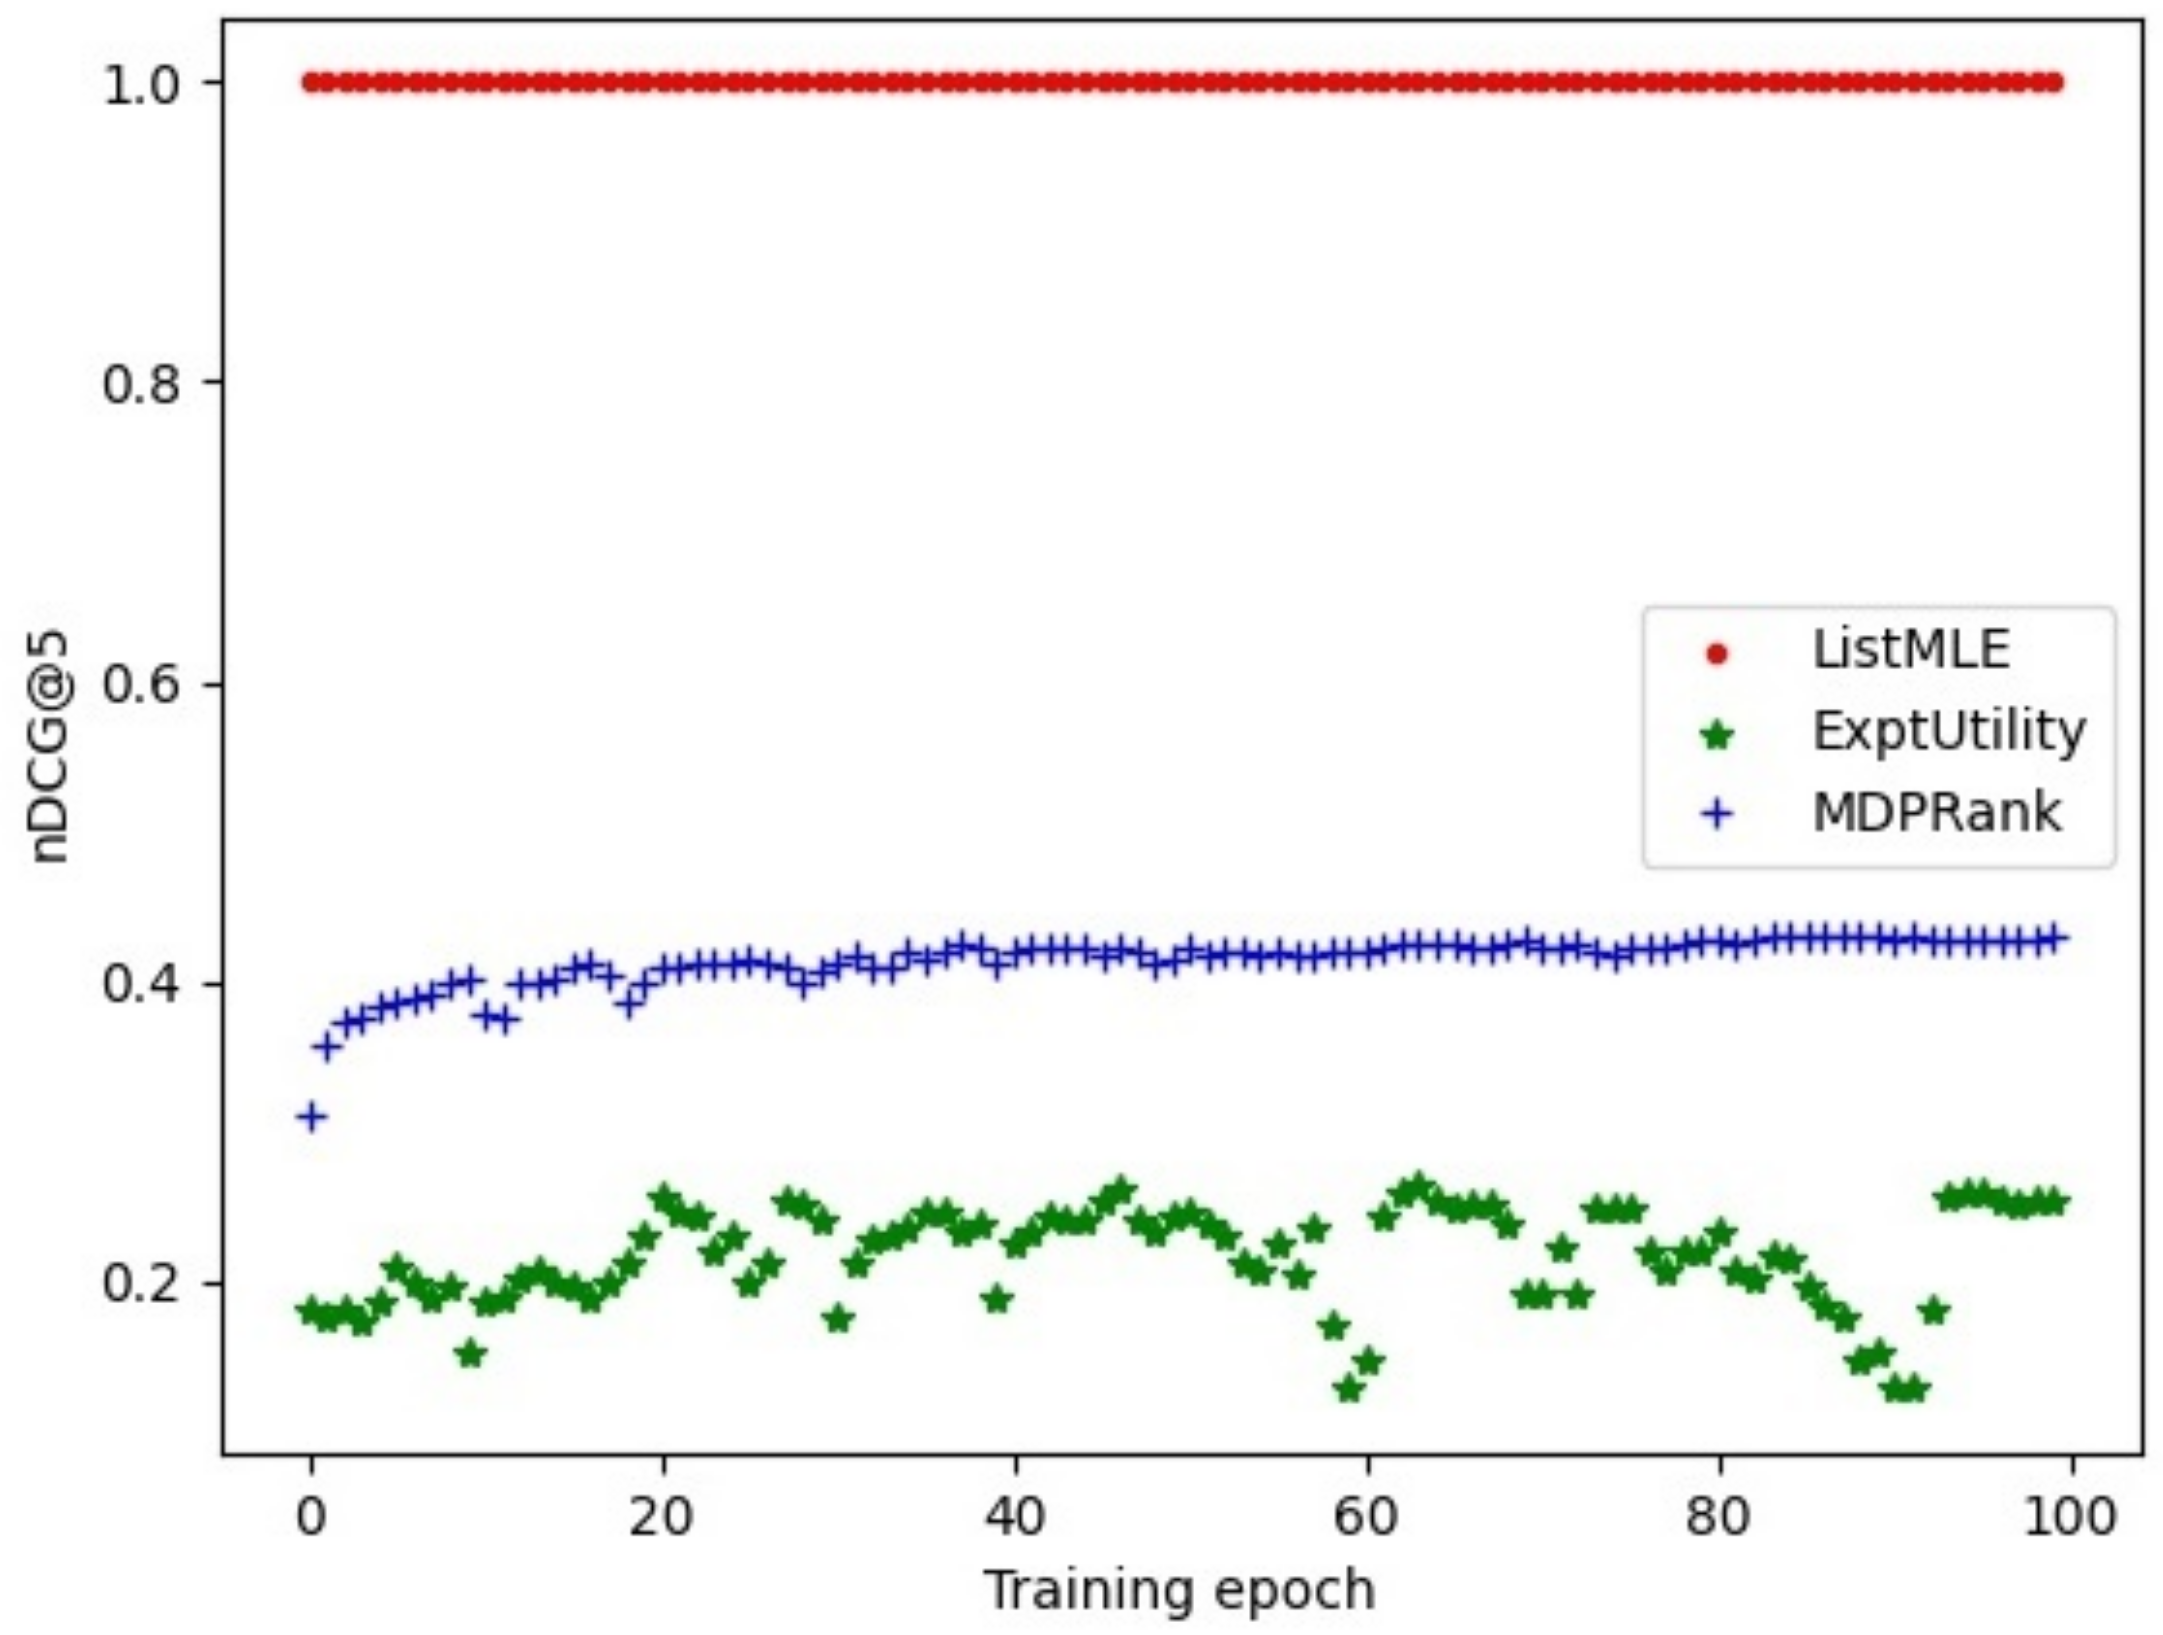
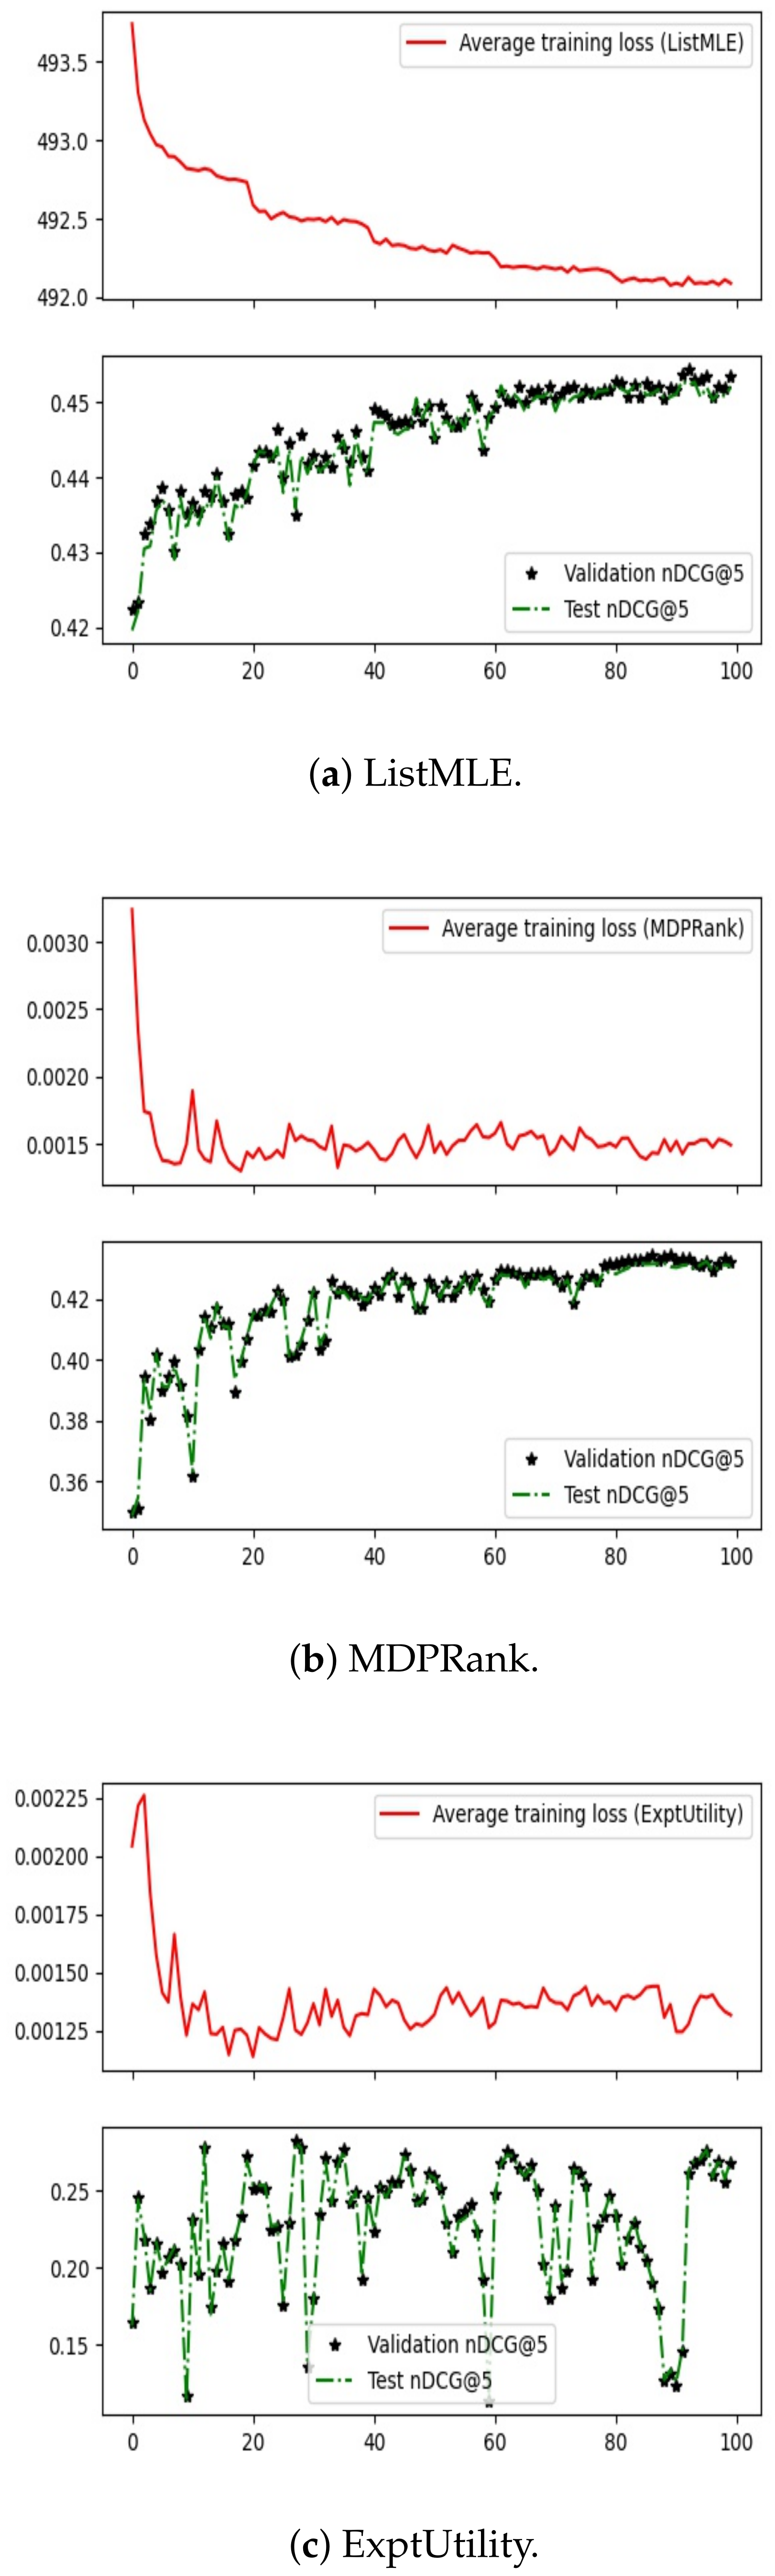
6.3. Examination of Training Process

To gain a good understanding of the limitation of policy-gradient-based ranking, it is useful to examine the detailed optimization process. Firstly, we plotted how the average nDCG@5 of sampled rankings on the training set varies as optimization progresses, where Fold-1 of MSLRWEB30K is used. Taking ExptUtility and MDPRank as an example, Figure 1 shows the quality of sampled rankings, where the x-axis denotes the metric value, and the y-axis represents the training progress. Meanwhile, in order to clearly attest to the inherent impact of using sampled rankings on learning-to-rank, ListMLE is also included. Its nDCG@5 value is always 1.0 , since it is formulated to maximize the likelihood of ideal rankings.
Figure 1 clearly shows that: (1) For policy-gradient-based ranking, though the sampling strategy is the same, namely PL-sampling, the quality of sampled rankings differs greatly when we use different optimization objectives. For example, MDPRank shows a more stable and better performance in terms of nDCG@5. (2) Regardless of how many training epochs are conducted, the quality of sampled rankings significantly diverges from ideal rankings. Since the sampled rankings play a fundamental role in estimating the gradients, the effectiveness of ranking optimization is greatly impacted, which is shown in Section 6. From an optimization viewpoint, it is impractical to expect to achieve superior performance given inferior sampled rankings.
Secondly, we plot how the average loss on the training set varies as optimization progresses, as well as the performance in terms of nDCG@5 in the validation and test sets, where Fold-1 of MSLRWEB30K was used again. As an illustration, Figure 2 shows the plots of ListMLE, MDPRank, and ExptUtility. Due to space limitation, not all the methods in Section 5 are illustrated. In all plots, the x-axis represents the training epoch. The y-axis represents the training loss and performance in terms of nDCG.
From Figure 2, we can observe that: (1) For ListMLE, the performance in terms of nDCG@5 in the validation and test sets is improved as the surrogate loss decreases. As the training epoch increases, the optimization shows a stable convergent trend. (2) For policy-gradient-based ranking, we observe a relatively unstable convergence trend, which is also demonstrated by the zigzag shape of the performance curve, especially for ExptUtility. The most possible explanation is that: policy-gradient-based ranking involves the sampling process. Since there is a large number of queries, the quality of sampled rankings per query cannot be guaranteed at a particular epoch. Another plausible reason is that the policy gradient suffers from the problem of high variance. On the contrary, ListMLE can alleviate the aforesaid problems by directly optimizing ideal rankings.
Overall, Figure 1 and Figure 2 largely demonstrate that policy-gradient-based ranking tends to suffer from an unstable convergence trend and underperform the conventional method ListMLE.

7. Conclusions

In this paper, we analytically and experimentally diagnosed the effectiveness of policy-gradient-based ranking. Our methodology is motivated by the observation that ranking methods based on either reinforcement learning or adversarial learning boil down to policy-gradient-based optimization. Thanks to this uniform formulation, we were able to reach a good understanding of the differences and connections between different policy-gradient-based ranking methods. Furthermore, by carrying out an in-depth analysis of the sampling process in the context of document retrieval, we pinpoint the pitfalls of gradient estimation based on sampled rankings. To validate our theoretical analysis, we conducted a series of experiments based on multiple benchmark datasets with complete information. The experimental results clearly demonstrate our findings. In view of the facts that reinforcement learning and adversarial learning are becoming more and more popular, and ranking is and always will be a core step in a variety of applications, we believe that our work sheds new light on how to develop more effective ranking methods based on these popular techniques.
Our work also opens up many interesting future research directions. First, we have only demonstrated the weaknesses of policy-gradient-based ranking over datasets with complete information. It would be very interesting to further test alternative formulations of ranking distribution, e.g., the Bradley–Terry model [84]. Second, for datasets used for research on learning-to-rank, the relevance labels for documents are query dependent. As a result, this characteristic renders the learning strategies for dealing with imbalanced datasets in the context of traditional classification unsuitable. Thus, it is also very interesting to extend the recent methods [85,86,87] for traditional classification on how to cope with imbalanced labels for learning-to-rank. Third, we did not thoroughly investigate to what extent the gradient estimation step can benefit from the techniques for variance reduction [73,74,75]. Finally, we plan to extend our diagnostic evaluation study by exploring different types of datasets, such as semi-supervised datasets (e.g., MQ2008-semi) or datasets consisting of raw text queries and documents (e.g., MS MARCO).

References

Author Contributions

Conceptualization, H.-T.Y.; methodology, H.-T.Y.; validation, D.H., F.R. and L.L.; formal analysis, H.-T.Y.; investigation, D.H.; resources, F.R.; writing—original draft preparation, H.-T.Y.; writing—review and editing, D.H., F.R. and L.L.; project administration, H.-T.Y.; funding acquisition, H.-T.Y. All authors have read and agreed to the published version of the manuscript.

Funding

This work was supported by JSPS KAKENHI, Grant Number 19H04215.

Acknowledgments

We sincerely thank all the anonymous reviewers for their helpful comments. This work was supported by JSPS KAKENHI, Grant Number 19H04215.

Conflicts of Interest

The authors declare no conflict of interest.

References

  1. Liu, B.; Chen, J.; Wang, X. Application of learning to rank to protein remote homology detection. Bioinformatics 2015, 31, 3492–3498. [Google Scholar] [CrossRef] [PubMed] [Green Version]
  2. Järvelin, K.; Kekäläinen, J. Cumulated gain-based evaluation of IR techniques. ACM Trans. Inf. Syst. 2002, 20, 422–446. [Google Scholar] [CrossRef]
  3. Cossock, D.; Zhang, T. Subset Ranking Using Regression. In Proceedings of the 19th Annual Conference on Learning Theory, Pittsburgh, PA, USA, 22–25 June 2006; pp. 605–619. [Google Scholar]
  4. Chu, W.; Ghahramani, Z. Gaussian Processes for Ordinal Regression. J. Mach. Learn. Res. 2005, 6, 1019–1041. [Google Scholar]
  5. Chu, W.; Keerthi, S.S. New Approaches to Support Vector Ordinal Regression. In Proceedings of the 22nd ICML, Bonn, Germany, 7–11 August 2005; pp. 145–152. [Google Scholar]
  6. Burges, C.; Shaked, T.; Renshaw, E.; Lazier, A.; Deeds, M.; Hamilton, N.; Hullender, G. Learning to rank using gradient descent. In Proceedings of the 22nd ICML, Bonn, Germany, 7–11 August 2005; pp. 89–96. [Google Scholar]
  7. Freund, Y.; Iyer, R.; Schapire, R.E.; Singer, Y. An Efficient Boosting Algorithm for Combining Preferences. J. Mach. Learn. Res. 2003, 4, 933–969. [Google Scholar]
  8. Shen, L.; Joshi, A.K. Ranking and Reranking with Perceptron. Mach. Learn. 2005, 60, 73–96. [Google Scholar] [CrossRef] [Green Version]
  9. Joachims, T. Training Linear SVMs in Linear Time. In Proceedings of the 12th KDD, Philadelphia, PA, USA, 20–23 August 2006; pp. 217–226. [Google Scholar]
  10. Chapelle, O.; Le, Q.; Smola, A. Large Margin Optimization of Ranking Measures. NIPS Workshop on Machine Learning for Web Search. 2007. Available online: https://fravia.2113.ch/library/Large%20margin%20optimization%20of%20ranking%20measures.pdf (accessed on 15 August 2019).
  11. Xu, J.; Li, H. AdaRank: A boosting algorithm for information retrieval. In Proceedings of the 30th SIGIR, Amsterdam, The Netherlands, 23–27 July 2007; pp. 391–398. [Google Scholar]
  12. Yue, Y.; Finley, T.; Radlinski, F.; Joachims, T. A Support Vector Method for Optimizing Average Precision. In Proceedings of the 30th SIGIR, Amsterdam, The Netherlands, 23–27 July 2007; pp. 271–278. [Google Scholar]
  13. Guiver, J.; Snelson, E. Learning to Rank with SoftRank and Gaussian Processes. In Proceedings of the 31st SIGIR, Singapore, 20–24 July 2008; pp. 259–266. [Google Scholar]
  14. Taylor, M.; Guiver, J.; Robertson, S.; Minka, T. SoftRank: Optimizing Non-smooth Rank Metrics. In Proceedings of the 1st WSDM, Palo Alto, CA, USA, 11–12 February 2008; pp. 77–86. [Google Scholar]
  15. Qin, T.; Liu, T.Y.; Li, H. A general approximation framework for direct optimization of information retrieval measures. J. Inf. Retr. 2010, 13, 375–397. [Google Scholar] [CrossRef]
  16. Wu, Q.; Burges, C.J.; Svore, K.M.; Gao, J. Adapting Boosting for Information Retrieval Measures. J. Inf. Retr. 2010, 13, 254–270. [Google Scholar] [CrossRef]
  17. Cao, Z.; Qin, T.; Liu, T.Y.; Tsai, M.F.; Li, H. Learning to Rank: From Pairwise Approach to Listwise Approach. In Proceedings of the 24th ICML, Corvalis, OR, USA, 20–24 June 2007; pp. 129–136. [Google Scholar]
  18. Xia, F.; Liu, T.Y.; Wang, J.; Zhang, W.; Li, H. Listwise Approach to Learning to Rank: Theory and Algorithm. In Proceedings of the 25th ICML, Helsinki, Finland, 5–9 July 2008; pp. 1192–1199. [Google Scholar]
  19. Volkovs, M.N.; Zemel, R.S. BoltzRank: Learning to Maximize Expected Ranking Gain. In Proceedings of the ICML, Montreal, QC, Canada, 14–18 June 2009; pp. 1089–1096. [Google Scholar]
  20. Burges, C.J.C.; Ragno, R.; Le, Q.V. Learning to Rank with Nonsmooth Cost Functions. In Proceedings of the NeurIPS, Vancouver, BC, Canada, 4–7 December 2006; pp. 193–200. [Google Scholar]
  21. Yu, H.T.; Jatowt, A.; Joho, H.; Jose, J.; Yang, X.; Chen, L. WassRank: Listwise Document Ranking Using Optimal Transport Theory. In Proceedings of the 12th WSDM, Melbourne, Australia, 11–15 February 2019; pp. 24–32. [Google Scholar]
  22. Wei, Z.; Xu, J.; Lan, Y.; Guo, J.; Cheng, X. Reinforcement Learning to Rank with Markov Decision Process. In Proceedings of the 40th SIGIR, Tokyo, Japan, 7–11 August 2017; pp. 945–948. [Google Scholar]
  23. Zou, S.; Li, Z.; Akbari, M.; Wang, J.; Zhang, P. MarlRank: Multi-Agent Reinforced Learning to Rank. In Proceedings of the CIKM, Beijing, China, 3–7 November 2019; pp. 2073–2076. [Google Scholar]
  24. Zeng, W.; Xu, J.; Lan, Y.; Guo, J.; Cheng, X. Multi Page Search with Reinforcement Learning to Rank. In Proceedings of the ICTIR, Tianjin, China, 14–17 September 2018; pp. 175–178. [Google Scholar]
  25. Feng, Y.; Xu, J.; Lan, Y.; Guo, J.; Zeng, W.; Cheng, X. From Greedy Selection to Exploratory Decision-Making: Diverse Ranking with Policy-Value Networks. In Proceedings of the SIGIR, Ann Arbor, MI, USA, 8–12 July 2018; pp. 125–134. [Google Scholar]
  26. Singh, A.; Joachims, T. Policy Learning for Fairness in Ranking. In Proceedings of the NeurIPS, Vancouver, BC, Canada, 8–14 December 2019; pp. 5426–5436. [Google Scholar]
  27. Montazeralghaem, A.; Zamani, H.; Allan, J. A Reinforcement Learning Framework for Relevance Feedback. In Proceedings of the SIGIR, Virtual Event, China, 25–30 July 2020; pp. 59–68. [Google Scholar]
  28. Xu, J.; Wei, Z.; Xia, L.; Lan, Y.; Yin, D.; Cheng, X.; Wen, J.R. Reinforcement Learning to Rank with Pairwise Policy Gradient. In Proceedings of the SIGIR, Virtual Event, China, 25–30 July 2020; pp. 509–518. [Google Scholar]
  29. Yao, J.; Dou, Z.; Xu, J.; Wen, J.R. RLPer: A Reinforcement Learning Model for Personalized Search. In Proceedings of the Web Conference, Taipei, Taiwan, 20–24 April 2020; pp. 2298–2308. [Google Scholar]
  30. Wang, J.; Yu, L.; Zhang, W.; Gong, Y.; Xu, Y.; Wang, B.; Zhang, P.; Zhang, D. IRGAN: A Minimax Game for Unifying Generative and Discriminative Information Retrieval Models. In Proceedings of the 40th SIGIR, Tokyo, Japan, 7–11 August 2017; pp. 515–524. [Google Scholar]
  31. He, X.; He, Z.; Du, X.; Chua, T.S. Adversarial Personalized Ranking for Recommendation. In Proceedings of the SIGIR, Ann Arbor, MI, USA, 8–12 July 2018; pp. 355–364. [Google Scholar]
  32. Park, D.H.; Chang, Y. Adversarial Sampling and Training for Semi-Supervised Information Retrieval. In Proceedings of the Web Conference, San Francisco, CA, USA, 13–17 May 2019; pp. 1443–1453. [Google Scholar]
  33. Wang, B.; Yang, Y.; Xu, X.; Hanjalic, A.; Shen, H.T. Adversarial Cross-Modal Retrieval. In Proceedings of the International Conference on Multimedia, Mountain View, CA, USA, 23–27 October 2017; pp. 154–162. [Google Scholar]
  34. Wang, Z.; Xu, Q.; Ma, K.; Jiang, Y.; Cao, X.; Huang, Q. Adversarial Preference Learning with Pairwise Comparisons. In Proceedings of the International Conference on Multimedia, Nice, France, 21–25 October 2019; pp. 656–664. [Google Scholar]
  35. Lin, K.; Yang, F.; Wang, Q.; Piramuthu, R. Adversarial Learning for Fine-Grained Image Search. In Proceedings of the ICME, San Diego, CA, USA, 23–27 July 2018; pp. 490–495. [Google Scholar]
  36. Liu, J.; Dou, Z.; Wang, X.; Lu, S.; Wen, J.R. DVGAN: A Minimax Game for Search Result Diversification Combining Explicit and Implicit Features. In Proceedings of the SIGIR, Virtual Event, China, 25–30 July 2020; pp. 479–488. [Google Scholar]
  37. Nallapati, R. Discriminative Models for Information Retrieval. In Proceedings of the 27th SIGIR, Sheffield, UK, 25–29 July 2004; pp. 64–71. [Google Scholar]
  38. Joachims, T. Optimizing search engines using clickthrough data. In Proceedings of the 8th KDD, Edmonton, AB, Canada, 23–26 July 2002; pp. 133–142. [Google Scholar]
  39. Yuan, F.; Guo, G.; Jose, J.; Chen, L.; Yu, H.T.; Zhang, W. LambdaFM: Learning Optimal Ranking with Factorization Machines Using Lambda Surrogates. In Proceedings of the 25th CIKM, Indianapolis, IN, USA, 24–28 October 2016; pp. 227–236. [Google Scholar]
  40. Chapelle, O.; Metlzer, D.; Zhang, Y.; Grinspan, P. Expected reciprocal rank for graded relevance. In Proceedings of the 18th CIKM, Hong Kong, China, 2–6 November 2009; pp. 621–630. [Google Scholar]
  41. Liu, T.Y. Learning to Rank for Information Retrieval; Springer: Berlin/Heidelberg, Germany, 2011. [Google Scholar]
  42. Li, H. Learning to Rank for Information Retrieval and Natural Language Processing. In Synthesis Lectures on Human Language Technologies; University of Toronto: Toronto, ON, Canada, 2011; Volume 4. [Google Scholar]
  43. LeCun, Y.; Bengio, Y.; Hinton, G. Deep learning. Nature 2015, 521, 436–444. [Google Scholar] [CrossRef] [PubMed]
  44. He, K.; Zhang, X.; Ren, S.; Sun, J. Deep Residual Learning for Image Recognition. In Proceedings of the 2016 CVPR, Las Vegas, NV, USA, 27–30 June 2016; pp. 770–778. [Google Scholar]
  45. Goodfellow, I.J.; Pouget-Abadie, J.; Mirza, M.; Xu, B.; Warde-Farley, D.; Ozair, S.; Courville, A.; Bengio, Y. Generative Adversarial Nets. In Proceedings of the NeurIPS, Montreal, QC, Canada, 8–13 December 2014. [Google Scholar]
  46. Szegedy, C.; Ioffe, S.; Vanhoucke, V. Inception-v4, Inception-ResNet and the Impact of Residual Connections on Learning. In Proceedings of the Thirty-First AAAI Conference on Artificial Intelligence, San Francisco, CA, USA, 4–9 February 2016; pp. 4278–4284. [Google Scholar]
  47. Devlin, J.; Chang, M.W.; Lee, K.; Toutanova, K. BERT: Pre-training of Deep Bidirectional Transformers for Language Understanding. In Proceedings of the NAACL-HLT 2019, Minneapolis, MN, USA, 2–7 June 2019; pp. 4171–4186. [Google Scholar]
  48. Hu, B.; Lu, Z.; Li, H.; Chen, Q. Convolutional Neural Network Architectures for Matching Natural Language Sentences. In Proceedings of the 27th NIPS, Montreal, QC, Canada, 8–13 December 2014; pp. 2042–2050. [Google Scholar]
  49. Huang, P.S.; He, X.; Gao, J.; Deng, L.; Acero, A.; Heck, L. Learning Deep Structured Semantic Models for Web Search Using Clickthrough Data. In Proceedings of the CIKM, San Francisco, CA, USA, 27 October–1 November 2013; pp. 2333–2338. [Google Scholar]
  50. Shen, Y.; He, X.; Gao, J.; Deng, L.; Mesnil, G. Learning Semantic Representations Using Convolutional Neural Networks for Web Search. In Proceedings of the 23rd WWW, Seoul, Korea, 7–11 April 2014; pp. 373–374. [Google Scholar]
  51. Guo, J.; Fan, Y.; Ai, Q.; Croft, W.B. A Deep Relevance Matching Model for Ad-hoc Retrieval. In Proceedings of the 25th CIKM, Indianapolis, IN, USA, 24–28 October 2016; pp. 55–64. [Google Scholar]
  52. Pang, L.; Lan, Y.; Guo, J.; Xu, J.; Wan, S.; Cheng, X. Text Matching As Image Recognition. In Proceedings of the AAAI Conference on Artificial Intelligence, Phoenix, AZ, USA, 12–17 February 2016; pp. 2793–2799. [Google Scholar]
  53. Wan, S.; Lan, Y.; Xu, J.; Guo, J.; Pang, L.; Cheng, X. Match-SRNN: Modeling the Recursive Matching Structure with Spatial RNN. In Proceedings of the IJCAI Conference, New York, NY, USA, 9–15 July 2016; pp. 2922–2928. [Google Scholar]
  54. Bello, I.; Kulkarni, S.; Jain, S.; Boutilier, C.; Chi, E.; Eban, E.; Luo, X.; Mackey, A.; Meshi, O. Seq2Slate: Re-ranking and Slate Optimization with RNNs. In Proceedings of the Workshop on Negative Dependence in Machine Learning, Long Beach, CA, USA, 14–15 June 2019. [Google Scholar]
  55. Onal, K.D.; Zhang, Y.; Altingovde, I.S.; Rahman, M.M.; Karagoz, P.; Braylan, A.; Dang, B.; Chang, H.-L.; Kim, H.; McNamara, Q.; et al. Neural Information Retrieval: At the End of the Early Years. J. Inf. Retr. 2018, 21, 111–182. [Google Scholar] [CrossRef] [Green Version]
  56. Guo, J.; Fan, Y.; Pang, L.; Yang, L.; Ai, Q.; Zamani, H.; Wu, C.; Croft, W.B.; Cheng, X. A deep look into neural ranking models for information retrieval. Inf. Process. Manag. 2019, 57, 102067. [Google Scholar] [CrossRef] [Green Version]
  57. Yilmaz, Z.A.; Wang, S.; Yang, W.; Zhang, H.; Lin, J. Applying BERT to Document Retrieval with Birch. In Proceedings of the EMNLP 2019, Hong Kong, China, 3–7 November 2019; pp. 19–24. [Google Scholar]
  58. Nogueira, R.; Cho, K. Passage Re-ranking with BERT. arXiv 2019, arXiv:1901.04085v4. [Google Scholar]
  59. MacAvaney, S.; Yates, A.; Cohan, A.; Goharian, N. CEDR: Contextualized Embeddings for Document Ranking. In Proceedings of the 42nd SIGIR, Paris, France, 21–25 July 2019; pp. 1101–1104. [Google Scholar]
  60. Khattab, O.; Zaharia, M. ColBERT: Efficient and Effective Passage Search via Contextualized Late Interaction over BERT. In Proceedings of the SIGIR, Virtual Event, China, 25–30 July 2020; pp. 39–48. [Google Scholar]
  61. Lin, J.; Nogueira, R.; Yates, A. Pretrained Transformers for Text Ranking: BERT and Beyond. arXiv 2020, arXiv:2010.06467. [Google Scholar] [CrossRef]
  62. Plackett, R.L. The Analysis of Permutations. J. R. Stat. Society. Ser. C 1975, 24, 193–202. [Google Scholar] [CrossRef]
  63. Ustimenko, A.; Vorobev, A.; Gusev, G.; Serdyukov, P. Learning to select for a predefined ranking. In Proceedings of the ICML, Long Beach, CA, USA, 10–15 June 2019; Volume 97, pp. 6477–64868. [Google Scholar]
  64. Adams, R.P.; Zemel, R.S. Ranking via Sinkhorn Propagation. arXiv 2011, arXiv:1106.1925v2. [Google Scholar]
  65. Williams, R.J. Simple statistical gradient-following algorithms for connectionist reinforcement learning. Mach. Learn. 1992, 8, 229–256. [Google Scholar] [CrossRef] [Green Version]
  66. Bruch, S.; Han, S.; Bendersky, M.; Najork, M. A Stochastic Treatment of Learning to Rank Scoring Functions. In Proceedings of the 13th WSDM, Houston, TX, USA, 3–7 February 2020; pp. 61–69. [Google Scholar]
  67. Jang, E.; Gu, S.; Poole, B. Categorical Reparameterization with Gumbel-Softmax. In Proceedings of the International Conference on Learning Representations, Toulon, France, 24–26 April 2017. [Google Scholar]
  68. Maddison, C.J.; Mnih, A.; Teh, Y.W. The Concrete Distribution: A Continuous Relaxation of Discrete Random Variables. In Proceedings of the International Conference on Learning Representations, Toulon, France, 24–26 April 2017. [Google Scholar]
  69. Harrie, O. Computationally Efficient Optimization of Plackett–Luce Ranking Models for Relevance and Fairness. In Proceedings of the 44th International ACM SIGIR Conference on Research and Development in Information Retrieval, Virtual Event, Canada, 11–15 July 2021; pp. 1023–1032. [Google Scholar]
  70. Hunter, D.R. MM algorithms for generalized Bradley-Terry models. Ann. Stat. 2004, 32, 384–406. [Google Scholar] [CrossRef]
  71. Soufiani, H.A.; Chen, W.Z.; Parkes, D.C.; Xia, L. Generalized Method-of-Moments for Rank Aggregation. In Proceedings of the NeurIPS, Lake Tahoe, NV, USA, 5–10 December 2013; pp. 2706–2714. [Google Scholar]
  72. Soufiani, H.A.; Parkes, D.C.; Xia, L. Computing Parametric Ranking Models via Rank-Breaking. In Proceedings of the ICML, Beijing, China, 21–26 June 2014; Volume 32, pp. 360–368. [Google Scholar]
  73. Xu, P.; Gao, F.; Gu, Q. An Improved Convergence Analysis of Stochastic Variance-Reduced Policy Gradient. In Proceedings of the 35th UAI conference, Virtual Event, 3–6 August 2020. [Google Scholar]
  74. Xu, P.; Gao, F.; Gu, Q. Sample Efficient Policy Gradient Methods with Recursive Variance Reduction. In Proceedings of the ICLR, Virtual Event, 26 April–1 May 2020. [Google Scholar]
  75. Shen, Z.; Ribeiro, A.; Hassani, H.; Qian, H.; Mi, C. Hessian Aided Policy Gradient. In Proceedings of the ICML, Long Beach, CA, USA, 10–15 June 2019; pp. 5729–5738. [Google Scholar]
  76. Qin, T.; Liu, T.Y.; Xu, J.; Li, H. LETOR: A benchmark collection for research on learning to rank for information retrieval. Inf. Retr. J. 2010, 13, 346–374. [Google Scholar] [CrossRef]
  77. Chapelle, O.; Chang, Y. Yahoo! Learning to Rank Challenge Overview. In Proceedings of the 2010 International Conference on YLRC, Haifa, Israel, 25 June 2010; pp. 1–24. [Google Scholar]
  78. Bruch, S.; Zoghi, M.; Bendersky, M.; Najork, M. Revisiting Approximate Metric Optimization in the Age of Deep Neural Networks. In Proceedings of the 42nd SIGIR, Paris, France, 21–25 July 2019; pp. 1241–1244. [Google Scholar]
  79. Wang, X.; Li, C.; Golbandi, N.; Bendersky, M.; Najork, M. The LambdaLoss Framework for Ranking Metric Optimization. In Proceedings of the 27th CIKM, Torino, Italy, 22–26 October 2018; pp. 1313–1322. [Google Scholar]
  80. Ke, G.; Meng, Q.; Finley, T.; Wang, T.; Chen, W.; Ma, W.; Ye, Q.; Liu, T.Y. LightGBM: A Highly Efficient Gradient Boosting Decision Tree. In Proceedings of the NeurIPS, Long Beach, CA, USA, 4–7 December 2017. [Google Scholar]
  81. Rahimi, R.; Montazeralghaem, A.; Allan, J. Listwise Neural Ranking Models. In Proceedings of the ICTIR 2019, Santa Clara, CA, USA, 2–5 October 2019; pp. 101–104. [Google Scholar]
  82. Ai, Q.; Bi, K.; Guo, J.; Croft, W.B. Learning a Deep Listwise Context Model for Ranking Refinement. In Proceedings of the 41st SIGIR, Ann Arbor, MI, USA, 8–12 July 2018; pp. 135–144. [Google Scholar]
  83. Qin, Z.; Yan, L.; Zhuang, H.; Tay, Y.; Pasumarthi, R.K.; Wang, X.; Bendersky, M.; Najork, M. Are Neural Rankers still Outperformed by Gradient Boosted Decision Trees? In Proceedings of the ICLR, Virtual Event, 3–7 May 2021. [Google Scholar]
  84. Bradley, R.A.; Terry, M.E. Rank Analysis volume of Incomplete Block Designs: I. The Method of Paired Comparisons. Biometrika 1952, 39, 324–345. [Google Scholar]
  85. Xiu, Z.; Chen, J.; Henao, R.; Goldstein, B.; Carin, L.; Tao, C. Supercharging Imbalanced Data Learning With Energy-based Contrastive Representation Transfer. In Proceedings of the 35th Conference on Neural Information Processing Systems (NeurIPS 2021), Virtual Event, 7–10 December 2021. [Google Scholar]
  86. Salazar, A.; Vergara, L.; Safont, G. Generative Adversarial Networks and Markov Random Fields for oversampling very small training sets. Expert Syst. Appl. 2021, 163, 113819. [Google Scholar] [CrossRef]
  87. Fernández, A.; García, S.; Galar, M.; Prati, R.C.; Krawczyk, B.; Herrera, F. Learning from Imbalanced Data Sets; Springer International Publishing: Berlin/Heidelberg, Germany, 2018. [Google Scholar]
Figure 1. The quality of sampled rankings.
Electronics 11 00037 g001
Figure 2. How the performance of nDCG@5 in the validation and test sets varies as the optimization on the training set progresses.
Electronics 11 00037 g002
Table 1. The statistics of adopted datasets.
MSLRWEB30KYahoo-Set1MQ2008
#Queries31,53129,921784
#Docs3,771,125709,87715,211
#Features13670046
#Avg relevant
docs per query
58.017.53.7
#Docs per query
(Min; Avg; Max)
(1; 119.6; 1251)(1; 23.7; 139)(5; 19.4; 121)
#Ground-truth label
distribution
01,940,9520185,192012,279
11,225,7701254,11012001
2504,9582202,7002931
369,010354,473
430,435413,402
Table 2. The performance of involved approaches in MSLRWEB30K.
nDCG@1nDCG@3nDCG@5nDCG@10nDCG@20nDCG@50
LambdaMART(GBM)0.49490.47610.47990.49720.51800.5468
RankNet (R5)0.4590 * 0.4488 * 0.4548 * 0.4731 * 0.4958 * 0.5296 *
LambdaRank (GE4.L)0.4875 * 0.4676 * 0.4705 * 0.4859 * 0.5065 * 0.5375 *
ListNet (R4.L)0.4665 * 0.4495 * 0.4534 * 0.4708 * 0.4942 * 0.5279 *
ListMLE (GE5)0.4633 * 0.4498 * 0.4541 * 0.4719 * 0.4935 * 0.5272 *
WassRank (GE5)0.4721 * 0.4497 * 0.4506 * 0.4639 * 0.4843 * 0.5180 *
ExptUtility (GE4.L)0.2619 * 0.2746 * 0.2887 * 0.3200 * 0.3588 * 0.4191 *
MDPRank (GE5)0.4521 * 0.4317 * 0.4346 * 0.4480 * 0.4671 * 0.4986 *
IRGAN-List-5-G (GE4.L)0.1419 * 0.1559 * 0.1697 * 0.1989 * 0.2393 * 0.3183 *
IRGAN-List-5-D (GE4.L)0.3853 * 0.3667 * 0.3709 * 0.3923 * 0.4230 * 0.4701 *
IRGAN-Pair-5-G (GE4.L)0.2334 * 0.2457 * 0.2568 * 0.2790 * 0.3041 * 0.3583 *
IRGAN-Pair-5-D (GE4.L)0.4183 * 0.4008 * 0.4029 * 0.4167 * 0.4377 * 0.4793 *
IRGAN-Point-10-G (GE5)0.3357 * 0.3264 * 0.3305 * 0.3428 * 0.3615 * 0.3937 *
IRGAN-Point-10-D (GE5)0.2807 * 0.2765 * 0.2822 * 0.3002 * 0.3250 * 0.3649 *
Table 3. The performance of involved approaches in Set1.
nDCG@1nDCG@3nDCG@5nDCG@10nDCG@20nDCG@50
LambdaMART(GBM)0.70780.69850.71120.75200.50680.1017
RankNet (GE4.L)0.6614 * 0.6497 * 0.6655 * 0.7131 * 0.4841 * 0.0984
LambdaRank (GE4.L)0.6731 * 0.6643 * 0.6769 * 0.7223 * 0.4886 * 0.0985
ListNet (GE4.L)0.6699 * 0.6597 * 0.6734 * 0.7193 * 0.4874 * 0.0982
ListMLE (R5)0.6609 * 0.6516 * 0.6661 * 0.7156 * 0.4863 * 0.0983
WassRank (GE4.L)0.6714 * 0.6593 * 0.6726 * 0.7188 * 0.4873 * 0.0988
ExptUtility (GE5)0.5397 * 0.5532 * 0.5760 * 0.6394 * 0.4329 * 0.0891
MDPRank (GE4.L)0.6547 * 0.6405 * 0.6543 * 0.7037 * 0.4768 * 0.0968
IRGAN-List-5-G (R5)0.3268 * 0.3682 * 0.4054 * 0.4913 * 0.3440 * 0.0761 *
IRGAN-List-5-D (R5)0.6559 * 0.6452 * 0.6613 * 0.7072 * 0.4769 * 0.0963
IRGAN-Pair-10-G (R5)0.4821 * 0.5145 * 0.5457 * 0.6143 * 0.4207 * 0.0884
IRGAN-Pair-10-D (R5)0.5637 * 0.5860 * 0.6120 * 0.6705 * 0.4585 * 0.0953
IRGAN-Point-10-G (R5)0.5383 * 0.5678 * 0.5942 * 0.6567 * 0.4508 * 0.0942
IRGAN-Point-10-D (R5)0.2912 * 0.3351 * 0.3767 * 0.4663 * 0.3279 * 0.0714 *
Table 4. The performance of involved approaches in MQ2008.
nDCG@1nDCG@3nDCG@5nDCG@10nDCG@20nDCG@50
LambdaMART(GBM)0.47560.48840.53310.60860.32540.1422
RankNet (L)0.48460.49640.53620.61570.32450.1410
LambdaRank (L)0.46950.48540.53040.61820.32200.1427
ListNet (L)0.47320.49260.53330.61010.32530.1412
ListMLE (L)0.46750.49050.53160.61280.32280.1419
WassRank (L)0.47720.49190.53740.61540.32120.1407
ExptUtility (GE5)0.3765 * 0.4017 * 0.4442 * 0.5218 * 0.2763 * 0.1209 *
MDPRank (GE5)0.4569 * 0.46950.51480.59460.31200.1385
IRGAN-List-1-G( GE5)0.2352 * 0.2647 * 0.2891 * 0.3655 * 0.1888 * 0.0812 *
IRGAN-List-1-D (GE5)0.4586 * 0.48890.51830.60380.31270.1358
IRGAN-Pair-10-G (R5)0.3851 * 0.4069 * 0.4623 * 0.5493 * 0.2859 * 0.1279
IRGAN-Pair-10-D (R5)0.4169 * 0.4549 * 0.4980 * 0.5803 * 0.3029 * 0.1377
IRGAN-Point-5-G (GE5)0.4469 * 0.48150.51960.60530.31340.1384
IRGAN-Point-5-D (GE5)0.4295 * 0.4474 * 0.4989 * 0.5756 * 0.3010 * 0.1325
Publisher’s Note: MDPI stays neutral with regard to jurisdictional claims in published maps and institutional affiliations.

