Article

Exploring the Measurement Lab Open Dataset for Internet Performance Evaluation: The German Internet Landscape

Faculty of Economics, Flensburg University of Applied Sciences, Kanzleistraße 91-93, 24943 Flensburg, Germany
*
Author to whom correspondence should be addressed.
Electronics 2022, 11(1), 162; https://doi.org/10.3390/electronics11010162
Submission received: 27 October 2021 / Revised: 29 December 2021 / Accepted: 30 December 2021 / Published: 5 January 2022
(This article belongs to the Section Computer Science & Engineering)

Abstract

:
The Measurement Lab (MLab) provides a large and open collection of Internet performance measurements. We make use of it to look at the state of the German Internet by a structured analysis, in which we carve out expressive results from the dataset to identify busy hours and days, the impact of server locations and congestion control protocols, and compare Internet service providers. Moreover, we examine the impact of the COVID-19 lockdown in Germany. We observe that only parts of the Internet show a performance degradation at the beginning of the lockdown and that a large impact in performance depends on the network the servers are located in. Furthermore, the evolution of congestion control algorithms is reflected by performance improvements. For our analysis, we focus on the busy hours. From the end-user perspective, this time is of most interest to identify if the network can support challenging services such as video streaming or cloud gaming at these intervals.

1. Introduction

The demand for high-throughput and low-latency Internet access is increasing by the requirements of recent and upcoming applications. Interactive voice applications require a mouth-to-ear latency below 200 ms, see [1], video streaming demands high bandwidth, e.g., Netflix recommends 5 Mbps for high-definition (HD) videos and 25 Mbps for ultra-high-definition (UHD) videos. These numbers are surpassed by cloud gaming that requires low latency as well as high throughput, in [2] 44 Mbps are reported for an UHD video stream and a negative impact on the user experience is measurable for a latency of about 25 ms [3]. Moreover, important for consumers, regulators, and Internet service providers (ISPs) are the national guidelines. Already in the year 2010, the European Commission recommended broadband access for all citizens in the year 2013 and concretized the numbers for the year 2020 with 30 Mbps for all and at least 100 Mbps for half of all citizens [4]. This claim failed as stated in [5]. The newer directive [6] demands for 30 Mbps, and the national German law as conversion of the directive deviates from this value. Still, concrete national requirements have to be determined based on application requirements [7]. Although the claim of an Internet access service that meets the contracted speed and quality of service parameters is regularized in the European Union in [8], the nature of the Internet with time-varying performance makes a verification difficult. At least, concrete guidelines for the measurements were stated for German end users in [9] recently. These guidelines specify requirements on a measurement series lasting for several days and multiple measurements per day. Moreover, similar attempts for evaluations of the digital infrastructure persist in other countries, e.g., the initiative Measuring Broadband America [10].
These regulations show on the one hand the need for comparative evaluations on Internet performance and on the other hand the complexity of a sophisticated data analysis on Internet performance measurements to extract representative results. In this work, we present our methodology to analyze the dataset from the Measurement Lab (MLab), an open platform for measuring the Internet. The openness of the platform includes the publication of measurement results performed by users as well as the software to perform the measurements. We use the collection of measurements to look at the state of the German Internet performance, but our procedure can still easily be extended to others regions.
The MLab gives access to a tremendous number of measurements on Internet performance, but its analysis hold pitfalls at hand [11]. Measurements are executed by users as needed, so the measurements originate from uncontrolled environments and in an uncontrolled manner. We contribute in this work a sophisticated examination to return representative results. Therefore, we contribute the following:
  • A procedure to confine the tremendous number of measurements to a representative subset. We do this by selection of the time of day, selection of providers, and congestion control protocols.
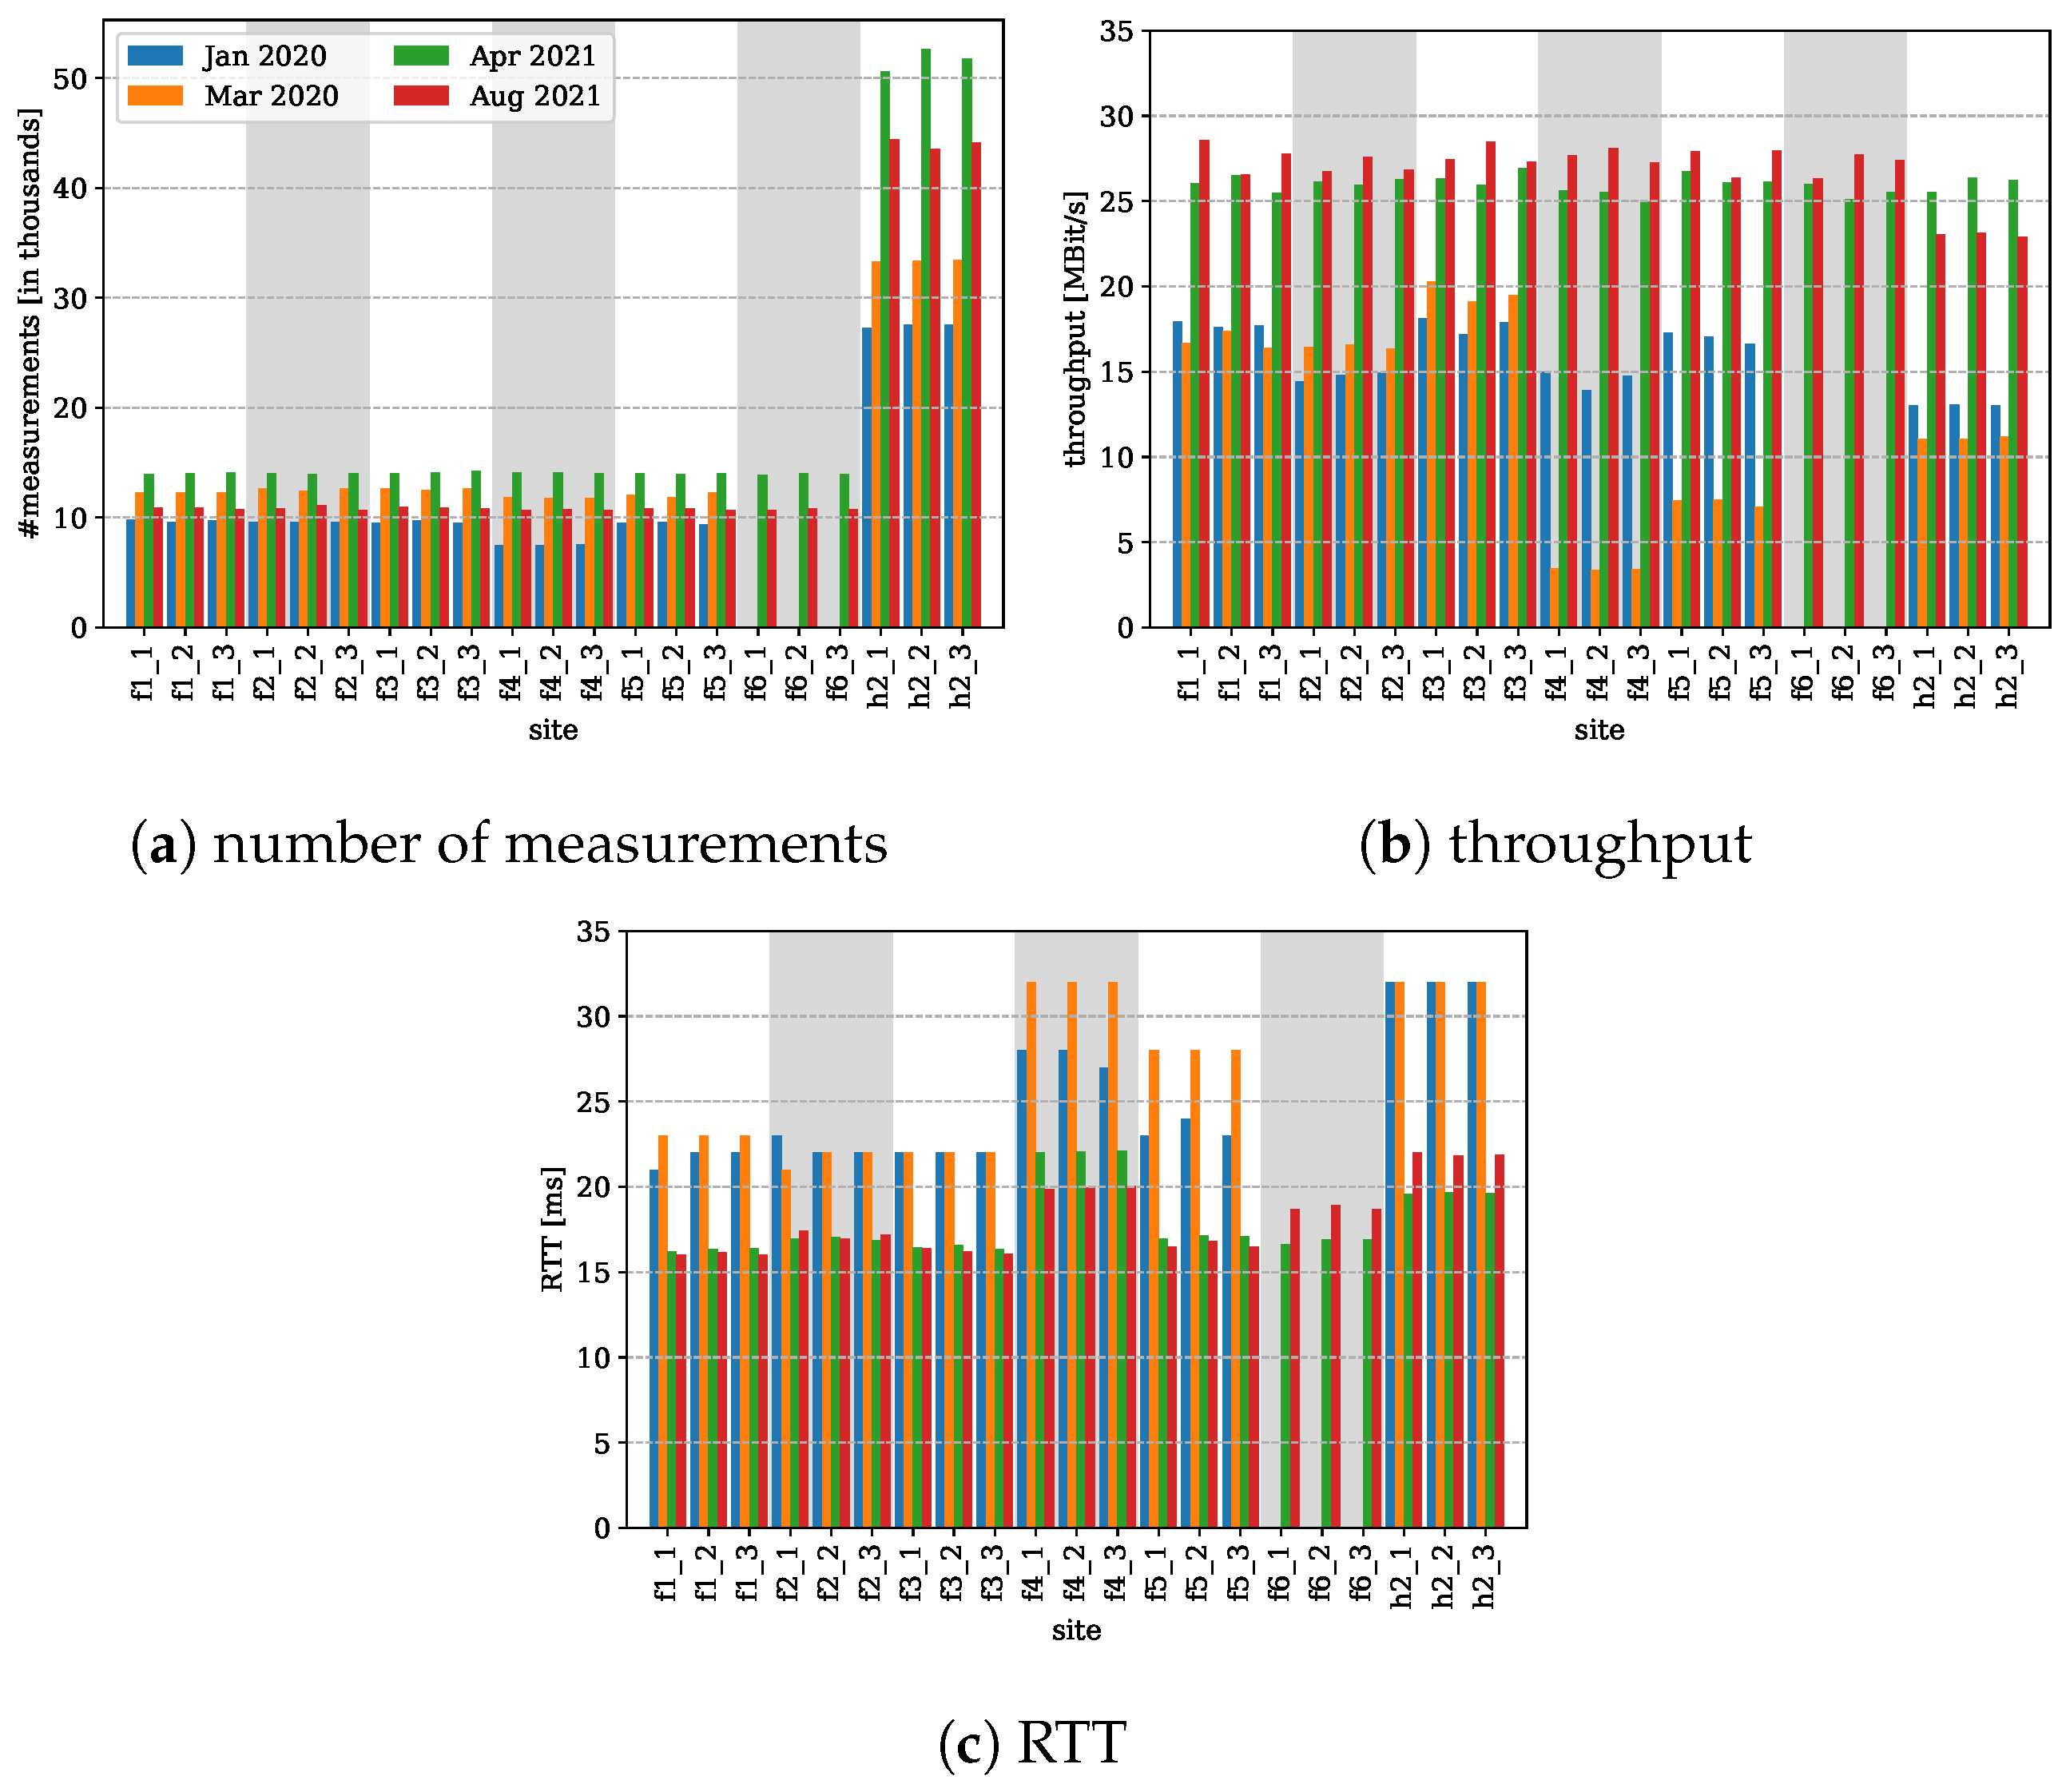
  • We analyze the impact of the servers, sites, and locations to which clients perform their measurements against. In detail, we carve out that, in the MLab, the location as well as the autonomous system the server is located in impacts the results. For comparative studies, such effects have to be considered.
  • By the use of these findings and confinements of the dataset:
    We show that congestion controls, deployed in the last years, redeem their goal by the evaluation of the open real-world dataset.
    We identify impacts on Internet performance during the beginning of the COVID-19 pandemic. By the split of the dataset and the analysis of the individual autonomous systems (AS), we demonstrate that the throughput and latency degraded only partially in the Internet. This degradation disappeared fast.
    We compare ISPs and their evolution to give insights about their performance during busy hours.
The outline of the article is as follows: Section 2 states the related work containing references to work using open datasets for Internet performance evaluation. Section 3 describes the material and methods and includes a brief description of what is measured by the MLab performance tests and mentions characteristics of the dataset to be considered for an expressive evaluation. Section 4 presents performance results for server site and client site providers, busy hours and days, as well as the congestion control protocols. Section 5 discusses the results and Section 6 concludes this article.

2. Related Work

Open Internet measurement collections offer a convenient way for performance evaluation of the Internet. We summarize evaluations of datasets, give references to challenges on its evaluation, and list recent work on Internet performance evaluations during the COVID-19 pandemic in Table 1.
Open Internet measurements are used in [12] to compare the latency from worldwide measurements. The measurements are usually performed by the end-users and stored at the measurement platform provider. Often these measurements are used to evaluate broadband access networks [13,14]. Still, using this data has shown pitfalls considering their interpretation. To allow for a better control of experiments, a centralized platform is proposed in [15]. Additionally, in [16] the experiments are performed from home routers to mitigate effects from user home networks. In [11], the authors describe the details of the measurement methodology of the network diagnostic tool (NDT) implemented by the MLab and evaluate the consequences of using TCP and the evolution of the NDT. Furthermore, the validity of the dataset is analyzed with the conclusion that results drawn from the dataset need careful interpretation due the way samples are captured, since measurements are initiated by users in an unregulated fashion. Moreover, the authors elaborate on a specific case in which different Internet measurement platforms provide distinctive results. They reason that differences originate from the aggregation of measurement results from ISPs with different kinds of access networks with strongly diverging access technologies. By the use of the median on the complete dataset, the distribution of measurements for each provider has a strong impact on the results and masks details. The authors also state that with careful data curation and interpretation, misleading results could be avoided. In [13], the authors also compare different Internet performance measurement platforms such as Ookla, MLab, and results from Akamai Speed. The results indicate that, typically, Ookla reports higher values than the other platforms, and the reasons mentioned are the placement of the measurement servers. Ookla lets ISPs often deploy the servers in their network, while the other platforms use servers outside the provider networks. For interpretation, the authors state that Ookla gives results closer to the broadband access network capacity, whereas the other platforms reflect better the users’ experience for end-to-end connections since, typically, destinations are not in the network of the access provider. A similar comparison is performed in [17]. Furthermore, it is high-lighted that the number of TCP flows and the exclusion of TCP’s slow start phase returns higher measurement results. Again, the results indicate that the significant increase in access bandwidth may lead to a shift in the network bottlenecks from the access networks to intermediary links and networks. A further aspect is elaborated in [14], where the use of network address translation in networks leads to the use of the same IP address by multiple clients, which invalidates the assumption that results using the same IP are performed by the same device and makes the comparison cumbersome. The authors also show that results can be split and allocated to different clients.
The differences in Internet performance tests are taken up in [18]. The paper concludes that there is no clear definition of Internet performance testing and that different tests measure different aspects of the network connection. Therefore, comparisons must be done carefully, and clear definitions and standards for a broad acceptance and comparison of such tests are required in the future since such evaluations are used by governmental regularization authorities and by users for the selection of their ISP.
Various papers examined the impact on the Internet performance and extension on network capacities during the COVID-19 pandemic lockdown due to increasing demand. A more than proportional extension of capacity is reported in [19] for providers in the United States, and a negative performance impact is also reported for the beginning of the lockdown. Nevertheless, providers counteracted to mitigate effects of increased Internet usage in the beginning of the lockdown. A difference in Internet usage is also determined in [20] from ISP, internet exchange point, mobile operator, and educational network measurements. Later, we show results from the users’ perspective for the Internet performance in Germany.

3. Material and Methods

We use the open Internet research database from the MLab [21], which collects Internet measurements from users and makes the results publicly available. The platform provides different tests, such as the NDT for speed and latency measurements, the Neubot DASH test to measure the quality of video streaming, and the WeHe test for violations of net neutrality to identify whether ISPs prioritize or slowing down specific applications. Here, we use the data of the NDT. This test exists in three versions: The first version deployed from February 2009 until November 2019 was based on the web100 Linux kernel [22] and used TCP Reno, the next version NDT5 started in July 2019 and is still available but will be phased out and replaced by NDT7 in February 2020. The modified Linux kernel of web100 project reports internal statistics of the TCP stack. NDT5 and NDT7 rely on a modern interface to collect TCP statistics from the network stack by the use of the socket diagnostics netlink interface [23] and the INET_DIAG_INFO message. If the message is requested on a TCP socket, it returns a TCP_INFO message which includes kernel-internal statistics of the TCP connection. The differences between NDT5 and NDT7 are the congestion control protocol and the TCP ports used for the tests. NDT5 uses TCP Cubic and non-default ports for the data connections, NDT7 relies by default on TCP BBR; if not available, it falls back to the TCP Cubic. Moreover, it uses default HTTP(S) ports. For speed and latency testing, all variants establish a TCP connection between a MLab server and the client, which initiates the test and measures the average throughput, as well as the latency given by the round trip time (RTT) from the TCP statistics. As mentioned before, differences exist in the congestion control protocols. For example, TCP Cubic is a successor of TCP Reno and designed for high-speed networks to achieve a high utilization even in networks with high latency [24]. The newer variant, TCP BBR, focuses on the prevention of the creation of large queues inside intermediary devices along the network path [25]. TCP Reno and TCP Cubic can fill up queues in the network, and if these are large, the delay can increase dramatically. This effect is termed bufferbloat [26].
Whereas the MLab contains measurements from all over the world, we limit our view to the state of the German Internet landscape. In Germany, the MLab operates measurement servers in two locations, Frankfurt and Hamburg. At the Frankfurt location, multiple sites in different autonomous systems exist, and at the Hamburg location, there is one site available. Each site consists of four servers, whereas one server is for testing purposes and three are for production. So, we include the data from all production machines. In Germany, all machines are connected by a 10 G interface and feature 16 CPU cores, see [27]. The available sites in Germany are listed in Table 2.
We limit our evaluation to clients located in Germany and analyze the time interval from January 2019 to August 2021 to include results from all congestion control variants. Sometimes, we limit the observed time interval, which we describe at each section. We further carve out the most frequently used ISPs in Germany, busy hours, and busy days to focus on the most demanding time intervals.

3.1. Materials—What Is Measured by NDT?

The NDT is a user-initiated test (It is available from Google’s search results website or at https://speed.measurementlab.net (accessed on 1 January 2022) that performs an active measurement. It establishes a TCP connection between the client and a MLab server. The MLab server is selected by a location service also deployed by the MLab. The location service returns a geographically close server, whereby the client location is determined by the Google Cloud App Engine, see [28]. Therefore, the NDT performs a single TCP connection test for the download and the upload direction. For each direction, the TCP performance as average throughput in the upload and the download direction is calculated by the elapsed time of the test and the bytes acknowledged (download) and bytes received (upload), respectively. The latency is extracted from the RTT measurements of the TCP stack. In detail, the minimal RTT of the last sample of the TCP_INFO message is used (https://github.com/m-lab/etl/blob/prod-v2.9.2/parser/ndt7_result.go (accessed on 1 January 2022)). We use these measurement results for our evaluation. The MLab database contains many additional results from the TCP stack, as well as information of the client and server, such as IP addresses, approximated geolocation, and network information. Even raw packet traces from the measurements are available in a cloud storage.
We use results from the dataset as provided in the BigQuery database in the table measurement-lab.ndt.unified_downloads, which harmonizes results from the different variants of the NDT. These results are already filtered to the following rules [29]:
  • At least 8 KB of data was transferred;
  • Test duration was between 9 and 60 s;
  • Congestion was detected (by loss or bufferbloat, see [11]);
  • Tests with NULL results are excluded;
  • Tests from MLab Operations and Management infrastructure are excluded.
The most questionable filter is the detection of congestion, since it is based on a heuristic which includes packet loss and the increase in the RTT. A detailed discussion is in [11]. However, this rule indicates that the connection was fully utilized, and the measurement result represents the achievable throughput of the connection, and not a throttled client, which is not able to utilize the connection.

3.2. Methods

The data of the measurements performed by the MLab are stored in different ways. On the one hand, raw packet traces are stored in Google’s cloud storage service. On the other hand, aggregated results are stored in different views in Google’s BigQuery data warehouse. Here, we access the data in the data warehouse system by the BigQery query language, which is similar to the structured query language (SQL). By the use of filters, we select relevant subsets of the data. The different filters such as date, time of day, locations, and ASNs are developed in the result’s section to obtain representative data. The data processing is performed using built-in functions of the query language, e.g., for calculation of quantiles, or the data is post processed by Python scripts for plotting. Even our analysis is limited to the Internet performance in Germany, the analysis can easily be extended since all scripts are publicly available, see the data available statement at the end of this article. The scripts contain all queries, filters, and instructions to produce the figures included in this article.

3.3. Threats to Validity

With the description in Section 3.1, we have to keep in mind that the tests measure the complete path between the client and the server, related to the used TCP variant. Therefore, the results reflect the TCP performance of the complete path and not only the performance of the access network provider. The throughput is determined by the bottleneck along the path. If we compare access providers, the assumption is that the access network is the bottleneck. Still, possible other bottlenecks could be wireless or wired local area networks at end costumers with a poor performance or poor connection if cellular networks are used. Moreover, bottlenecks could exist in the transit networks between the access networks and the measurement servers. At least the last issue of bottlenecks in transit networks is unlikely as later results show, except during a period of extensive utilization at the beginning of the lockdown of the COVID-19 pandemic in Germany. Nevertheless, for the comparison of broadband access network providers, the results present a lower bound on their performance. Still, during an interval, typically one TCP variant is predominant, and all providers are affected by end costumers with possibly poor local area networks or limited client capabilities such as reported in [30]. So, the results are comparable except for providers that provide wired broadband access as well as cellular access networks. We differentiate between these providers in the following.
In addition to the ambiguous location of the bottleneck, the design decisions for the throughput calculation should be interpreted as a lower bound on the connection and access network capabilities, since a single TCP connection may not fully utilize the connection at all times. Moreover, the inclusion of measurements during TCP’s slow-start phase, which typically does not fully utilize the connection, underestimates the connection capabilities.
Still, the NDT reflects the performance of a TCP connection important for the end-to-end application performance, which is of great interest for a user. From a user’s perspective, a 1 Gbps access network is of little value if the provider’s interconnections to further networks are congested and the end-to-end performance is poor.
In [11], the authors present a detailed analysis of the MLab dataset, with a detailed description of the testing methodology and the statistical relevance of the dataset. Therein, the collection of measurement results is termed as convenience sampling. Related to the MLab dataset, this means that the data do not stem from a random experiment in which independence of the measurements are guaranteed and that the measurements are representative for the population, e.g., many people may never perform a speed test due to lack of interest in computer networks, whereas interested people often perform measurements. As stated in [11], such a dataset needs careful judgment of the results, which we approach by the examination of the different providers on the server site as well as on the client site, identification of aspects on representativeness of congestion control protocols in different time intervals, and considerations on the measurement frequency of single IP addresses during busy hours.

4. Results

We start a series of evaluations to confine the dataset to generate a representative extract of the available data. This confinement includes the selections of ISPs, busy hours and days, congestion control protocols, and the impact of the measurement server locations and sites. This evaluation also reveals performance impairments during the COVID-19 pandemic. With this information, we present results for the evolution of different congestion protocols and compare different access providers.

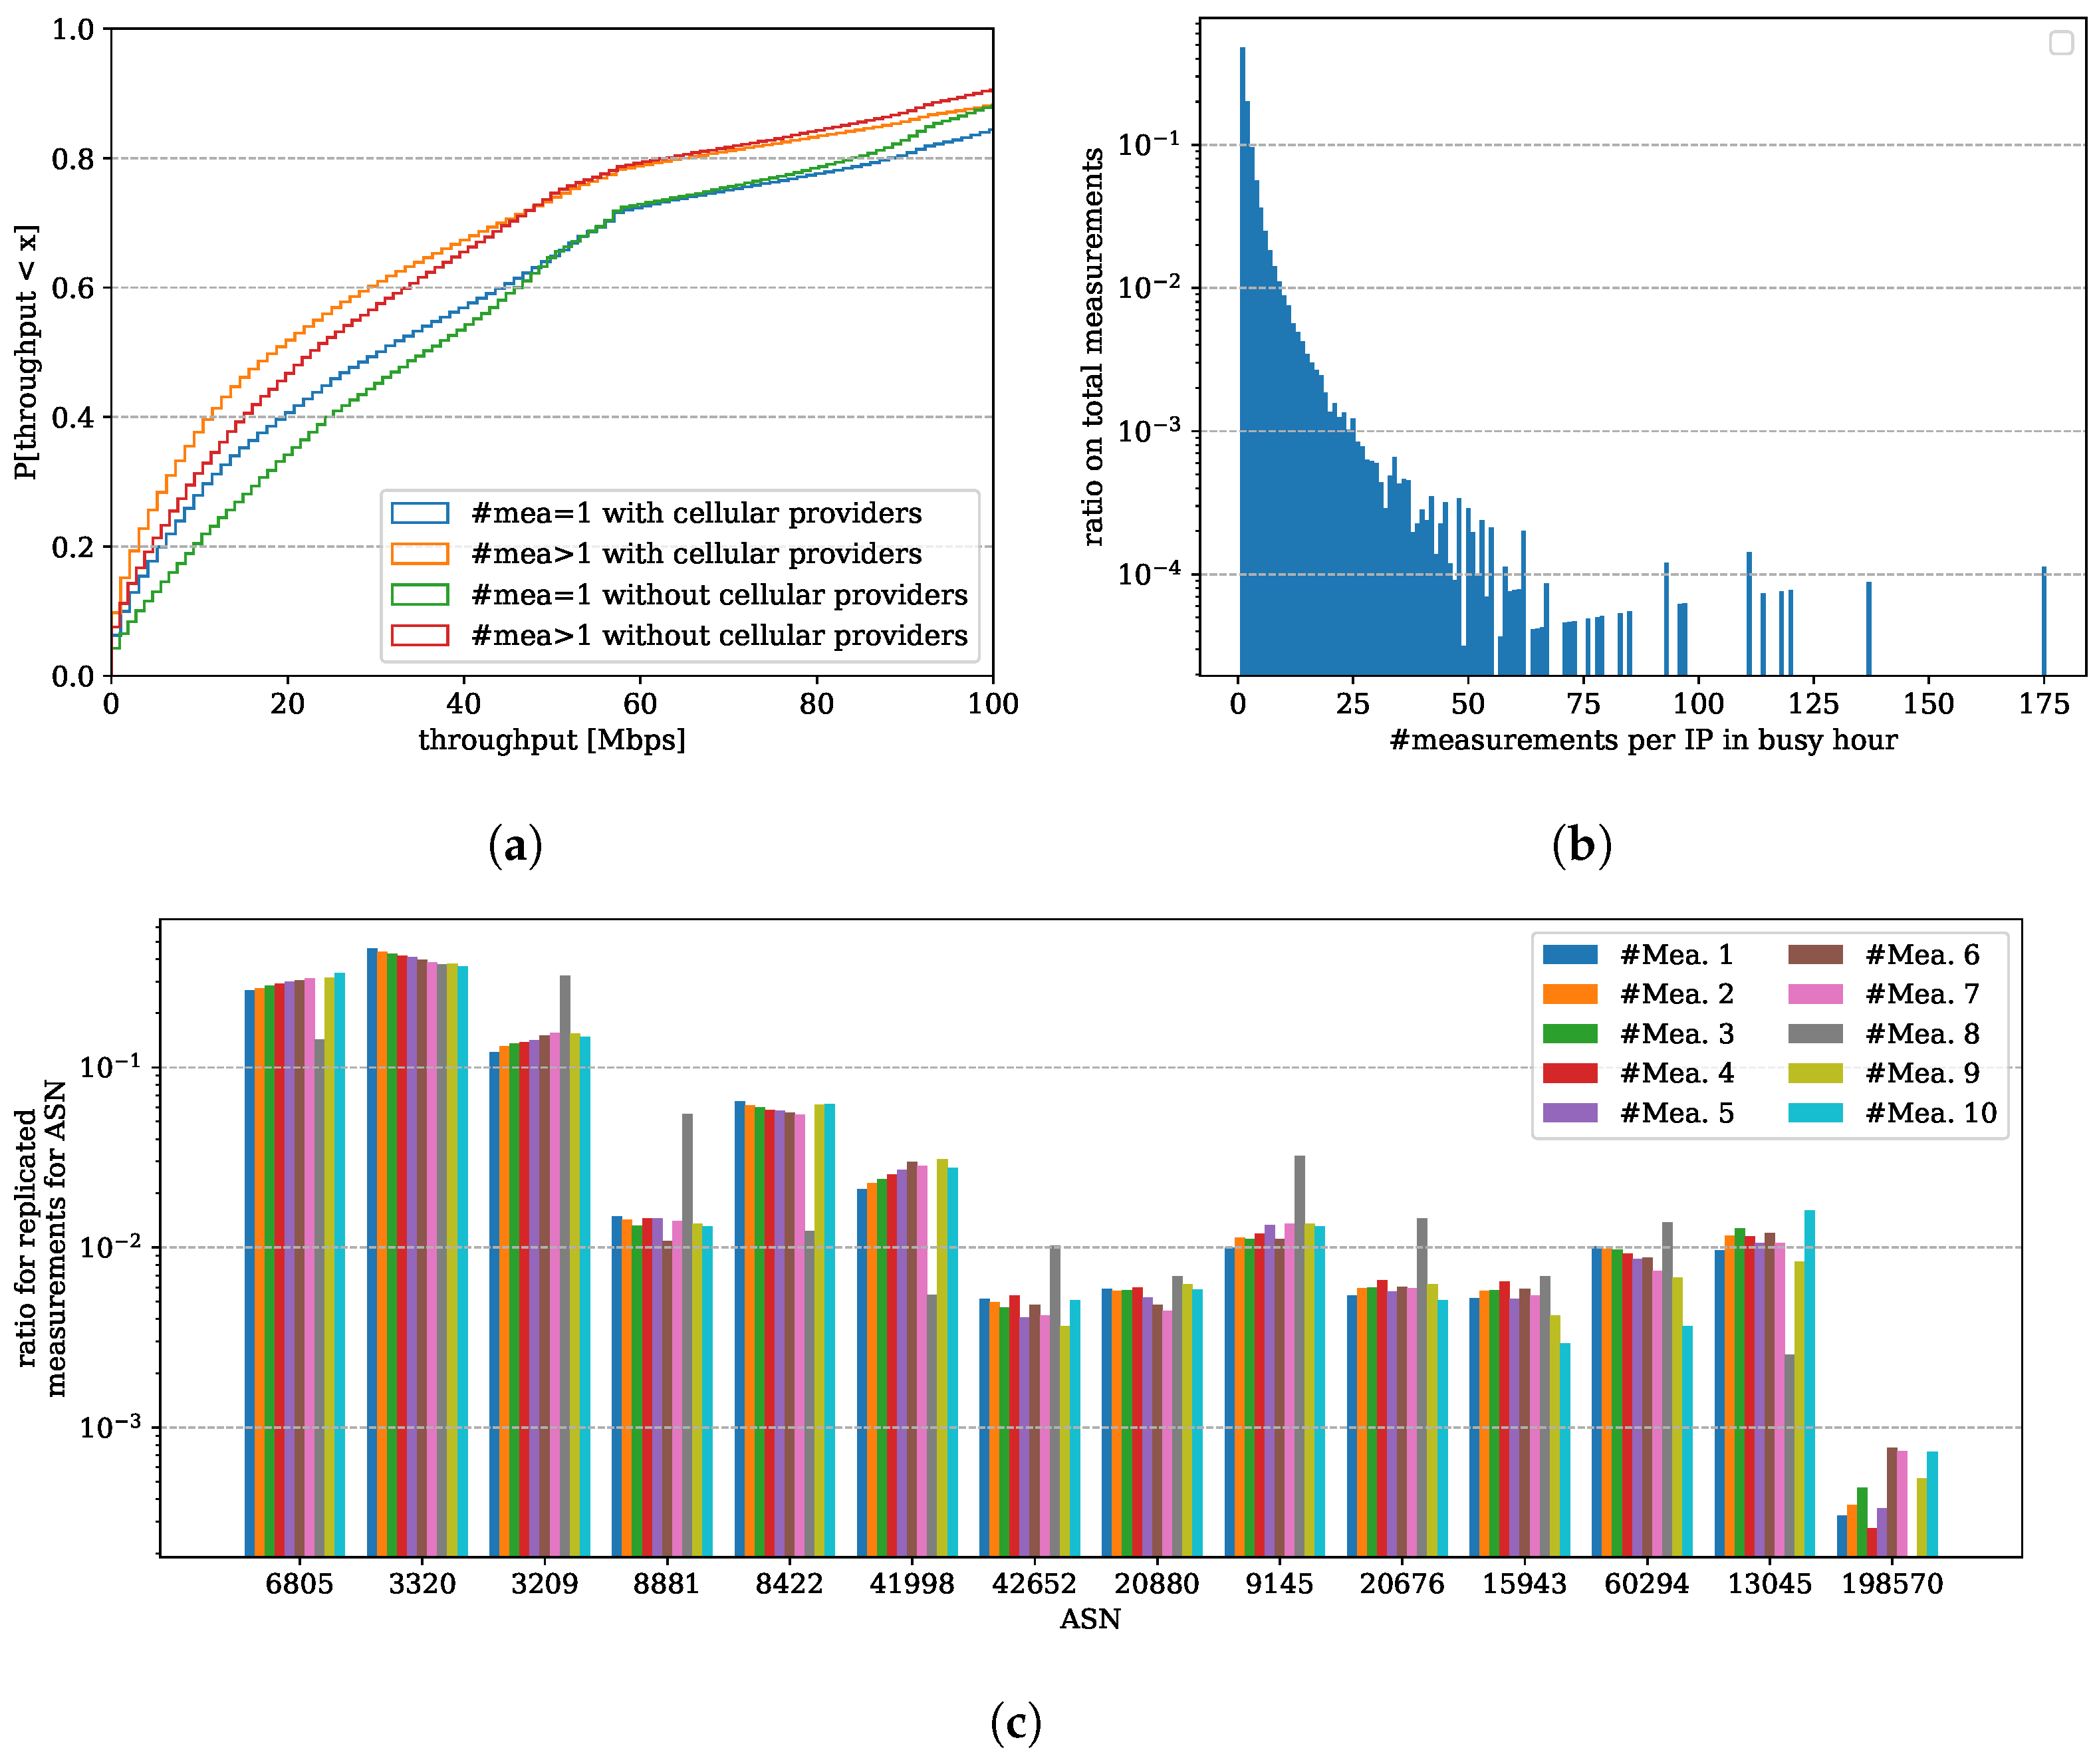
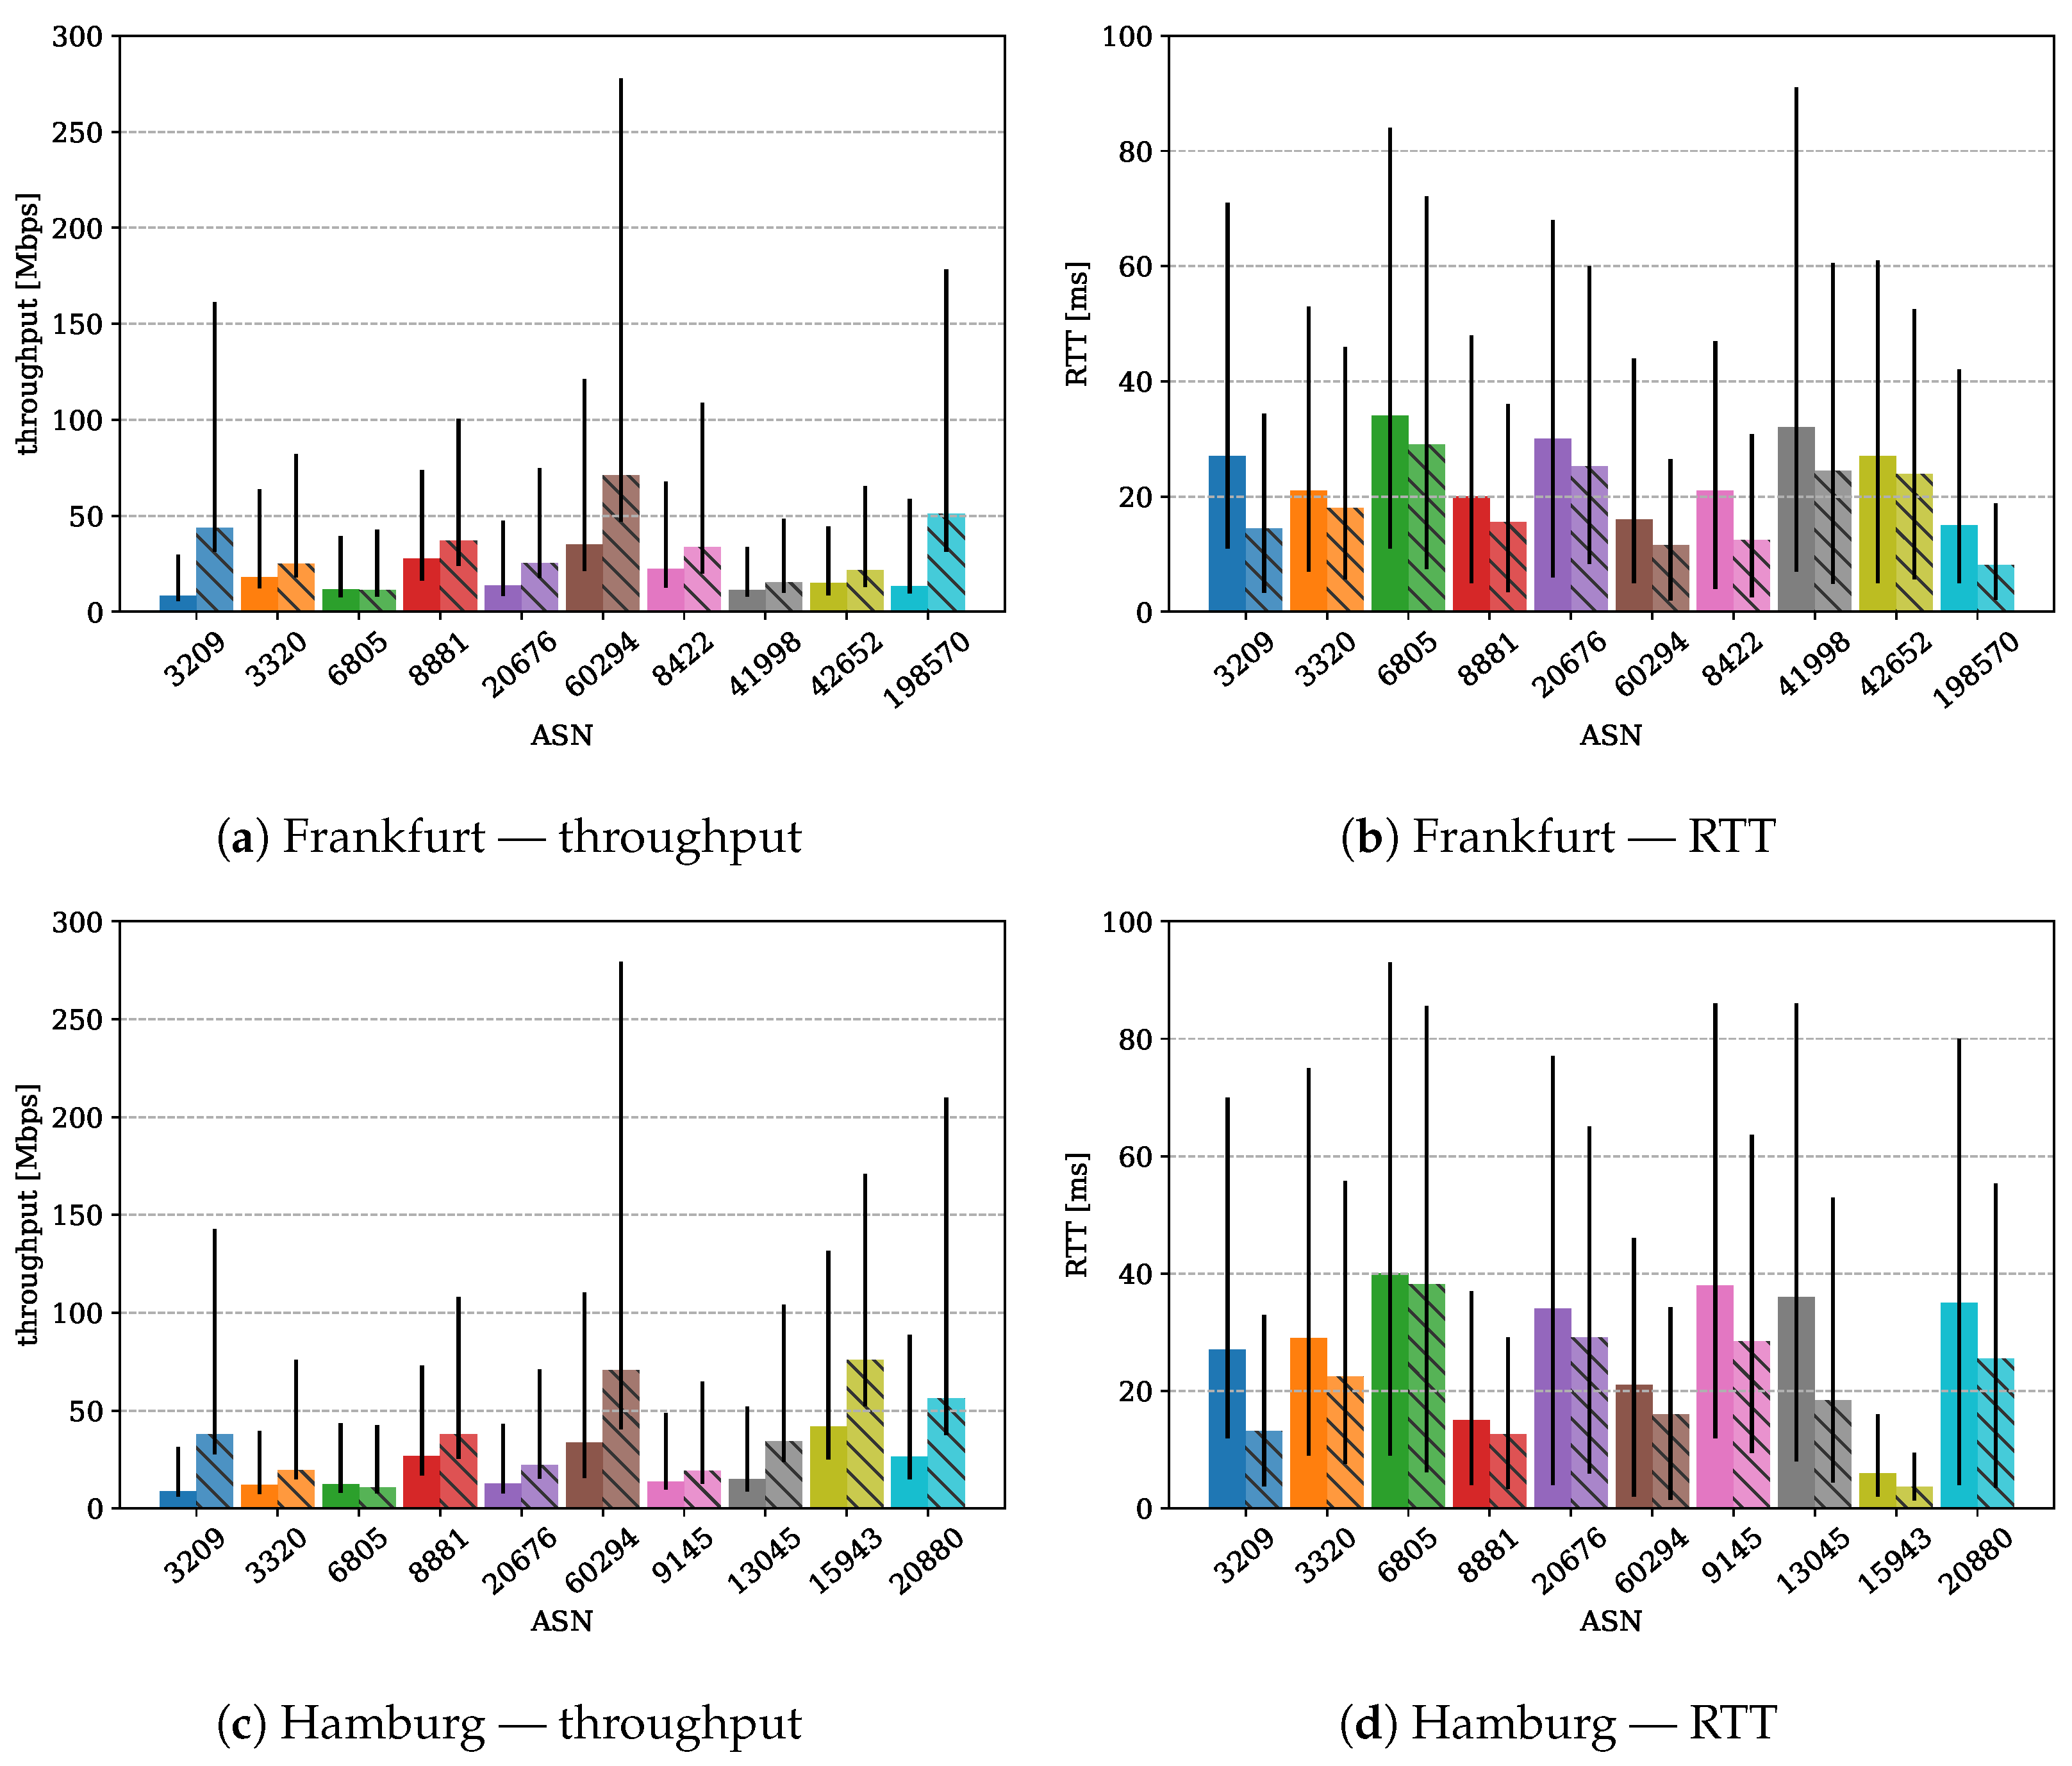
4.1. Popular ASNs in Germany

For the locations in Hamburg and Frankfurt, we list the 10 most active providers in August 2021 in Table 3 and Table 4, respectively. Note that, Table 3 lists 11 ASNs from which we do not account the University Stuttgart as an ISP, since as a network provider for research institutes, it does not provide broadband network access for end costumers.
Furthermore, the tables show national providers as well as regional providers, which only occur in one of the tables. We classify the providers as national (N), regional (R), as well as wired broadband (B) and cellular (C) providers. The results show that three providers account already for 71% and 75% of all measurements in Frankfurt as well as in Hamburg. These three providers are national providers and provide cellular as well as wired broadband services. For further evaluations, we restrict the evaluations to 10 popular ISPs for each location. The selections already include about 90% of all measurements performed, but exclude measurements from non-ISP networks such as research networks or non-ISP entities with our own ASNs, which typically have connections with properties divergent from end costumer connections.

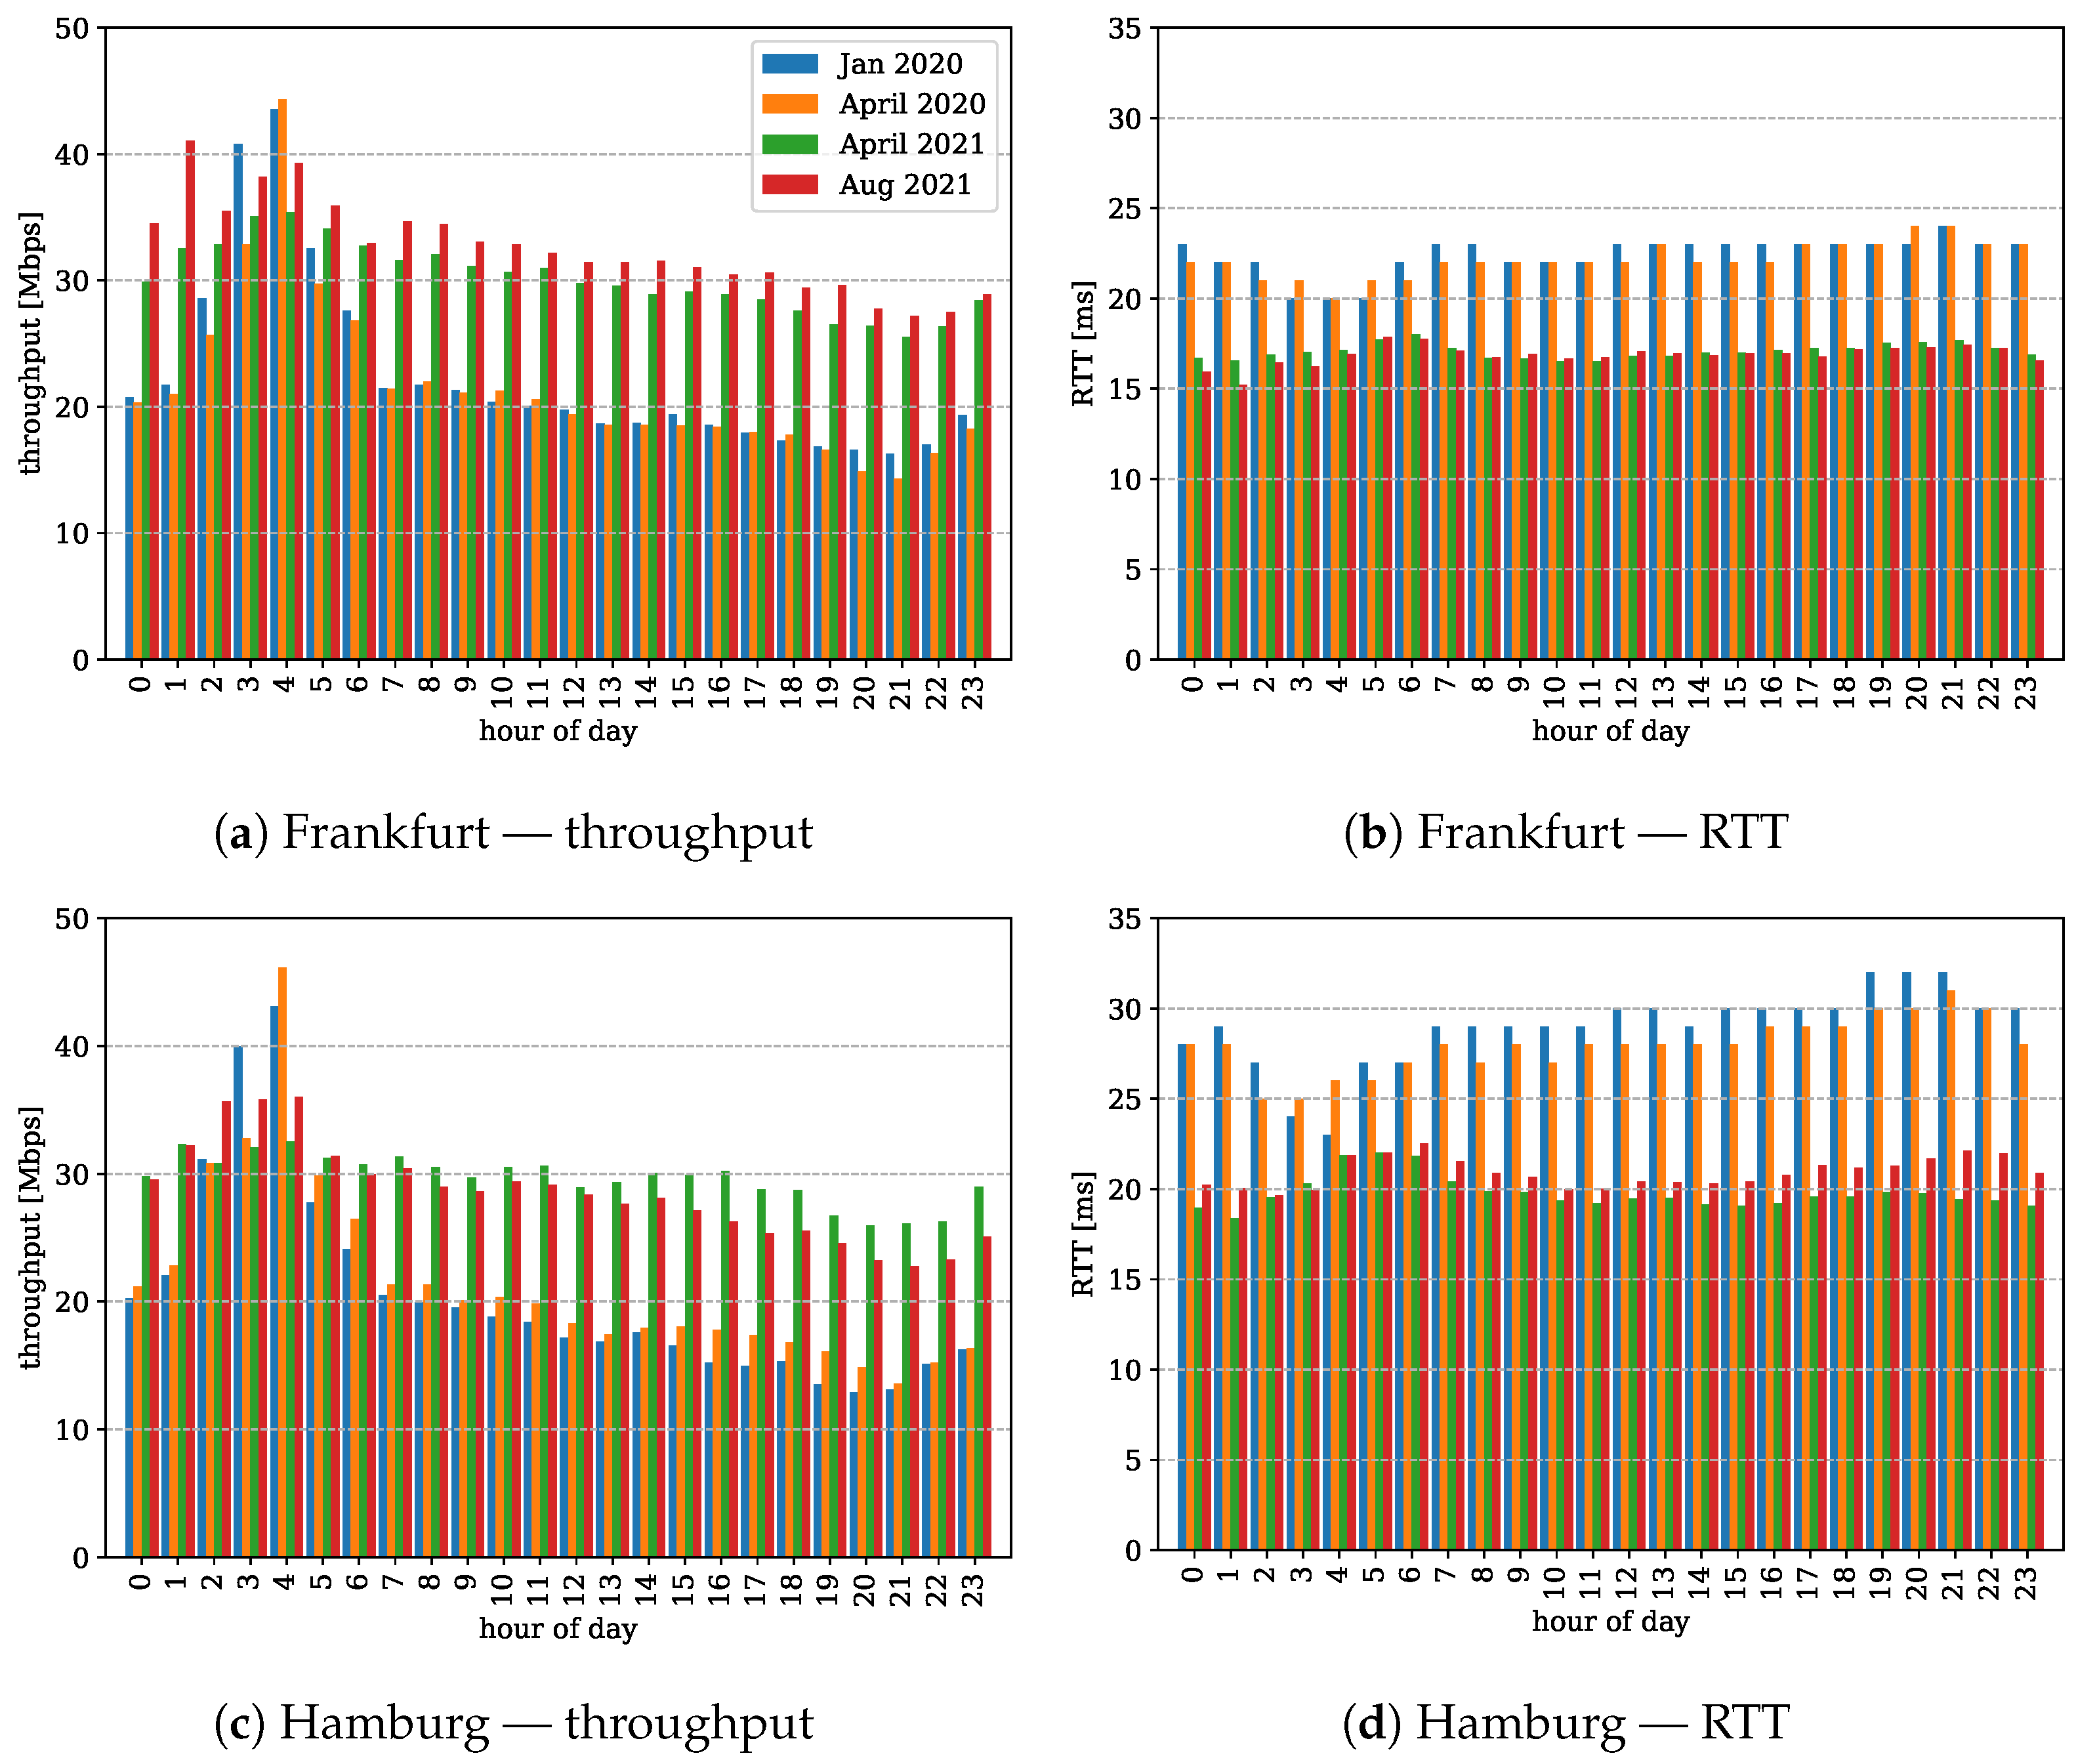
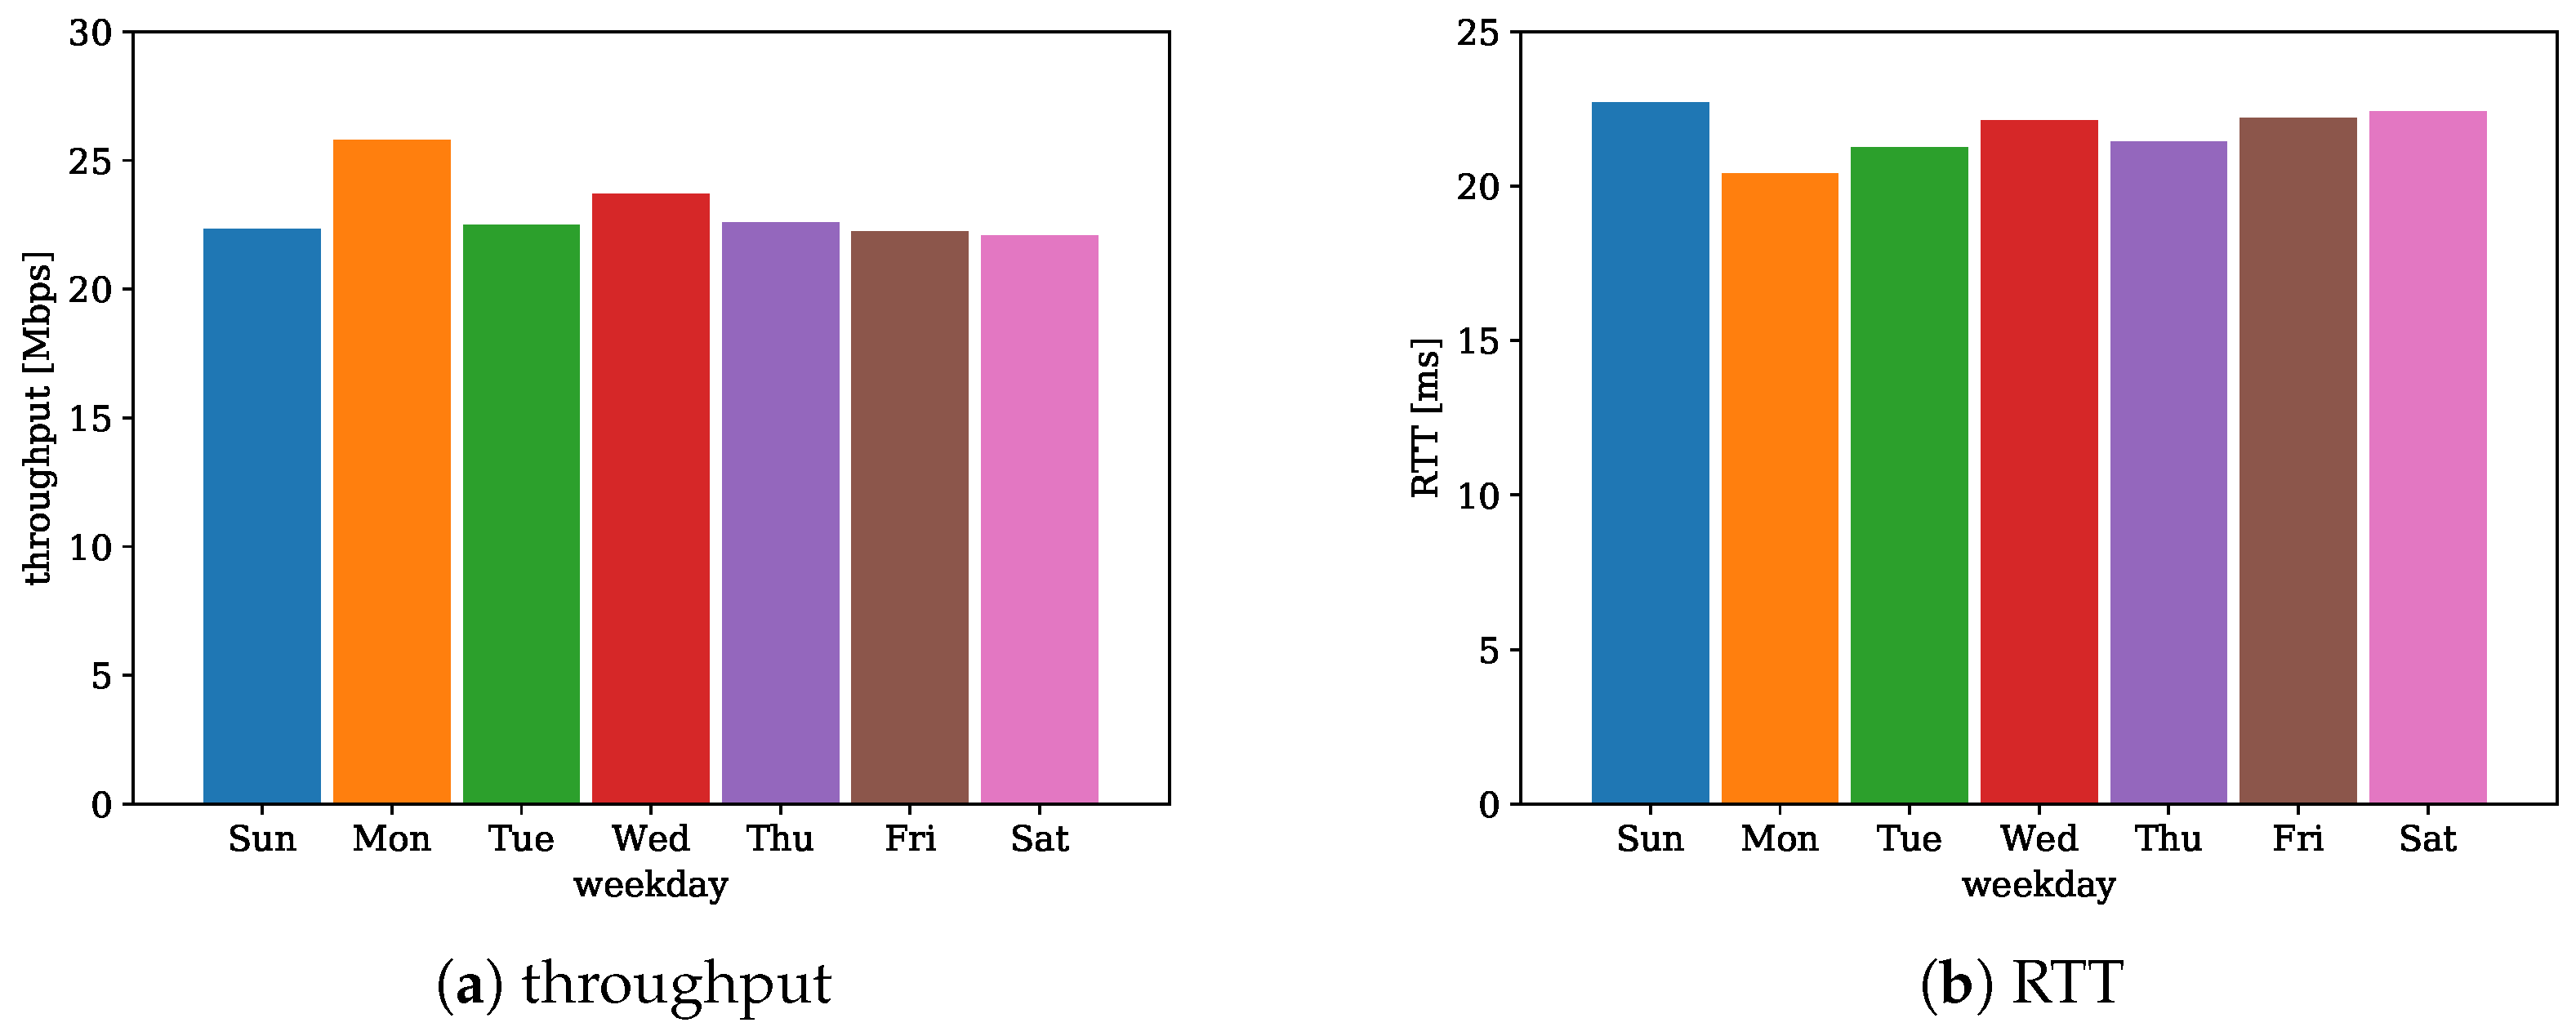
4.2. Busy Hours and Days

To identify busy hours, we evaluate the number of measurements and number of different IPs performing a measurement during hours of day in Figure 1 for August 2021 to identify the current user behavior. Moreover, we rely on the achievable throughput. For this relation, we assume that during busy hours the achievable throughput decreases due to a higher network utilization. We differentiate between the two congestion control protocols available. For the congestion control protocol TCP BBR, we see a clear pattern for both locations with a peak at 8 p.m. For further evaluations, we fix the busy hours interval from 8 p.m. to 10 p.m. Figure 1 shows further that the number of measurements is greater than the active IP addresses, i.e., multiple measurements are performed by one IP address.
Possible reasons for multiple measurements are (i) a client performs multiple measurements executed by a user or automated by a program, and (ii) multiple users share a single IP address. For example, the second issue is the case for private and enterprise networks that use a private network address space and network address translation (NAT) for Internet access. In addition, often private network addresses and NATs are used in cellular networks, too.
To identify the causes of the difference between the number of measurements and the number of active IP addresses, we compare the CDFs for all IPs that occur once and multiple times during the busy hours. Since NAT is used often in cellular networks, we differentiate results for all providers and non-cellular providers.
From Figure 2a, we learn that there is a difference between measurements that are performed once by an IP address per busy hour and measurements performed multiple times from the same IP address. The probability to achieve a lower throughput is greater for measurements performed multiple times from the same IP address. Figure 2b shows that 50% of the measurements performed by a unique IP address during the busy hour, i.e., 50% of the measurements stem from IP addresses that perform multiple measurements. From few IP addresses, many measurements are observed, e.g., in August 2021, 1 IP address performed 175 measurements during 1 busy hour interval. Figure 2c breaks the ratio down to each ASN of the access provider, i.e., the number of IPs that perform X measurements per busy hour in ASN Y to the number of IPs that perform X measurements per busy hour in all ASNs. Here, we limit the displayed range of X to at most 10 measurements for better visibility, so we include about 90% of all measurements. Obviously, the ratio between the ASNs varies due to the number of costumers, still, the ratio of the number of measurements performed by one IP address is mostly equal within each ASN. Therefore, we conclude that repeated measurements occur similarly for all providers and are not specific to a particular provider. In addition, we do not see a difference between providers with and without cellular networks. So, for comparison of providers, we include all measurements even if the measurements are performed by one IP address. As mentioned before, from the data, it is not possible to differentiate between the reasons for multiple measurements and the clients’ behavior between providers is similar.
For TCP Cubic, we observe in Figure 1a different pattern. There is no clear peak visible, but a regular pattern with a reduction in the number of measurements at 1 a.m., 7 a.m., 1 p.m., and 7 p.m., i.e., with a cycle of 6 h the number reduces. In addition, the number of measurements and IP addresses is nearly equal, which indicates that the measurements are performed by different clients. Compared to TCP BRR, the number of measurements are small. From this, we infer that measurements using TCP Cubic are mostly performed by automatic test methodologies that rely on the outdated NDT5 test and do not support the newer NDT7 test, which is conducted by end user devices. Therefore, measurements using NDT7 reflect the end-user behavior better than NDT5 tests. A similar behavior of repeated measurement pattern is described in [11] for networks in the US.
The difference between TCP Cubic and TCP BBR observed before continues for the throughput and RTT. In Figure 3, TCP Cubic performs much better than TCP BBR, the periodic pattern is also visible in the throughput and RTT. As described before, measurements using TCP Cubic are performed by a few clients following a periodic pattern. Therefore, we do expect these results to be not representative for typical customers. Measurements using TCP BBR were introduced in February 2020 and became predominant in August 2020 on the selected servers. Therefore, we do not aggregate results for TCP Cubic and TCP BBR. Before August 2020, TCP Cubic gave a more representative mapping of the performance, since August 2020, it is TCP BBR. In the following results, we only include results from the predominant protocol in the respective months.
In August 2021, the busy hour starts at 8 p.m., we further analyze selected previous month. Of special interest is April 2020, since at the end of March a lockdown due to the COVID-19 pandemic was enforced in Germany. Figure 4 compares January 2020 (before the COVID-19 pandemic), April 2020 (beginning of the lockdown), April 2021 (one year after the lockdown), and August 2021 (most recent month). The months in 2020 still rely on TCP Cubic, the results from the year 2021 on TCP BBR. For all months, we identify a low throughput at 8 p.m. and 9 p.m., which comes along with a slight increase in the RTT. The highest throughput and lowest RTT is achieved after midnight. The months in 2020 show a difference in throughput of about 20 Mbps, and in 2021, the difference is about 10 Mbps. Note that, in 2020, all TCP Cubic measurements were included, but in 2021, only the TCP BBR measurements are shown. Especially, during the hours after midnight, the number of measurements decreases, so that the continuous TCP Cubic measurements mentioned before, see Figure 3, would raise the throughput during this interval, which makes a direct comparison impossible. However, the trend of the performance increase is clearly visible, but no effect of the lockdown is obvious in this evaluation. We show later that a performance decrease exists in dependence on the AS.
For the weekly pattern, we compare the throughput and the RTT during the busy hours. There is not such a clear difference in throughput. Figure 5 plots the median throughput for all machines in Germany and the 10 most popular access providers at each location from August 2021 during the busy hours. On Sundays, the performance decreases slightly. Mondays shows the best performance, and the other days show a very similar performance.
For later evaluations, we make use of these results such that we restrict evaluations to the busy hours from 8 p.m. to 10 p.m., since these are of most interest to end costumers. Since there is no large difference in the weekly pattern, we do not differentiate between the weekdays for the evaluation.

4.3. MLab Locations in Germany

Next, we analyze the differences in the locations Frankfurt and Hamburg for all machines during busy hours. For each site, we reduce the clients to the prevalent AS numbers, see Table 3 and Table 4. We analyze different months to examine impacts of the COVID-19 pandemic and restrict the data to the congestion control protocol TCP Cubic in the year 2020 and TCP BBR in the year 2021, both are the predominant protocols for the presented months. In Section 4.2, we elaborated in detail why measurements for, e.g., TCP Cubic, are excluded in months in which TCP BBR accounts for the majority of measurements.
Figure 6 shows that the number of measurements are equally distributed between the machines at one location, since at the Hamburg location, only one site exists, and the number of measurements are about two to three times larger. Exceptions are the site fra04, which has fewer measurements in January 2020, and site fra06, which was not available in January and March 2020. We especially include the month January and March 2020 to examine the impact of the lockdown again. The previous aggregation of results on the median throughput and RTT of all machines at a location hides effects of the lockdown in Figure 4. Here, a performance impact is visible for the sites fra04 and fra05. Most of the sites do not present any obvious difference in throughput and RTT, only the sites fra04 and fra05 have a large decrease in performance. The median throughput decreases strongly for fra04 and fra05, and the RTT increases by a few milliseconds. The site ham02 shows a slight decrease in throughput. All the mentioned sites exhibit larger RTTs than the other sites. Note that all sites in Frankfurt are located in different autonomous systems.
Differences vanish in 2021. Still, the Hamburg site shows a slightly worse throughput and RTT, but the machines at the Frankfurt location show a similar throughput, and only the RTT of the site fra04 is greater compared to the other machines. From these differences, we infer that the location and AS of the servers have a slight impact on the performance. Since the effect that a few sites perform slightly worse in the year 2020 as well as 2021 but with an increasing number of measurements over time, the continuity of a worse performance may not originate from the servers but is due to topological differences.

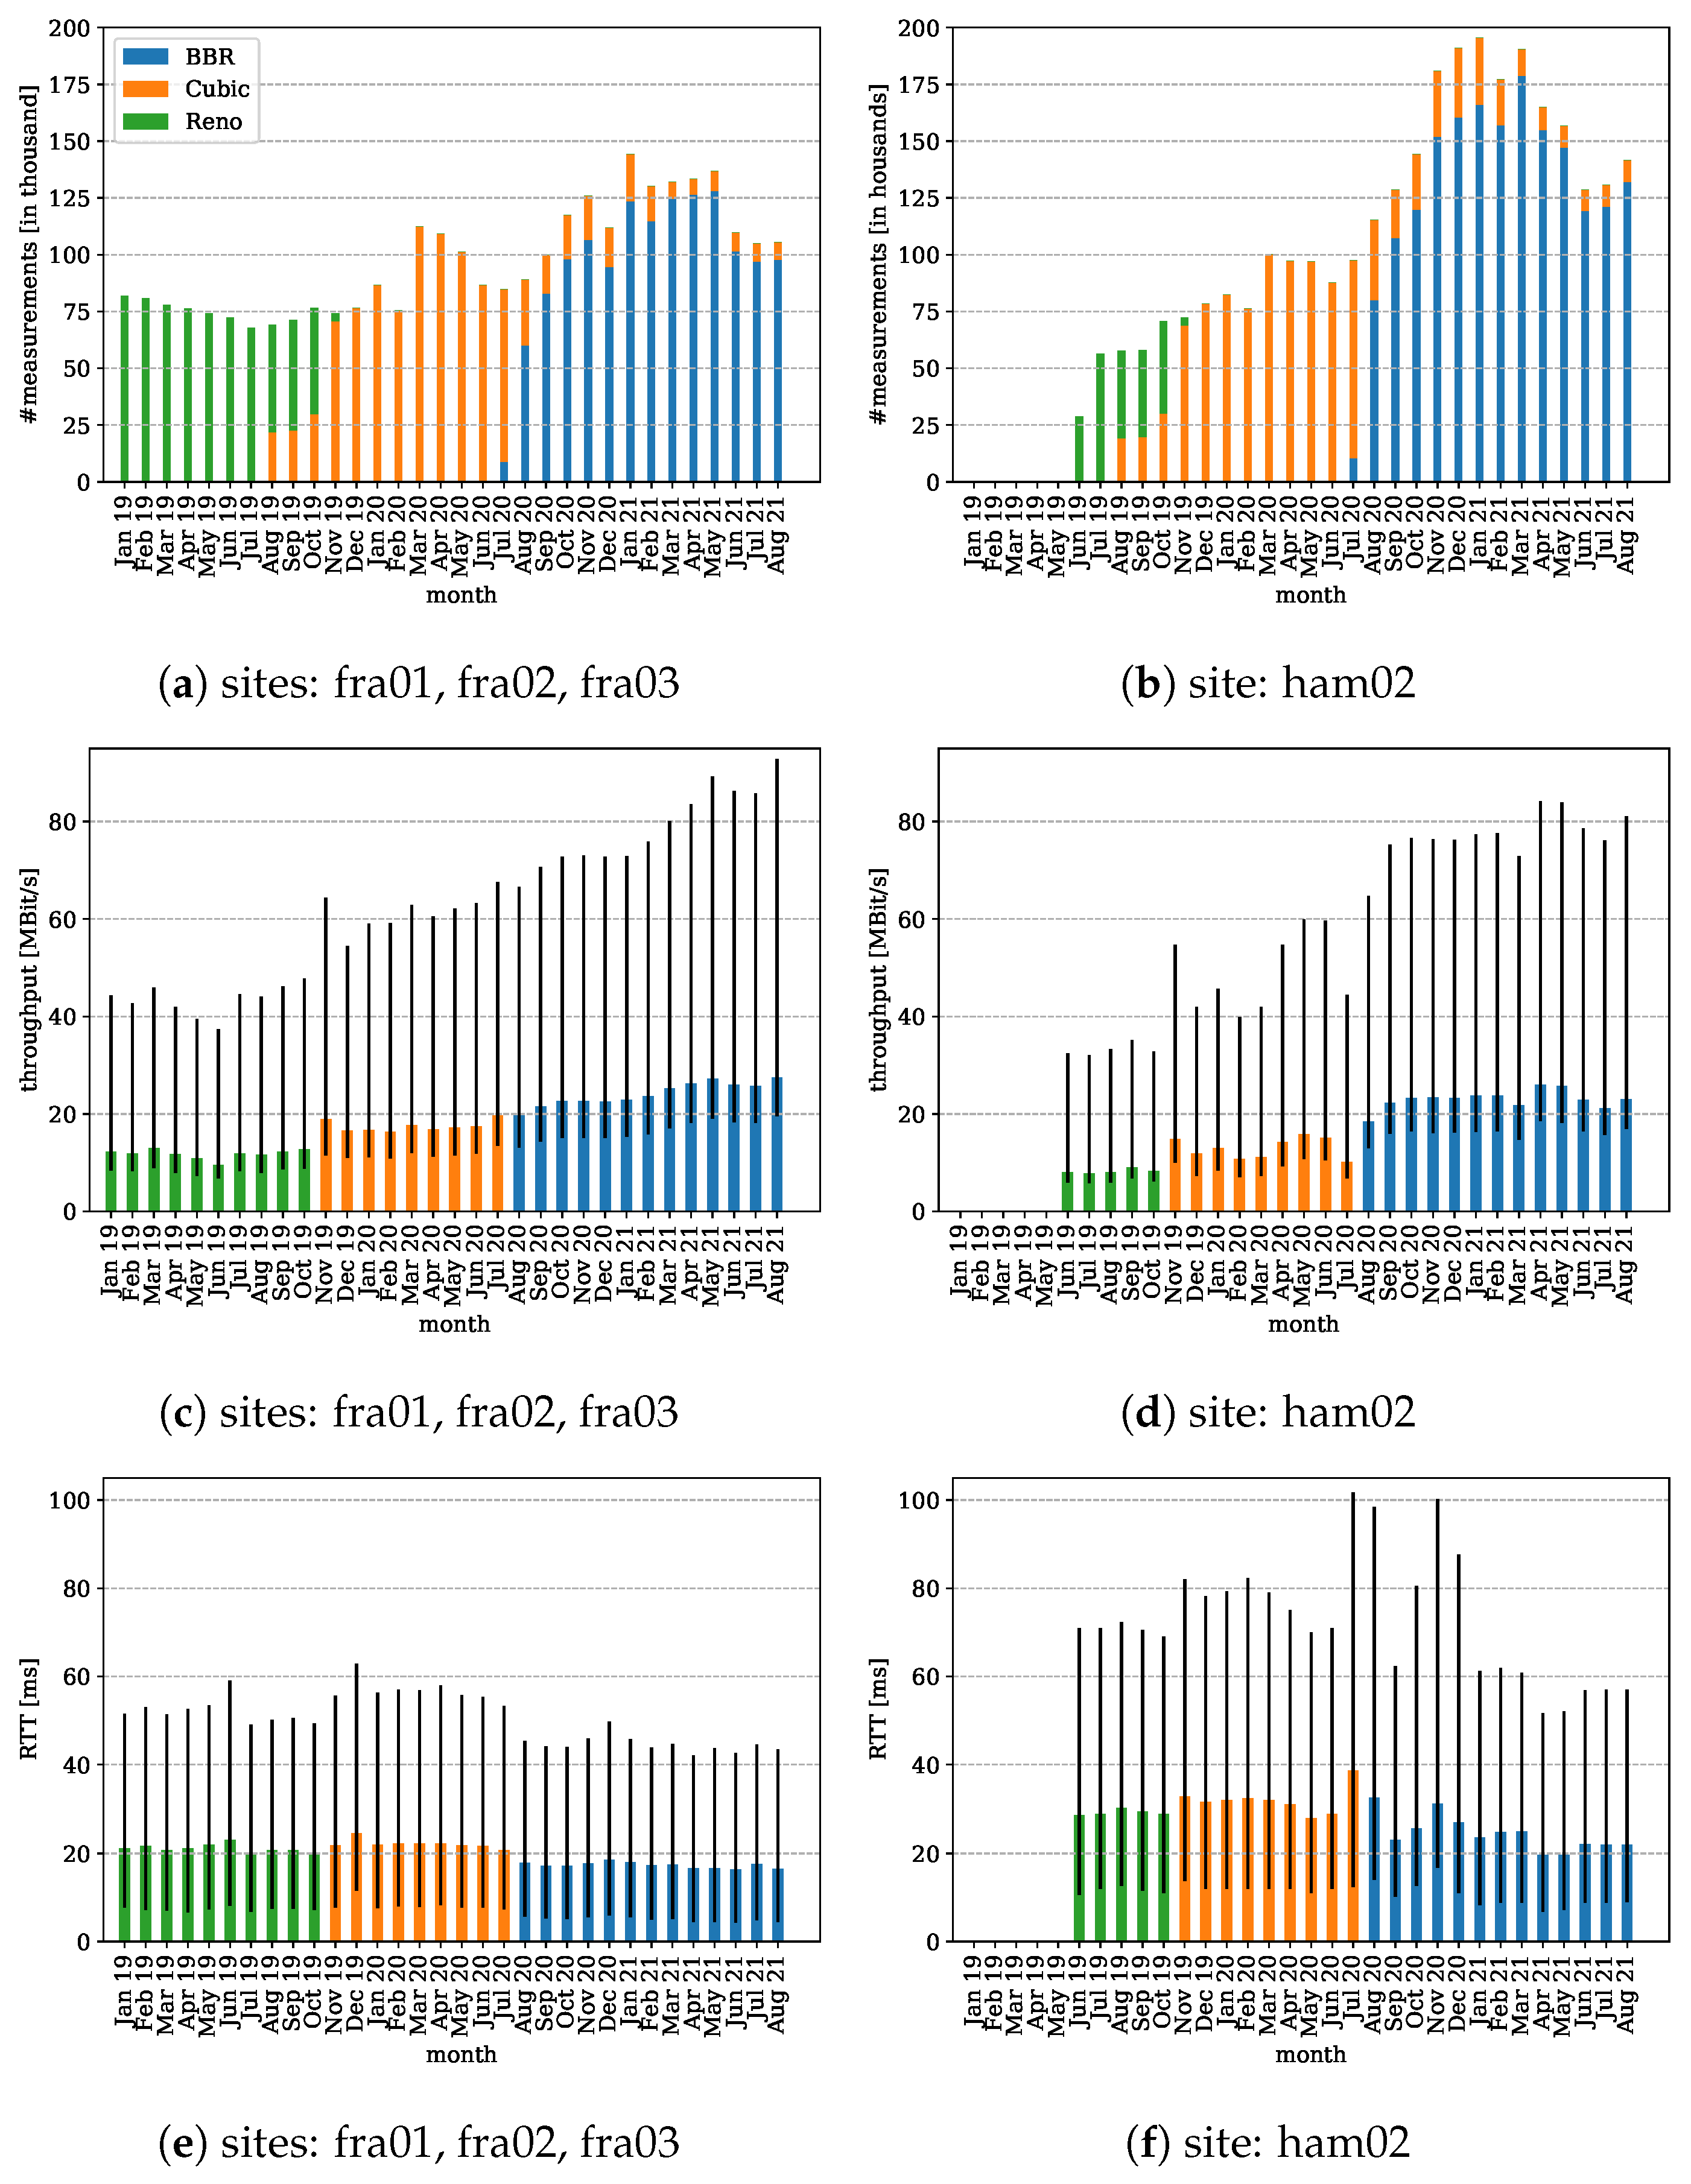
4.4. Performance Evolution of Congestion Control Protocols

The previous parts of this section restrict the data to yield a subset of the data for a representative evaluation. We use this constrained dataset here to compare congestion control protocols. In the past, MLab implements three tests using the TCP congestion control protocols Reno, Cubic, and BBR. Here, we compare the evolution of the throughput and the RTT over time. We examine results from three sites located in Frankfurt, which perform equally, as described in Section 4.3, and one site in Hamburg. Figure 7 presents the number of measurements, the throughput and the RTT. For the throughput and RTT, the median and the 25 and 75 percentiles are presented. For the evaluation, only results from the busy hours and previously selected providers are included.
Figure 7a,b show the number of measurements differentiated by the congestion control protocol. Until November 2019, TCP Reno was the predominant protocol. Between November 2019 and July 2020, it was TCP Cubic, replaced by TCP BBR. Note that the number of measurements are balanced between three machines in Hamburg and nine machines in Frankfurt.
Both locations show an increase in throughput over time, especially the change from TCP Reno to TCP Cubic indicates a strong increase, which gives rise to a better performance for TCP Cubic than TCP Reno. Still, the higher throughput comes along with a slightly higher RTT, explainable by the faster congestion window adaptation of TCP Cubic [24]. The changeover in July and August 2020 to TCP BBR gives a less clear picture, the throughput for the measurements performed to machines in Frankfurt is similar, and the throughput in Hamburg increases in August 2020. Nevertheless, it dropped in the previous month. Although for all machines the RTT decreases, which reflects the goals of TCP BBR, for a high utilization without excessive buffering, see [25]. The reduction of buffering in turn reduces the delay.

4.5. Comparison and Evolution of Popular Internet Service Providers

Previously, we compared the different sites using the server site AS number. Here, we compare the different ISPs and their evolution. We again filter for the busy hour interval and limit to the popular providers for each location. We plot the 25% and 75% percentiles, as well as the median for the throughput and the RTT in Figure 8 for January 2020 and August 2021. The bars with hatches show the results for August 2021, and the bars without hatches determine the results from January 2020.
Six providers are popular at both locations, whereas further providers occur only at one location. The results show huge differences between the providers. Especially, the throughput and RTT for the provider with ASN 3209 improved. The median throughput increases by about a factor of three and the RTT nearly halves. Additional providers that stand out are providers with ASN 60294 and ASN 15943. The ISP with ASN 60294 provides fiber to the home exclusively, whereas others may include further access technologies such as digital subscriber lines, cable Internet, or cellular access. The provider with ASN 15943 shows a significant lower RTT than all other providers, which is likely in part due to an advantage of its supply area, which is the greater area of Hamburg. Thereby, it is geographically close to the measurement servers in Hamburg.

5. Discussion

In this part, we discuss our evaluation procedure first, and later, we discuss results derived from our analysis regarding the Internet performance regarding application requirements and observations during the COVID-19 lockdown and show results on the evolution of congestion control protocols on the Internet.

5.1. Internet Performance Evaluation Methodology

To make statements on the Internet performance and its evolution, we have to carefully confine the dataset to mitigate undesired effects. Only using median results may hide characteristics embedded in the dataset, e.g., during the COVID-19 pandemic, the performance degraded in two of six ASNs, as we have shown before. Simply using the median or averaging results would hide this local performance degradation and its root cause that is located in the transit networks and not in access networks. Such simplifications can lead to erroneous statements as reported and clarified in [11].
Typically, the Internet performance is evaluated by the point of view of an end user. The end user is interested in which applications the connection supports. Generating unbiased estimates are difficult due to the distributed and time-varying nature of the Internet, e.g., the same connection at the same point in time may deliver a good performance to one destination but a poor performance to another destination with a divergent path.
To avoid systematic bias in the comparisons, we carved out factors of impairment. The previous results show that the performance in terms of throughput and RTT are impacted by the time of day and the congestion control protocol, whereas we show that the difference in congestion protocols after the TCP BBR becomes the predominant protocols stems from clients with a different behavior. Clients using TCP Cubic perform periodic measurements, but clients using TCP BBR present a behavior with a peak in the number of measurements in the evening hours. This leads to the guess that clients using TCP Cubic are legacy clients performing automated measurements, whereas clients using TCP BBR perform user induced measurements. More details are given later in this section. Slight differences in the results are also visible in the locations of the measurement servers and the day of the week.
To analyze the impact of machines, sites, and locations on measurement results, we compare all machines available in Germany. Especially between the Frankfurt and Hamburg locations, the number of measurements for each machine differs by a factor of about three, see Section 4.3, still performance results are similar. Therefore, we conclude that the utilization and the location of the measurement server has a small impact on the result. This difference stems from topological differences but not from the different utilization of the servers, since systematic difference are also visible during time periods of a small utilization of the servers, see Figure 3. Exceptions to this description occur during the COVID-19 pandemic lockdown and are described later in this section.
From this breakdown of the individual factors, we propose that for a comparable evaluation, all these factors have to be considered to produce sophisticated Internet performance evaluations.

5.2. Performance Evaluation

For measurements conducted to the German MLab servers, the database contains mostly measurements performed from three national providers in Germany, see Section 4.1. These already account for about 70% of all measurements. If we include the top 10 providers from which measurements are performed, the results show these account for about 90% of the measurements. Many of these providers are regional providers. By the use of this information, we identify the busy hours by counting the number of measurements, active IP addresses, and the decrease in throughput measurement results. Most measurements and a decrease in throughput occur typically in the evening hours. We also compare the top 10 ISPs for each location. The results include ISPs that provide different kinds of wired access networks and wireless access, so a comparison is biased by the mix of different access technologies. Nevertheless, one provider which exclusively provides fiber access performs best with one exception to a regional provider, which shows very small RTTs. However, these results may be influenced by the proximity of clients to the measurement server, since the provider operates in the greater area of Hamburg, but measurements from other providers typically comprise larger regions up to the whole country. Nevertheless, the difference in the median RTT of about 20 ms in comparison to other ISPs goes strongly beyond the propagation delay. If we assume a symmetric RTT, i.e., a one way delay of 10 ms, and propagation speed of 75% of speed of light, the difference would account for 2250 km, which is significantly greater than the air-line distance of Germany from north to south of 876 km.
If we compare the application requirements stated in the introduction and summarized in Table 5 to the results from August 2021 in Section 4.4, we see that typically the latency, approximated with half of the RTT, in the 75 percentile is sufficiently small to support all applications. However, the throughput shows a different picture. Roughly half of the measurements show a throughput of 25 Mbps required for UHD video streaming and much less achieve a data rate required for UHD cloud gaming. Nevertheless, a throughput required for HD video streaming is measured by more than 75% of tests. As mentioned before, the test measures the TCP performance, and voice applications and cloud gaming typically rely on the real time protocol, which uses the user datagram protocol at the transport layer. Since the minimal RTT is extracted from the TCP stack, the value should be in the range of the propagation delay and processing delay along the path without queuing delays. Still, the results present a snapshot of a time-varying metric. Furthermore, the TCP throughput given as the average throughput of the connection is influenced by the congestion control algorithm, so that the available bandwidth may be greater. Nevertheless, protocols for real media such as the Web real time protocol (WebRTC) typically implement different congestion protocols, see [31], which may lead to divergent results.

Performance Impairments during the Lockdown—Does the Internet Bear Up against the Rush?

In the beginning of the lockdown due to the COVID-19 pandemic, there was a worry about performance degradation of the Internet. From our evaluation, we demonstrate the performance degradation was only notable partially. During the COVID-19 lockdown, a performance degradation on few machines located in two of six autonomous systems are visible, see Figure 6. In one ASN, the achieved throughput was reduced to less than 5 Mbps and in another to about 8 Mbps in March 2020. However, the performance degradation is no longer visible in the evaluation from the year 2021, which indicates an increase in the network capacity.

5.3. Evolution of Congestion Control Protocols—Do Protocols Keep Their Promises?

Furthermore, we compare the different congestion control protocols used in the MLab. Often, congestion control protocols are developed for specific scenarios, TCP Cubic targets at connections with a large bandwidth delay product. The design goal of TCP BBR is to avoid extensive use of buffers along a path to reduce queuing delays. Therefore, evaluations are often conducted in selected and controlled environments to show improvements or shortcomings. Here, we evaluated the performance based on a real-world measurement dataset.
Since these protocols were deployed in different time intervals, the continuous improvement of ISP networks in throughput and RTT hinders a direct comparison. Still, differences are visible, when a new protocol was deployed and became the predominant variant. The throughput escalates when TCP Cubic replaces TCP Reno, and the RTT decreases when TCP BBR replaces TCP Cubic. Both observations reflect the design goals of the respective congestion control protocols. TCP Cubic aims for a better utilization and therefore a higher throughput [24]. TCP BBR targets on the reduction of excessive queuing delay and reduces the RTT, see [25].
Still, the comparison of TCP Cubic and TCP BBR reveals pitfalls of the datasets of unsupervised experiments, i.e., when and how often a client performs a measurement is up to the user. Furthermore, the complete path from the client to the server is measured, which may include poor local area networks and do not reflect the ISP performance. This is one reason, as stated in Section 3.3, to interpret results as a lower bound if results are used to evaluate access capabilities of ISPs. In our evaluation, we identify two peculiarities. First, the same IP address performs multiple measurements per busy hour intervals, whereas we also identify a difference in the throughput. Nevertheless, we also show that this behavior is similar for all providers, so we do not reject these measurements for a comparison. Second, after TCP BBR was deployed and became the predominant variant, few measurements still rely on the TCP Cubic. These measurements do not show a typical user pattern but are performed at a similar frequency during the day with a periodic reduction of measurements. Since TCP Cubic is kept in the MLab for legacy measurement setups, these measurements do not reflect a typical user behavior pattern and show significantly greater throughput measurements with a periodic reduction. We infer that these measurements are not representative after TCP BBR became the predominant protocol.

6. Conclusions

We provide a systematic confinement of the data collected by the MLab to generate comparable subsets of the data. Exemplarily, we provide an analysis of the data for ISPs in Germany that the busy hours are in the evening and the busiest days are Mondays. The server to which measurements are performed have typically a small impact, except during the COVID-19 lockdown. During the lockdown, there are few servers in different autonomous systems that perform worse, which indicates a local overload. The test results show that design decisions of TCP congestion control algorithms are apparent in the dataset. Furthermore, we present strong differences between providers. ISPs that provide fiber access networks outperform others. Especially, one local provider stands out, whereas the outstanding performance may be partially due to a home field advantage with respect to the server location.

Author Contributions

Conceptualization, R.L. and N.M.; data curation, R.L. and N.M.; investigation, R.L. and N.M.; supervision, R.L.; validation, R.L.; visualization, R.L.; writing—original draft, R.L.; writing—review and editing, R.L. and N.M. All authors have read and agreed to the published version of the manuscript.

Funding

We acknowledge financial support by Land Schleswig-Holstein within the funding program Open Access-Publikationsfonds.

Institutional Review Board Statement

Not applicable.

Data Availability Statement

The dataset is publicly available from the MLab, scripts to extract the used data, and related scripts to plot all figures available at https://gitlab.com/ralfluebben/mlab_germany_2021_data (accessed on 1 January 2022).

Conflicts of Interest

The authors declare no conflict of interest.

References

  1. ITU. G.114: One-Way TRANSMISSION Time. Available online: https://www.itu.int/rec/T-REC-G.114-200305-I/en (accessed on 1 January 2022).
  2. Di Domenico, A.; Perna, G.; Trevisan, M.; Vassio, L.; Giordano, D. A Network Analysis on Cloud Gaming: Stadia, GeForce Now and PSNow. Network 2021, 1, 247–260. [Google Scholar] [CrossRef]
  3. Flinck Lindström, S.; Wetterberg, M.; Carlsson, N. Cloud Gaming: A QoE Study of Fast-paced Single-player and Multiplayer Gaming. In Proceedings of the 2020 IEEE/ACM 13th International Conference on Utility and Cloud Computing (UCC), Leicester, UK, 7–10 December 2020; pp. 34–45. [Google Scholar]
  4. European Commission. A Digital Agenda for Europe; European Commission: Brussels, Belgium, 2010.
  5. European Court of Auditors. Broadband in the EU Member States: Despite Progress, Not All the Europe 2020 Targets Will Be Met; Publications Office of the European Union Luxembourg: Luxembourg, 2018. [Google Scholar]
  6. European Union. Directive (EU) 2018/1972 of the European Parliament and of the Council—European Electronic Communications Code; European Union: Brussels, Belgium, 2018. [Google Scholar]
  7. Bundesrepublik Deutschland. Gesetz zur Umsetzung der Richtlinie (EU) 2018/1972 des Europäischen Parlaments und des Rates vom 11. Dezember 2018 über den Europäischen Kodex für die Elektronische Kommunikation (Neufassung) und zur Modernisierung des Telekommunikationsrechts (Telekommunikationsmodernisierungsgesetz); Bundesministerium der Justiz und für Verbraucherschutz: Bonn, Germany, 2021. [Google Scholar]
  8. European Union. Regulation (EU) 2015/2120 of the European Parliament and of the Council—European Electronic Communications Code; European Union: Brussels, Belgium, 2015. [Google Scholar]
  9. Bundesnetzagentur für Elektrizität, Gas, Telekommunikation, Post und Eisenbahnen. Verfügung Nr. 99/2021; Bundesnetzagentur für Elektrizität, Gas, Telekommunikation, Post und Eisenbahnen: Bonn, Germany, 2021.
  10. Federal Communications Commission. Measuring Broadband America. Available online: https://www.fcc.gov/general/measuring-broadband-america (accessed on 1 January 2022).
  11. Clark, D.D.; Wedeman, S. Measurement, Meaning and Purpose: Exploring the M-Lab NDT Dataset; SSRN Scholarly Paper ID 3898339; Social Science Research Network: Rochester, NY, USA, 2021. [Google Scholar]
  12. Høiland-Jørgensen, T.; Ahlgren, B.; Hurtig, P.; Brunstrom, A. Measuring Latency Variation in the Internet. In Proceedings of the 12th International on Conference on Emerging Networking Experiments and Technologies, Orlando, FL, USA, 9–12 December 2019; Association for Computing Machinery: New York, NY, USA, 2016; pp. 473–480. [Google Scholar]
  13. Rajabiun, R.; McKelvey, F. Complementary realities: Public domain Internet measurements in the development of Canada’s universal access policies. Inf. Soc. 2019, 35, 81–94. [Google Scholar] [CrossRef]
  14. Deng, X.; Feng, Y.; Gharakheili, H.H.; Sivaraman, V. Estimating Residential Broadband Capacity using Big Data from M-Lab. arXiv 2019, arXiv:1901.07059. [Google Scholar]
  15. de Donato, W.; Botta, A.; Pescapè, A. HoBBIT: A Platform for Monitoring Broadband Performance from the User Network. In Proceedings of the 6th International Workshop on Traffic Monitoring and Analysis (TMA), London, UK, 14 April 2014; Lecture Notes in Computer Science. Dainotti, A., Mahanti, A., Uhlig, S., Eds.; Springer: Berlin/Heidelberg, Germany, 2014; Volume 8406, pp. 65–77. [Google Scholar]
  16. Sundaresan, S.; de Donato, W.; Feamster, N.; Teixeira, R.; Crawford, S.; Pescapè, A. Measuring Home Broadband Performance. Commun. ACM 2012, 55, 100–109. [Google Scholar] [CrossRef]
  17. Feamster, N.; Livingood, J. Measuring Internet Speed: Current Challenges and Future Recommendations. Commun. ACM 2020, 63, 72–80. [Google Scholar] [CrossRef]
  18. Bauer, S.; Clark, D.; Lehr, W. Gigabit Broadband Measurement Workshop Report. SIGCOMM Comput. Commun. Rev. 2020, 50, 60–65. [Google Scholar] [CrossRef]
  19. Liu, S.; Schmitt, P.; Bronzino, F.; Feamster, N. Characterizing Service Provider Response to the COVID-19 Pandemic in the United States. In Passive and Active Measurement; Springer International Publishing: Cham, Switzerland, 2021; pp. 20–38. [Google Scholar]
  20. Feldmann, A.; Gasser, O.; Lichtblau, F.; Pujol, E.; Poese, I.; Dietzel, C.; Wagner, D.; Wichtlhuber, M.; Tapiador, J.; Vallina-Rodriguez, N.; et al. Implications of the COVID-19 Pandemic on the Internet Traffic. In Proceedings of the Broadband Coverage in Germany, 15th ITG-Symposium, Online, 2–3 March 2021. [Google Scholar]
  21. Measurement Lab. The M-Lab NDT Data Set. Available online: https://measurementlab.net/tests/ndt (accessed on 1 January 2022).
  22. Mathis, M.; Heffner, J.; Reddy, R. Web100: Extended TCP Instrumentation for Research, Education and Diagnosis. SIGCOMM Comput. Commun. Rev. 2003, 33, 69–79. [Google Scholar] [CrossRef]
  23. Linux Programmer’s Manual—SOCK_DIAG. Available online: https://man7.org/linux/man-pages/man7/sock_diag.7.html (accessed on 1 January 2022).
  24. Ha, S.; Rhee, I.; Xu, L. CUBIC: A New TCP-Friendly High-Speed TCP Variant. SIGOPS Oper. Syst. Rev. 2008, 42, 64–74. [Google Scholar] [CrossRef]
  25. Cardwell, N.; Cheng, Y.; Gunn, C.S.; Yeganeh, S.H.; Jacobson, V. BBR: Congestion-Based Congestion Control: Measuring Bottleneck Bandwidth and Round-Trip Propagation Time. Queue 2016, 14, 20–53. [Google Scholar] [CrossRef]
  26. Gettys, J.; Nichols, K. Bufferbloat: Dark Buffers in the Internet. Commun. ACM 2012, 55, 57–65. [Google Scholar] [CrossRef] [Green Version]
  27. Measurement Lab. M-Lab—Conceptual & Technical Scope & Policies. Available online: https://www.measurementlab.net/mlab-scope (accessed on 1 July 2019).
  28. Measurement Lab. Locate API Usage. Available online: https://github.com/m-lab/locate/blob/master/USAGE.md (accessed on 28 July 2020).
  29. Chris Ritzo. NDT Unified Views Now Published. Available online: https://www.measurementlab.net/blog/new-ndt-unified-views (accessed on 7 May 2020).
  30. Riegel, B.J.; Bauer, S.; Zirngibl, J. An overview on Measurement Lab. In Proceedings of the Seminar Innovative Internet Technologies and Mobile Communication, Munich, Germany, 28 February 2020. [Google Scholar]
  31. De Cicco, L.; Carlucci, G.; Mascolo, S. Congestion Control for WebRTC: Standardization Status and Open Issues. IEEE Commun. Stand. Mag. 2017, 1, 22–27. [Google Scholar] [CrossRef]
Figure 1. Frequency of measurements and active IPs in thousands per hour in August 2021: Measurements using TCP BBR follow a typical end-user pattern with a peak at the evening hours and little measurements after midnight. TCP Cubic shows a regular pattern during the day with periodic reductions at 1 a.m., 7 a.m., 1 p.m., and 7 p.m.
Electronics 11 00162 g001
Figure 2. Impact of number of measurements performed by a single IP address during busy hours in August 2021 for TCP BBR: (a) CDF of the throughput for one or multiple measurements; (b) Ratio of IP addresses that perform X measurements; (c) Ratio of IP addresses that perform X measurements per ASN.
Electronics 11 00162 g002
Figure 3. Throughput and RTT per hour of day for August 2021: The performance for TCP BBR follows the pattern of the frequency, during evening hours the performance decreases, after midnight it increases. TCP Cubic shows a significant better performance than TCP BBR, also the periodic pattern at 1 a.m., 7 a.m., 1 p.m., and 7 p.m. is visible where TCP Cubic performs worse. This indicates a few clients account for many measurements with high throughput.
Electronics 11 00162 g003
Figure 4. Throughput and RTT per hour of day in January 2020, April 2020, April 2021, and August 2021: During the evening hours, the measured throughput decreases and the RTT increases, where after midnight the throughput increases and the RTT decreases slightly.
Electronics 11 00162 g004
Figure 5. Weekly pattern of throughput and RTT shown as median value.
Electronics 11 00162 g005
Figure 6. Number of measurements, throughput, and RTT for all machines in Frankfurt (f) and Hamburg (h) during busy hours for January 2020, March 2020, March 2021, and August 2021. The sites are f1, …, f6, and h2 with the machines numbered from one to three.
Electronics 11 00162 g006
Figure 7. Number of measurements, throughput, and RTT per month for TCP Reno, TCP Cubic, and TCP BBR for three different machines from January 2019 to August 2021. For the throughput and RTT median, 25% and 75% percentiles are shown.
Electronics 11 00162 g007
Figure 8. Throughput and RTT comparison of ISPs in Hamburg and Frankfurt for January 2020 and August 2021 (hatched bars).
Electronics 11 00162 g008
Table 1. Summary Related Work.
Ref.ScopeFindingsOur Contribution
[11]Evaluation of the MLab NDT testing procedure for ISPs in the US.Shows that justifiable conclusions can be drawn from the dataset and showcases pitfalls on the usage of the data.Especially, the observation that single IPs perform multiple measurements is recovered for German ISPs, we further analyze the performance impact and occurrence of multiple measurements at different ISPs.
[12]Measures latency variations on the MLab dataset and passive packet traces between 2010 and 2015.Large latency variations above 100 ms are common during connection.We do not evaluate the latency variation during the connection, but we observe small round trip times (RTTs) in 2021, even in the 75% percentile below 100 ms.
[13]Evaluation of public domain Internet measurements for Canada’s access networks by comparison speed tests from MLab, Akamai, and Ookla.The MLab and Akamai datasets return similar results, whereas the Ookla speed test returns typically greater results.We evaluate German ISPs with a procedure to extract representative data that confines the evaluation to busy hours, ISPs, and sites as well as locations of the measurement servers.
[14]Propose a method to evaluate broadband capacity exemplary for Australia and the US. The focus is on throughput and congestion count as well the evaluation of the effect that different households may share the same IP by the use of network address translation.Present that sharing IP addresses is common in Australia and individual households can be identified. Further results indicate the achievable throughput of these households.See line above.
[15]Design and deployment of a large-scale platform for measuring broadband performance to be able to schedule and control experiments centrally.A controllable platform avoids pitfalls of user-initiated tests. The evaluation shows that users do not achieve contracted rates.We provide insights to the evaluation of user initiated tests. The trade-off is between less control on the experiments and the convenience in collected samples.
[16]Measuring broadband performance by the use of home routers.The use of home routers avoids effects of home networks on the measurement and enables scheduling of experiments as well as comparison of different modems. Still, traffic shaping at ISPs hinder their comparisons.See line above.
[17]Evaluation of Internet speed tests under point of view of the interest of governmental organizations to evaluate the digital infrastructure.Shows flaws of current testing procedures and provides considerations for future testing.Even the authors criticize current testing procedures but still highlighting their importance. We show that with curation of the dataset of imperfect measurement procedures, representative results can be extracted.
[18]Report of a research workshop for broadband measurements.Presents ten takeaways on the current state of broadband measurements and gives future directions.The report elaborates generally on the difficulties, importance, and challenges on broadband measurements. We hope, that we can contribute to this field with our evaluation procedure.
[19]Evaluation of the COVID-19 pandemic on the Internet using datasets from ISP interconnects, the Measuring Broadband America (MBA) database, and information from the Internet-wide border gateway protocol tables.A significant increase in the delay and peak traffic rate is detected in the beginning of the lockdown. In addition, it is limited to specific ISPs. ISPs mitigate the increase in the delay by increasing transport capacities.We present the impact of the lockdown in Germany. The results present a partial performance degradation in few transit networks in which measurement servers are located.
[20]Implications of the COVID-19 pandemic on the Internet traffic using datasets from ISPs, exchange points, mobile operators, and educational networks.Increase in traffic at ISPs and internet exchange points but decrease in educational networks. Moreover, usual daily pattern change during the lockdown.We provide results on an open dataset and show that performance degradation only occurred partially and reveal a similar usage pattern.
Table 2. MLab locations, sites and ASNs in Germany.
LocationSiteProviderASN
Frankfurtfra01Telia Company ABAS1299
Frankfurtfra02GTT Communications Inc.AS3257
Frankfurtfra03Vodafone Group PLCAS1273
Frankfurtfra04Level 3 Parent, LLCAS3356
Frankfurtfra05TATA COMMUNICATIONS (AMERICA) INCAS6453
Frankfurtfra06TELECOM ITALIA SPARKLE S.p.A.AS6762
Hamburgham02Telia Company ABAS1299
Table 3. Ten most seen ASNs at Frankfurt location in August 2021, note that we do not count the University of Stuttgart as an ISP.
AS NameAS Num.#Mea.RatioISP
Deutsche Telekom AG33201,639,0530.32BCN
Vodafone GmbH32091,447,6540.29BCN
Telefonica Germany GmbH & Co. OHG6805441,2320.09BCN
Stadtnetz Bamberg mbH198570439,0310.09BR
1&1 Versatel Deutschland GmbH8881225,4640.04BN
Universitaet Stuttgart55391,8610.02-
NetCologne GmbH842290,2100.02BR
inexio Gmbh4265253,1420.01BN
Plusnet GmbH2067644,6840.01BN
Deutsche Glasfaser Wholesale GmbH6029439,7720.01BN
NetCom BW GmbH4199837,1780.01BR
0.89
Table 4. Ten most seen ASNs at Hamburg location in August 2021.
AS NameAS Num.#Mea.RatioISP
Deutsche Telekom AG3320902,0320.32BCN
Vodafone GmbH3209848,9080.30BCN
Telefonica Germany GmbH & Co. OHG6805424,1760.15BCN
EWE TEL GmbH9145127,2450.04BR
1&1 Versatel Deutschland GmbH8881108,3310.04BN
wilhelm.tel GmbH1594345,4270.02BR
htp GmbH1304532,6260.01BR
Plusnet GmbH2067628,3140.01BN
Tele Columbus AG2088025,5970.01BN
Deutsche Glasfaser Wholesale GmbH6029423,8130.01BN
0.91
Table 5. Exemplary application requirements.
ApplicationData RateLatency
Voice64 kbps200 ms
Video streaming (HD)5 Mbpsfew seconds
Video streaming (UHD)25 Mbpsfew seconds
Cloud gaming44 Mbps25 ms
Publisher’s Note: MDPI stays neutral with regard to jurisdictional claims in published maps and institutional affiliations.

