Article

SD-UNet: A Novel Segmentation Framework for CT Images of Lung Infections

School of Electronics and Information Engineering, Sichuan University, Chengdu 610065, China
*
Author to whom correspondence should be addressed.
Electronics 2022, 11(1), 130; https://doi.org/10.3390/electronics11010130
Submission received: 22 November 2021 / Revised: 24 December 2021 / Accepted: 28 December 2021 / Published: 1 January 2022
(This article belongs to the Topic Machine and Deep Learning)

Abstract

:
Due to the outbreak of lung infections caused by the coronavirus disease (COVID-19), humans have to face an unprecedented and devastating global health crisis. Since chest computed tomography (CT) images of COVID-19 patients contain abundant pathological features closely related to this disease, rapid detection and diagnosis based on CT images is of great significance for the treatment of patients and blocking the spread of the disease. In particular, the segmentation of the COVID-19 CT lung-infected area can quantify and evaluate the severity of the disease. However, due to the blurred boundaries and low contrast between the infected and the non-infected areas in COVID-19 CT images, the manual segmentation of the COVID-19 lesion is laborious and places high demands on the operator. Quick and accurate segmentation of COVID-19 lesions from CT images based on deep learning has drawn increasing attention. To effectively improve the segmentation effect of COVID-19 lung infection, a modified UNet network that combines the squeeze-and-attention (SA) and dense atrous spatial pyramid pooling (Dense ASPP) modules) (SD-UNet) is proposed, fusing global context and multi-scale information. Specifically, the SA module is introduced to strengthen the attention of pixel grouping and fully exploit the global context information, allowing the network to better mine the differences and connections between pixels. The Dense ASPP module is utilized to capture multi-scale information of COVID-19 lesions. Moreover, to eliminate the interference of background noise outside the lungs and highlight the texture features of the lung lesion area, we extract in advance the lung area from the CT images in the pre-processing stage. Finally, we evaluate our method using the binary-class and multi-class COVID-19 lung infection segmentation datasets. The experimental results show that the metrics of Sensitivity, Dice Similarity Coefficient, Accuracy, Specificity, and Jaccard Similarity are 0.8988 (0.6169), 0.8696 (0.5936), 0.9906 (0.9821), 0.9932 (0.9907), and 0.7702 (0.4788), respectively, for the binary-class (multi-class) segmentation task in the proposed SD-UNet. The result of the COVID-19 lung infection area segmented by SD-UNet is closer to the ground truth compared to several existing models such as CE-Net, DeepLab v3+, UNet++, and other models, which further proves that a more accurate segmentation effect can be achieved by our method. It has the potential to assist doctors in making more accurate and rapid diagnosis and quantitative assessment of COVID-19.

1. Introduction

At the beginning of 2020, the pulmonary infection pandemic caused by the new coronavirus disease (COVID-19) broke out and spread rapidly around the world. This disease poses a huge threat to human health and life safety, making humanity face an unprecedented and devastating global health crisis [1,2,3,4,5]. COVID-19 is mainly manifested in the lungs, causing respiratory infections. It can also lead to intestinal infections, causing digestive symptoms including nausea, vomiting, and diarrhea [6]. As of 6 August 2021, according to world health organization (WHO) statistics, the cumulative number of confirmed cases of new coronary pneumonia in the world has exceeded 200 million, reaching 200,174,883, which means there has been about one COVID-19 patient per 39 people in the world, and the number of deaths has exceed 4.25 million. COVID-19 is highly contagious, and early screening of COVID-19 patients can help stop the spread of the disease. Therefore, the rapid and accurate diagnosis of COVID-19 is very important for the prevention and control of the pandemic. Polymerase chain reaction (PCR) testing is considered to be the gold standard for COVID-19 testing. It can only qualitatively detect COVID-19 using nasal swabs, sputum, and nasopharyngeal aspirates. In addition, PCR testing requires a large number of doctors to perform it manually. At the same time, the progression of COVID-19 can be quantitatively analyzed based on computed tomography (CT). CT images can be used to detect the relevant pathological features of COVID-19 [7]. A lot of clinical experience shows that CT imaging plays an irreplaceable role in the evaluation [8] and diagnosis [9] of COVID-19 lung diseases. In comparison to chest X-rays, chest CT scans have the advantage of not being affected by other chest tissues and have good recognition ability of lung diseases. Therefore, chest CT scans are recommended by radiologists as the main lung clinical diagnostic tool. Some studies [10,11] found that typical chest CT slices of COVID-19 showed radioactive features such as ground-glass opacity (GGO) in the early stage and pulmonary consolidation in the advanced stage. Medical image segmentation plays a key role in the analysis of pathological characteristics of medical images. It can help clinicians perform image-guided medical interventions and radiotherapy. Given that doctors’ manual segmentation of lesions is time-consuming and is greatly affected by their own subjective experience, it is of great significance to study and find an automatic and effective medical image segmentation algorithm to assist clinicians to make accurate and rapid diagnosis and treatment plans [12].
In recent years, with the rapid development of deep learning, semantic segmentation algorithms based on deep learning have made remarkable achievements in medical image segmentation tasks. In particular, the automatic segmentation of the COVID-19 lung infection area based on deep learning is very important for further diagnosis of the disease because it can assist radiologists in quantitative evaluation of the disease quickly [8]. Some researchers used deep learning [13,14,15,16,17,18,19] to screen for COVID-19. Wang et al. [13] used a segmentation method based on deep learning to extract the lesion features of COVID-19. Some frameworks widely used in medical image segmentation were also utilized for COVID-19 segmentation, such as U-Net, V-Net, and U-Net++ [14,15,16]. Wang et al. [17] designed a segmentation framework to learn distinguishing features from noisy labels, which alleviated the impact of COVID-19 image label quality on segmentation performance and captured the scale and morphological information of COVID-19 lung CT images. Wu et al. [18] proposed a two-stage COVID-19 segmentation strategy: U-Net was first used to roughly locate the lesion area and then to finely segment the lesion area on the basis of the rough positioning information. Fan et al. [19] introduced a semi-supervised COVID-19 segmentation method, which can effectively alleviate the impact of the lack of labeled data.
As a particularly effective and robust segmentation model, U-Net is widely used in the field of medical image segmentation, but in this model, each channel of the output feature is given the same weight. It lacks the ability to deal with different types of features and does not take into account the difference of the contribution of each convolution channel to the feature extraction of the network. Compared with the fully-connected layer, convolution adopts a local connection mode, and the weight sharing operation greatly reduces the calculation parameters. Convolution kernel has the characteristic of local perception and is good at capturing the information around pixels. This characteristic makes it difficult to learn the correlation between pixels far away in the image. Because of the local receptive field feature of the convolution kernel, it does not make full use of the global context information of the image. In fact, a lot of previous works focused on the improvement of pixel level segmentation performance, basically ignoring the importance of pixel-grouping in semantic segmentation [
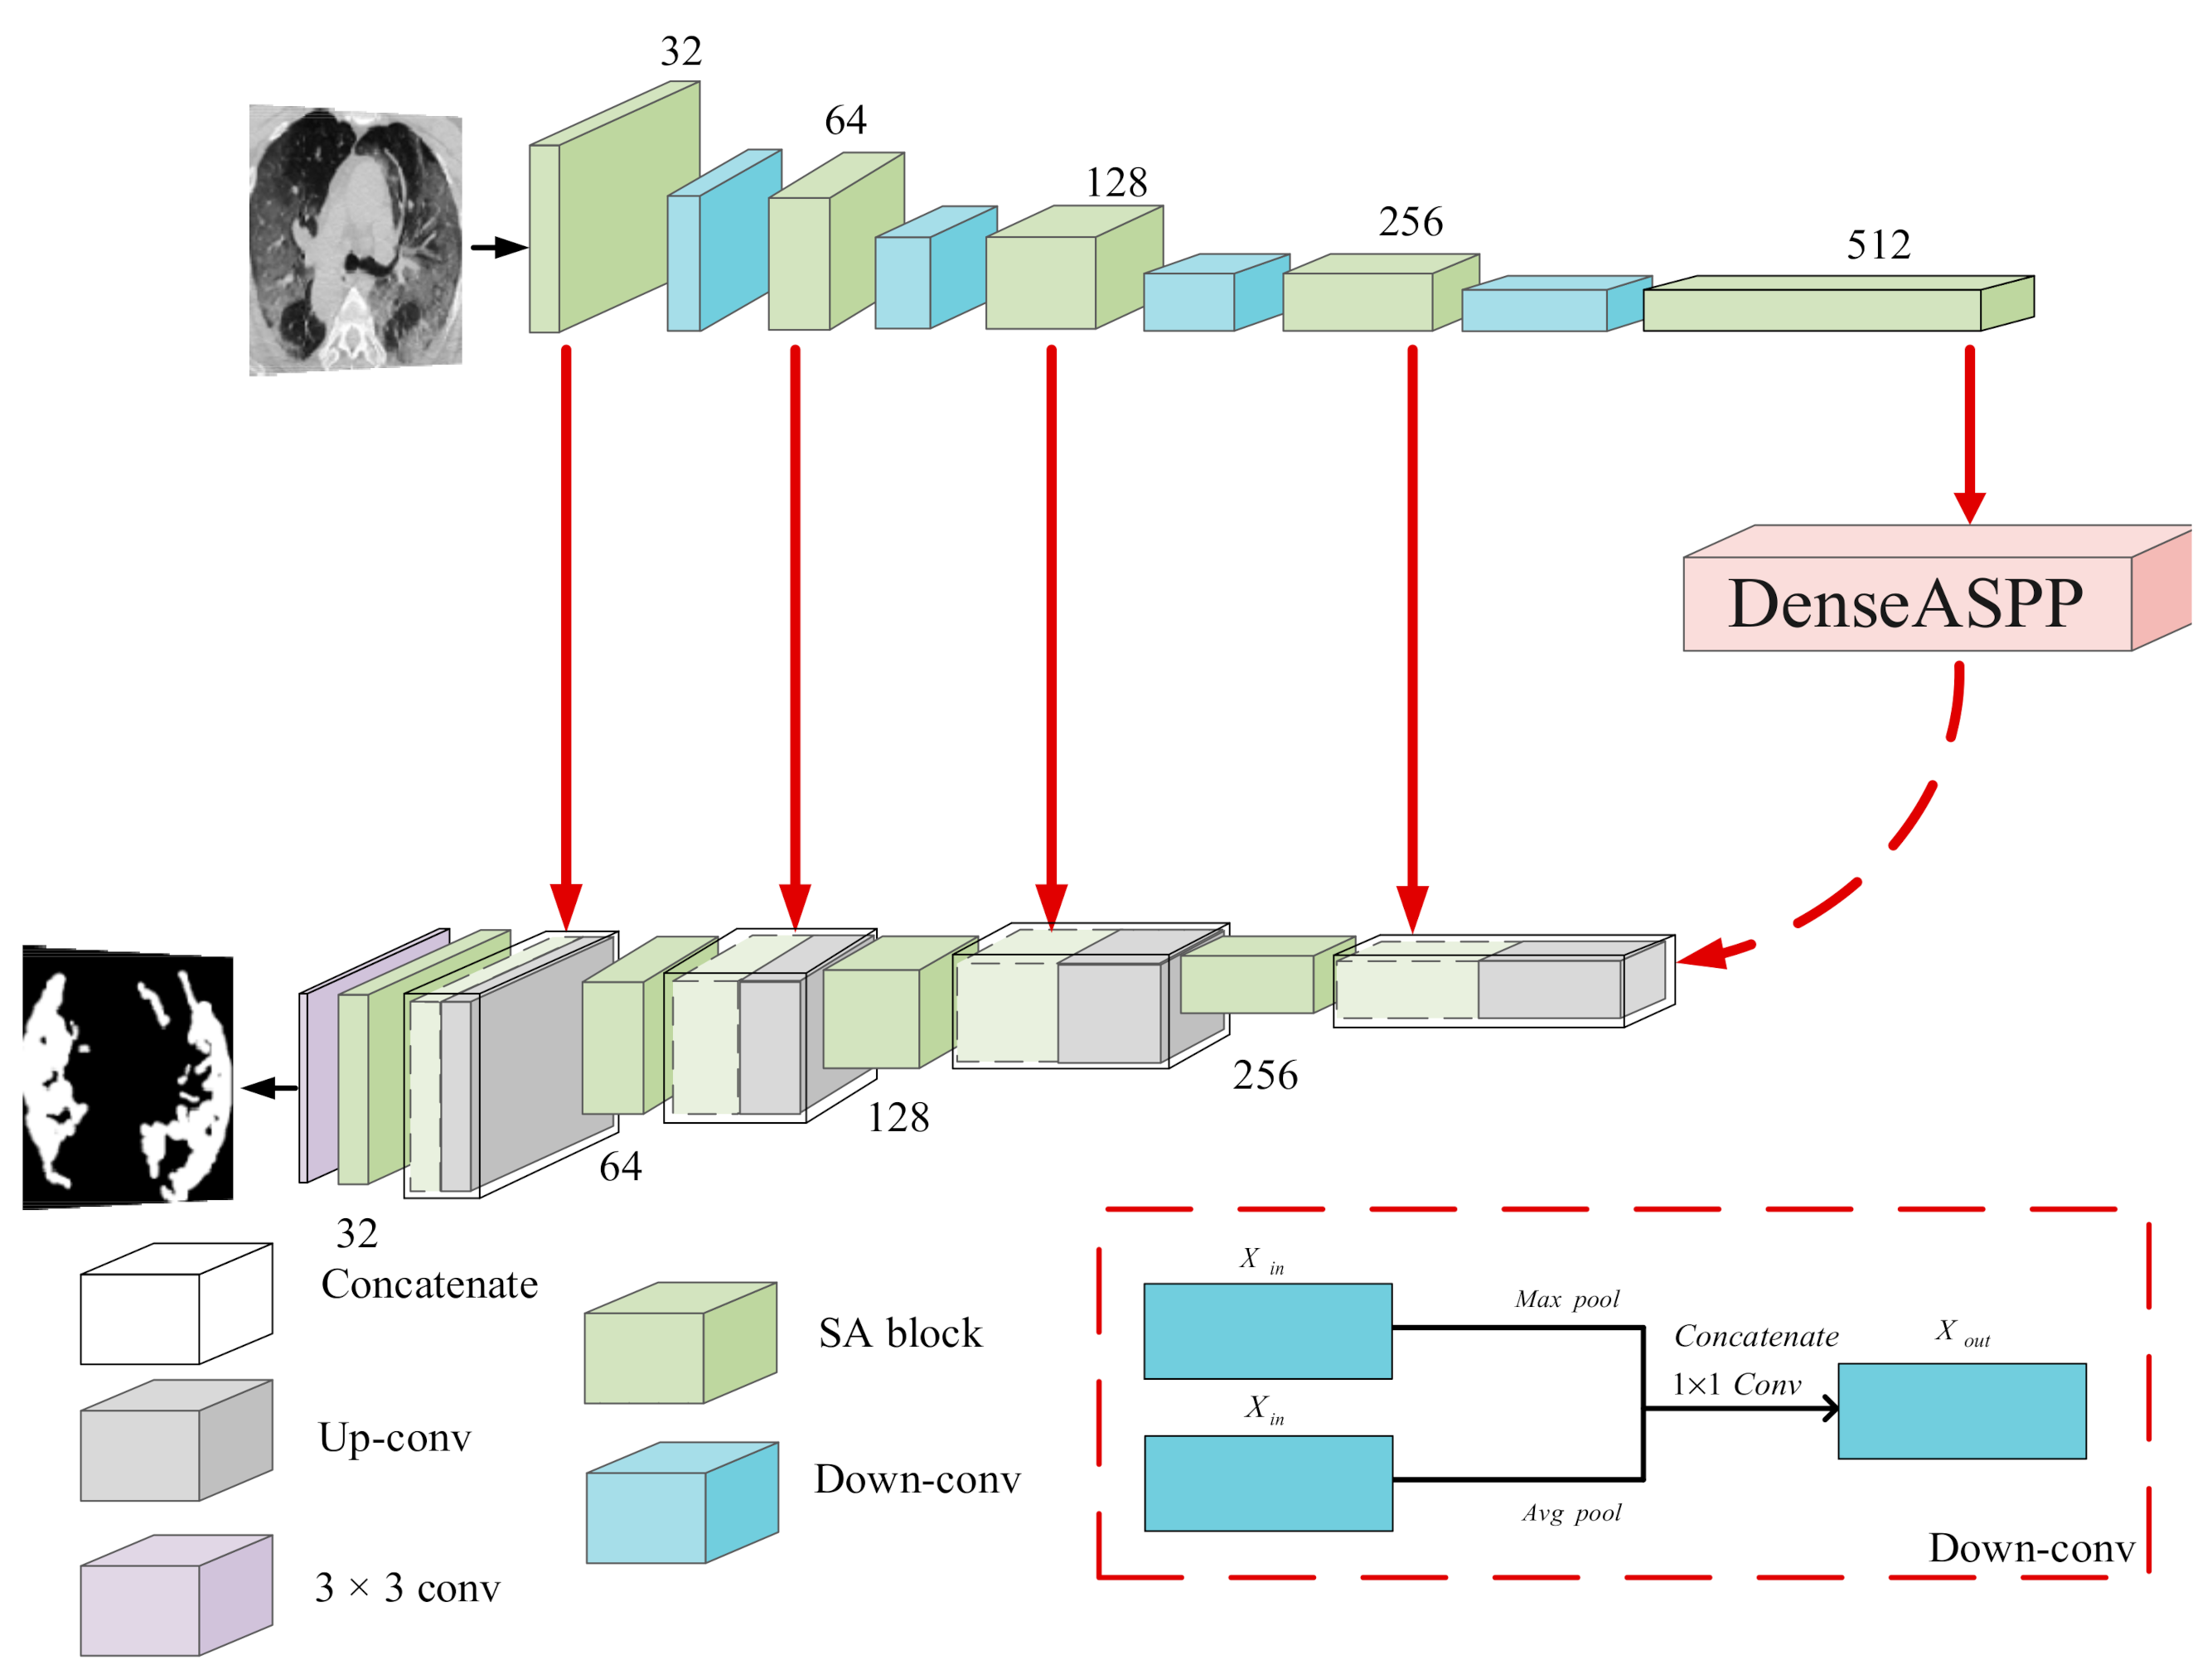
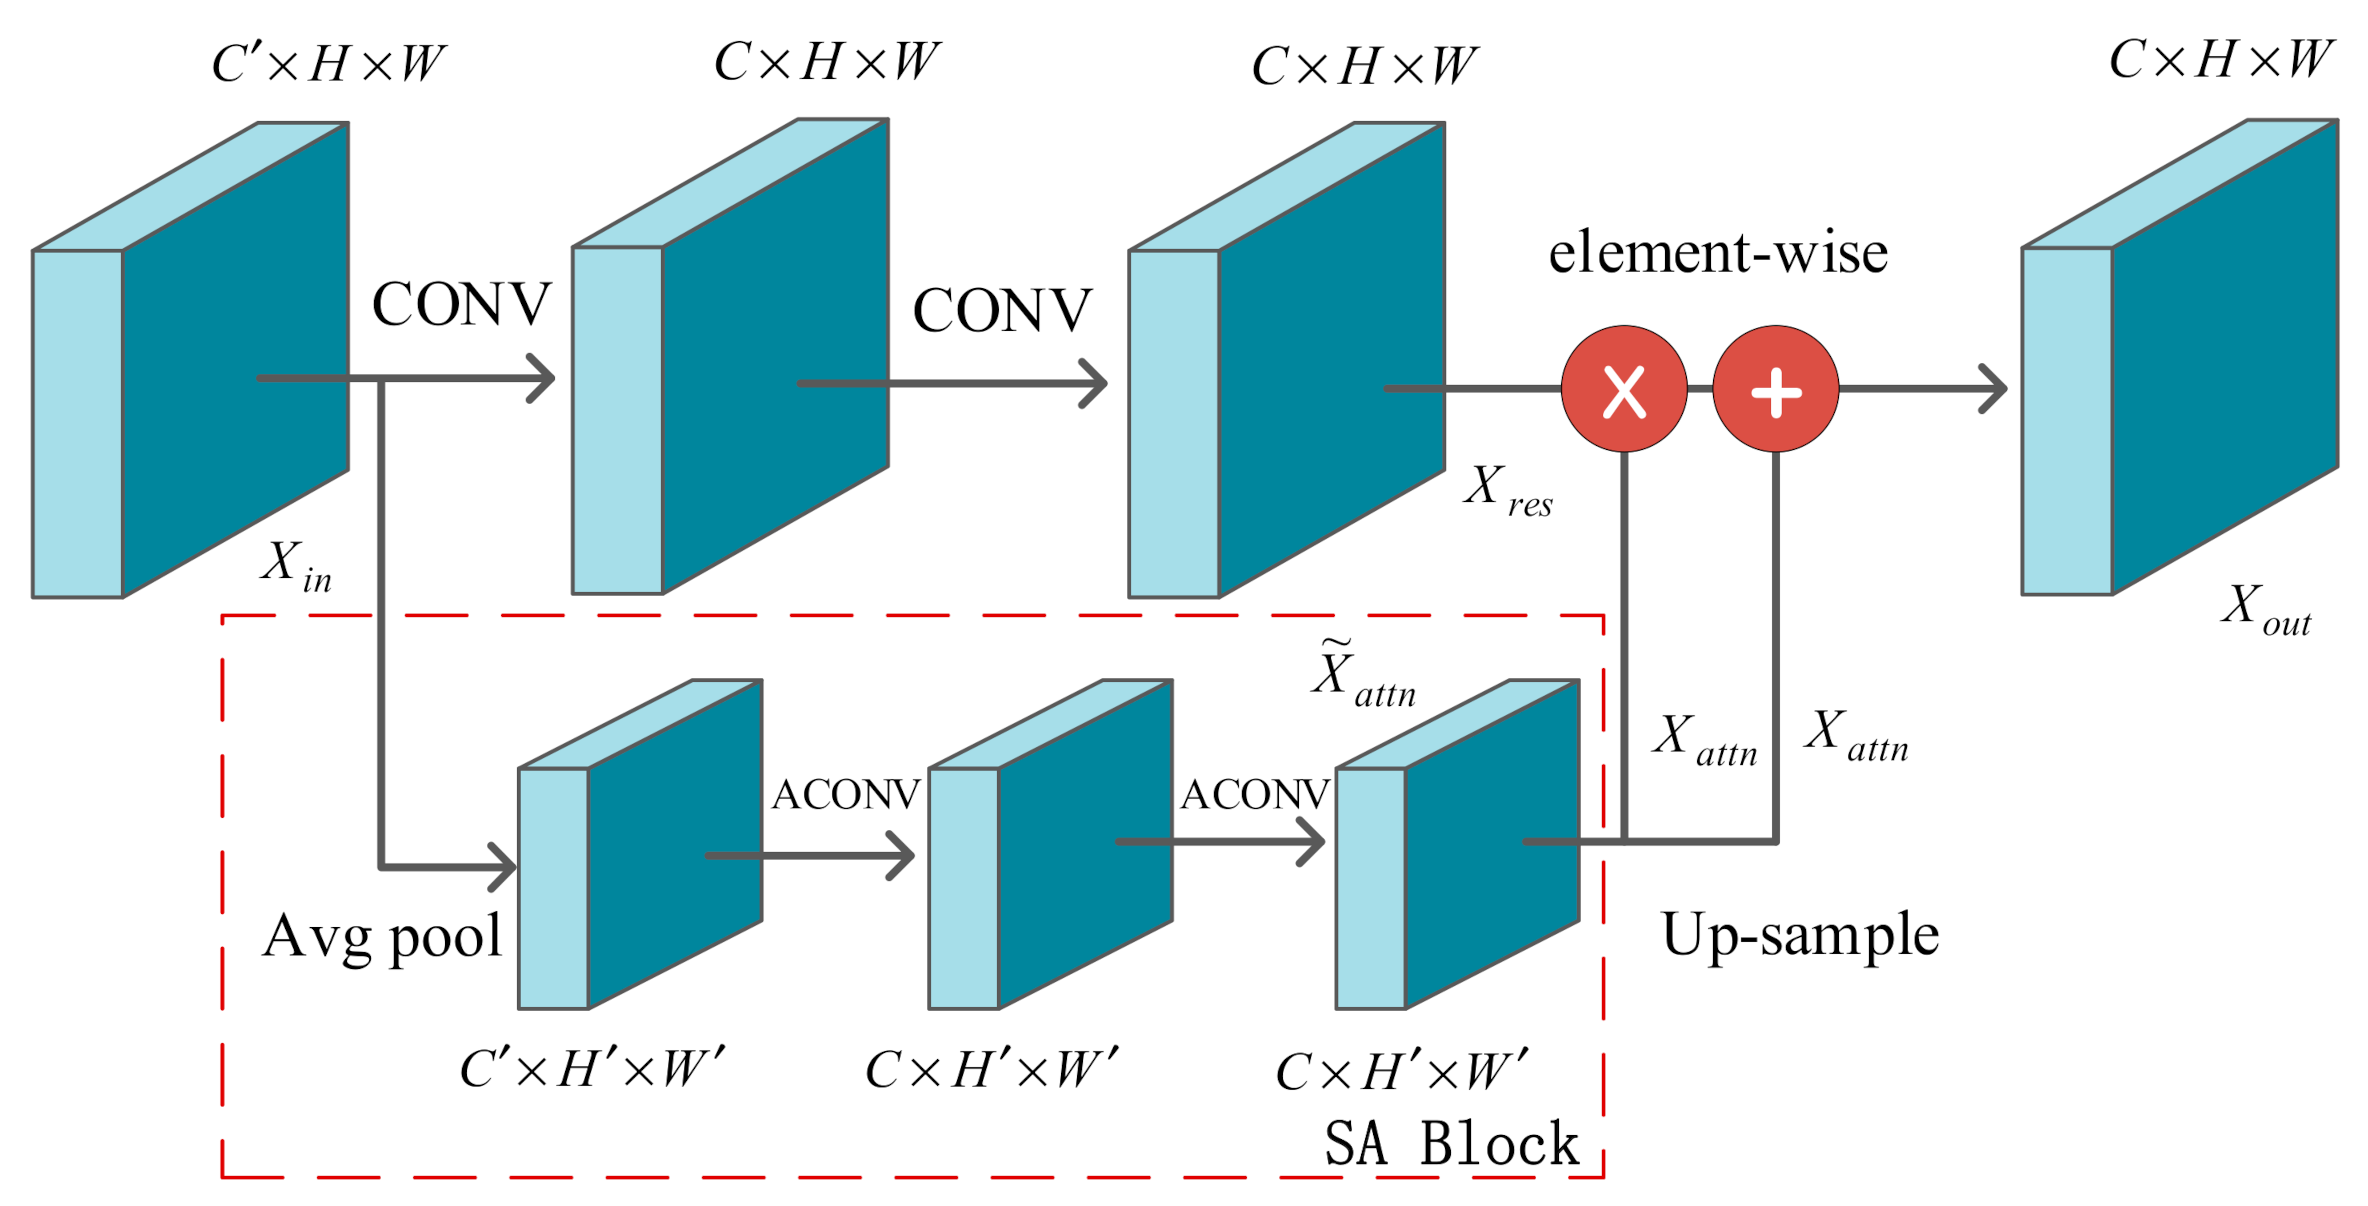
20]. In our SD-UNet, a squeeze-and-attention (SA) module was introduced to overcome these challenges by using a not fully-squeezed attention channel mechanism to generate non-local spatial attention to the image and make full use of the global context information to selectively re-weight the channel features. It can also be considered a kind of spatial attention to pixel grouping. Each pixel on the input feature map was scanned by generating attention convolution, and pixels with different spatial positions but belonging to the same class were divided into a group.
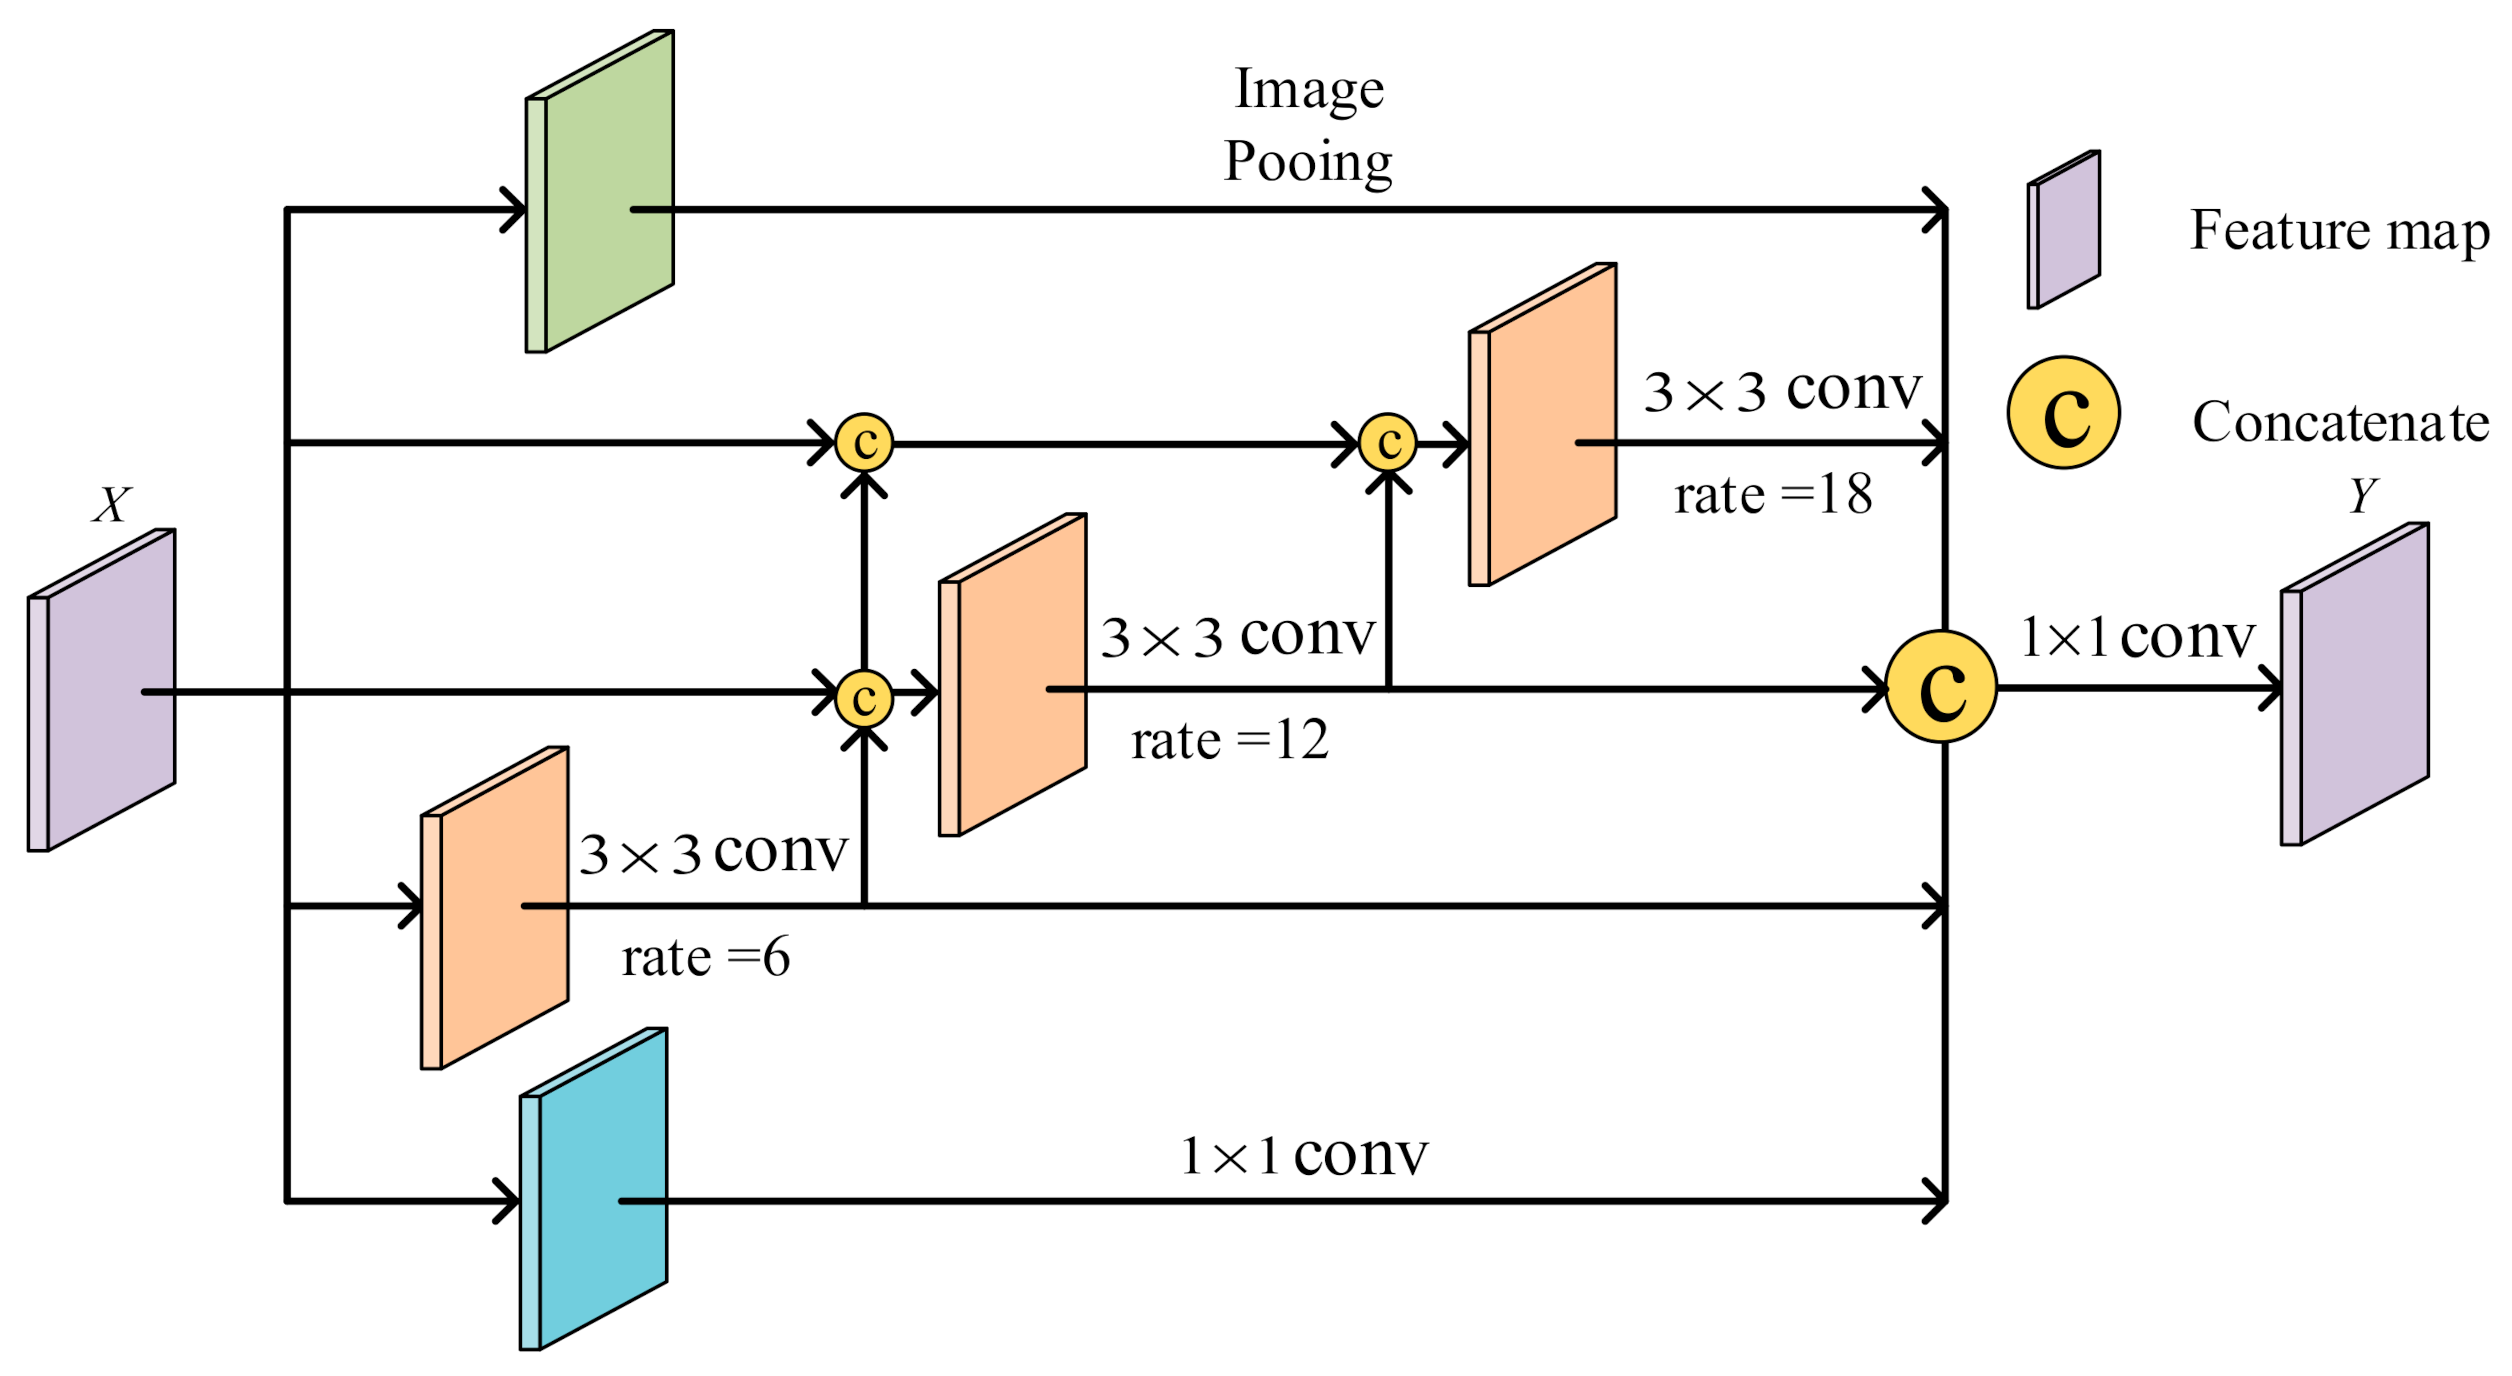
Apart from the above-mentioned lack of global context information, the ability of a convolutional neural network (CNN) to perceive information is largely dependent on the size of its convolution kernel, making it difficult to capture long-distance and multi-scale lesion information. It is worth emphasizing that the detection of COVID-19 usually uses advanced computed tomography technology, which generates high-resolution CT images, but labeling lesions still requires experienced doctors. Due to the lack of medical personnel and efficient medical instruments, the diagnosis of COVID-19 is usually subjective and time-consuming. At the same time, for COVID-19 CT images, computer-aided diagnosis will face great challenges and limitations due to the diversity of object locations and shapes of lesions as well as the blurred boundaries between infected and non-infected areas. In view of this situation, the dense atrous spatial pyramid pooling (Dense ASPP) module was embedded into our COVID-19 lung lesion segmentation network SD-UNet to help explore multi-scale contextual features [21], locate lesion boundaries, and refine semantic labels, which facilitates the capture of the size and location information of different lesion targets.
Our contributions are listed in the following three aspects:
  • We propose a novel framework SD-UNet for segmentation of COVID-19 lesions, which combines the advantages of SA and Dense ASPP modules. The SA module is introduced to strengthen the attention of pixel grouping and fully exploit the global context information, making the network better mine the differences and connections between pixels. Therefore, we added a new path from the output of convolution to learn the weight information and explicitly model the dependency between channels by re-weighting local and global features. This mechanism can better adapt to the task of semantic segmentation. The Dense ASPP module is utilized at the bottleneck of the encoder and decoder of SD-UNet to better capture long-distance and multi-scale lesion information and to avoid the loss of semantic information caused by the down-sampling operation in the encoding process. In summary, the global context and multi-scale information of COVID-19 lesions can be better mined by the fusion of these two modules, so that a more accurate segmentation effect can be achieved.
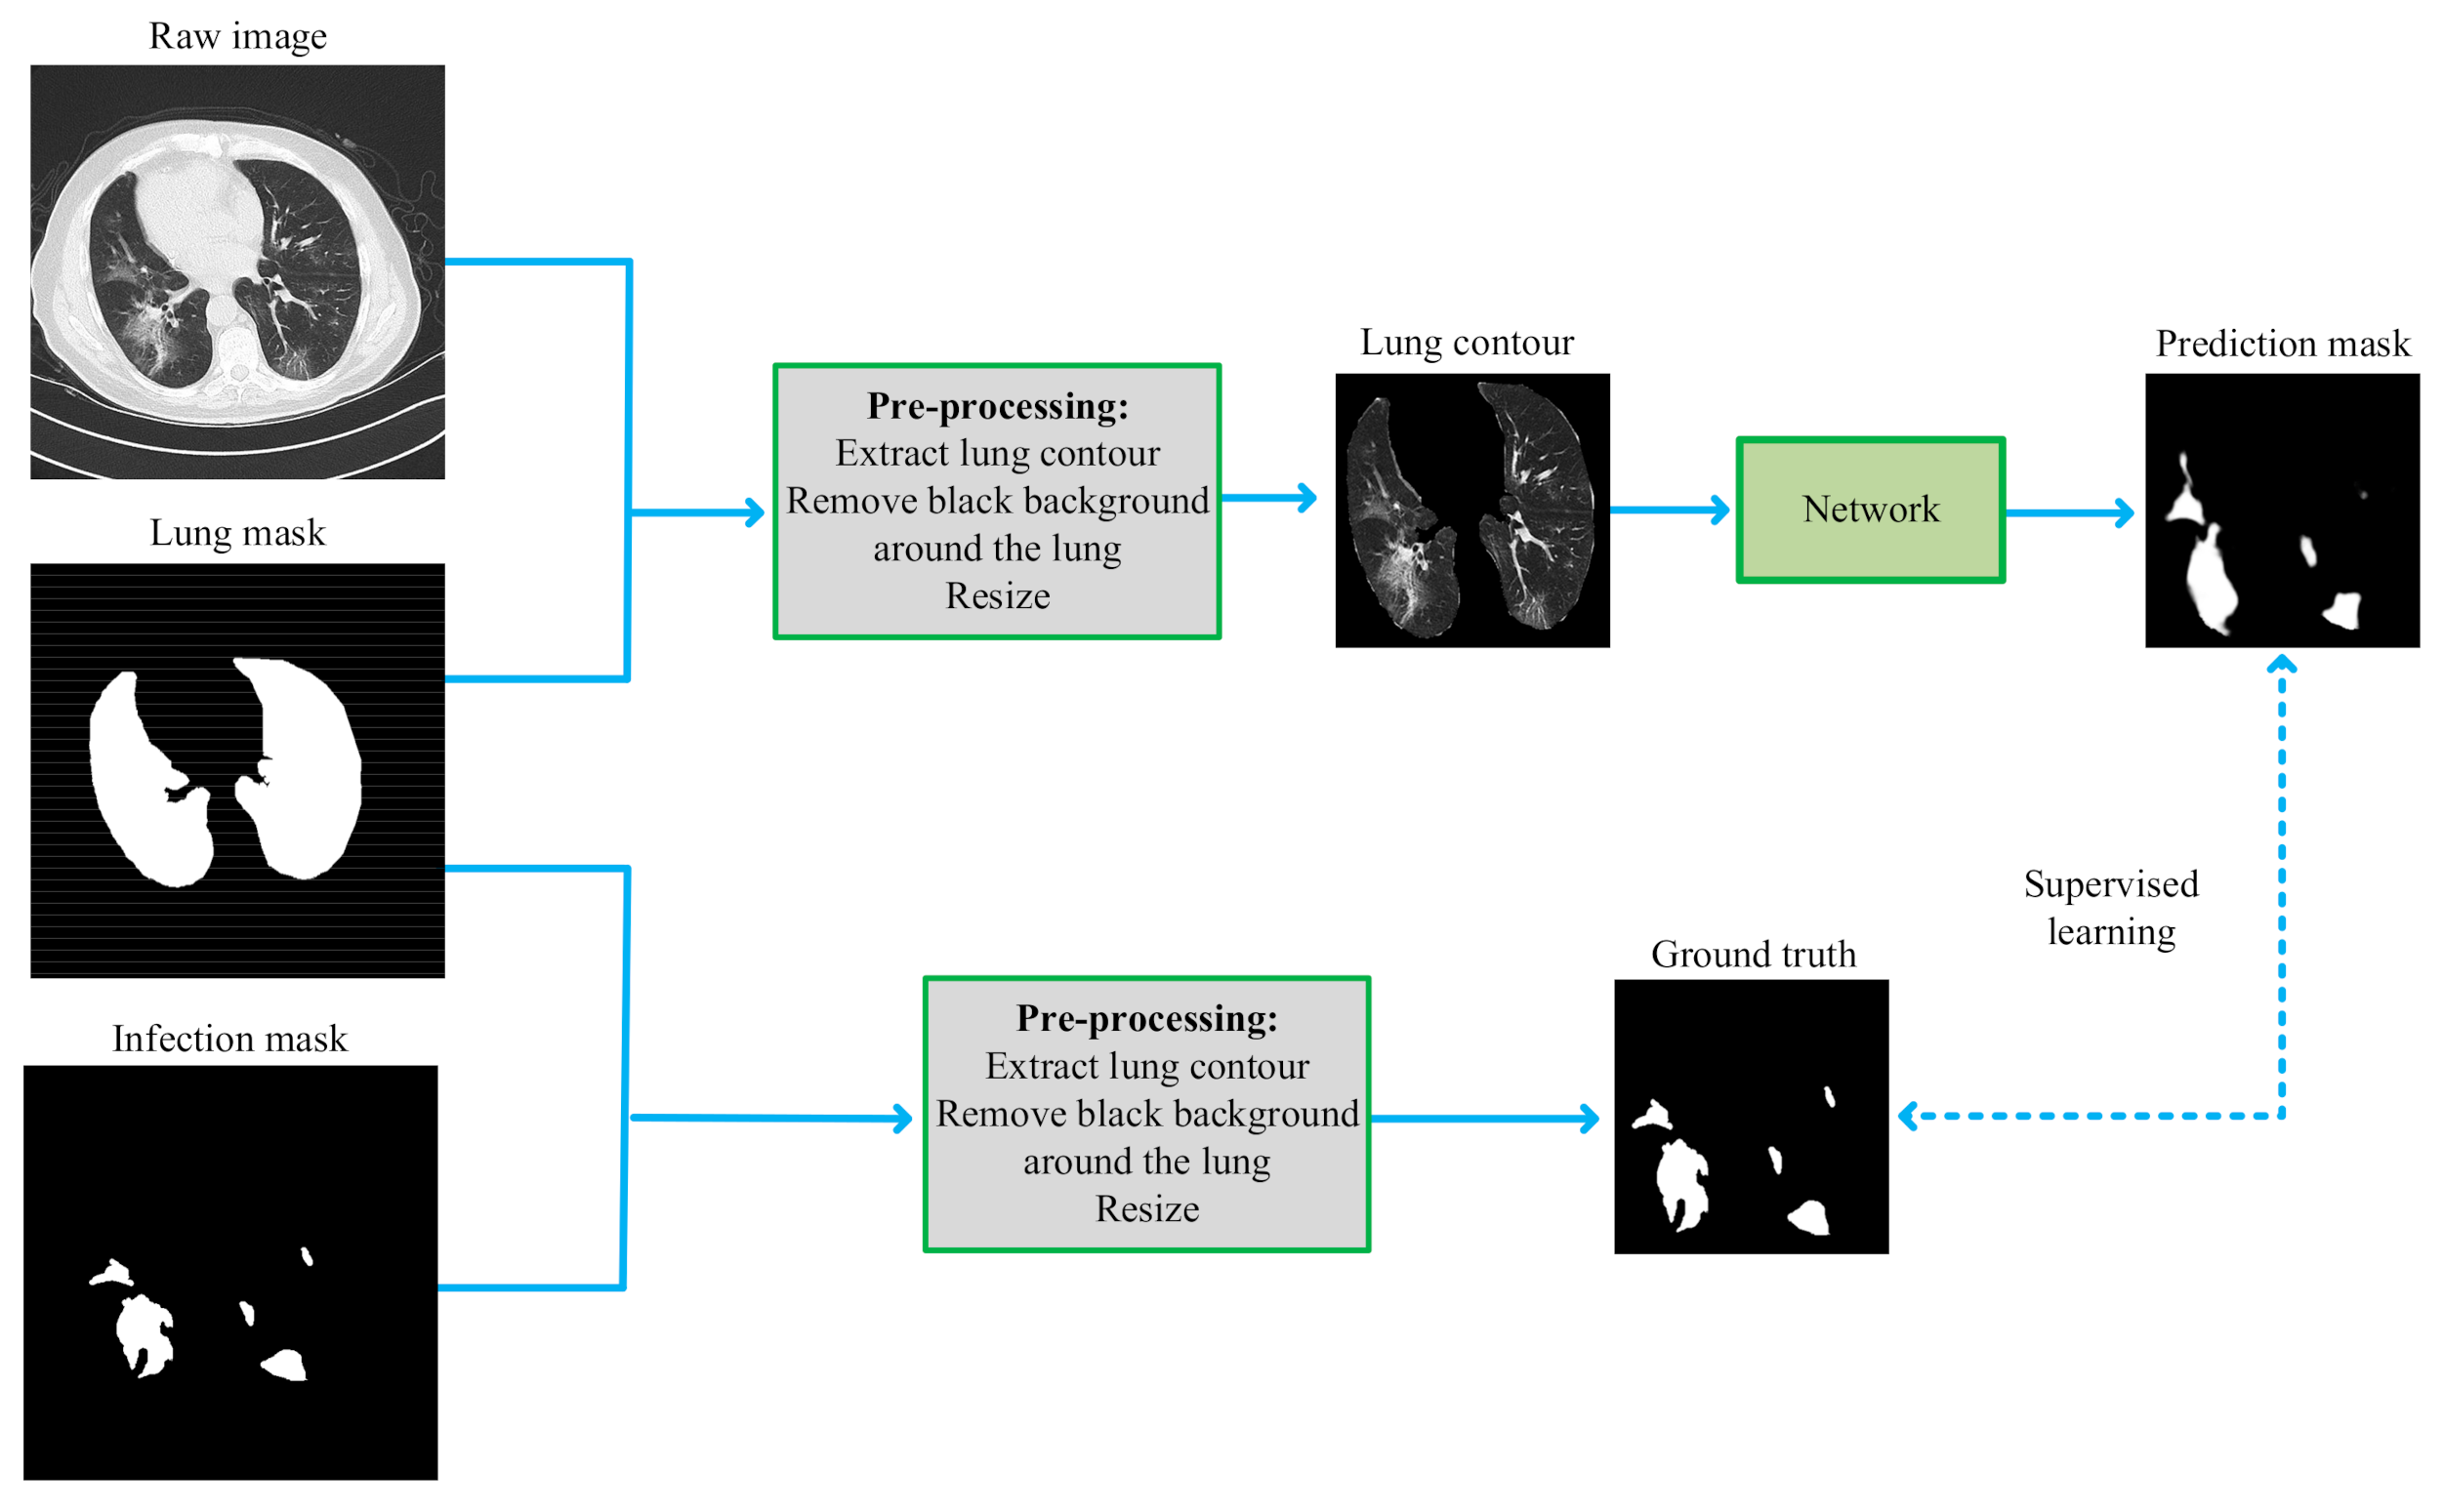
  • To eliminate the interference of background noise outside the lungs and highlight the texture features of the lung lesion area, we extracted the lung area from the CT images in the pre-processing stage. Specifically, the raw image and infection mask were pre-processed through extraction of the lung contour and removal of the black background around the lung followed by resizing.
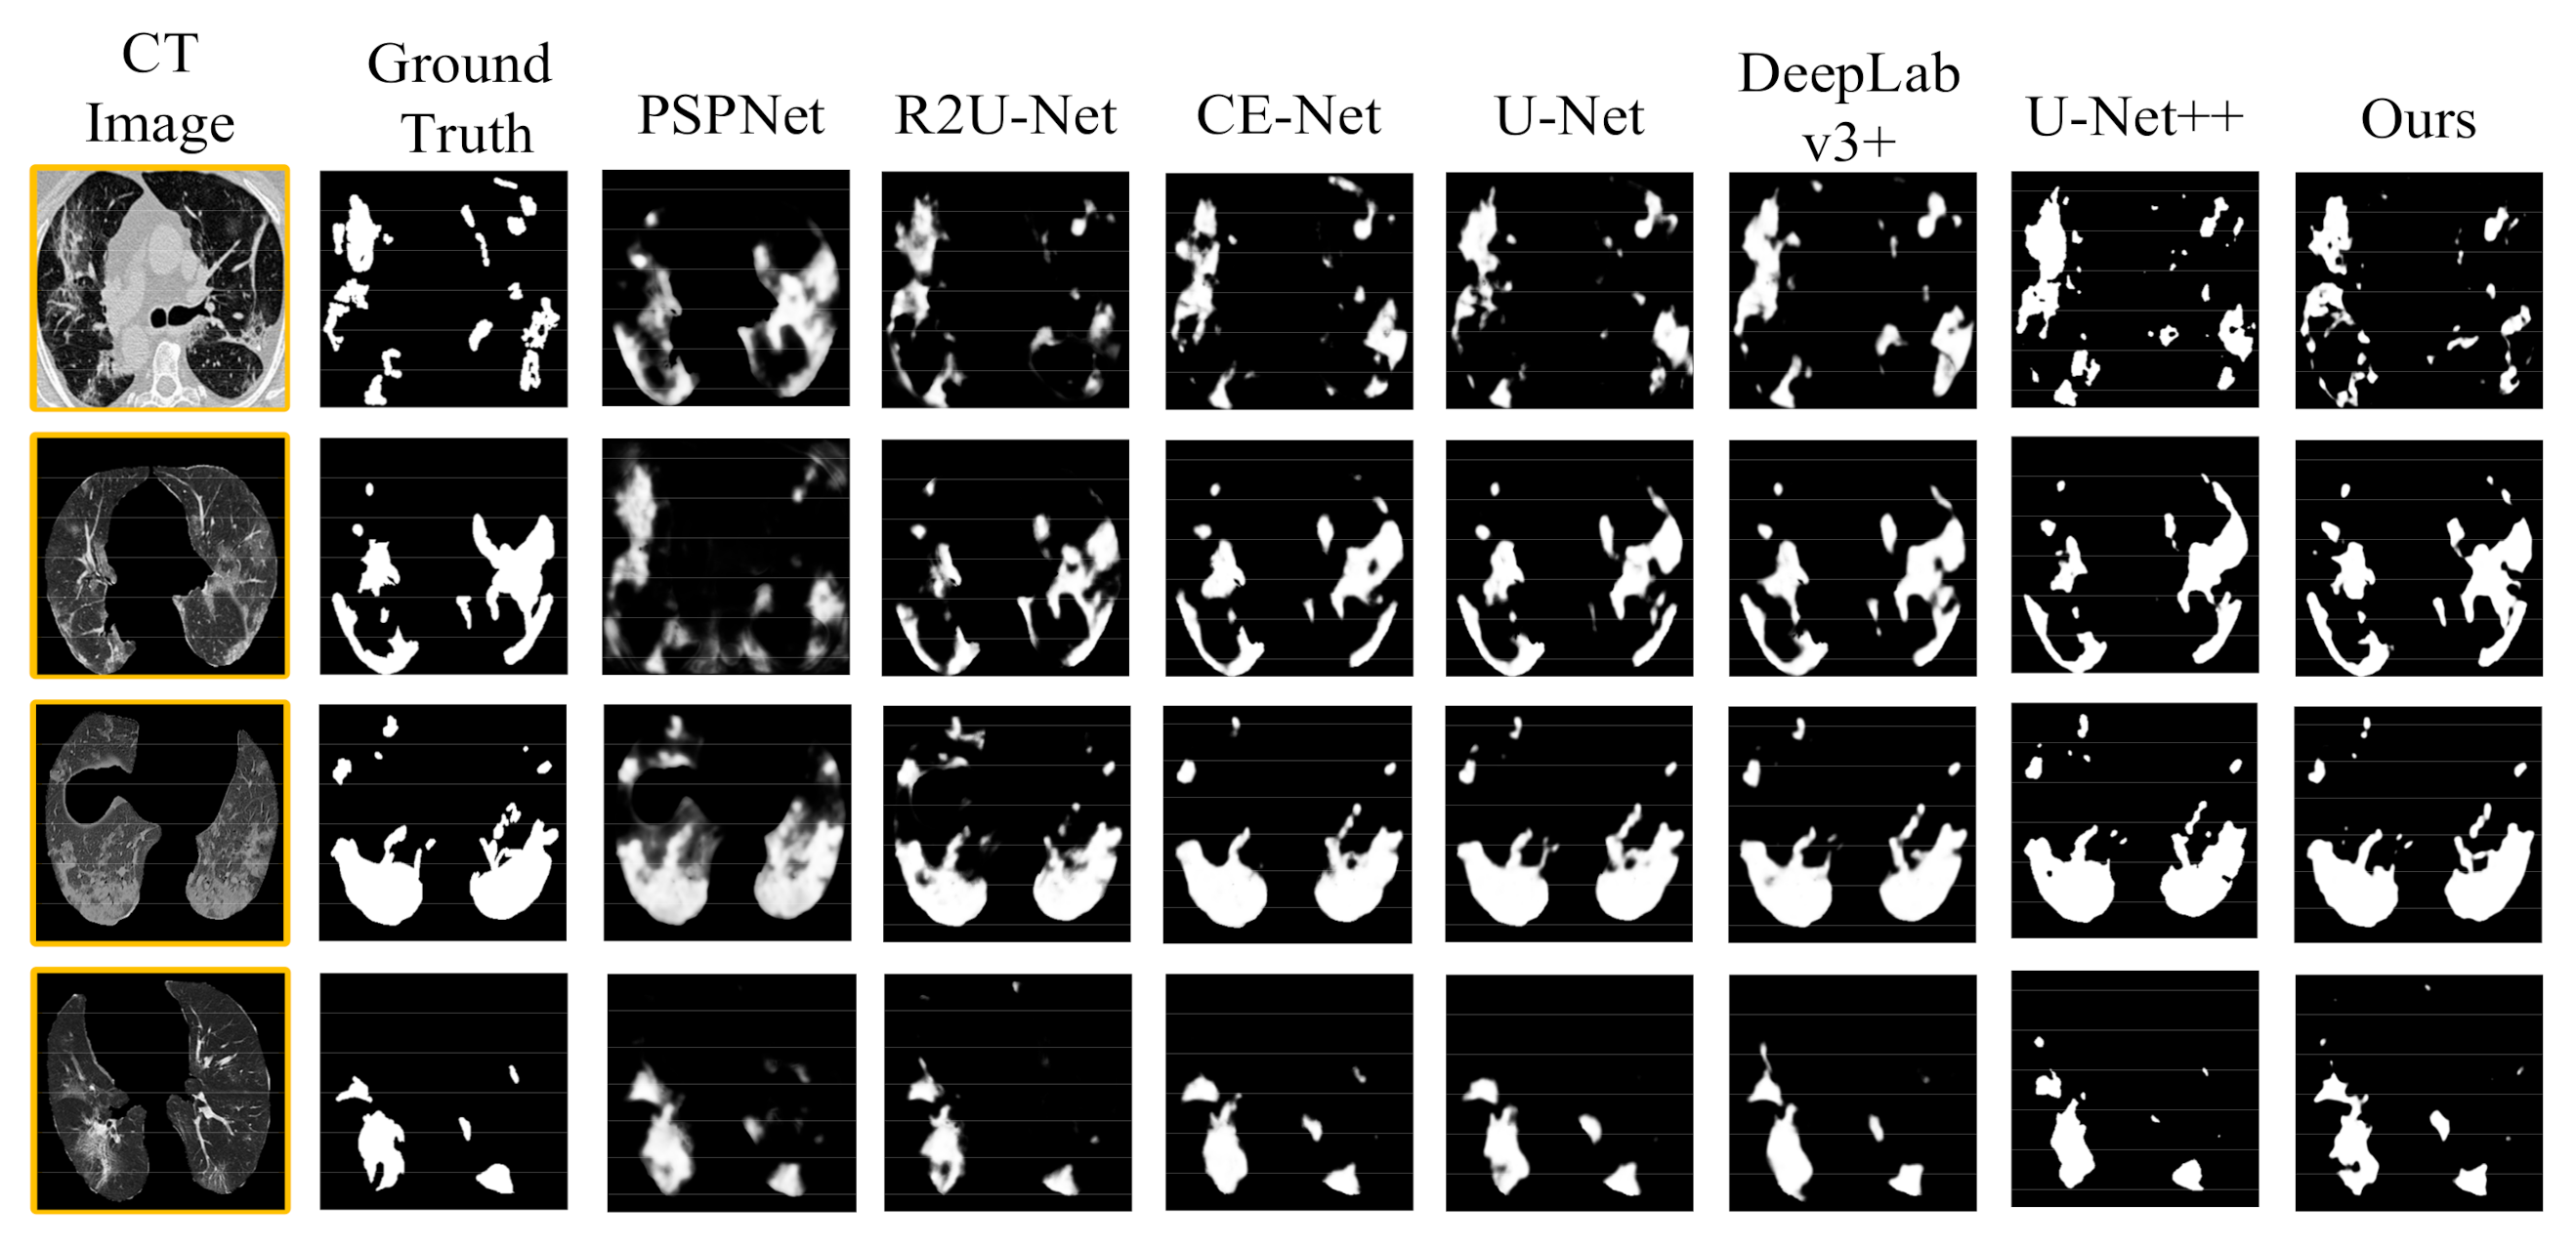
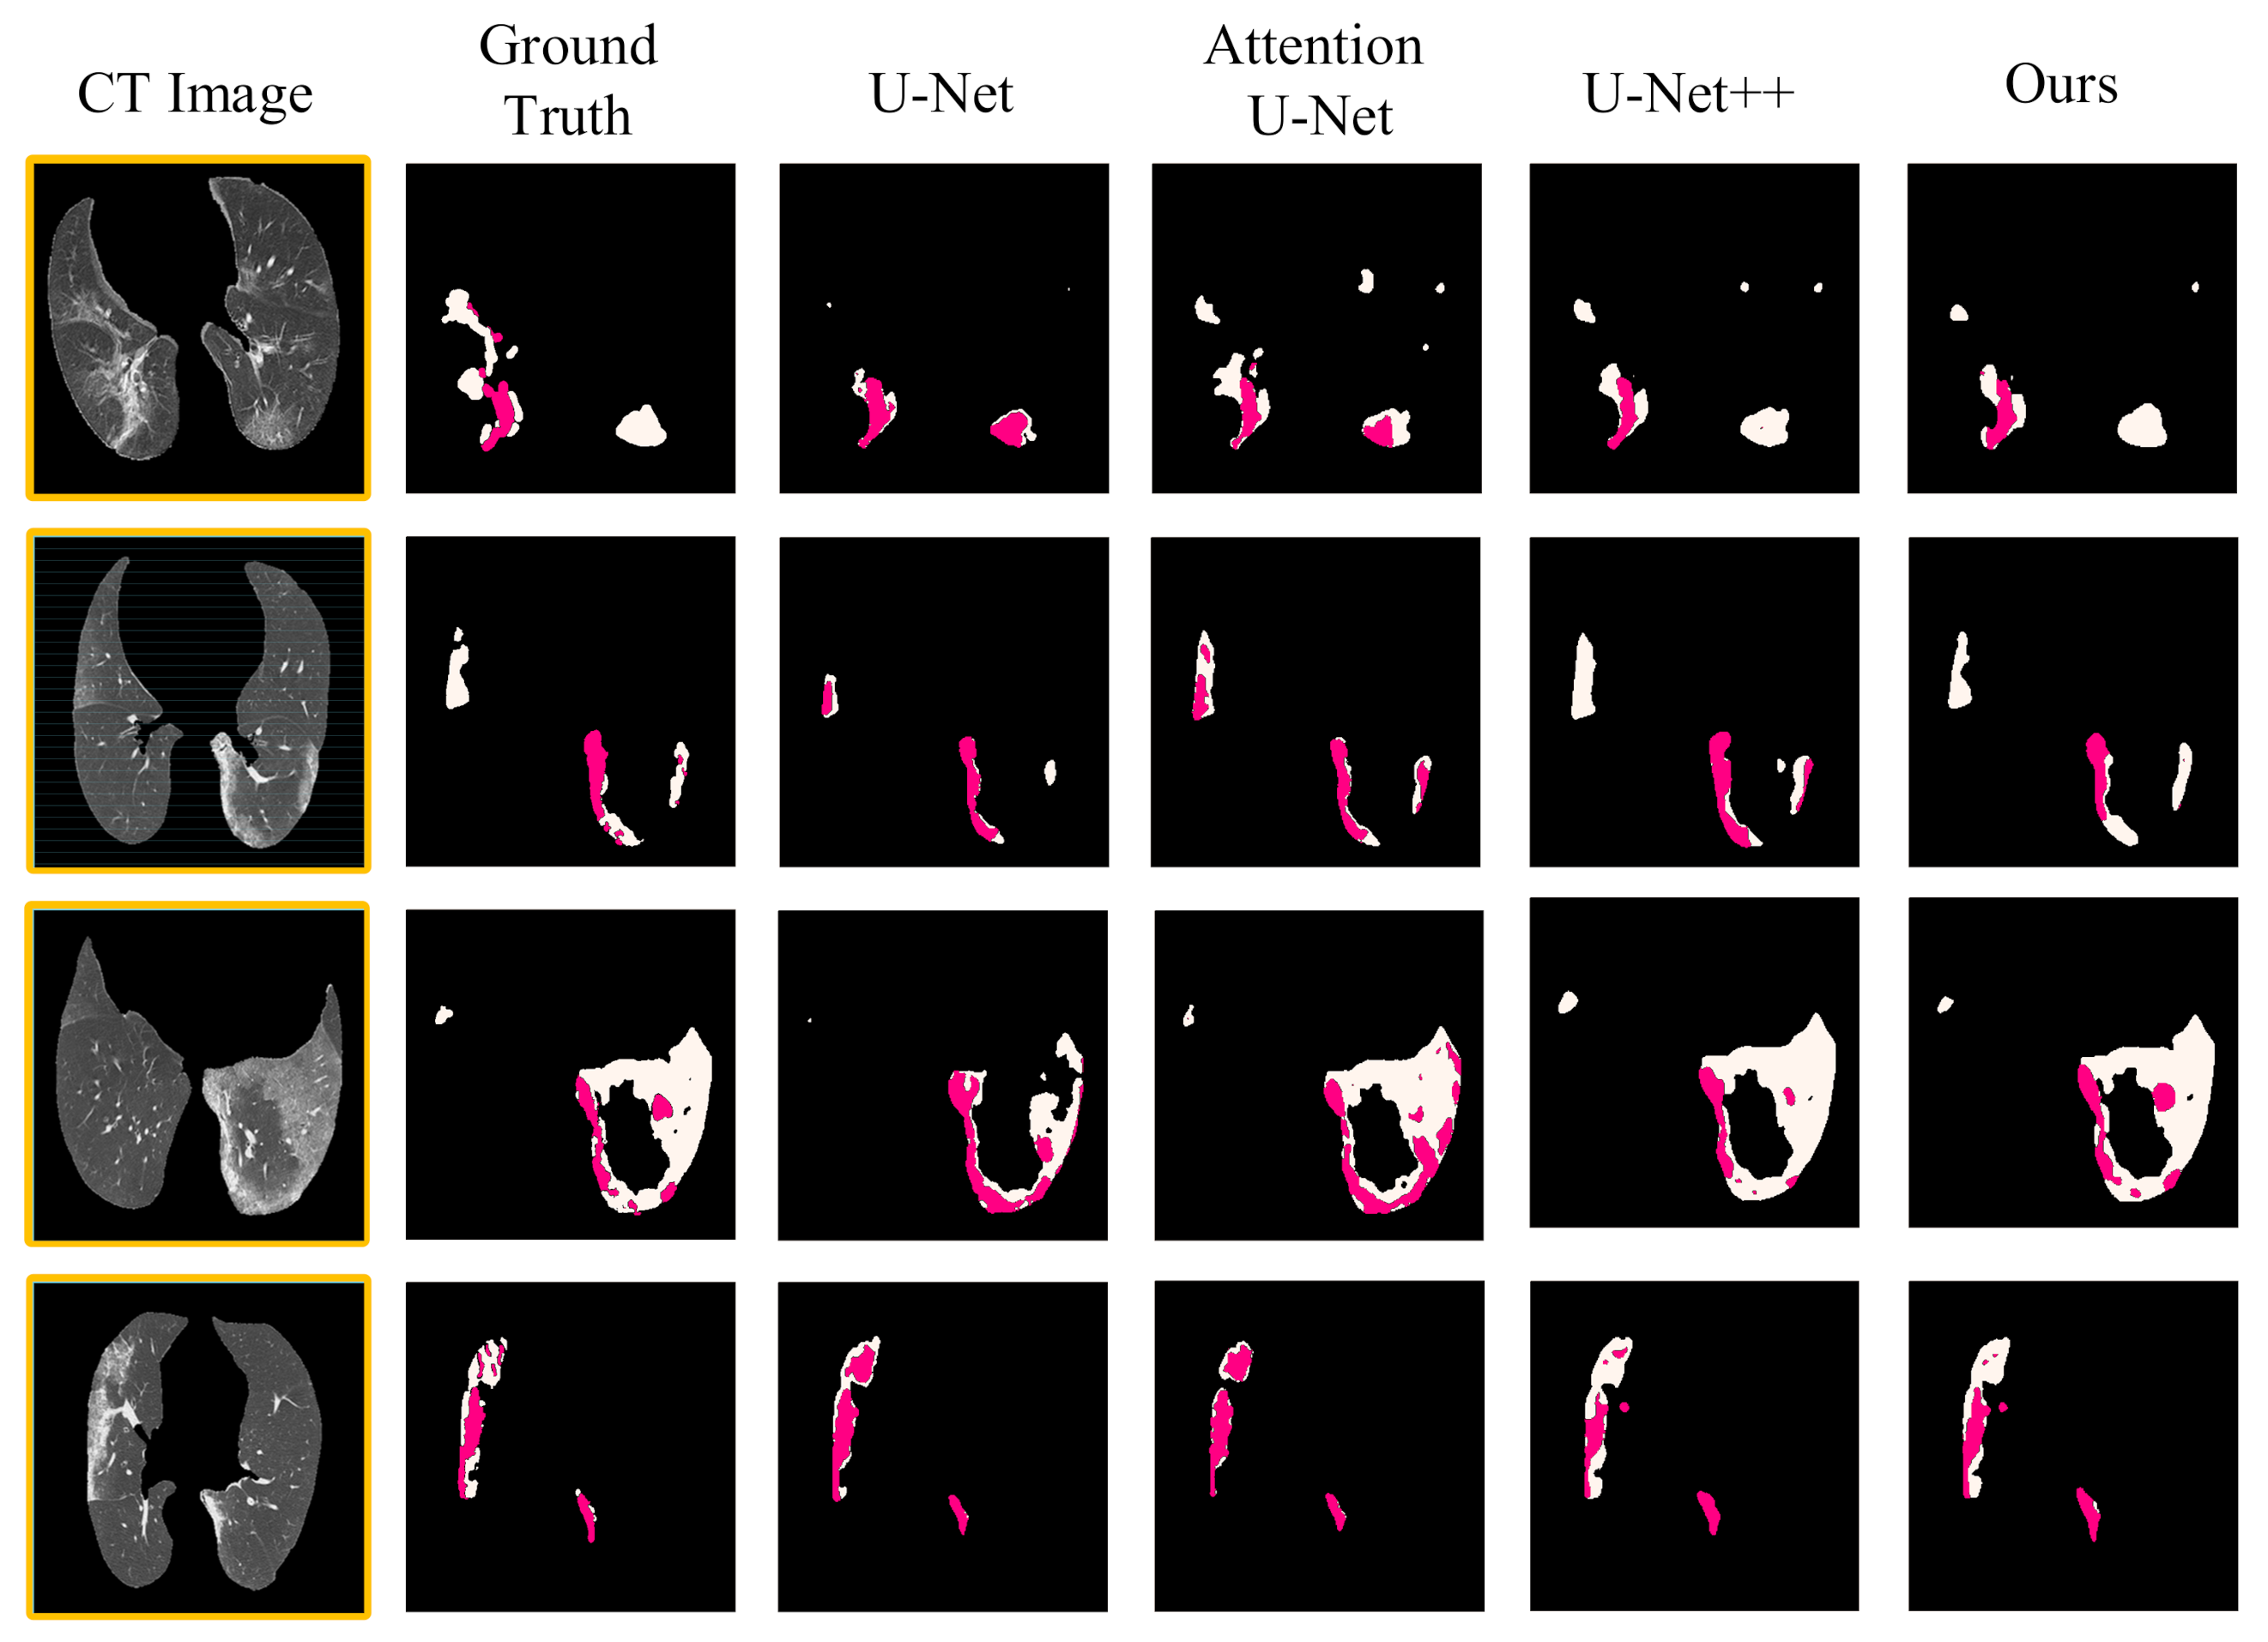
  • We compared the framework with several existing segmentation methods. The experimental results based on the binary-class and multi-class lesion segmentation datasets demonstrated that SD-UNet is more robust and effective for the COVID-19 lung infection segmentation task. Further, an ablation study was implemented to verify the efficiency of the Dense ASPP and SA components, and 5-fold cross-validation was used to objectively and accurately evaluate the performance of our segmentation model.
The rest of this paper is organized as follows: In Section 2, several research works related to the segmentation of COVID-19 pulmonary infection are discussed. In Section 3, the architecture and key components of the proposed network are illustrated in detail. In Section 4, some of the details of the experiment are described. The performance evaluation results of our segmentation network are presented in Section 5, and the conclusion is drawn in Section 6.

2. Related Work

In this section, we present several works that are relevant to our research in several aspects, including medical image semantic segmentation, attention mechanism, and multi-scale contextual information.
Based on the data-driven deep learning method, the high-level abstract thinking ability similar to the human brain is approximately simulated by building an end-to-end deep feature extraction network. One of the advanced and effective models is a convolutional neural network (CNN) [22]. Long et al. [23] designed an end-to-end, pixel-to-pixel fully convolutional neural network (FCN), which was more efficient than traditional CNN-based segmentation networks, but the segmentation result was unsatisfactory because it ignored the global context information of the image and was not sensitive enough to the details of the image. Ronneberger et al. [24] proposed a U-shaped symmetric network (U-Net) that was good at segmentation of cell images and liver CT images by using a jump connection method that greatly improved the segmentation accuracy and the robustness. Zhou et al. [25] designed a U-Net++ segmentation network. By modifying the jump connections in U-Net to nested dense jump connections, this can facilitate the integration of different levels of image features. Zhao et al. [26] designed a novel dilated dual attention network based on U-Net (D2A U-Net) for COVID-19 infection area segmentation in CT images. Xie et al. [27] constructed a double U-shaped dilated attention network (DUDA-Net), which effectively improved the segmentation ability of subtle lesions of COVID-19.
In recent years, the attention mechanism has been widely used in various fields of deep learning. We can easily find the attention mechanism in various tasks such as natural language processing, speech recognition or image processing, and it can be used to emphasize important feature information and suppress irrelevant information [28]. The attention mechanism can also enhance the interpretability of the network. Hu et al. [29] proposed a lightweight channel attention module, “Squeeze-and-Excitation” (SE), which can adaptively learn the interdependence between channels to readjust the characteristic response of the network. Woo et al. [30] designed an attention module convolutional block attention module (CBAM), which combined channel attention and spatial attention mechanisms, so that the network can simultaneously pay attention to the details of the image from both the channel and space. Fan et al. [18] proposed an edge attention mechanism for the segmentation of COVID-19 lung CT images, which provided useful constraints on the edge information of the generated feature maps and explicitly improved the feature representation of the boundary area of the object. Han et al. [31] exploited a self-attention mechanism in generative adversarial networks (GANs) for unsupervised anomaly detection in MRI, helping the network to model the global and long-range dependencies for MRI slices. Schlemper et al. [32] designed an attention gate (AG) model, which can make the model pay more attention to learn features related to the segmentation target. Yeung et al. [33] proposed a dual attention (spatial and channel attention) gated CNN for polyp segmentation during colonoscopies, which encouraged the network to selectively mine polyp features and suppress background features, thus effectively deal with the image segmentation task of category imbalance.
Some previous studies [34,35,36,37,38] showed that multi-scale context information was beneficial for semantic segmentation of image pixels. Farabet et al. [34] used the Laplacian pyramid to transform the image at multiple scales, inputting each scale into the network and merging the feature maps of different scales. Lin et al. [35] simply adjusted the input image at several different scales and then aggregated the output feature maps of all these scales. The disadvantage of this method was its very high number of parameters from extracting multi-scale features [34,35]. Considering the performance of GPU, it is not suitable for larger and deeper networks. Chen et al. [36] introduced atrous spatial pyramid pooling (ASPP), which captured the multi-scale context with parallel dilated convolution at multiple dilated rates for a given input, greatly increasing the receptive field at the cost of increasing the number of parameters. This captured the long-distance and multi-scale information of the image as well. Huang et al. [37] designed a jump connection structure that can extract full-scale information from each convolutional layer of the encoder and decoder and can capture the context information of the image from multiple scale ranges for more precise segmentation. To solve the problem of multiple lesion shapes and positions of COVID-19 pneumonia, Pei et al. [38] designed a network with multi-scale feature extraction capabilities, which used multiple sizes of receptive fields to obtain multiple-scale lesion features so as to strengthen the ability of segmenting COVID-19-infected regions with different sizes.

3. Proposed Method for COVID-19 Infection Segmentation

3.1. The Architecture of SD-UNet

In this section, we elaborate on the network structure of SD-UNet and how the key component SD module is embedded in our network. As shown in Figure 1, the proposed SD-UNet has a U-shaped symmetrical structure, which mainly includes encoder and decoder parts. The upper part of the structure framework diagram of the SD-UNet segmentation network is the encoder, which is called the “down-sampling stages”. DenseASPP is in the middle of the SD-UNet, which is a module for extracting multi-scale features of images. The lower part is the decoder, which is the “up-sampling stages”. The red arrows in the middle are the jump connection operation, concatenating the shallow features with the deep features. In the encoder part, feature extraction is performed on the network, and the image is decomposed into a combination of smaller feature maps at different levels to capture image context information, including four down-sampling encoding stages. Each stage includes an SA block followed by a 2 times of down-sampling called Down-conv operation, halving the sizes of the feature maps and doubling the number of channels of the feature maps. Down-conv operation is achieved by concatenating the features after the maximum pooling operation and the average pooling operation, which can extract the most representative feature and retain the global information of the feature maps to the greatest extent. The feature extraction of the encoder is followed by a Dense ASPP module closely, so that our model can capture a larger receptive field to better deal with multi-scale lesion areas. In the decoder part, up-sampling operation is conducted to restore the feature maps, and the SA block is added to mine deeper semantic features related to lesions, including four up-sampling encoding stages. Each stage includes a 2 times of up-sampling called Up-conv operation and an SA block. In particular, for the Up-conv operation, a bilinear interpolation is used to double the sizes of feature maps, followed by a 1 × 1 convolution to halve the number of channels of feature vectors for concatenation operation. After decoding, a 3 × 3 convolution is used to integrate the number of channels of the feature vectors and output the semantic segmentation map. Additionally, the jump connection operation merges the deep abstract semantic features from the decoding part and the low-level semantic features of different scales from the encoding part, which preserves more spatial details for better image segmentation. In our paper, each convolution layer is followed by an activation function using the Leaky ReLU and Group Normalization [39] layer with Groups = 32.
In the SD-UNet network, it is worth mentioning two key components: SA and Dense ASPP. In the SA component, two 3 × 3 convolutions of U-Net are modified by adding an SA block. The SA module is an improvement of the Squeeze-and-Excitation (SE) module [28], and this module integrates the advantages of ResNet and U-Net and effectively solves the problem of information loss caused by convolution operations. Classical convolution is mainly aimed at spatial local feature coding, while SE establishes the interdependence among feature mapping channels, adaptively learns the weights of feature mapping of different channels, and allocates more important resources to important tasks. The SE module was originally designed to improve classification performance. However, image segmentation is not exactly equivalent to image classification. Inspired by SE, a newer channel attention mechanism, SA, is introduced, which is specifically used for semantic segmentation tasks and aims to improve the segmentation results. The global and local information representation of the image is very important for semantic segmentation. Because the convolutional layer generates a feature map based on the local information, only the local information within the receptive field is considered; the global information of the image is ignored. The global context feature can clarify which areas belong to the same category and can provide a broader view. Global context information is very useful for improving the accuracy of semantic segmentation. The global context feature is utilized to encode these regions as a whole, instead of individually re-weighting each part of the image. The SA module can selectively learn more representative features, which is useful for segmentation by re-weighting both local and global information.
For the Dense ASPP component, it is added between the encoder and decoder of the model. The currently used convolution usually leads to a reduction in the size of the feature map, and the receptive field of the convolution operation in U-Net is often dependent on the size of the convolution kernel. In this paper, atrous or dilated convolution is used to overcome this limitation. This method uses a filter with holes to increase the receptive field without changing the size of the feature map. In COVID-19 lung CT images, there are lesions with large-scale changes and complex textures. ASPP uses dilated convolution with different dilated rates to aggregate features of different scales in parallel. To a certain extent, it can alleviate multi-scale problems. However, the resolution of the features on the scale axis is not sufficient to accurately extract the lesion features of lung CT images without enough receptive field information. Additionally, ASPP aggregates dilated convolutions of different dilated rates to obtain more scale information of the image, but when the dilated rate is too high, only a small number of feature points will be selected for each calculation, and the sampling points are not dense, resulting in the loss of a large amount of the key information. With the different sizes of the diseased object taken into account, the accuracy of the semantic segmentation of the object based on a deep neural network can be improved, and more dense sampling can retain more feature information. Dense ASPP encourages the use of dilated convolution layers with different dilated rates in a densely connected way to better capture lesion features from different scales. Without significantly increasing the computation burden of the model, Dense ASPP has denser receptive field information in contrast to ASPP and can extract more semantic features from multiple scales to retain more spatial context information to handle multi-scale image features and improve segmentation accuracy. The descriptions of SA and Dense ASPP will be illustrated in detail in the following section.

3.2. Squeeze-and-Attention Module

In many previous works, the attention mechanism was used to guide the network to learn more useful information adaptively and to enhance the feature representation ability of the network. However, most of the work mainly focused on the pixel-level attention mechanism while ignoring the importance of pixel grouping. Specifically, pixel-level attention solves the problem of pixel-by-pixel prediction, and pixel grouping emphasizes the relation between pixels of the same type. For segmentation tasks, in addition to the dense prediction of a single pixel, it is necessary to capture the differences and relations among pixels. In other words, segmentation should focus on grouping pixels of the same category. In this paper, we introduce a novel SA module into SD-UNet, which is specifically responsible for the channel attention mechanism of pixel grouping. The SA module introduces “attention” convolution to the traditional convolution channel, to a large extent explicitly constructs the interdependence between the feature channels, and reduces the local constraints of the convolution kernel. The SA module uses the down-sampling channel generated by the average pooling to fuse multi-scale feature maps and generate non-local spatial attention. In general, our SA module not only considers the pixel-level prediction, but also takes into account the attention to the pixel group. Unlike the SE module, the SA module avoids the use of very large multiples of up-sampling and so reduces the model parameters. Down-sampling is not fully-squeezed, which makes the network more flexible. Moreover, unlike the ordinary residual module, the SA module can adaptively recalibrate the channel weights, which effectively enhances the local feature representation ability of the residual module. Figure 2 shows the architecture of the SA module. We introduce an additional path from the output of the convolution to learn the weight information and explicitly model the relationship among the channels by re-weighting the local and global features. This mechanism can better adapt to semantic segmentation tasks. Through this re-weighting mechanism, the original feature channel weights are adjusted, allowing the network to use global information to adaptively determine which parts of the image need to be activated, thereby emphasizing important features and suppressing irrelevant features.
The formula of the SA module can be simply expressed as:
X o u t = X a t t n × X r e s + X a t t n
where X a t t n = U p X ˜ a t t n denotes the up-sampling operation on X ˜ a t t n to match the output feature map X r e s on the main convolution path. Moreover, X r e s = ε X i n ; Θ , Ω , ε represents the residual feature extraction operation of X i n on the main convolution path, Θ and Ω represent the two “CONV” convolution layers for feature extraction separately, which are used to parameterize ε ; “×” and “+” represent the element multiplication and addition operations of the two tensors, respectively.
X ˜ a t t n can be expressed as in Equation (2):
X ˜ a t t n = ε a t t n A P o o l X i n ; Θ a t t n , Ω a t t n
where X ˜ a t t n represents the output of the attention convolution channel ε a t t n , which is parameterized by Θ a t t n and Ω a t t n . A P o o l is the average pooling operation and the not fully-squeezed of the input feature map X i n ; Θ a t t n and Ω a t t n represent the convolution operations on two “ACONV” attention channels responsible for calibrating the output feature map channel.

3.3. Dense ASPP

CNNs are widely used in the field of computer vision to perform deep-level abstract feature extraction tasks. However, in CNN, simple convolution operations may be too weak to solve some complex tasks. For example, if the image is resized, rotated, or deformed, it is difficult for CNN to accurately identify the original image. Usually, 3 × 3 or 5 × 5 convolution is used to extract the local information of the image. In the feature extraction process, the pooling operation is often utilized to reduce the size of the feature map. While the pooling operation reduces the resolution of the image, it will also cause such problems as loss of spatial position information and loss of small object information, which are not good for improving the segmentation results. Therefore, in this paper, dilated convolution was designed to avoid the loss of semantic information caused by down-sampling operation, better capture the position information of the image, and improve the segmentation accuracy of infected tissue. Dilated convolution can increase the receptive field by injecting dilation into different convolutions. The ASPP proposed in Deeplab v3+ contains the following five parallel feature extraction operations: three dilated convolution layers whose dilated rates are 6, 12, and 18, a 1 × 1 convolution, and an average pooling down-sampling layer. The obtained five features are concatenated in the channel dimension, and finally, the channel is compressed to the desired value through a 1 × 1 convolution to obtain a larger range of information. As shown in Figure 3, based on ASPP, we build a denser connected Dense ASPP module, which can effectively extract targets of different scales and more effectively segment high-resolution lung images with complex textures. Dense ASPP cascades the dilated convolutions of different dilated rates in a densely connected way. The input of each dilated convolutional layer is derived from all of its previous layers, so that a denser receptive field can be achieved.
The specific calculation formula of one-dimensional dilated convolution is:
Y i = n = 1 N X i + r × n × W n
where X represents the input feature map, W represents the convolution kernel, N represents the size of the filter, and r is the dilated rate of the convolution with holes. Dilated convolution can be utilized to expand the receptive field of feature map by injecting dilation into different convolutions while maintaining the resolution of feature map; thus, it can capture a wider range of spatial context information.
Dense ASPP is similar to ASPP, including three layers of dilated convolution, a 1 × 1 convolution, and a lower sampling average pooling layer. The concatenation calculation of the 5-feature extraction operations is shown in (4):
Y = c o n c a t I p o o l X , C X , Y 0 , Y 1 , Y 2
where C o n c a t refers to the channel-dimensional splicing of the five output feature maps, I p o o l represents the average pooling operation, and C represents the convolution operation with the convolution kernel size of 1 × 1. The output Y i expression of a dilated convolution in each layer is:
Y 0 = H 6 , 3 X Y 1 = H 12 , 3 C o n c a t X , Y 0 Y 2 = H 18 , 3 C o n c a t X , Y 0 , Y 1
where H r , n represents the dilated convolution with dilated rate r and convolution kernel size n .

4. Experiments

4.1. Dataset Descriptions

Data acquisition: For the purpose of evaluating our proposed method, we performed two-class and multi-class lung lesion tissue segmentations separately on different datasets, all of which are publicly available. The dataset for the binary-class segmentation experiment is a combination of two different lung CT segmentation datasets (Dataset-B1, Dataset-B2), with a total of 1963 lung CT slices, including 100 from dataset-B1 and 1863 from dataset-B2. Specifically, Dataset-B1 in the experiment was collected from more than 40 patients with COVID-19 by the Italian Society of medical and interactive radiology [40], including 100 axial CT images with lung infection labels segmented by radiologists, and the size of each CT slice is 520 × 520. Dataset-B2 [41] consists of 1863 COVID-19 and 1637 non-COVID-19 CT samples from 20 labeled COVID-19 CT scans (with two sizes of images, 520 × 520 and 630 × 630) and has been labeled with left lung, right lung, and affected region by experienced radiologists. We excluded lung CT slices without lesions and only retained 1863 COVID-19 cases containing infected areas for training. Dataset-M [40] was selected for the multi-class segmentation task in this paper; it was from nine CT scans segmented by radiologists. This dataset has 829 lung CT slices and masks, including 456 negative and 373 positive samples, and the image size is 630 × 630. We selected 373 slices of positive COVID-19 cases as our training samples. The pixel sizes of all training data of binary-class and multi-class segmentation experiments were resized 288 × 288 CT images with mask labels. In particular, each multi-class label included three categories, namely, consolidation, GGO, and background.
In order to eliminate the interference of background regions that are unrelated to pneumonia segmentation in COVID-19 samples, we chose to extract the lung regions of all CT slices in the pre-processing stage. First, as can be seen in Figure 4, the raw image and infection mask were pre-processed through extraction of the lung contour, removal of the black background around the lung (the OpenCV toolkit was used to remove the black background), and resizing (the resized image of each CT slice was 288 × 288). Then, the processed data (lung contour) were sent to the network for training. Finally, supervised learning was performed on the prediction mask and ground truth to optimize the segmentation results. Since the pixel level standard for image masks is time-consuming and laborious, we only collected 1863 CT slices with lung masks from dataset-B2 and 373 CT slices with lung masks from dataset-M. For dataset-B1, lung masks were difficult to identify because they were not marked by experts, so only the operations of removing the black background around the lung and adjusting the image size to 288 × 288 were performed. By using lung masks to extract the lung region related to infection from lung CT slices, we can effectively filter out the interference of the background noise outside the lung and highlight the texture features of the lung lesion region, which can make the network put more focus on the segmentation of the COVID-19 lesion region. It is worth mentioning that we classified non-COVID-19 lesions into a semantic category (background category).

4.2. Evaluation Metrics

We quantitatively evaluated the model using the COVID-19 dataset and selected five evaluation indices to measure the performance of network segmentation: Sen (Sensitivity), DSC (Dice Similarity Coefficient), Acc (Accuracy), Spe (Specificity), and JS (Jaccard Similarity). The DSC and JS indicators were used to measure the similarity between the predicted results and the real results. It is worth noting that the DSC and JS indicators are widely used in the field of medical image segmentation. The formula is defined as follows:
D S C S 1 , S 2 = 2 S 1 S 2 S 1 + S 2 J S S 1 , S 2 = S 1 S 2 S 1 S 2
where S 1 and S 2 denote the ground truth and masks predicted by the network, respectively, and their value ranges are 0 , 1 . The closer the value is to 1, the closer the segmentation result predicted by the network is to the ground truth.
Sen, Acc, and Spe are also often used to evaluate the quality of semantic segmentation results, which are defined as follows:
Sen = T P T P + F N Acc = T P + T N T P + T N + F P + F N Spe = T N T N + F P
T P , F P , F N , and T N indicate that the lesion area is correctly segmented as a lesion, the background area is incorrectly segmented as a lesion, the lesion area is incorrectly segmented as background, and the background area is correctly segmented as background, respectively. We used the above indicators to comprehensively evaluate the segmentation results of COVID-19 lung infection. In addition, the COVID-19 lung infection dataset provided ground truth as labels, and the performance evaluation results can be seen in Section 5.

4.3. Combo Loss Function

Recent works [42,43] have proved that the compound loss function, especially the dice-related compound loss function, is a better choice to improve the segmentation effect compared with a single loss function, so we deployed a combo loss function for segmentation supervision. The combo loss function in this paper consists of two parts: BCE (Binary Cross Entropy) loss and DSC (Dice Similarity Coefficient) loss. BCE loss is widely used in image semantic segmentation tasks. Each pixel of the image is evaluated one by one, ignoring the neighborhood label and weighting the segmented pixels and background pixels, which can contribute to the convergence of the network. Since the BCE loss can back-propagate the gradient values corresponding to different categories very stably, using it for network optimization can effectively alleviate the problem of gradient disappearance. However, for medical image segmentation, the phenomenon of class imbalance often occurs, which leads to the fact that network training mainly tends to segment categories with dense pixel distribution, and it is difficult for the network to learn the characteristics of small objects, so as to reduce the reliability of the network. The formula is as follows:
L B C E = 1 N i = 1 N g i ln p i + 1 g i × ln 1 p i
where g i is the segmentation result marked by radiologist for pixel i , and p i is the segmentation result predicted by network for pixel i .
The introduction of DSC loss is aimed to alleviate the impact of category imbalance and make the predicted result closer to the real result. However, if the predicted result does not completely coincide with the labeled real result pixels, the DSC loss will have a negative impact on the back propagation, which will make the training process very difficult. The formula is as follows:
L D S C = 1 2 I = 1 N g i p i i = 1 N g i 2 + i = 1 N p i 2
For the sake of accelerating the convergence speed of the network, alleviate the problem of gradient disappearance in the process of back propagation and the impact of category imbalance, and achieve the accurate segmentation of COVID-19 lung-infected tissue, we combined the two loss functions for network training, and the formula is as follows:
L = L B C E + L D S C

4.4. Implementation Details

Our computer is configured with i5-10600KF (CPU), 32 GB RAM, and the graphics card is an NVIDIA GeForce GTX3070. The experimental language is Python, and all models were executed in the Pytorch framework. In order to balance computational efficiency and memory consumption, we used the Adam optimizer to minimize the loss function. The initial learning rate was set to 0.0002, the learning rate attenuation strategy used a fixed step size attenuation, the learning rate was adjusted every 20 epochs, and the attenuation coefficient was set to 0.8. This paper divided the training set, validation set, and testing set at a ratio of 7:1:2, as shown in Table 1. The training set was sent to the network with a batchsize of 4 for iterative training. At the end of each epoch, we validated the model and saved the best performing results. The largest epoch was set to 200. After training, the best weights of the model were saved, and then the generalization performance of the model was tested. Moreover, we adopted several data enhancement methods widely used in semantic segmentation, such as translation, rotation, flipping, and scaling, which effectively enhance the diversity of training data and improve the generalization ability of the model in the case of a small training dataset.

5. Results

5.1. Performance Evaluation of the Segmentation Network

With the purpose of verifying the segmentation performance of the SD-UNet proposed in this paper for the COVID-19 pneumonia disease, we compared SD-UNet with the state-of-the art models on the binary-class COVID-19 lung infection dataset.
Table 2 shows the segmentation results of our proposed method compared with PSPNet, R2U-Net, CE-Net, U-Net, DeepLab v3+, and UNet++. The codes of these models are all open source. We used the same training strategy for training SD-UNet and the other models to ensure fairness of the comparison. From Table 2, we can observe that our SD-UNet had a great advantage in the overall segmentation performance compared with other models on the binary-class COVID-19 lung infection dataset. It is worth mentioning that our proposed SD-UNet had better segmentation results compared with the baseline model U-Net. Specifically, four of the five indices of SD-UNet were significantly improved compared with U-Net. This shows that our SD-UNet effectively improved the segmentation performance of COVID-19 lung infections and achieved the expected optimization goal compared with the baseline model. To be specific, our proposed SD-UNet performed best except for the Spe index. Compared with the model UNet++ that achieved the second best result, our SD-UNet improved by 0.94%, 0.36%, 0.17%, and 1.10% in DSC, Acc, Spe, and JS, respectively. Moreover, as shown in Figure 5, although the segmentation effect of UNet++ was better than that of U-Net, it still predicted the background area as the lung infection area and the lung infection area as the background area segmentation, and the segmentation effect was not accurate enough. The segmentation results produced by SD-UNet were closest to the ground truth in overall shape and position; they effectively distinguished the infection area from the background area, solved the over-segmentation and under-segmentation problems of other algorithms, had clearer and smoother boundaries, and were more sensitive to the segmentation of small objects compared to other methods. This shows that our proposed method is more robust and effective for the segmentation task of COVID-19 lung infection.
In order to further evaluate the performance of our method on different types of COVID-19 pulmonary disease, we selected three state-of-the art models for comparison on the multi-class COVID-19 lung infection dataset. From the experimental results of Table 3, Sen, DSC, JS, Acc, and Spe in our proposed lung segmentation network reached 0.6169, 0.5936, 0.9821, 0.9907, and 0.4788, respectively. This indicates that our evaluation indicators achieved the best comprehensive performance compared with the existing baseline model U-Net and its variants such as U-Net, Attention U-Net, and U-Net++, but not the Spe index. Compared with the baseline model U-Net, the proposed method improved by 0.25%, 3.03%, 0.37%, 0.28%, and 2.15% in these five indices. In particular, although U-Net++’s segmentation index Sen was 2.24% higher than our method, other indices were lower than our proposed method. In analysis, the pixel contrast between the GGO class and background class was low. On the other hand, the appearance of the GGO class was blurred. This is why it is difficult for GGO to be accurately segmented by the network compared with the Con (Consolidation) class. However, the segmentation index of the GGO class of our proposed method was still the best compared to other methods. All of the above experiments show that our method has a stronger ability to deal with semantic segmentation. Specifically, as shown in Figure 6, our SD-UNet effectively distinguished the lung infection area from the background area and clearly segmented the outline of the infection area, more approximately reaching the result based on the doctor’s manual labeling. It is worth mentioning that our method can better segment different types of infections and can clearly capture the category characteristics of GGO and Con (Consolidation). It also shows good segmentation results even for the more challenging GGO category, which indicates that our method has potential for COVID-19 auxilliary diagnosis.

5.2. Analysis and Discussion

With the aim of exploring the effect of the Dense ASPP and SA components in SD-UNet, we performed ablation studies using Dense ASPP and SA components independently on the dataset-B. The experimental results are shown in Table 4; it can be seen that both the Dense ASPP and SA components play positive roles in improving the segmentation ability of the network. For the Dense ASPP component, the Sen, DSC, Acc, and JS indicators were improved compared with the backbone, which can be explained as follows: Dense ASPP can help the network capture long-distance lesion features and improve the segmentation accuracy of multi-scale lesion tissue. For the SA component, the DSC, Acc Spe, and JS indicators also showed a better result relative to the backbone. This can be understood that the SA component can better use global information to adaptively determine which parts of the image are activated in the process of feature extraction so as to achieve the effect of emphasizing important features and suppressing irrelevant features, helping to achieve better segmentation results. In general, Our SD-UNet combines the advantages of high sensitivity of the Dense ASPP module with high specificity of the SA module to improve the segmentation performance of COVID-19.
On the basis of the U-Net segmentation network architecture, the SA and SE modules were embedded into the network for training to verify that the performance of the SA module was better than that of the SE module in the task of pulmonary infection segmentation. Table 5 shows the comparative test results of the two modules.
As a measure of the confusion degree of the multi-classification model, the confusion matrix can express the performance of the classification algorithm in a visualized way. Therefore, to better evaluate the performance of the proposed multi-class segmentation model, we drew the confusion matrix obtained from the multi-class segmentation experiments. As shown in Figure 7, the values on the diagonal line indicate the correct prediction results, and the remaining values are the wrong prediction results caused by the misjudgment of the model.

5.3. Cross-Validation

Given that our segmentation dataset is relatively small and the distribution of the COVID-19 segmentation dataset is very complicated, it is difficult to be fully understood. When we manually divide the dataset, there will be an imbalance in the data division, resulting in insufficient robustness of the model training results. This imbalance will have a significant impact on small dataset, so we chose a cross-validation operation to obtain a more accurate and objective evaluation of the model. Table 6, Table 7, Table 8 and Table 9 are the results of 5-fold cross-validation of the model. It can be seen that there are certain fluctuations in each evaluation index when we divide the dataset many times. Except for the binary-class Sen and multi-class Acc indices, the change trend of each index is consistent with that in Table 2 and Table 3, which also confirms that our segmentation model has better generalization performance.

6. Conclusions

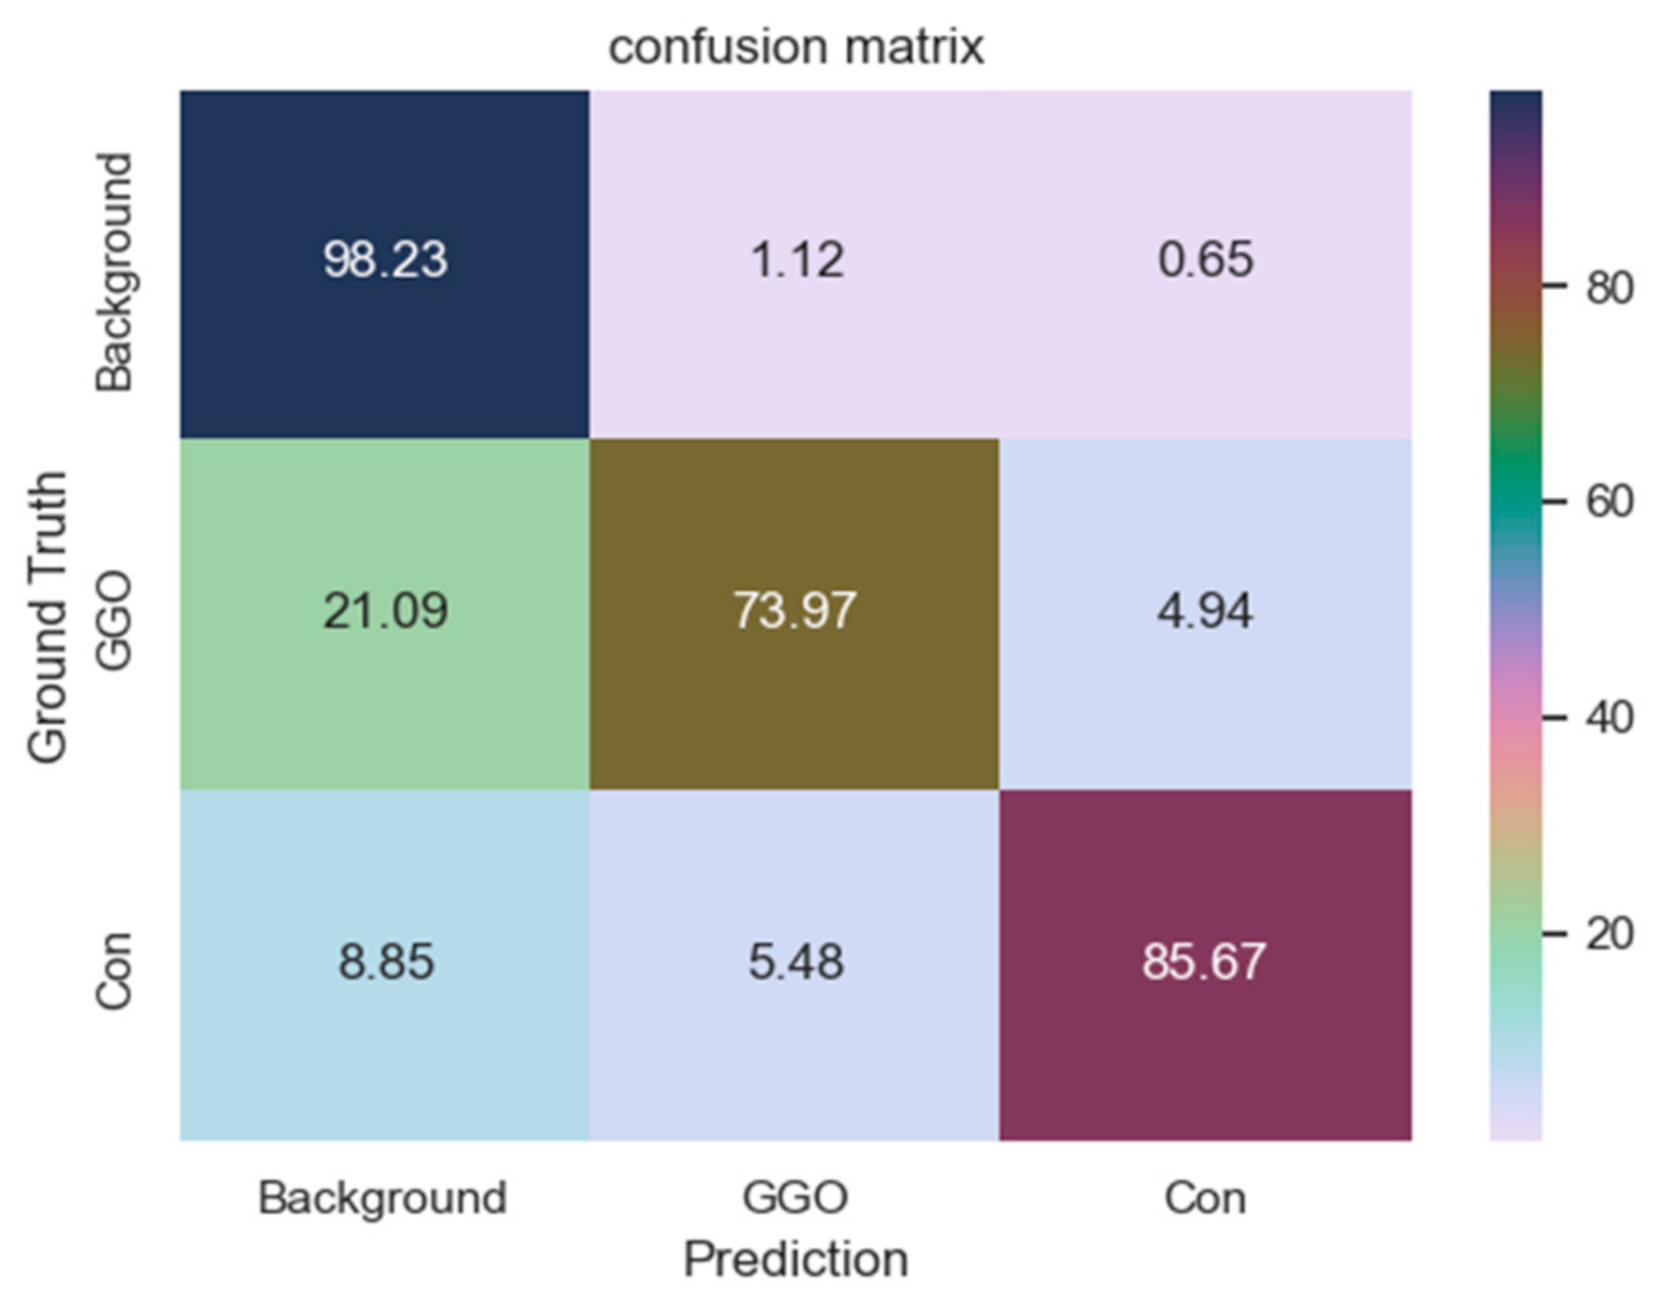
In this paper, we propose a novel framework dedicated to COVID-19 segmentation: SD-UNet. It integrates the Dense ASPP and SA modules into our segmentation framework to better mine the multi-scale context and global context information in COVID-19 lung CT infection slices. Pre-processing operations are also performed on COVID-19 samples to eliminate irrelevant background information and enhance information related to COIVD-19 lesion segmentation. During training, to accelerate the convergence of the network and alleviate the problem of gradient disappearance in the process of back propagation and the impact of category imbalance of mall datasets, we also deployed a combo loss function for segmentation supervision. The experimental results show that compared with the baseline U-Net and other cutting-edge segmentation methods, SD-UNet can achieve a more accurate segmentation effect for COVID-19. In addition, not only can we segment COVID-19 lung infections globally in our segmentation framework, we can also segment different types of infections (GGO and Consolidation) in detail. Moreover, the good segmentation performance also proves that our method has great practical significance for the development of computer-aided diagnosis technology for COVID-19. It is expected to assist doctors in making diagnosis and treatment plans more accurately and quickly and to improve the segmentation effect. However, there are some deficiencies in the experiment, e.g., the predicted COVID-19 lesion contours are not elaborate enough. The main reason is the relatively limited COVID-19 lesion segmentation data labeled by the experts, resulting in the insufficient training sample sizes of the model. In the future, we will further expand our research in the following aspects: increase the amount of data, use more image enhancement technology, explore various loss functions suitable for medical image segmentation, continue to optimize our segmentation framework, and apply our segmentation framework to other segmentation tasks such as blood vessel segmentation, liver segmentation, and pancreas segmentation.

Author Contributions

Conceptualization, methodology, software and writing—original draft preparation, S.Y.; editing and supervision, H.D.; visualization Z.X., Q.Z. and J.C. All authors have read and agreed to the published version of the manuscript.

Funding

This work was supported by the National Natural Science Foundation of China, grant number 62020106010.

Conflicts of Interest

The authors declare no conflict of interest.

References

  1. Zhu, N.; Zhang, D.; Wang, W. A novel coronavirus from patients with pneumonia in China, 2019. N. Engl. J. Med. 2020, 382, 727–733. [Google Scholar] [CrossRef]
  2. Benvenuto, D.; Giovanetti, M.; Salemi, M. The global spread of 2019-nCoV: A molecular evolutionary analysis. Pathog. Glob. Health 2020, 114, 64–67. [Google Scholar] [CrossRef] [Green Version]
  3. Shi, F.; Wang, J.; Shi, J. Review of artificial intelligence techniques in imaging data acquisition, segmentation, and diagnosis for COVID-19. IEEE Rev. Biomed. Eng. 2021, 14, 4–15. [Google Scholar] [CrossRef] [PubMed] [Green Version]
  4. Wang, C.; Horby, P.W.; Hayden, F.G.; Gao, G.F. A novel coronavirus outbreak of global health concern. Lancet 2020, 395, 470–473. [Google Scholar] [CrossRef] [Green Version]
  5. Huang, C.; Wang, Y.; Li, X. Clinical features of patients infected with 2019 novel coronavirus in Wuhan, China. Lancet 2020, 395, 497–506. [Google Scholar] [CrossRef] [Green Version]
  6. Guan, W.; Ni, Z.; Hu, Y. Clinical characteristics of coronavirus disease 2019 in China. N. Engl. J. Med. 2020, 382, 1708–1720. [Google Scholar] [CrossRef]
  7. Roberts, M.; Driggs, D.; Thorpe, M. Common pitfalls and recommendations for using machine learning to detect and prognosticate for COVID-19 using chest radiographs and CT scans. Nat. Mach. Intell. 2021, 3, 199–217. [Google Scholar] [CrossRef]
  8. Huang, L.; Han, R.; Ai, T. Serial quantitative chest CT assessment of COVID-19: A deep learning approach. Radiol. Cardiothorac. Imaging 2020, 2, e200075. [Google Scholar] [CrossRef] [Green Version]
  9. Shan, F.; Gao, Y.; Wang, J. Lung infection quantification of COVID-19 in CT images with deep learning. arXiv 2020, arXiv:2003.04655. [Google Scholar]
  10. Ai, T.; Yang, Z.L.; Hou, H.Y. Correlation of chest CT and RT-PCR testing for coronavirus disease 2019 (COVID-19) in China: A Report of 1014 Cases. Radiology 2020, 296, E32–E40. [Google Scholar] [CrossRef] [Green Version]
  11. Ye, Z.; Zhang, Y.; Wang, Y.; Huang, Z.X.; Song, B. Chest CT manifestations of new coronavirus disease 2019 (COVID-19): A pictorial review. Eur. Radiol. 2020, 30, 4381–4389. [Google Scholar] [CrossRef] [Green Version]
  12. Patil, D.D.; Deore, S.G. Medical image segmentation: A Review. Int. J. Comput. Sci. Mob. Comput. 2013, 2, 22–27. [Google Scholar]
  13. Wang, S.; Kang, B.; Ma, J. A deep learning algorithm using CT images to screen for coronavirus disease (COVID-19). Eur. Radiol. 2021, 31, 6096–6104. [Google Scholar] [CrossRef] [PubMed]
  14. Zhou, T.X.; Canu, S.; Su, R. Automatic COVID-19 CT segmentation using U-Net integrated spatial and channel attention mechanism. Int. J. Imaging Syst. Technol. 2021, 31, 16–27. [Google Scholar] [CrossRef] [PubMed]
  15. Chen, X.C.; Yao, L.; Zhang, Y. Residual attention U-Net for automated multi-class segmentation of COVID-19 chest CT images. arXiv 2020, arXiv:2004.05645. [Google Scholar]
  16. Rajaraman, S.; Siegelman, J.; Alderson, P.O.; Folio, L.S.; Folio, L.R.; Antani, S.K. Iteratively pruned deep learning ensembles for COVID-19 detection in chest X-Rays. IEEE Access 2020, 8, 115041–115050. [Google Scholar] [CrossRef]
  17. Wang, G.T.; Liu, X.L.; Li, C.P. A noise-robust framework for automatic segmentation of COVID-19 pneumonia lesions from CT images. IEEE Trans. Med. Imaging 2020, 39, 2653–2663. [Google Scholar] [CrossRef] [PubMed]
  18. Wu, D.F.; Gong, K.; Arru, C.D. Severity and consolidation quantification of COVID-19 from CT images using deep learning based on hybrid weak labels. IEEE J. Biomed. Health Inform. 2020, 24, 3529–3538. [Google Scholar] [CrossRef] [PubMed]
  19. Fan, D.P.; Zhou, T.; Ji, G.P. Inf-Net: Automatic COVID-19 lung infection segmentation from CT images. IEEE Trans. Med. Imaging 2020, 39, 2626–2637. [Google Scholar] [CrossRef]
  20. Zhong, Z.L.; Lin, Z.Q.; Bidart, R. Squeeze-and-attention networks for semantic segmentation. In Proceedings of the IEEE Conference on Computer Vision and Pattern Recognition, Seattle, WA, USA, 13–19 June 2020; pp. 13062–13071. [Google Scholar]
  21. Yang, M.K.; Yu, K.; Zhang, C.; Li, Z.W.; Yang, K.Y. DenseASPP for semantic segmentation in street scenes. In Proceedings of the IEEE Conference on Computer Vision and Pattern Recognition, Salt Lake City, UT, USA, 18–23 June 2018; pp. 3684–3692. [Google Scholar]
  22. LeCun, Y.; Bengio, Y.; Hinton, G. Deep learning. Nature 2015, 521, 436–444. [Google Scholar] [CrossRef]
  23. Long, J.; Shelhamer, E.; Darrell, T. Fully convolutional networks for semantic segmentation. IEEE Trans. Pattern Anal. Mach. Intell. 2017, 39, 640–651. [Google Scholar]
  24. Ronneberger, O.; Fischer, P.; Brox, T. U-Net: Convolutional networks for biomedical image segmentation. In Proceedings of the International Conference on Medical Image Computing and Computer-Assisted Intervention, Munich, Germany, 5–9 October 2015; pp. 234–241. [Google Scholar]
  25. Zhou, Z.W.; Siddiquee, M.M.R.; Tajbakhsh, N.; Liang, J.M. UNet++: A nested U-Net architecture for medical image segmentation. In Proceedings of the 4th International Workshop on Deep Learning in Medical Image Analysis, Granada, Spain, 20 September 2018; pp. 3–11. [Google Scholar]
  26. Zhao, X.Y.; Zhang, P.; Song, F. D2A U-Net: Automatic segmentation of COVID-19 CT slices based on dual attention and hybrid dilated convolution. Comput. Biol. Med. 2021, 135, 104526. [Google Scholar] [CrossRef] [PubMed]
  27. Xie, F.; Huang, Z.; Shi, Z.J. DUDA-Net: A double u-shaped dilated attention network for automatic infection area segmentation in COVID-19 lung CT images. Int. J. Comput. Assist. Radiol. Surg. 2021, 16, 1425–1434. [Google Scholar] [CrossRef] [PubMed]
  28. Snyder, D.; Garcia-Romero, D.; Povey, D.; Khudanpur, S. Deep neural network embeddings for text- independent speaker verification. In Proceedings of the 18th Annual Conference of the International-Speech-Communication-Association, Stockholm, Sweden, 20–24 August 2017; pp. 999–1003. [Google Scholar]
  29. Hu, J.; Shen, L.; Albanie, S.; Sun, G.; Wu, E.H. Squeeze-and-excitation networks. In Proceedings of the IEEE Conference on Computer Vision and Pattern Recognition, Salt Lake City, UT, USA, 18–23 June 2018; pp. 7132–7141. [Google Scholar]
  30. Woo, S.H.; Park, J.; Lee, J.Y.; Kweon, I.S. CBAM: Convolutional block attention module. In Proceedings of the 15th European Conference on Computer Vision, Munich, Germany, 8–14 September 2018; pp. 3–19. [Google Scholar]
  31. Han, C.; Rundo, L.; Murao, K. MADGAN: Unsupervised medical anomaly detection GAN using multiple adjacent brain MRI slice reconstruction. BMC Bioinform. 2021, 22, 31. [Google Scholar] [CrossRef]
  32. Schlemper, J.; Oktay, O.; Schaap, M. Attention gated networks: Learning to leverage salient regions in medical images. Med. Image Anal. 2019, 53, 197–207. [Google Scholar] [CrossRef]
  33. Yeung, M.; Sala, E.; Schönlieb, C.B.; Rundo, L. Focus U-Net: A novel dual attention-gated CNN for polyp segmentation during colonoscopy. Comput. Biol. Med. 2021, 137, 104815. [Google Scholar] [CrossRef]
  34. Farabet, C.; Couprie, C.; Najman, L.; LeCun, Y. Learning hierarchical features for scene labeling. IEEE Trans. Pattern Anal. Mach. Intell. 2013, 35, 1915–1929. [Google Scholar] [CrossRef] [Green Version]
  35. Lin, G.S.; Shen, C.H.; van den Hengel, A.; Reid, I. Efficient piecewise training of deep structured models for semantic segmentation. In Proceedings of the IEEE Conference on Computer Vision and Pattern Recognition, Seattle, WA, USA, 27–30 June 2016; pp. 3194–3203. [Google Scholar]
  36. Chen, L.C.; Zhu, Y.K.; Papandreou, G. Encoder-decoder with atrous separable convolution for semantic image segmentation. In Proceedings of the 15th European Conference on Computer Vision, Munich, Germany, 8–14 September 2018; pp. 833–851. [Google Scholar]
  37. Huang, H.M.; Lin, L.F.; Tong, R.F. UNet 3+: A full-scale connected UNet for medical image segmentation. In Proceedings of the IEEE International Conference on Acoustics, Speech, and Signal Processing, Barcelona, Spain, 4–8 May 2020; pp. 1055–1059. [Google Scholar]
  38. Pei, H.Y.; Yang, D.; Liu, G.R.; Lu, T. MPS-Net: Multi-point supervised network for CT image segmentation of COVID-19. IEEE Access 2021, 9, 47144–47153. [Google Scholar] [CrossRef]
  39. Wu, Y.X.; He, K.M. Group normalization. In Proceedings of the 15th European Conference on Computer Vision, Munich, Germany, 8–14 September 2018; pp. 3–19. [Google Scholar]
  40. Ma, J.; Ge, C.; Wang, Y.; An, X.; Gao, J.; Yu, Z. COVID-19 CT Lung and Infection Segmentation Dataset. 2020. Available online: https://doi.org/10.5281/zenodo.3757476 (accessed on 20 April 2020).
  41. COVID-19 CT Segmentation Dataset. Available online: https://medicalsegmentation.com/covid19/ (accessed on 11 April 2020).
  42. Ma, J.; Chen, J.; Ng, M. Loss odyssey in medical image segmentation. Med. Image Anal. 2021, 71, 102035. [Google Scholar] [CrossRef]
  43. Yeung, M.; Sala, E.; Schönlieb, C.B.; Rundo, L. Unified focal loss: Generalising dice and cross entropy-based losses to handle class imbalanced medical image segmentation. Comput. Med. Imaging Graph. 2021, 95, 102026. [Google Scholar] [CrossRef]
  44. Zhao, H.S.; Shi, J.P.; Qi, X.J.; Wang, X.G.; Jia, J.Y. Pyramid scene parsing network. In Proceedings of the IEEE Conference on Computer Vision and Pattern Recognition, Honolulu, HI, USA, 21–26 July 2017; pp. 6230–6239. [Google Scholar]
  45. Alom, M.Z.; Yakopcic, C.; Taha, T.M.; Asari, V.K. Nuclei Segmentation with Recurrent Residual Convolutional Neural Networks based U-Net (R2U-Net). In Proceedings of the IEEE National Aerospace and Electronics Conference, Dayton, OH, USA, 23–26 July 2018; pp. 228–233. [Google Scholar]
  46. Gu, Z.W.; Cheng, J.; Fu, H.Z. CE-Net: Context Encoder Network for 2D Medical Image Segmentation. IEEE Trans. Med. Imaging 2019, 38, 2281–2292. [Google Scholar] [CrossRef] [PubMed] [Green Version]
Figure 1. Architecture of the proposed SD-UNet.
Electronics 11 00130 g001
Figure 2. Architecture of the squeeze-and-attention module.
Electronics 11 00130 g002
Figure 3. Architecture of the Dense ASPP module.
Electronics 11 00130 g003
Figure 4. Example of lung region segmentation from COVID-19 CT images.
Electronics 11 00130 g004
Figure 5. Segmentation results of different models for the COVID-19 binary-class lung infection dataset.
Electronics 11 00130 g005
Figure 6. Segmentation results of different models for the COVID-19 multi-class lung infection dataset, where the white and magenta parts indicate the GGO and consolidation, respectively.
Electronics 11 00130 g006
Figure 7. Confusion matrix of multi-class segmentation experiments.
Electronics 11 00130 g007
Table 1. Distribution of samples for segmentation.
SetTrainingValidationTestingTotal
Dataset-B (B1, B2)13761963911963
Dataset-M2583877373
Table 2. Quantitative analysis of different segmentation methods for COVID-19 using Dataset-B.
NetworkSenDSCAccSpeJS
PSPNet [44]0.81920.80840.96150.97720.6784
R2U-Net [45]0.86800.82890.95760.96970.7079
CE-Net [46]0.88920.83990.97700.98120.7291
U-Net [24]0.86240.85440.98790.99420.7508
DeepLab v3+ [36]0.87670.85710.98770.99310.7546
UNet++ [25]0.90100.86020.98700.99150.7592
Our SD-UNet0.89880.86960.99060.99320.7702
Table 3. Quantitative analysis of different segmentation methods for COVID-19 using Dataset-M.
NetworkClassSenDSCAccSpeJS
U-Net [24]Avg0.61440.56330.97840.98810.4573
GGO0.45570.38890.97800.98420.2975
Con0.77310.73770.97880.99200.6171
Attention U-Net [32]Avg0.60410.57010.98130.98970.4580
GGO0.51450.40180.98020.98460.3008
Con0.69350.73840.98240.99480.6152
UNet++ [25]Avg0.63930.58690.98040.98950.4734
GGO0.53910.41440.97970.98530.3124
Con0.73950.75940.98110.99370.6344
Our SD-UNetAvg0.61690.59360.98210.99070.4788
GGO0.46130.42250.98230.99020.3146
Con0.77250.76470.98190.99120.6430
Table 4. Ablation Study on the COVID-19 binary-class lung infection dataset.
NetworkSenDSCAccSpeJS
UNet0.88520.85610.97950.99230.7508
UNet + Dense ASPP0.90470.86160.98780.99150.7597
UNet + SA0.87590.86670.98690.99360.7668
Our SD-UNet0.89880.86960.99060.99320.7702
Table 5. Quantitative comparison of the SA and SE modules for COVID-19 binary-class lung infection dataset.
NetworkSenDSCAccSpeJS
UNet0.88520.85610.97950.99230.7508
UNet + SE0.86230.86260.98740.99150.7626
UNet + SA0.87590.86670.98690.99360.7668
Table 6. The Sen and DSC of 5-fold cross-validation results of different models for the COVID-19 binary-class lung infection dataset.
NetworkSenDSC
PSPNet0.8022 ± 0.01940.7920 ± 0.0293
R2U-Net0.8430 ± 0.02630.8070 ± 0.0314
CE-Net0.8674 ± 0.20800.8149 ± 0.0257
U-Net0.8452 ± 0.01620.8328 ± 0.0140
DeepLab v3+0.8624 ± 0.01730.8463 ± 0.0159
UNet++0.8721 ± 0.02330.8485 ± 0.0189
Our SD-UNet0.8826 ± 0.01590.8588 ± 0.0126
Table 7. The Acc, Spe and JS of 5-fold cross-validation results of different models for the COVID-19 binary-class lung infection dataset.
NetworkAccSpeJS
PSPNet0.9310 ± 0.04210.9251 ± 0.05150.6417 ± 0.0340
R2U-Net0.9258 ± 0.04650.9187 ± 0.06110.6703 ± 0.0315
CE-Net0.9326 ± 0.0523 0.9419 ± 0.04370.6933 ± 0.0370
U-Net0.9382 ± 0.03730.9720 ± 0.02350.7216 ± 0.0272
DeepLab v3+0.9557 ± 0.03600.9514 ± 0.03820.7344 ± 0.0254
UNet++0.9426 ± 0.04840.9527 ± 0.04290.7449 ± 0.0238
Our SD-UNet0.9606 ± 0.03280.9642 ± 0.03300.7602 ± 0.0150
Table 8. The Sen and DSC of 5-fold cross-validation results of different models for the COVID-19 multi-class lung infection dataset.
NetworkClassSenDSC
U-NetAvg0.5635 ± 0.09470.5278 ± 0.1028
GGO0.3944 ± 0.05580.3660 ± 0.0767
Con0.7326 ± 0.07720.6896 ± 0.0958
Attention U-NetAvg0.5623 ± 0.07280.5344 ± 0.0799
GGO0.4853 ± 0.06360.3796 ± 0.0520
Con0.6393 ± 0.05740.6892 ± 0.0808
UNet++Avg0.5894 ± 0.08690.5494 ± 0.0898
GGO0.4971 ± 0.04260.4000 ± 0.0568
Con0.6817 ± 0.06970.6988 ± 0.0657
Our SD-UNetAvg0.5798 ± 0.07360.5618 ± 0.0781
GGO0.4441 ± 0.05920.4075 ± 0.0545
Con0.7155 ± 0.05730.7161 ± 0.0626
Table 9. The Acc, Spe, and JS of the 5-fold cross-validation results of different models for the COVID-19 multi-class lung infection dataset.
NetworkClassAccSpeJS
U-NetAvg0.9207 ± 0.06650.9218 ± 0.07220.4041 ± 0.0783
GGO0.9258 ± 0.05390.9156 ± 0.07160.2563 ± 0.0598
Con0.9156 ± 0.06480.9280 ± 0.07450.5519 ± 0.0726
Attention U-NetAvg0.9256 ± 0.06200.9273 ± 0.06810.4132 ± 0.0751
GGO0.9141 ± 0.06250.9221 ± 0.06370.2778 ± 0.0432
Con0.9371 ± 0.05090.9325 ± 0.05400.5486 ± 0.0635
UNet++Avg0.9323 ± 0.05610.9292 ± 0.06230.4341 ± 0.0476
GGO0.9316 ± 0.05140.9270 ± 0.05400.2886 ± 0.0385
Con0.9330 ± 0.05500.9314 ± 0.06340.5796 ± 0.0587
Our SD-UNetAvg0.9403 ± 0.05010.9354 ± 0.05850.4506 ± 0.0394
GGO0.9511 ± 0.04270.9384 ± 0.05370.2993 ± 0.0279
Con0.9395 ± 0.05160.9324 ± 0.06090.6019 ± 0.0538
Publisher’s Note: MDPI stays neutral with regard to jurisdictional claims in published maps and institutional affiliations.

