Article

Modeling Small UAV Micro-Doppler Signature Using Millimeter-Wave FMCW Radar

1
Department of Information Engineering, University of Florence, via Santa Marta, 3, 50139 Firenze, Italy
2
Department of Information Engineering, University of Pisa, Via G. Caruso, 16, 56122 Pisa, Italy
*
Author to whom correspondence should be addressed.
Electronics 2021, 10(6), 747; https://doi.org/10.3390/electronics10060747
Submission received: 3 March 2021 / Revised: 15 March 2021 / Accepted: 17 March 2021 / Published: 22 March 2021

Abstract

:
With the increase in small unmanned aerial vehicle (UAV) applications in several technology areas, detection and small UAVs classification have become of interest. To cope with small radar cross-sections (RCSs), slow-flying speeds, and low flying altitudes, the micro-Doppler signature provides some of the most distinctive information to identify and classify targets in many radar systems. In this paper, we introduce an effective model for the micro-Doppler effect that is suitable for frequency-modulated continuous-wave (FMCW) radar applications, and exploit it to investigate UAV signatures. The latter depends on the number of UAV motors, which are considered vibrational sources, and their rotation speed. To demonstrate the reliability of the proposed model, it is used to build simulated FMCW radar images, which are compared with experimental data acquired by a 77 GHz FMCW multiple-input multiple-output (MIMO) cost-effective automotive radar platform. The experimental results confirm the model’s ability to estimate the class of the UAV, namely its number of motors, in different operative scenarios. In addition, the experimental results show that the motors rotation speed does not imprint a significant signature on the classification of the UAV; thus, the estimation of the number of motors represents the only viable parameter for small UAV classification using the micro-Doppler effect.

1. Introduction

Over the past decade, the use of unmanned aerial vehicles (UAVs) has grown dramatically in a variety of applications such as surveillance [1], air traffic management [2], and civil and commercial demands [3], because working with them provides new opportunities and enables applications not possible with conventional aircraft. Because of their flexibility, UAVs are applied in biomedical applications, for example, in conjunction with brain-controlled interfaces [4]. UAVs can overcome the need for supervising personnel in extended scenarios like massive farming, monitoring of critical infrastructure, and logistic services in remote areas [3,5], helping to meet the need for reliable surveillance in crowded or dangerous sites. However, UAVs are occasionally involved in illegal activities. They pose a serious threat to public safety, flight safety, and the protection of sensitive areas [6]. Consequently, the detection and classification of UAVs is needed; However, due to their small size, slow flying speeds, and low flying altitudes, detecting and classifying them are challenging tasks requiring improved resolution radar imaging [7].
In the literature, several solutions for addressing the task of UAV target classification and localization have been presented, but the classifying is always achieved by applying image recognition techniques. In Reference [8], precise UAV position detection was accomplished by applying an advanced image recognition methodology, which recognizes the UAV target class through its main features. The achieved detection rate and positioning accuracy result were quite good but systems based on image recognition rely on good quality images captured by cameras; thus, detection performance is dramatically reduced under adverse environmental conditions. Another drawback of image-based methods is the reduction in target image resolution with the increase in UAV distance from cameras. To increase UAV detection reliability, in [9], algorithms-based template matching and morphological filtering were adopted to improve the ability to recognize UAV within a wide range of relative distances. In Reference [10], acoustic and optical detectors were combined to improve UAV detection and tracking through active imaging.
When an object with a low radar cross-section (RCS), such as many UAVs, is moving, it may produce a shift in the expected echo signal as well as a frequency modulation on the scattered radar signal, which creates the sidebands of the target Doppler frequency shift. This effect is named the micro-Doppler signature [11], which offers a way to recognize and classify mini-UAVs [12,13]. The micro-Doppler effect is adopted here to improve the classification of UAVs using remote sensing technology such as radars in surveillance systems because they are capable of determining dynamic properties secondary effects of the target, thus offering insight into target signatures. In addition to this analysis, micro-Doppler helps improve UAV recognition in adverse weather conditions [11,14].
Continuous-wave (CW) radar Doppler is the most popular technique used in radar systems for obtaining targets information, and plays an important role in achieving high classification accuracy [15,16,17,18]. However, its use is limited in surveillance systems since the CW radar cannot determine the target range. The frequency-modulated Doppler CW (FMDCW) radar [19] is a type of CW Doppler radar that is an alternative to the modified Doppler CW radar for surveillance systems.
At the radar signal processing level, a UAV identification and classification system based on a FMCW radar micro-Doppler signature analysis can be accomplished in different ways; however, machine learning techniques have gained attention due to their ability to extract features of of interest with high recognition ratios and low computational time [20,21,22,23]. Since machine learning is related to learning through data, it has become critical to the quality and quantity of data used in the training and testing of classification models with low bias and variance. The data should cover a wide range of cases that arise or resemble real conditions. Due to the diminishing bias in the learned experiment while reducing the variance (avoiding over-fitting), the model should learn from a vast data set to obtain sufficient experience and increase its generalization. Regrettably, there are no available data sets that are acceptable sources for UAVs classification. In most cases, researchers generated their data set through simulations and experiments combined with noise and other impairments to imitate a real environment [24]. Hence, we addressed this drawback of the methods that require a large training dataset to train systems aimed at identifying different classes of interest.
This paper introduces a novel approach to compact modeling of the micro-Doppler signature of small UAVs, which correctly generates signals for different kinds of UAV classes according to different scenarios, namely the number of motors and their rotating speed. The model can be potentially adapted for data generation to reduce the deep learning training time window by exploiting pre-deterministic simulations of realistic scenarios.
Finally, in this study, the reliability of the proposed model was examined by comparing the simulated micro-Doppler UAV signature with experimental data obtained in an anechoic chamber using a commercial millimeter-wave radar platform and prototype UAVs. The data were then compared using a confusion matrix (CM) that describes the analytical compact model fit with the measured data of a given class of UAVs. In addition, the CM provides the accuracy of the correct estimation, demonstrating the significant resemblance to different motor classes without having any considerable effect on different speed classes.

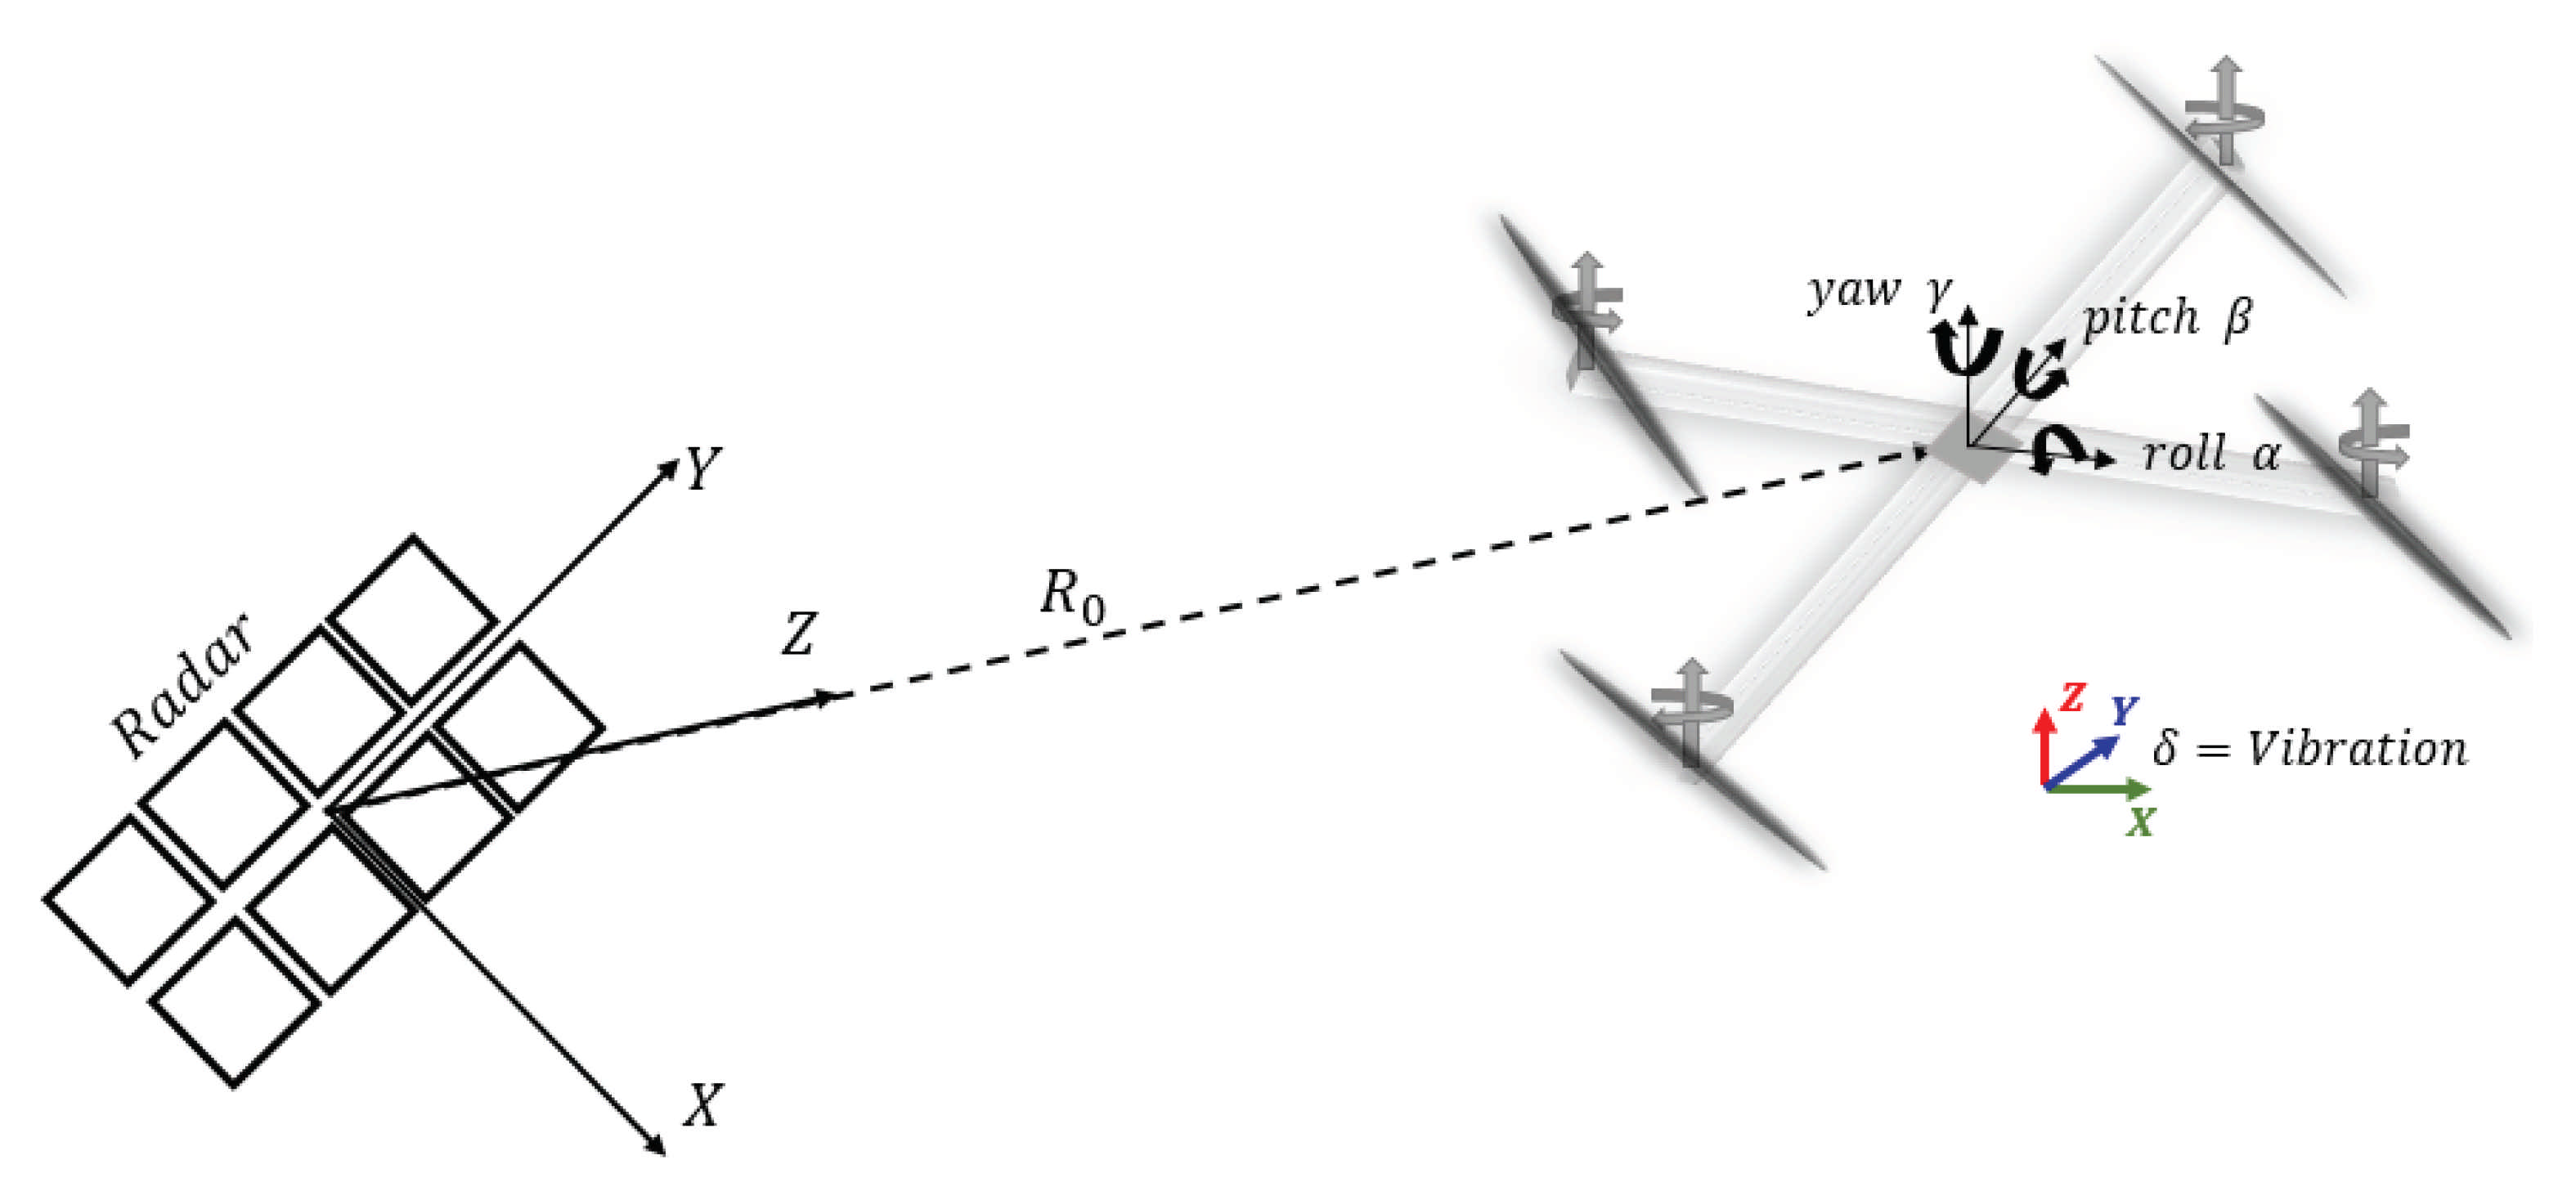
2. Compact Model for Flying UAVs

In this section, we review the generic modeling of the micro-Doppler effect and introduce its contribution to the scattered FMCW signal.

2.1. FMCW Radar and Micro-Doppler Generality

According to the general theory of an FMCW radar, the transmitted signal is
s T X t = e j 2 π f R F + μ t t
where μ represents the linear chirp rate of the transmitted signal and f R F is the radar carrier frequency. Assuming the flight time τ = 2 R / c 0 , with R being the range and c the light speed, the received signal is
s R X t = Γ · e j 2 π f R F + μ t τ t τ ,
where Γ considers the radar equation Γ = s T X 2 G T X G R X λ 2 σ a v / 4 π 3 R 4 , where σ a v is the UAV’s average RCS, G R X , T X is the receiving and transmitting antenna gain, and R is the UAV range. The receiver down-converter is capable of retrieving the IF signal by the coherent demodulation
s I F t = s T X ( t ) · conj s R X ( t ) = Γ · cos 2 π · 2 μ τ · t + 2 π f R F τ μ τ 2 .
by low-pass filtering in (3), we have the relation between the range and IF response
f I F = 2 μ τ = 2 μ 2 R t c 0 = 4 μ c 0 R t .
The target trajectory translates into a range variation, which in turn determines the long-term frequency variation in the IF signal according to (4), which is normally represented by a 2D spectrogram [25].
When a radar target along with its translation motion also undergoes vibration or rotation, then we observe a Doppler frequency shift generated by its vibration or rotation [11]. This frequency shift is time-varying and can be characterized as a periodic time-varying modulation onto the scattered signal. As a result, micro-motions yield new features on the UAV’s signature that are distinct from those in the absence of micromotions; since they depend upon the UAV’s physical and mechanic structure, the characterization of the micro-Doppler effect provides valuable information for UAV classification.
Assuming pure periodic vibration or rotation, micromotion dynamics generate sideband Doppler frequency shifts about the scattered signal. The modulation contains spectral components that depend on the vibration or rotation rate, the vibration amplitude, and the angle between the direction of vibration and the direction of the incident wave. The correct extraction of this information needs coherent demodulation to extract useful information about the micro-Doppler signature. For small UAVs that exhibit small RCSs, say of the order of 10 2 m 2 , the micro-Doppler provides effective information for UAV classification [26]. For a vibration rate in angular frequency, ω d , and a maximal displacement of the vibration, A d , the maximum Doppler frequency displacement is determined by
max f d = ( 2 / λ ) ω d A d .
As a consequence, for very short wavelengths, even with very low vibration rate any microvibration can cause observable frequency modulation changes. This motivated our investigation into small UAV micro-Doppler signatures at the millimeter-wave level.

2.2. Micro-Doppler Vibrational Spectral Model of a Flying UAV

We considered the schematic of a four-motor UAV presented in Figure 1, where the coordinate reference is shown with respect to a radar system. We assumed that the UAV has four motors, each of them composed of horizontally oriented propellers with two diagonal rotor pairs rotating reverse to their plastic blade pair. The degrees of freedom of the UAV’s vibration are the lateral and longitudinal translation in the vertical direction z-axis and horizontal plane x-y-axis, respectively. The rotation about these axes corresponds to yaw, roll, and pitch degrees of freedom.
Let us assume the vibrational effects on the translating UAV barycenter. A general representation of target range distance including its mechanical vibration is
R t = R 0 + δ t
where δ t indicates the vibration about the range R 0 , which is assumed by the UAV barycenter. The range distance R t results in a frequency-modulated IF signal. The model of the UAV translation can be characterized by considering the vibration about three dimensions of the roll angle, α t , the pitch angle, β t , and the yaw angle, γ t , as shown in Figure 1. These vibrational deviations are exhibited by each motor with the same mathematical representation, which is, in general terms, represented by [27]
δ t = x 0 · cos ( β t t ) · cos ( γ t t ) + y 0 · sin ( γ t t ) · cos ( α t t ) + z 0 · sin ( β t t ) · cos ( α t t )
where x 0 , y 0 , and z 0 denote the UAV barycenter position with respect to the radar and the trigonometric terms corresponding to the degrees of freedom of vibration. Equation (7) leads to the generation of 6 signal components, which consist of the relation between each two vibration dimensions. They are located in the spectra about the carrier and correspond to:
w β w γ ; w β + w γ ; w γ w α ; w γ + w α ; w β w α ; w β + w α .
To characterize the UAV micro-Doppler signature along with its range and azimuth and elevation angles, we assumed that the UAV is able to maintain a certain position and orientation in space with respect to the radar. Let us assume that the UAV stands along the z-axis of the reference system shown in Figure 1; this assumption is easily verified when the radar unit points to the UAV. Thus, under this assumption, the UAV vibration around the vertical direction does not affect the range information. As a result, the yaw angle displacement is set to zero on average [27]. Hence, by neglecting the contribution of yaw angle displacement signal, only 4 signals remain: w β , w α , w β w α , w β + w α . Thus, the vibration term related to each jth motor can be written in the compact form
δ j t = i = 1 4 A i j cos ω i j t + ϕ i j
where w 1 = w β , w 2 = w α , w 3 = w β + w α , and w 4 = w β w α for each jth motor. From (9), the vibration of a single mechanical point of scattering results from the combination of four un-correlated components of vibrations across the lateral axis. In most general cases, the vibration source is represented by the rotor propeller activated by an electrical motor. In the most general case of a multi-rotor UAV, we consider the latter as an ensemble of different vibrating objects (or rather, the different motors), each jth motor providing its own back-scattering signal generated in its range equal to
R j ( t ) = R 0 + i = 1 4 A i j cos ω i j t + ϕ i j
The (10) assumes that the UAV is small and that all the motors can be considered effectively collapsed in the barycentric position, which is in range R 0 . Finally, including (10) into (3) and considering the linear superposition of the back-scattering signals produced by different motors, for the FMCW radar case, we have the most general case of the IF signal
s I F t = j = 1 N Γ j cos 2 π · 4 μ c 0 R 0 + i = 1 4 A j i cos ω j i t + ϕ j i · t .
In (11), the parameters that characterize the micro-Doppler signature are 13 × N , where N corresponds to the number of vibration motors and the constant 13 derives from the amplitude A j i , the frequency ω i j / 2 π , and the phase ϕ j i , with i = 1 to 4, plus the parameter Γ j , with the latter taking into account the radar equations as already defined in (2).
The model described by (11) permits the generation of different UAV signatures classes with respect to the several morphological and cinematic parameters. These are the number of motorsr their rotation speed, and the UAV trajectory and translation speed. Observing that the latter two of the list are typical objectives of radar target tracking, the number of motors and their rotating speed can be effectively estimated only by the analysis of the micro-Doppler effect. Thus, upon the acquisition of the radar signal, it would be possible to exploit a model-fitting procedure, and thus determine the class of the observed UAV in terms of the number of motors N, and their vibrational parameters, ω i j . amount of simulated data, which can provide an extensive measurement database suitable for UAV classification applications.

3. Experimental Validation of Micro-Doppler Model for Multi-Motor UAV

In this section, we provide an extensive characterization of the UAV prototype by considering a commercial radar platform operating in the millimeter-wave range. The data were acquired in an anechoic chamber with the UAV installed on a mount, which, while keeping it in a suitable position, does not inhibit the natural vibration of its motors and structure.

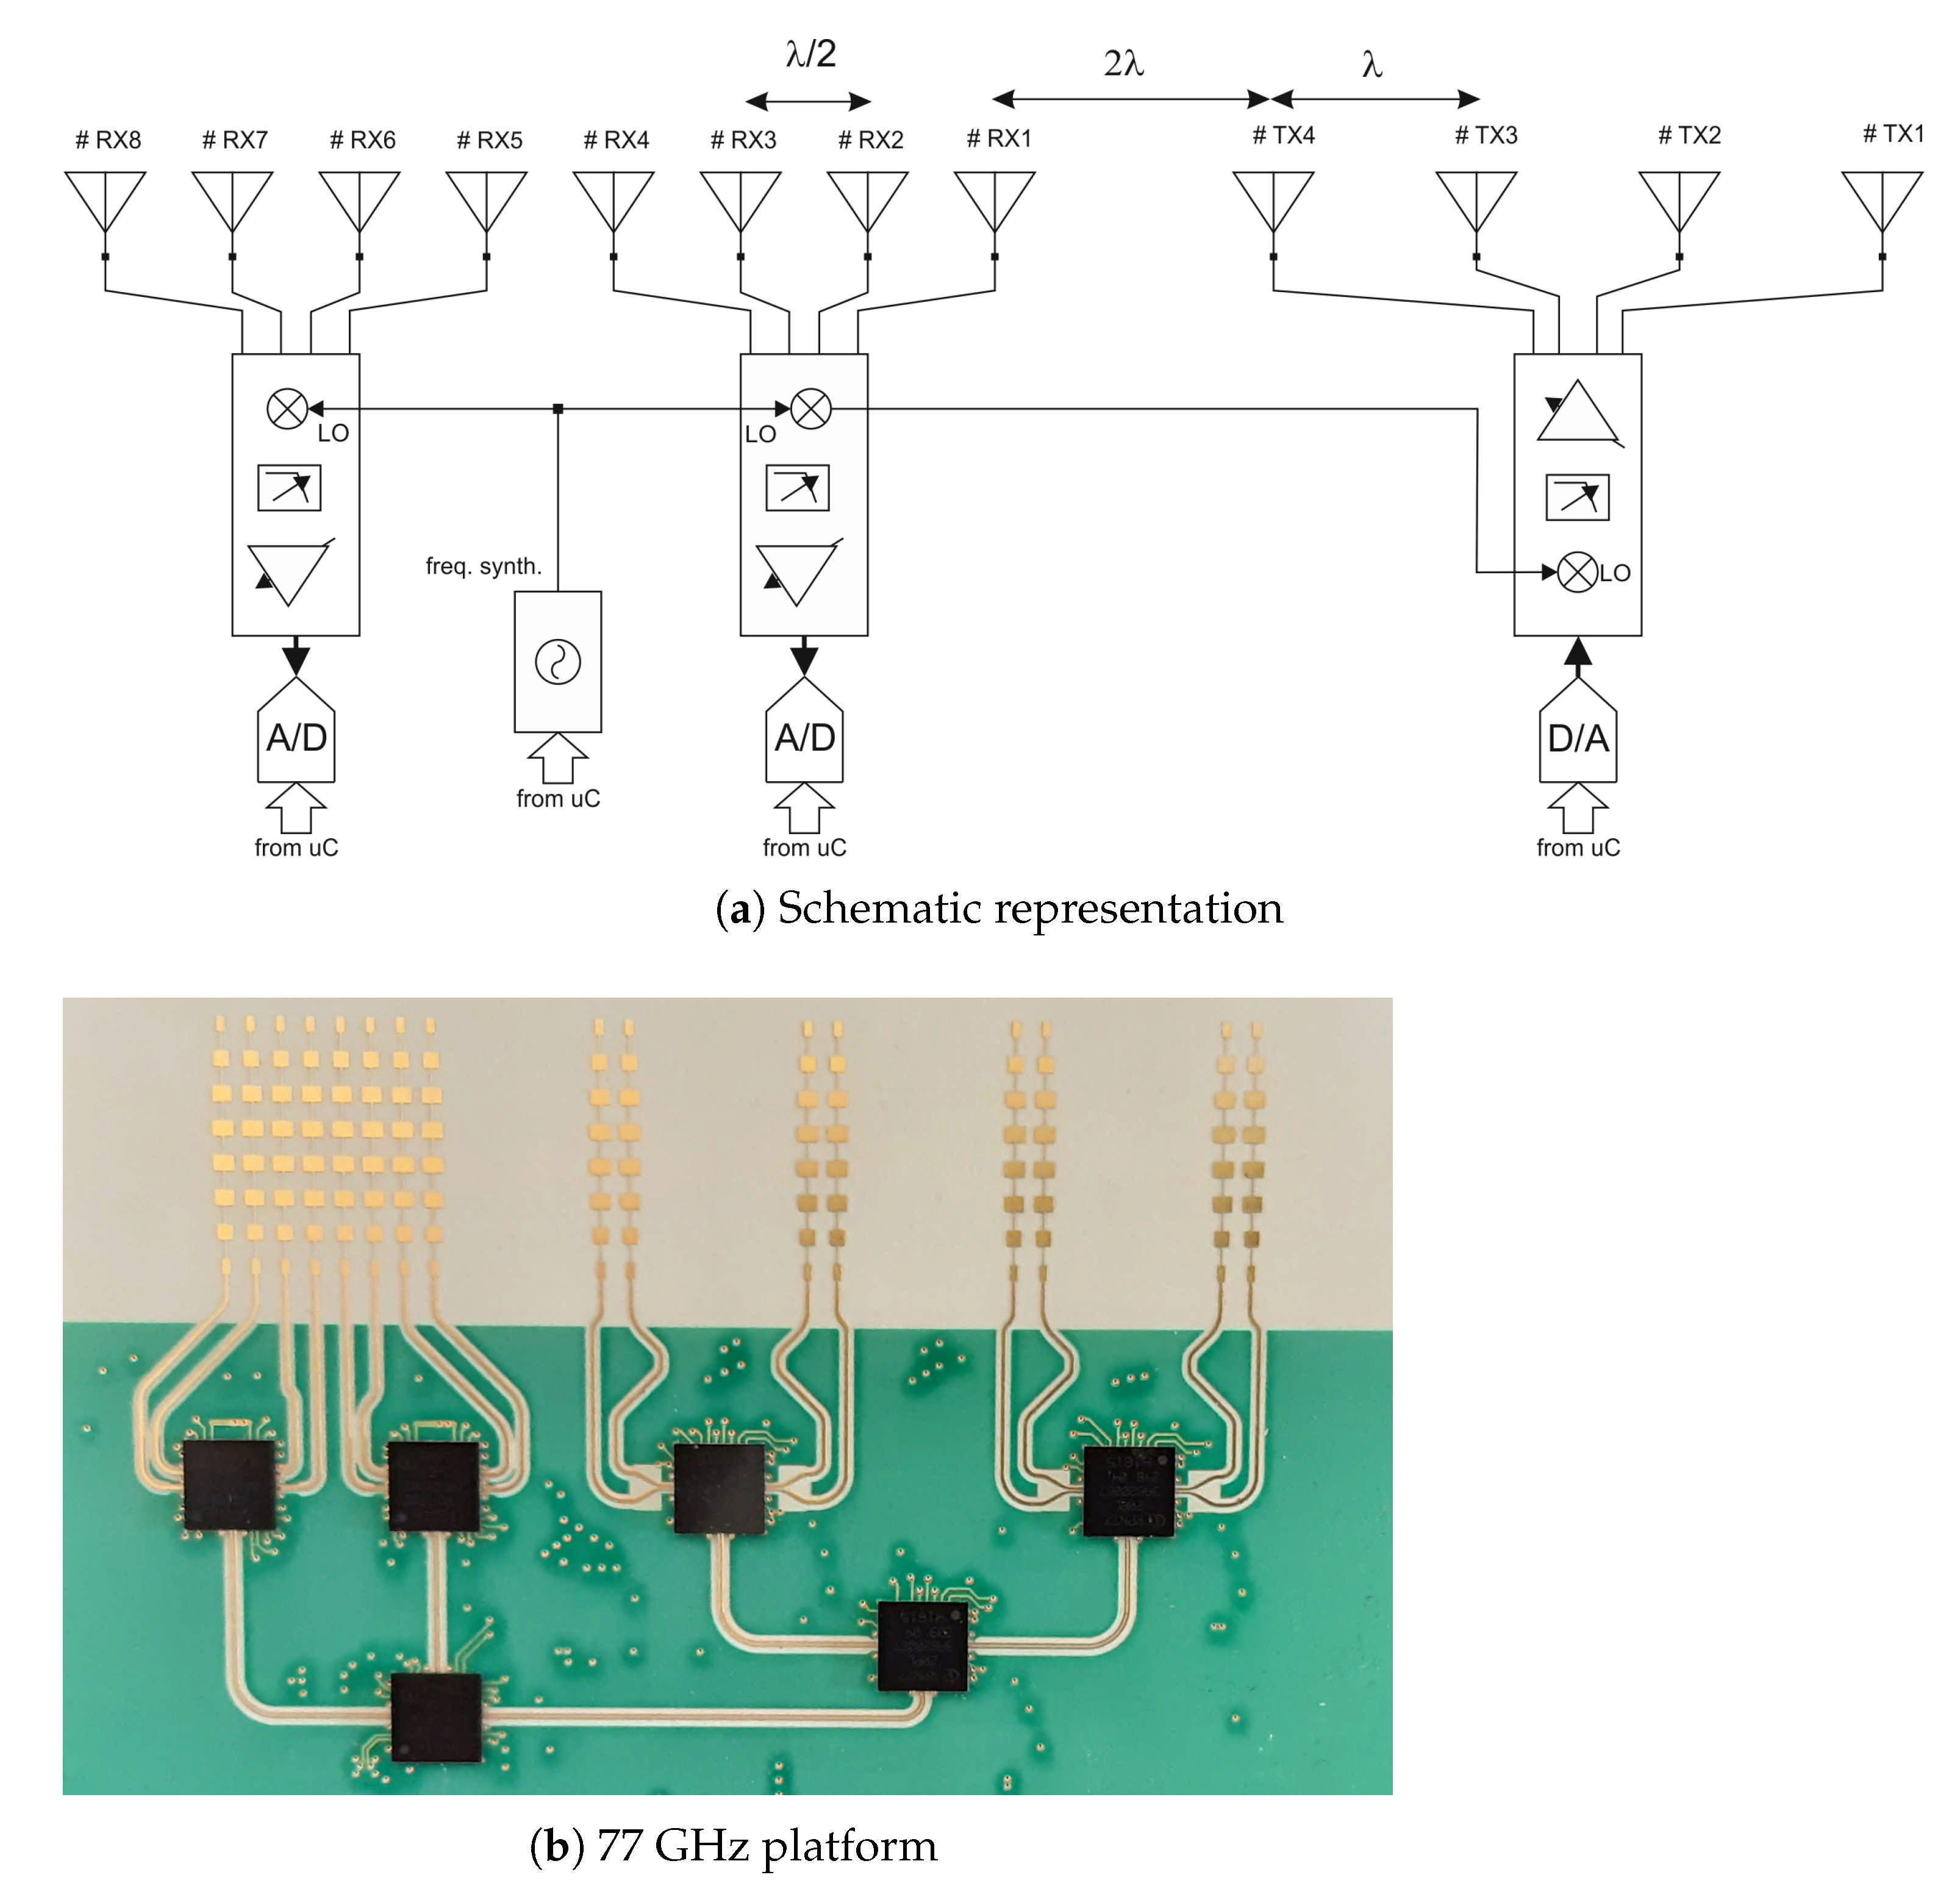
3.1. Experimental FMCW Radar Measurement Set-Up

The radar platform adopted for the experimental validation of the model described by (11) operates in the millimeter-wave range and adopts the multi-input multi-output antenna configuration [25,28].
The schematic of the radar front-end, which exploits eight receivers ( R X ) and four transmitter ( T X ) antennas, is provided in Figure 2a; Figure 2b shows a picture of the actual device. This radar platform adopted in the experiments is based on a commercial chip-set capable of operating with a carrier frequency of 77 GHz, and provides MIMO radar processing for FMCW waveforms with a bandwidth B of 2 GHz and chirp duration T ramp of 2.6 × 10 4 s. This carrier frequency was selected due to the potential imaging-enabling capability due to the short wavelength, and the availability of commercial platforms normally adopted for transport and traffic telematics and radio-determination applications in vehicular communications (see, for instance, the European Electronic Communications Committee). The radar platform allows a fast connection to a remote control unit through which the base-band RX channel signals can by acquired coherently, while the post-processing of the radar image was carried out using a MATLAB code. In the following experiment, the UAV under test was placed on a floor in front of the radar front-end, as shown in Figure 3a, at a distance of 3 m for single motor UAV and 3.40 m for the quadricopter due to the different mechanical structures of the mounting racks. In this set-up, the radar front-end was held on a holder base upside in a small controlled anechoic environment with absorbing panels spread throughout the floor and the walls, as shown in Figure 3a. The anechoic chamber had a square longitudinal section with sides 1.50 m in length and an overall height of 5 m.
Different measurements campaign were performed, swapping the positions between the radar platform and UAV to obtain radar images for both the upper and lower side of each drone target. Due to the blades’ profile and mechanical structure asymmetry with respect to the longitudinal plane, radar fingerprints were different for each observation side, so constructing a complete fingerprints database for this must be considered.
The UAV prototype features an H-type frame of 550 mm and was built by a conventional 3D printer; its picture is shown in Figure 3b. It adopts 950 KV (volt/rpm) brushless motors connected to 10 inch carbon fiber blades that permit a maximum thrust of 3.8 kgN or a maximum rotational speed of 14,000 rpm per motor. The motors are driven by 20 A peak current and the motor drivers are regulated by an F4-ARM controller, while the energy storage is a 11.1. V 3-cell LiPo battery with a capacity of 5500 mAh. The UAV prototype total weight is 1.7 kg.
Along with the above-described UAV, the following tests considered the case of only one motor in an effort to simulate one example of the class of single-motor UAVs. This class could be representative of either tailed drones or mono-copters; however, the characterizations did not consider either the prospective UAV wings or its fuselage. The UAV model consists of the brusheless motor and a blade adopted in the quad-copter UAV, along with the rotation speed controller.
Before proceeding further, we examined the typical radar image of a small UAV. An example of a radar image is shown in Figure 4, where the quad-copter UAV is observed toward the z-axis of the system reference at a distance of 3 m; the images were produced using moving target indicator (MTI) radar image processing suitable for removing the clutter. Since the UAV has extremely low RCS, it results to be very hard to detect by the radar system when its motors were set off. Conversely, when the UAV motors were on, the micro-Doppler signature permitted the distinction of the UAV from the clutter. Figure 4a,b shows radar images for both cases in an actual measurement scenario. The radar image in Figure 4a was acquired with drone motors switched off and without applying the MTI algorithm; otherwise, the drone would have been totally removed from the image by MTI averaging. Figure 4b was achieved by applying the MTI algorithm with an averaging window of 10 frames keeping the thrust of the motors at the maximum level.

3.2. Micro-Doppler Model Validation

In the following, we examine the accuracy of the proposed model by comparing the simulated and experimental data using the experimental set-up described in Section 3.1.
Starting from the preliminary consideration in the previous section, the process for assessing the reliableness of the model (11) was applied in two different scenarios: the quad-copter UAV and the single-motor UAV model. The latter was considered with the single motor working at its highest rotation speed, and in a second state with the rotation speed reduced to half. Similarly, we used the second set-up for the quad-copter UAV. Afterward, the obtained measurements were subdivided into two different classes corresponding to the number of motors and to the different UAV blades’ rotating speeds. A set of measurements consisted of the acquisition of a suitable number of radar image frames, and by considering the corresponding detected base-band signal spectrum, an optimization genetic algorithm (GA) was applied to extract the best coefficients of the compact micro-Doppler model (11).
Figure 5 demonstrates a comparison between the power density spectrum associated with the two different UAV classes.
Figure 5a,b presents the best-fitting model of the genetic algorithm for a single motor at maximum and half rotation speeds, whereas Figure 5c,d shows the fitting model of the genetic algorithm of a quad-copter with its motor’s rotation speed at half and maximum, respectxively.
Applying Equation (4) using actual FMCW radar parameters, the range estimation is
R 0 = c 0 4 μ f peak = c 0 · T ramp 4 B f peak 9.75 × 10 6 f peak
and considering f peak in Figure 5, the estimated distance between the radar and a single motor is 3.10 m, whereas for the quad-copter, it is 3.40 m, as expected given the scenario depicted above.
Table 1 provides the coefficients related to the required model parameters for different UAV classes in accordance with roll w α and pitch w β , and angle vibration scattered signals and their intermodulations, w β + w α and w β w α respectively.
Table 1 shows that despite good model approximation accuracy, there are slight dissimilarities in the amplitudes and frequencies of the vibration associated with each single-motor for the quad-copter, and the phase is a parameter that cannot be linked with some physical meaning. This is not surprising because the mechanical vibrations depend significantly on many factors, for instance, the mechanical tolerances of the several parts by which a UAV is composed, as well as the action of the control unit that induces different drivings on the motors to counterbalance oscillations during the flight. For this reason, the results are not relevant to the absolute value of each vibration parameter, but rather the relation between them and across the classes: this leads to the classification of the several classes of UAV. In particular, UAV classification results in terms of number of motors are significant, providing a meaningful definition of further actions with respect to the presence of the UAV in a given observation space. In this respect, the pitch and roll frequencies, ω β and ω α , respectively, combine in their sum and difference into the third and fourth vibrational parameters, thus confirming the accuracy of the model.

3.3. UAV Classification on the Basis of the Micro-Doppler Model

In the previous section, we introduced the validation of the Micro-Doppler compact model. In this section, we discuss the reliability of the proposed model to ensure that this model, although compatible with similar UAV-class measurements, does not show any significant similarity for different classes of measurements; hence, the confusion matrix (CM) was introduced. We considered several UAV classes with different numbers of motors, their nominal rotation speed, and their orientation with respect to the reference system. For each state, we acquired several radar images, corresponding to the label meas-i. For each measurement data set, the corresponding micro-Doppler model (11) was fit assuming both N = 1 and N = 4; this led to several estimated classes starting from the model fitting. Thus, simply stated, the correlation between the measurements and simulated radar images, the latter of which is generated by the optimized compact model, was calculated for each different class following (13)
C v = 1 fft SIM fft MEAS 6 ,
where C v is the correlation value evaluated in the frequency domain, the fft SIM refers to the simulated data of the model after fitting, and fft MEAS is the measurement data obtained from the FMCW radar platform. Note that before calculating the correlation value, the simulated data spectrum was aligned to the measurement spectrum with respect to its maximum peak to compensate for different scenario configurations. Given a measurement, each correlation value was normalized with respect to the sum of the entire set of correlation values for all the UAV states considered.
Table 2 shows the relative probability of matching between each measurement and a corresponding model class, and thus provides the cross-correlation between different UAV states. Notably, the values in each row are the probability of matching the measurement to a specified UAV state (or rather, the confidence rate), the sum of each row in Table 2 is equal to 100%. The highest probability value corresponds to the correct class, which produced the CM as a diagonal matrix.
To better understand the reporting format of Table 2, the first two column pairs consider the single-motor UAV located toward the z-axis direction with respect to the radar and rotating at two different speeds: nominally half and maximum speed. The two considered cases were the single motor parallel to the x-axis and the y-axis, which are the longitudinal and orthogonal views, respectively.
Similarly, the second two column pairs correspond to the quad-motor UAV aligned toward the z-axis and observed from the bottom and the top. The correlating data were obtained by comparing several measured data and the model outcomes by genetic algorithm (GA) fitting. From the analysis of Table 2, we can recognize its diagonal shape, highlighted by gray cells, with intensity proportional to the correlation between measurements and modelled data. We found that by using the modeled UAV signature, the classifier is capable of identifying the UAV class related to the number of motors, with a high degree of confidence. Conversely, the model does not show significant differences in confidence rates for different motor rotation speeds for the same UAV motor class.
Accordingly, Table 3 presents the confusion matrix compiled regardless of blade rotation speed. The table deals with the same data adopted to generate Table 2, but considering just the classification of the number of motors in all the mentioned scenarios. Regarding the data in Table 3, we expected to have a strong correlation with all various measurements of the same class (number of motors) for each class-related simulated radar image, while having a weak correlation with different class measurements. Therefore, we found that the model considers the number of motors as an orthogonal base for building a simulated UAV micro-Doppler signature.
In both Table 2 and Table 3 the background color for each cell is proportional to its value, to highlight how much the highest correlation values are spread only along matrices diagonals. Such value distribution points out the reliability of proposed model for drone type classification.

4. Conclusions

In this paper, a compact model for micro-Doppler signatures, dependent on the number of vibrational motors and their propellers’ rotation rates, was proposed. To ensure the reliability of the proposed model, the latter was used to build some simulated FMCW radar images, which were compared with experimental measurements using a 77-GHz FMCW radar platform to provide a large measurement database suitable for UAV classification applications.
By observing the confusion matrices,the proposed model showed a lack of significance regarding motor speeds but it overcomes this limitation with strong confidence rates for UAV class identification, i.e., number of UAV motors. Despite this, such weakness can also considered a point of strength because a classifier must consider only one signature for each UAV class, thus reducing the required amount of memory and increasing the reliability of class detection regardless of motor speed.
The method actually lacks an effective depiction of the relationships between physical scenario parameters, such as real drone motor rotational speeds and fitted model parameters. The physical significance of model was proven because the fitted component frequency ratios fulfill the conditions imposed by the well-proven vibrational model given in [27]. Through this further investigation, measuring real UAV functional parameters could lead to identifying meaningful mathematical relations. Such relations could be used to build large fingerprint databases deterministically, removing the need to fit models on sample measurements.
Following this, the proposed model can provide the basis for investigations into the effectiveness of such fingerprint models instead of needing massive measurements campaigns for building a complete training dataset for artificial intelligence (AI) or deep learning classification applications in UAVs. If such models are proven to be effective, we could consider them as a starting point for introducing a new kind of unsupervised training procedure for AI or deep learning.

Author Contributions

M.P., N.R., A.C. and G.C. initiated and discussed the research problem; M.P. performed experiments and analyzed the data; N.R. wrote the paper. All authors have read and agreed to the published version of the manuscript.

Funding

This work was partially founded by the National Italian Research Project, PRIN-2015 Prot. 2015CPC2MA, by the project ANDRAS under the grant of Regione Toscana—POR FSE 2014-2020, and by the Foundation Ente Cassa di Risparmio di Firenz under the grant 2017-0941.

Data Availability Statement

Data available on request.

Conflicts of Interest

The authors declare no conflict of interest.

References

  1. Kim, H.; Mokdad, L.; Ben-Othman, J. Designing UAV surveillance frameworks for smart city and extensive ocean with differential perspectives. IEEE Commun. Mag. 2018, 56, 98–104. [Google Scholar] [CrossRef]
  2. Elloumi, M.; Dhaou, R.; Escrig, B.; Idoudi, H.; Saidane, L.A. Monitoring road traffic with a UAV-based system. In Proceedings of the 2018 IEEE Wireless Communications and Networking Conference (WCNC), Barcelona, Spain, 15–18 April 2018; pp. 1–6. [Google Scholar]
  3. González-Jorge, H.; Martínez-Sánchez, J.; Bueno, M.; Arias, P. Unmanned aerial systems for civil applications: A review. Drones 2017, 1, 2. [Google Scholar] [CrossRef]
  4. Paszkiel, S.; Sikora, M. The Use of Brain-Computer Interface to Control Unmanned Aerial Vehicle. In Automation 2019; Szewczyk, R., Zieliński, C., Kaliczyńska, M., Eds.; Springer International Publishing: Cham, Switzerland, 2020; pp. 583–598. [Google Scholar]
  5. Shin, J.I.; Seo, W.W.; Kim, T.; Park, J.; Woo, C.S. Using UAV multispectral images for classification of forest burn severity—A case study of the 2019 Gangneung forest fire. Forests 2019, 10, 1025. [Google Scholar] [CrossRef] [Green Version]
  6. Yaacoub, J.P.; Salman, O. Security Analysis of Drones Systems: Attacks, Limitations, and Recommendations. Internet Things 2020, 11, 100218. [Google Scholar] [CrossRef]
  7. Rojhani, N.; Passafiume, M.; Lucarelli, M.; Collodi, G.; Cidronali, A. Exploiting Compressive Sensing Basis Selection to Improve 2 × 2 MIMO Radar Image. In Proceedings of the 2020 IEEE MTT-S International Conference on Microwaves for Intelligent Mobility (ICMIM), Linz, Austria, 23–23 November 2020. [Google Scholar] [CrossRef]
  8. Premachandra, C.; Ueda, D.; Kato, K. Speed-up automatic quadcopter position detection by sensing propeller rotation. IEEE Sens. J. 2018, 19, 2758–2766. [Google Scholar] [CrossRef]
  9. Opromolla, R.; Fasano, G.; Accardo, D. A Vision-Based Approach to UAV Detection and Tracking in Cooperative Applications. Sensors 2018, 18, 3391. [Google Scholar] [CrossRef] [PubMed] [Green Version]
  10. Christnacher, F.; Hengy, S.; Laurenzis, M.; Matwyschuk, A.; Naz, P.; Schertzer, S.; Schmitt, G. Optical and acoustical UAV detection. In Electro-Optical Remote Sensing X; International Society for Optics and Photonics: Bellingham, WA, USA, 2016; Volume 9988, p. 99880B. [Google Scholar]
  11. Chen, V.C.; Li, F.; Ho, S.S.; Wechsler, H. Micro-Doppler effect in radar: Phenomenon, model, and simulation study. IEEE Trans. Aerosp. Electron. Syst. 2006, 42, 2–21. [Google Scholar] [CrossRef]
  12. Zhao, F.; Liu, X.; Xu, Z.; Liu, Y.; Ai, X. Micro-Motion Feature Extraction of a Rotating Target Based on Interrupted Transmitting and Receiving Pulse Signal in an Anechoic Chamber. Electronics 2019, 8, 1028. [Google Scholar] [CrossRef] [Green Version]
  13. Thayaparan, T.; Abrol, S.; Riseborough, E. Micro-Doppler Radar Signatures for Intelligent Target Recognition; Technical Report; Defence Research and Development Canada: Ottawa, ON, Canada, 2004. [Google Scholar]
  14. Chen, V.C.; Ling, H. Time-Frequency Transforms for Radar Imaging and Signal Analysis; Artech House: Boston, MA, USA, 2002. [Google Scholar]
  15. Ye, L.; Lan, S.; Zhang, K.; Zhang, G. EM-Sign: A Non-Contact Recognition Method Based on 24 GHz Doppler Radar for Continuous Signs and Dialogues. Electronics 2020, 9, 1577. [Google Scholar] [CrossRef]
  16. Du, L.; Wang, B.; Li, Y.; Liu, H. Robust classification scheme for airplane targets with low resolution radar based on EMD-CLEAN feature extraction method. IEEE Sens. J. 2013, 13, 4648–4662. [Google Scholar] [CrossRef]
  17. Molchanov, P.; Egiazarian, K.; Astola, J.; Totsky, A.; Leshchenko, S.; Jarabo-Amores, M.P. Classification of aircraft using micro-Doppler bicoherence-based features. IEEE Trans. Aerosp. Electron. Syst. 2014, 50, 1455–1467. [Google Scholar] [CrossRef]
  18. Ma, X.; Oh, B.S.; Sun, L.; Toh, K.A.; Lin, Z. EMD-based Entropy Features for micro-Doppler mini-UAV classification. In Proceedings of the 2018 24th International Conference on Pattern Recognition (ICPR), Beijing, China, 20–24 August 2018; pp. 1295–1300. [Google Scholar]
  19. Oh, B.S.; Guo, X.; Lin, Z. A UAV classification system based on FMCW radar micro-Doppler signature analysis. Expert Syst. Appl. 2019, 132, 239–255. [Google Scholar] [CrossRef]
  20. Ezuma, M.; Erden, F.; Anjinappa, C.K.; Ozdemir, O.; Guvenc, I. Micro-UAV detection and classification from RF fingerprints using machine learning techniques. In Proceedings of the 2019 IEEE Aerospace Conference, Big Sky, MT, USA, 2–9 March 2019; pp. 1–13. [Google Scholar]
  21. Kim, B.K.; Kang, H.S.; Park, S.O. Drone classification using convolutional neural networks with merged Doppler images. IEEE Geosci. Remote. Sens. Lett. 2016, 14, 38–42. [Google Scholar] [CrossRef]
  22. Mendis, G.J.; Randeny, T.; Wei, J.; Madanayake, A. Deep learning based doppler radar for micro UAS detection and classification. In Proceedings of the MILCOM 2016-2016 IEEE Military Communications Conference, Baltimore, MD, USA, 1–3 November 2016; pp. 924–929. [Google Scholar]
  23. Park, D.; Lee, S.; Park, S.; Kwak, N. Radar-Spectrogram-Based UAV Classification Using Convolutional Neural Networks. Sensors 2021, 21, 210. [Google Scholar] [CrossRef] [PubMed]
  24. Taha, B.; Shoufan, A. Machine learning-based drone detection and classification: State-of-the-art in research. IEEE Access 2019, 7, 138669–138682. [Google Scholar] [CrossRef]
  25. Cidronali, A.; Passafiume, M.; Colantonio, P.; Collodi, G.; Florian, C.; Leuzzi, G.; Pirola, M.; Ramella, C.; Santarelli, A.; Traverso, P. System level analysis of millimetre-wave gan-based mimo radar for detection of micro unmanned aerial vehicles. In Proceedings of the 2019 PhotonIcs & Electromagnetics Research Symposium-Spring (PIERS-Spring), Rome, Italy, 17–20 June 2019; pp. 438–450. [Google Scholar]
  26. Molchanov, P.; Harmanny, R.I.; de Wit, J.J.; Egiazarian, K.; Astola, J. Classification of small UAVs and birds by micro-Doppler signatures. Int. J. Microw. Wirel. Technol. 2014, 6, 435–444. [Google Scholar] [CrossRef] [Green Version]
  27. Herrmann, R.; Moortgat-Pick, A.; Marx, S. Vibration Analysis of Structures using a Drone (UAV) based Mobile Sensing Platform. In Proceedings of the 5th International Conference on Smart Monitoring, Assessment and Rehabilitation of Civil Structures, Potsdam, Germany, 27–29 August 2019; pp. 1–8. [Google Scholar]
  28. Rojhani, N.; Passafiume, M.; Lucarelli, M.; Collodi, G.; Cidronali, A. Assessment of Compressive Sensing 2 × 2 MIMO Antenna Design for Millimeter-Wave Radar Image Enhancement. Electronics 2020, 9, 624. [Google Scholar] [CrossRef] [Green Version]
Figure 1. Geometry of the radar and rotor blades of an unmanned aerial vehicle (UAV) and their vibration angle components.12
Electronics 10 00747 g001
Figure 2. Architecture of the millimeter frequency-modulated continuous-wave (FMCW) multi-input multi-output (MIMO) radar adopted for the experimental validations.
Electronics 10 00747 g002
Figure 3. Experimental validation in the laboratory set-up using a quad-copter UAV.
Electronics 10 00747 g003
Figure 4. Radar image of the quad-copter UAV obtained with a moving target indicator (MTI) evidencing the micro-Doppler effect.
Electronics 10 00747 g004
Figure 5. The fitting paradigm of the genetic algorithm between the output FMCW radar measurements and the simulated FMCW radar measurements applying the UAV vibrational model for different UAV state classes.
Electronics 10 00747 g005aElectronics 10 00747 g005b
Table 1. Micro-Doppler model coefficients for different UAV state classes.
Class Γ j w β w α w β + w α w β w α
AmplitudeFrequencyPhaseAmplitudeFrequencyPhaseAmplitudeFrequencyPhaseAmplitudeFreqPhase
single motor
half speed
motor 10.044 2.05 × 10 3 2.69 × 10 3 1.04 2.08 × 10 3 3.98 × 10 3 0.81 6.68 × 10 4 6.94 × 10 3 1.90 2.35 × 10 3 1.19 × 10 3 0.04
quad motor
half speed
motor 10.001 2.20 × 10 3 3.32 × 10 3 1.00 2.08 × 10 3 3.79 × 10 3 1.04 2.41 × 10 3 7.07 × 10 3 1.24 2.92 × 10 3 4.67 × 10 2 0.20
motor 20.007 2.92 × 10 3 1.75 × 10 3 0.63 2.77 × 10 3 2.61 × 10 3 2.56 2.69 × 10 3 4.53 × 10 3 0.12 2.20 × 10 3 9.10 × 10 2 −2.01
motor 30.001 1.80 × 10 3 3.43 × 10 3 3.64 1.94 × 10 3 3.07 × 10 3 1.07 1.65 × 10 3 6.74 × 10 3 0.13 2.86 × 10 3 3.56 × 10 2 2.17
motor 40.004 2.09 × 10 3 5.44 × 10 3 0.16 2.07 × 10 3 2.17 × 10 3 1.60 1.75 × 10 3 7.51 × 10 3 1.77 2.77 × 10 3 3.08 × 10 3 1.59
quad motor
max speed
motor 10.001 2.24 × 10 3 1.77 × 10 3 1.70 2.19 × 10 3 4.84 × 10 3 0.51 1.64 × 10 3 6.58 × 10 3 3.88 3.60 × 10 3 3.06 × 10 3 0.01
motor 20.003 3.24 × 10 3 4.79 × 10 3 1.06 1.63 × 10 3 2.61 × 10 3 1.93 1.42 × 10 3 7.43 × 10 3 2.64 2.61 × 10 3 2.16 × 10 3 1.54
motor 30.001 1.67 × 10 3 2.82 × 10 3 1.52 3.02 × 10 3 5.06 × 10 3 3.35 1.31 × 10 3 7.86 × 10 3 4.31 4.76 × 10 3 2.24 × 10 3 1.70
motor 40.011 1.82 × 10 3 5.07 × 10 3 0.68 1.44 × 10 3 2.62 × 10 3 2.58 8.29 × 10 4 7.69 × 10 3 3.92 3.88 × 10 3 2.47 × 10 3 1.71
Table 2. Confusion matrix considering the different number of motors and blade rotation speeds. GA, genetic algorithm.
MeasuresReference Models (Best GA Fits for Class)
Single MotorSingle MotorQuad MotorQuad Motor
Orthogonal ViewLongitudinal viewBottom ViewTop View
Single Motor
Vertical View
ω half meas 1 66.383.1014.3714.080.960.960.110.05
ω half meas 2 22.291.3823.9349.201.031.930.150.08
ω half meas 3 6.3782.905.122.721.531.040.240.08
ω max 1.5295.691.060.600.780.270.070.02
Single Motor
Horizontal View
ω half meas 1 17.648.9841.5019.256.744.001.300.60
ω half meas 2 5.662.8722.0243.282.0823.270.620.20
ω half meas 3 6.911.3561.9927.431.081.080.120.05
ω half meas 4 19.854.4046.1723.342.712.560.640.32
ω max meas 1 17.307.2343.0423.464.093.580.900.41
ω max meas 2 5.812.0828.9449.101.5111.990.410.15
ω max meas 3 3.411.2142.6248.441.182.860.190.07
ω max meas 4 17.102.9538.3435.251.743.620.650.35
Quad Motor
Bottom View
ω half meas 1 7.342.636.096.9533.0243.710.110.14
ω half meas 2 6.662.174.143.8934.7548.210.080.11
ω half meas 3 3.712.7616.2911.2344.8221.030.080.08
ω half meas 4 6.271.844.563.1234.1549.970.040.06
ω half meas 5 13.655.213.813.2215.2558.720.060.08
ω max meas 1 4.571.9010.145.8246.0831.400.040.05
ω max meas 2 3.593.0314.3414.4844.2920.080.090.10
ω max meas 3 6.271.844.563.1234.1549.970.040.06
ω max meas 4 21.055.358.468.2824.3532.060.180.26
Quad Motor
Top View
ω half meas 1 0.040.040.050.070.060.0696.483.21
ω half meas 2 0.040.040.050.080.060.0796.163.51
ω half meas 3 0.020.020.030.040.030.0398.451.37
ω half meas 4 0.090.070.100.150.120.1393.565.79
ω max meas 1 0.140.100.150.210.220.2365.8433.11
ω max meas 2 0.250.170.270.350.370.4030.0168.20
ω max meas 3 0.110.080.110.160.160.1882.1117.08
ω max meas 4 0.090.060.090.120.110.134.4994.91
ω max meas 5 0.380.240.400.500.550.598.1589.18
Table 3. Confusion matrix considering different numbers of motors.
MeasuresReference Models (Best GA Fits for Class)
Single MotorSingle MotorQuad MotorQuad Motor
Orthogonal ViewLongitudinal ViewBottom ViewTop View
Single Motor
Vertical View
ω half meas 1 69.4728.441.920.17
ω half meas 2 23.6773.132.960.23
ω half meas 3 89.277.842.570.32
ω max 97.211.661.040.09
Single Motor
Horizontal View
ω half meas 1 26.6260.7410.731.90
ω half meas 2 8.5465.2925.340.83
ω half meas 3 8.2689.422.160.16
ω half meas 4 24.2569.515.270.97
ω max meas 1 24.5366.507.661.31
ω max meas 2 7.9078.0413.510.56
ω max meas 3 4.6391.074.040.26
ω max meas 4 20.0473.585.371.01
Quad Motor
Bottom View
ω half meas 1 9.9713.0476.730.26
ω half meas 2 8.838.0382.960.19
ω half meas 3 6.4727.5165.850.16
ω half meas 4 8.117.6884.120.10
ω half meas 5 18.867.0473.960.14
ω max meas 1 6.4715.9677.490.08
ω max meas 2 6.6228.8264.370.19
ω max meas 3 8.117.6884.120.10
ω max meas 4 26.4116.7456.410.44
Quad Motor
Top View
ω half meas 1 0.070.120.1299.69
ω half meas 2 0.080.130.1399.66
ω half meas 3 0.040.060.0799.83
ω half meas 4 0.150.250.2599.35
ω max meas 1 0.240.360.4598.95
ω max meas 2 0.410.610.7798.21
ω max meas 3 0.180.280.3499.20
ω max meas 4 0.150.210.2499.40
ω max meas 5 0.630.901.1497.33
Publisher’s Note: MDPI stays neutral with regard to jurisdictional claims in published maps and institutional affiliations.

