Article

Sobel Edge Detection Based on Weighted Nuclear Norm Minimization Image Denoising

College of Electronic Information and Optical Engineering, Nankai University, Tianjin 300350, China
*
Author to whom correspondence should be addressed.
Electronics 2021, 10(6), 655; https://doi.org/10.3390/electronics10060655
Submission received: 9 February 2021 / Revised: 6 March 2021 / Accepted: 9 March 2021 / Published: 11 March 2021
(This article belongs to the Section Computer Science & Engineering)

Abstract

:
As a classic and effective edge detection operator, the Sobel operator has been widely used in image segmentation and other image processing technologies. This operator has obvious advantages in the speed of extracting the edge of images, but it also has the disadvantage that the detection effect is not ideal when the image contains noise. In order to solve this problem, this paper proposes an optimized scheme for edge detection. In this scheme, the weighted nuclear norm minimization (WNNM) image denoising algorithm is combined with the Sobel edge detection algorithm, and the excellent denoising performance of the WNNM algorithm in a noise environment is utilized to improve the anti-noise performance of the Sobel operator. The experimental results show that the optimization algorithm can obtain better detection results when processing noisy images, and the advantages of the algorithm become more obvious with the increase of noise intensity.

1. Introduction

Image edge means the end of one area and the beginning of another area in an image. The collection of pixels at the junction of adjacent areas in the image constitutes the edge of the image [1]. Because the grayscale difference of pixels between different areas is often very large, the purpose of edge detection is to identify pixels with obvious brightness changes in the image. The significance of edge detection is that it greatly reduces the amount of data that need to be processed. It removes the data that carry less information and retains the important structural information of the image, so it is an important research direction in the field of image processing and computer vision, especially in the area of feature extraction.
With the development of edge detection technology, there are some mature classical edge detection operators, including the Roberts operator, the Prewitt operator, the Sobel operator and the Laplacian operator. On this basis, many scholars have conducted in-depth research on the above operators over the years and proposed a series of improved algorithms with much superior performance. For example, Zhang et al. proposed a fusion edge detection algorithm based on an improved Sobel operator, using a fusion algorithm that combines an improved Sobel operator, a Canny operator and a Laplacian-of-Gaussian operator to optimize the edge detection result [2]. Topno et al. proposed an improved edge detection method based on median filtering. After edge detection, the median filter is used to protect the edge from salt and pepper noise [3]. Yoon et al. proposed an edge detection method based on the Bhattacharyya distance with adjustable block space. In this algorithm, in order to calculate the Bhattacharyya distance, a pair of blocks were extracted for each pixel. The Bhattacharyya distance was used to detect edges, which was calculated from the mean vector and covariance matrix of each block. By adjusting the block space, weak edges can also be accurately detected [4]. Chetia et al. proposed a quantum-improved Sobel edge detection algorithm with nonmaximum suppression. In this algorithm, the Sobel operator with 45° and 135° direction masks was used for quantum edge extraction, and then the non-maximum suppression technique with dual thresholds was used to sharpen the edges. This algorithm can significantly improve edge information and circuit complexity [5]. Sung et al. proposed an edge detection method based on the edge-preserving filter. The algorithm used an edge-preserving filter to smooth the image, and then used the Canny operator and morphological operations to detect edges, which can detect the edge of the image more accurately [6]. Xie et al. proposed an improved subpixel edge detection algorithm combining coarse and precise locations. The algorithm used an improved Roberts operator to detect pixel-level edges and used the Zernike moment method to locate subpixel edges, which effectively improved the detection efficiency and the detection accuracy [7]. Raheja et al. proposed a fuzzy-logic-based edge detection method. The algorithm used a sharpening guided filter to enhance the edge quality and a Gaussian filter to remove noise, which can obtain a significant improvement in the detected edges [8] and so on. However, in general, the existing edge detection algorithms have problems such as poor anti-noise performance and sensitivity to noise [9]. Based on this, this paper proposes a Sobel-operator-based edge detection optimization algorithm. This algorithm uses a low-rank image denoising algorithm to improve the traditional edge detection algorithm. The experimental results verified that the proposed algorithm has better anti-noise performance and can obtain clear and continuous edge information under high noise levels, thus confirming the effectiveness of the algorithm.

2. Sobel Edge Detection Operator

The edge of an image is some continuous pixels in the image that have drastic changes in grayscale [10]. From the feature that the pixel at the edge of the image has the largest grayscale jump, the following information can be obtained: along the edge direction, the grayscale value changes slowly; perpendicular to the edge direction, the grayscale value jumps significantly. Based on this feature, the first-order derivative and the second-order derivative are usually used to detect edges. The Sobel operator is a typical first-order derivative edge operator, also known as a gradient edge operator [11].

2.1. Image Gradient

The partial derivative of the image f(x,y) at the point (x,y); that is, the gradient of the image at that point, can be expressed by the vector shown in Equation (3):
g x = f ( x , y ) x = f ( x + 1 , y ) f ( x , y ) .
g y = f ( x , y ) y = f ( x , y + 1 ) f ( x , y ) .
f g r a d ( f ) = [ g x , g y ] T = [ f x , f y ] T .
its amplitude is:
M ( x , y ) = m a g ( f ) = g x 2 + g y 2 .
since the calculation amount of this equation is too large, Equation (5) is usually used as an approximate substitute:
M ( x , y ) | g x | + | g y | .
its direction is:
α ( x , y ) = arctan [ g y g x ] .

2.2. Sobel Operator

The Sobel operator uses Equation shown in (7) to calculate the image gradient:
S ( i , j ) = | G x | + | G y | .
G x = [ f ( i + 1 , j 1 ) + 2 f ( i + 1 , j ) + f ( i + 1 , j + 1 ) ] [ f ( i 1 , j 1 ) + 2 f ( i 1 , j ) + f ( i 1 , j + 1 ) ] .
G y = [ f ( i 1 , j + 1 ) + 2 f ( i , j + 1 ) + f ( i + 1 , j + 1 ) ] [ f ( i 1 , j 1 ) + 2 f ( i , j 1 ) + f ( i + 1 , j 1 ) ] .
It can be seen that when using 8 surrounding pixels to estimate the central pixel gradient, the Sobel operator sets the weight of pixels in the neighborhood of the central pixel as 2 or −2 [12] to distinguish the influence of pixels of different distances on the central pixel, so as to make the edge contour more prominent and the detection and positioning more accurate.
After calculating the gradient of the center pixel, we only need to set a threshold value and compare the gradient with it. If the gradient of this point is greater than the threshold value, it is considered the edge point of the image. In the traditional Sobel operator, the threshold can be customized, or the average of the grayscale values of all pixels can be used as the threshold.
The Sobel operator can detect the edges of a noise-free image quickly and accurately; however, it is usual that the traditional Sobel operator wrongly marks the noise points as edges when it is used for edge detection of noisy images, resulting in low detection accuracy and a high error rate

3. Sobel Edge Detection Based on Weighted Nuclear Norm Minimization (WNNM) Image Denoising

3.1. WNNM Image Denoising Algorithm

The WNNM image denoising algorithm is a kind of low-rank matrix recovery algorithm. It uses the low-rank property of the image to recover the original image from the noisy image. In the WNNM denoising algorithm, the image is first divided into blocks with overlapping pixels. By exploiting the nonlocal self-similarity prior [13] to the image, many nonlocal similar patches can be searched across the whole image for a given patch. By stacking those nonlocal similar patches into a matrix, denoted by Y j , the noisy image can be regarded as the model shown in Equation (10):
Y j = X j + V j .
where V j represents the additive noise matrix, and X j represents the low-rank image to be restored. Therefore, the task of restoring the original image can be accomplished by solving the following inverse problem:
X ^ j = arg   min X j Y j X j F 2 + r a n k ( X j ) .
Equation (11) is an NP problem [14], so the objective function needs to be relaxed. In 2009, Candès and Recht proved that the nuclear norm minimization (NNM) is a convex optimization of the rank function [15], so Equation (11) can be relaxed to the following problem:
X ^ j = arg   min X j = Y j X j F 2 + λ X j * .
where X j * is the nuclear norm, and λ is a positive number. The model can be solved in the following ways:
Y j = U V T .
S λ ( ) i i = max ( i i λ , 0 ) .
X ^ j = U S λ ( ) V T .
The method is called the singular value threshold method (SVT), where Y j = U V T is the singular value decomposition of matrix Y j , and S λ ( ) is the soft threshold shrinkage of singular value . This method has been widely used in many NNM-based problems [16]. However, this method shrinks all the singular values to the same degree, resulting in the loss of flexibility. For this reason, the concept of weight is introduced, and different singular values are given different weights [17]. Then, Equation (14) becomes:
S w ( ) i i = max ( i i w i , 0 ) .
w i = c n σ i ( X j ) + ε .
where c is a constant, n is the number of similar blocks in the block group and σ i ( X j ) is the i-th singular value of X j . ε = 10 16 , this is to avoid the situation that the denominator is 0. Since the singular value of X j is unknown, σ i ( X j ) can be estimated by the following equation on the assumption that the noise energy is uniformly distributed in the noise space [18]:
σ ^ i ( X j ) = max ( σ i 2 ( Y j ) n σ n 2 , 0 ) .
where σ i ( Y j ) is the i-th singular value of Y j . Finally,
X ^ j = U S w ( ) V T .
After the above processing for each block group, matrix X can be reconstructed; that is, the denoised image can be obtained.

3.2. Improved Sobel Edge Detection Operator

At present, several classical edge detection operators widely used in image processing technology mostly have performance defects that are very sensitive to noise [19]; even the presence of a small amount of noise will affect the detection results. Therefore, it is of great practical significance to improve the anti-noise performance of edge detection operators. Taking the Sobel operator as an example, this paper proposes an improvement scheme that can enhance the anti-noise performance of edge detection operators. The specific process is as follows:
  • Dividing the noisy image into blocks. In order to eliminate the problem of seams when reconstructing an image, there needs to be some overlap between adjacent blocks. After block segmentation, similar image blocks are gathered according to the nonlocal similarity to form a low-rank matrix. The common criterion for judging whether blocks are similar is the Euclidean distance; that is, for blocks p i and p j , there is:
    D i j = m = 1 m = n ( p i m p j m ) 2 .
    where n represents the number of pixels in the block. The larger the value of D i j , the smaller the similarity between the two blocks, and vice versa.
  • Mathematical modeling and solving the objective function. Using the low-rank characteristic of the matrix obtained in the previous step to perform WNNM mathematical modeling of the image denoising problem, and using the singular value threshold method to solve the objective function to obtain the denoised block groups.
  • Reconstructing the image. In the process of reconstructing the image, due to the different selection of the center block of the block group, the same block may belong to multiple block groups at the same time, so it is necessary to average all the denoising results containing this block to get the final denoising result. Similarly, the averaging method is also used for the overlapping part between adjacent blocks to obtain a denoised complete image.
  • Obtaining the edge pixels of the image. After WNNM denoising, the interference factors of edge detection are greatly reduced. At this time, the Sobel operator is used to calculate the grayscale difference approximation of the horizontal and vertical directions of each pixel in the image, and then the estimated gradient value is obtained. Finally, these gradient values are compared with the preset threshold, and the edge pixels of the image are those that exceed the threshold.

4. Experimental Results and Analysis

In order to verify the effectiveness of the algorithm in this paper, several images with a gray level of 256 and a BMP format are used for simulation experiments. The simulation software is MATLAB 2016a, and the running environment is the Windows 10 operating system with a 64-bit processor.
As a contrast, the Sobel edge detection algorithm based on WNNM denoising proposed in this paper, the traditional Sobel edge detection algorithm and the improved edge detection algorithm based on median filtering proposed in Reference [3] will be applied to the Cameraman image, respectively. The experimental results and analysis are listed as follows.
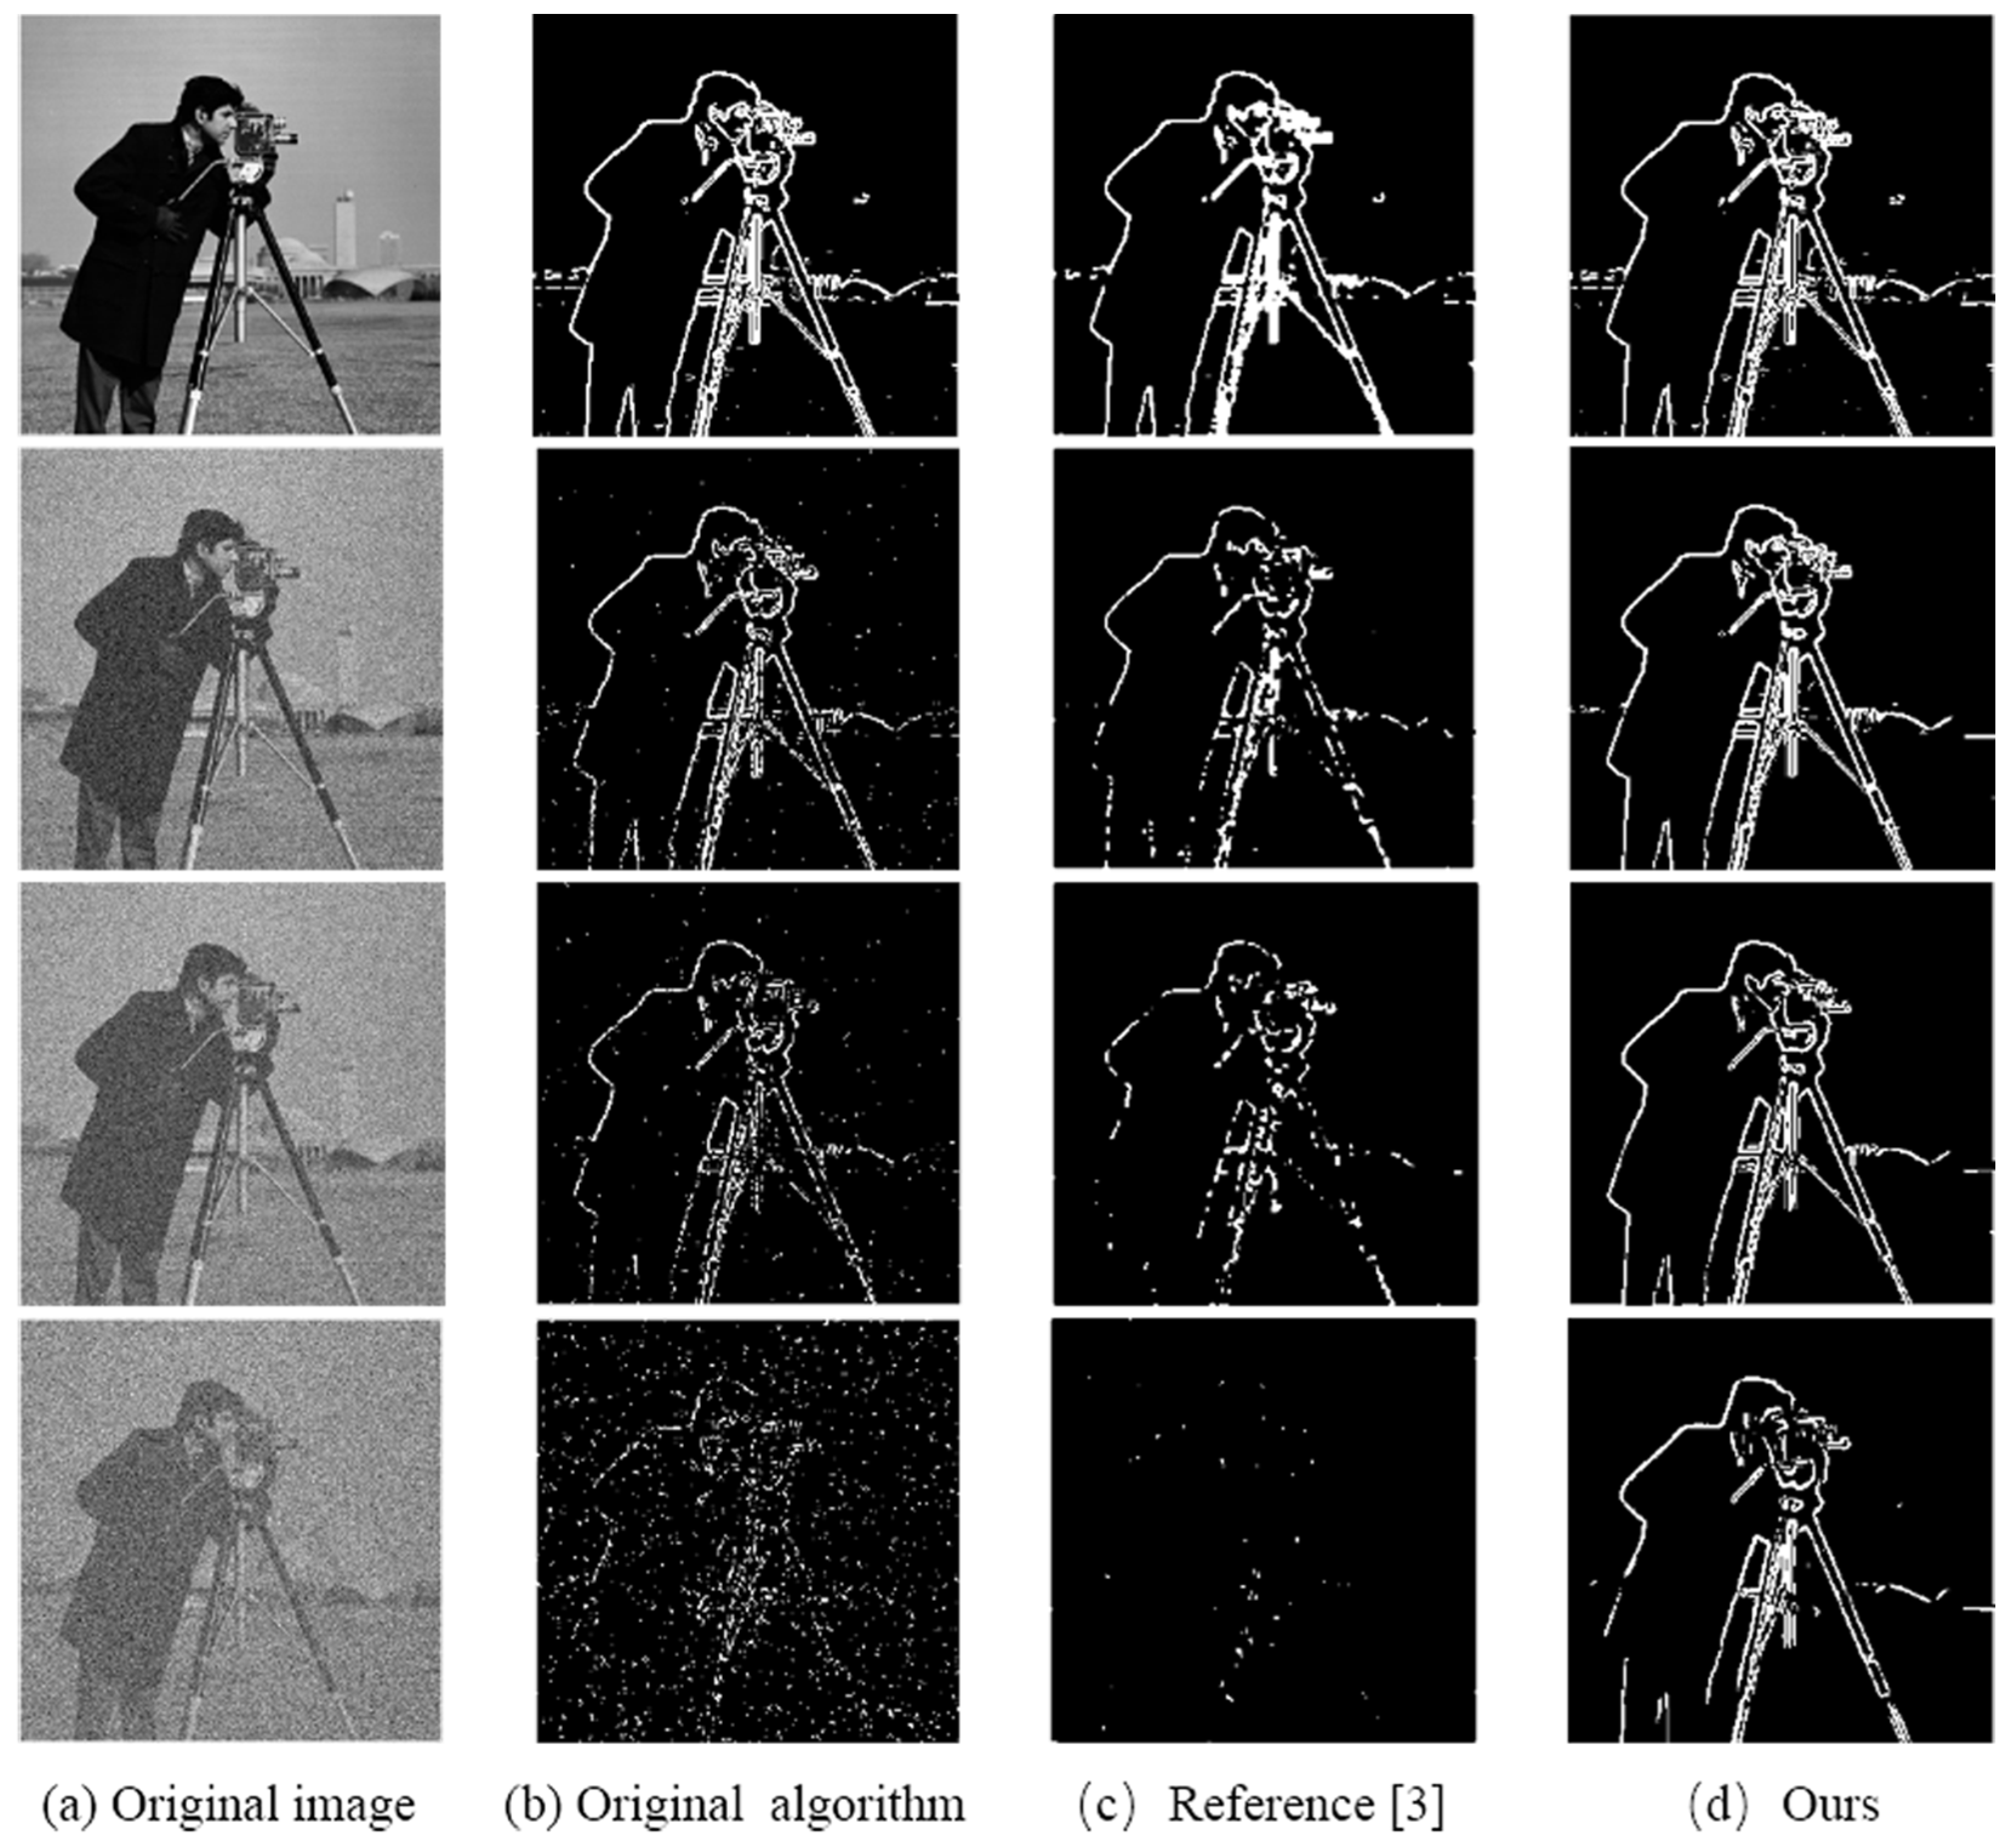
The first row in Figure 1 shows the detection results of the three algorithms when no noise is added. It can be seen that there is no significant difference in the performance of the three algorithms. The second to fourth rows show the detection results of the three algorithms after adding Gaussian noise with standard deviations of 30, 40 and 80 to the original image. It can be seen from the second and third rows that under the low and medium intensity noise levels, the traditional Sobel edge detection operator detects more noise points, while the median filter-based method proposed in [3] can eliminate most of the noise points, but it causes obvious damage to the real edges. By contrast, the algorithm proposed in this paper retains the true edge of the image to the greatest extent while eliminating the noise and achieves better detection results. Finally, this paper also selects high-intensity noise with a standard deviation of 80 for the experiment, and the experimental results are shown in the fourth row of Figure 1. At this time, the detection result of the traditional Sobel operator has been completely submerged in a large amount of noise, and the edge pixels cannot be distinguished. Similarly, after median filtering, the result of the algorithm in Reference [3] only has some isolated pixels, and both of them are difficult to achieve the purpose of extracting the edges of the image. The detection method in this paper can still obtain clear and relatively complete edges in this environment.
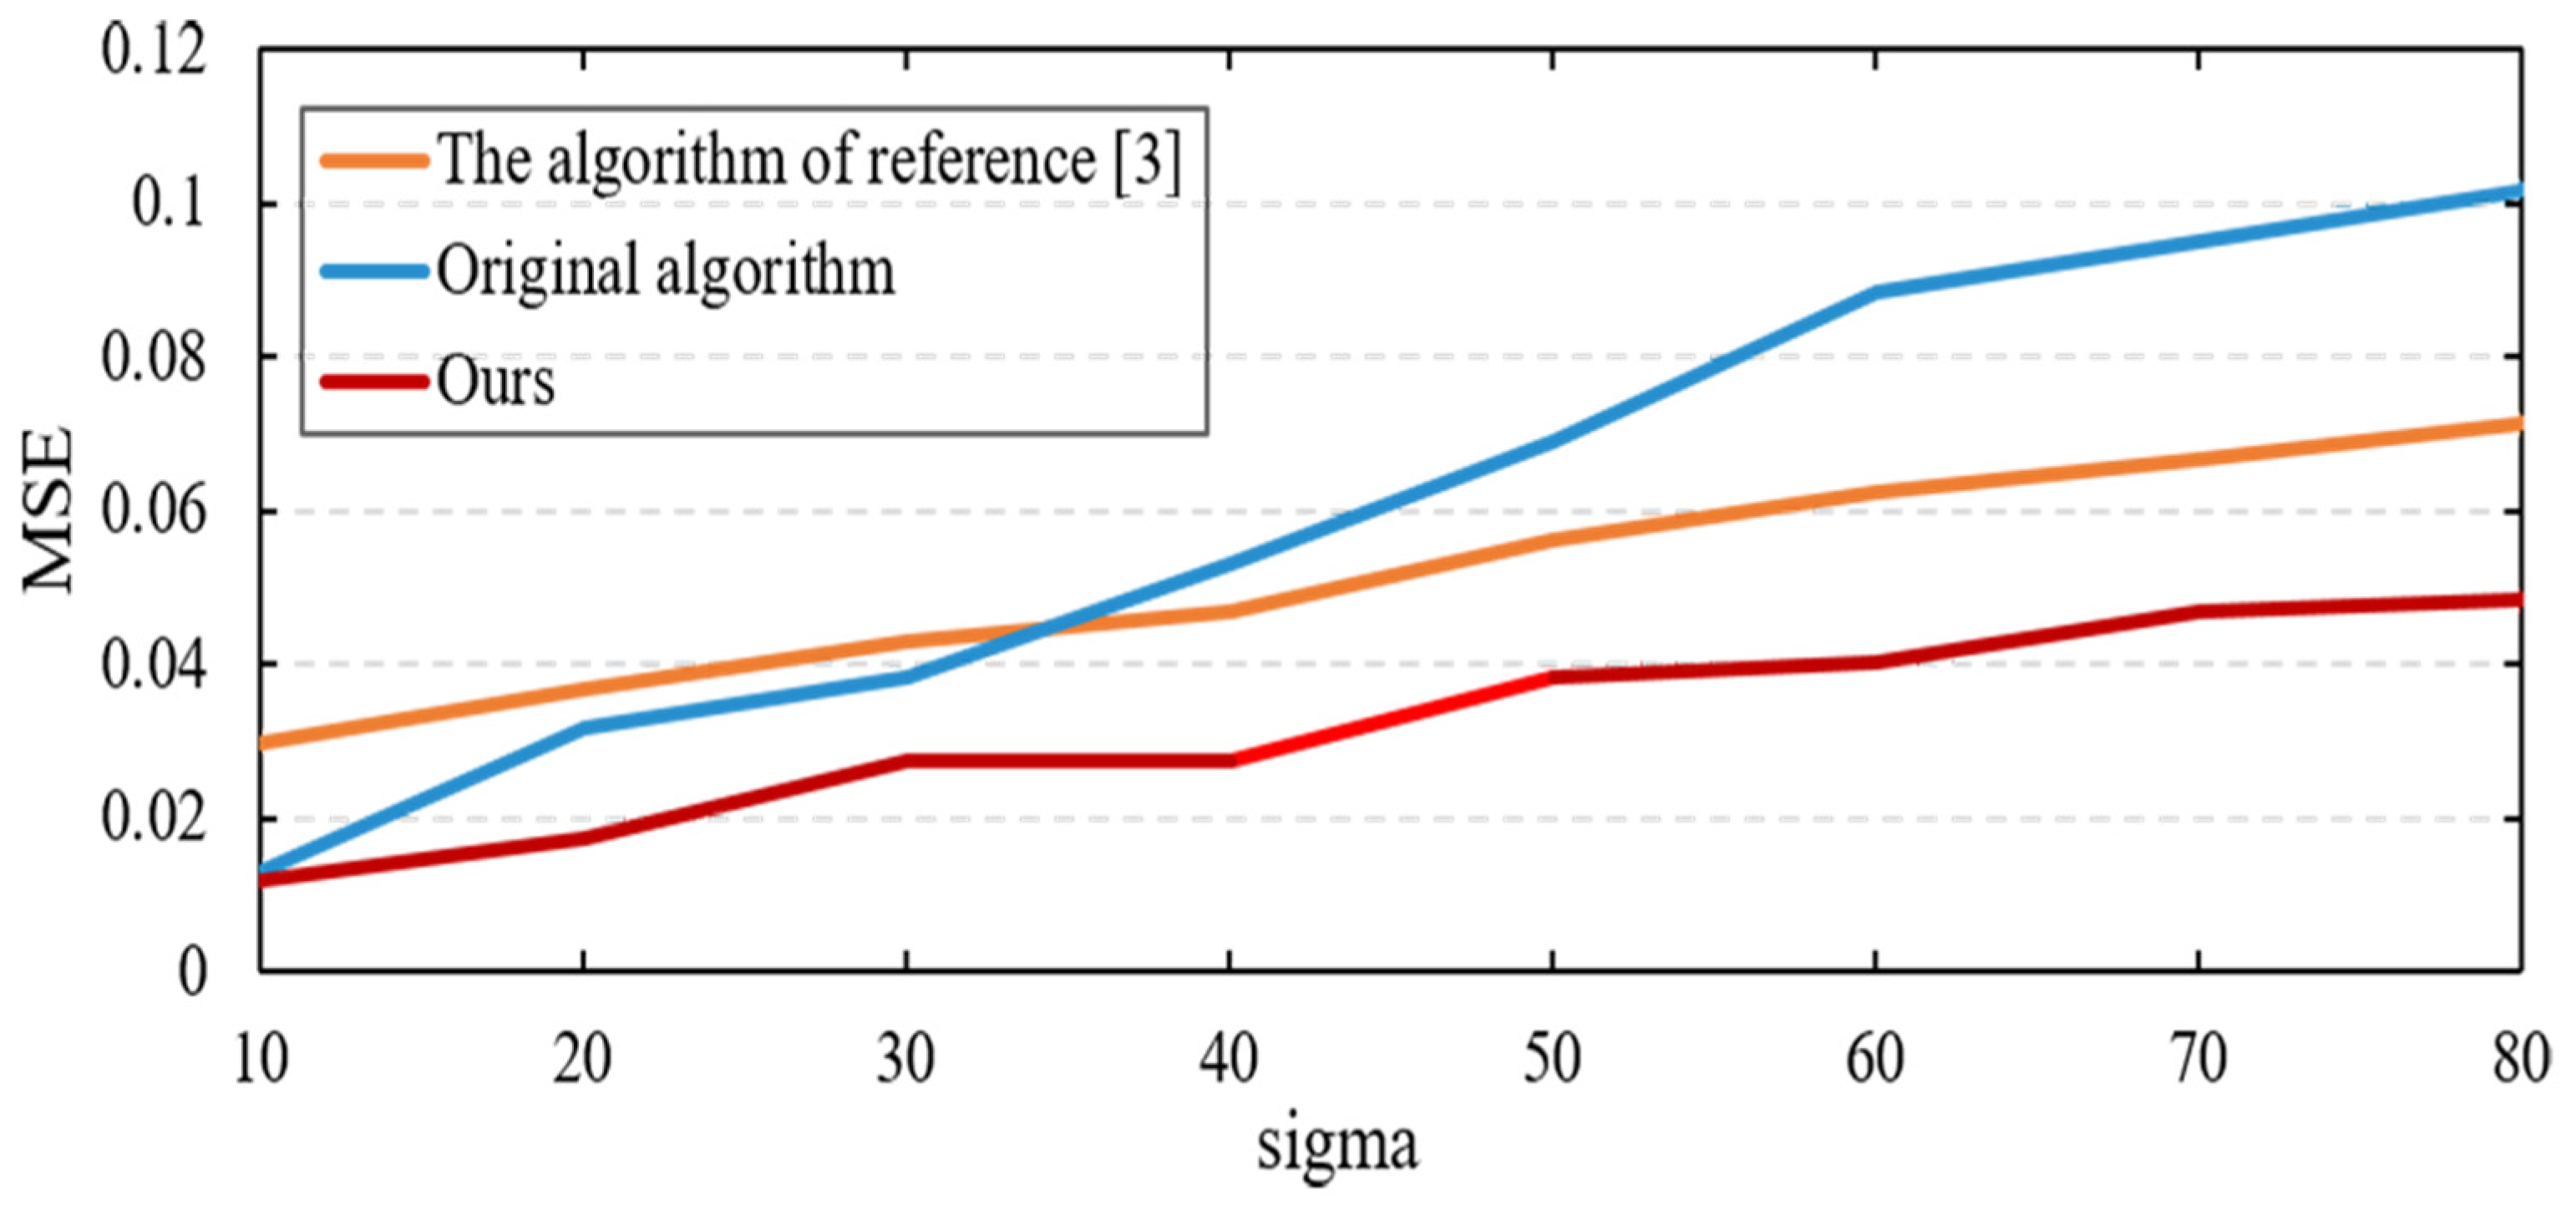
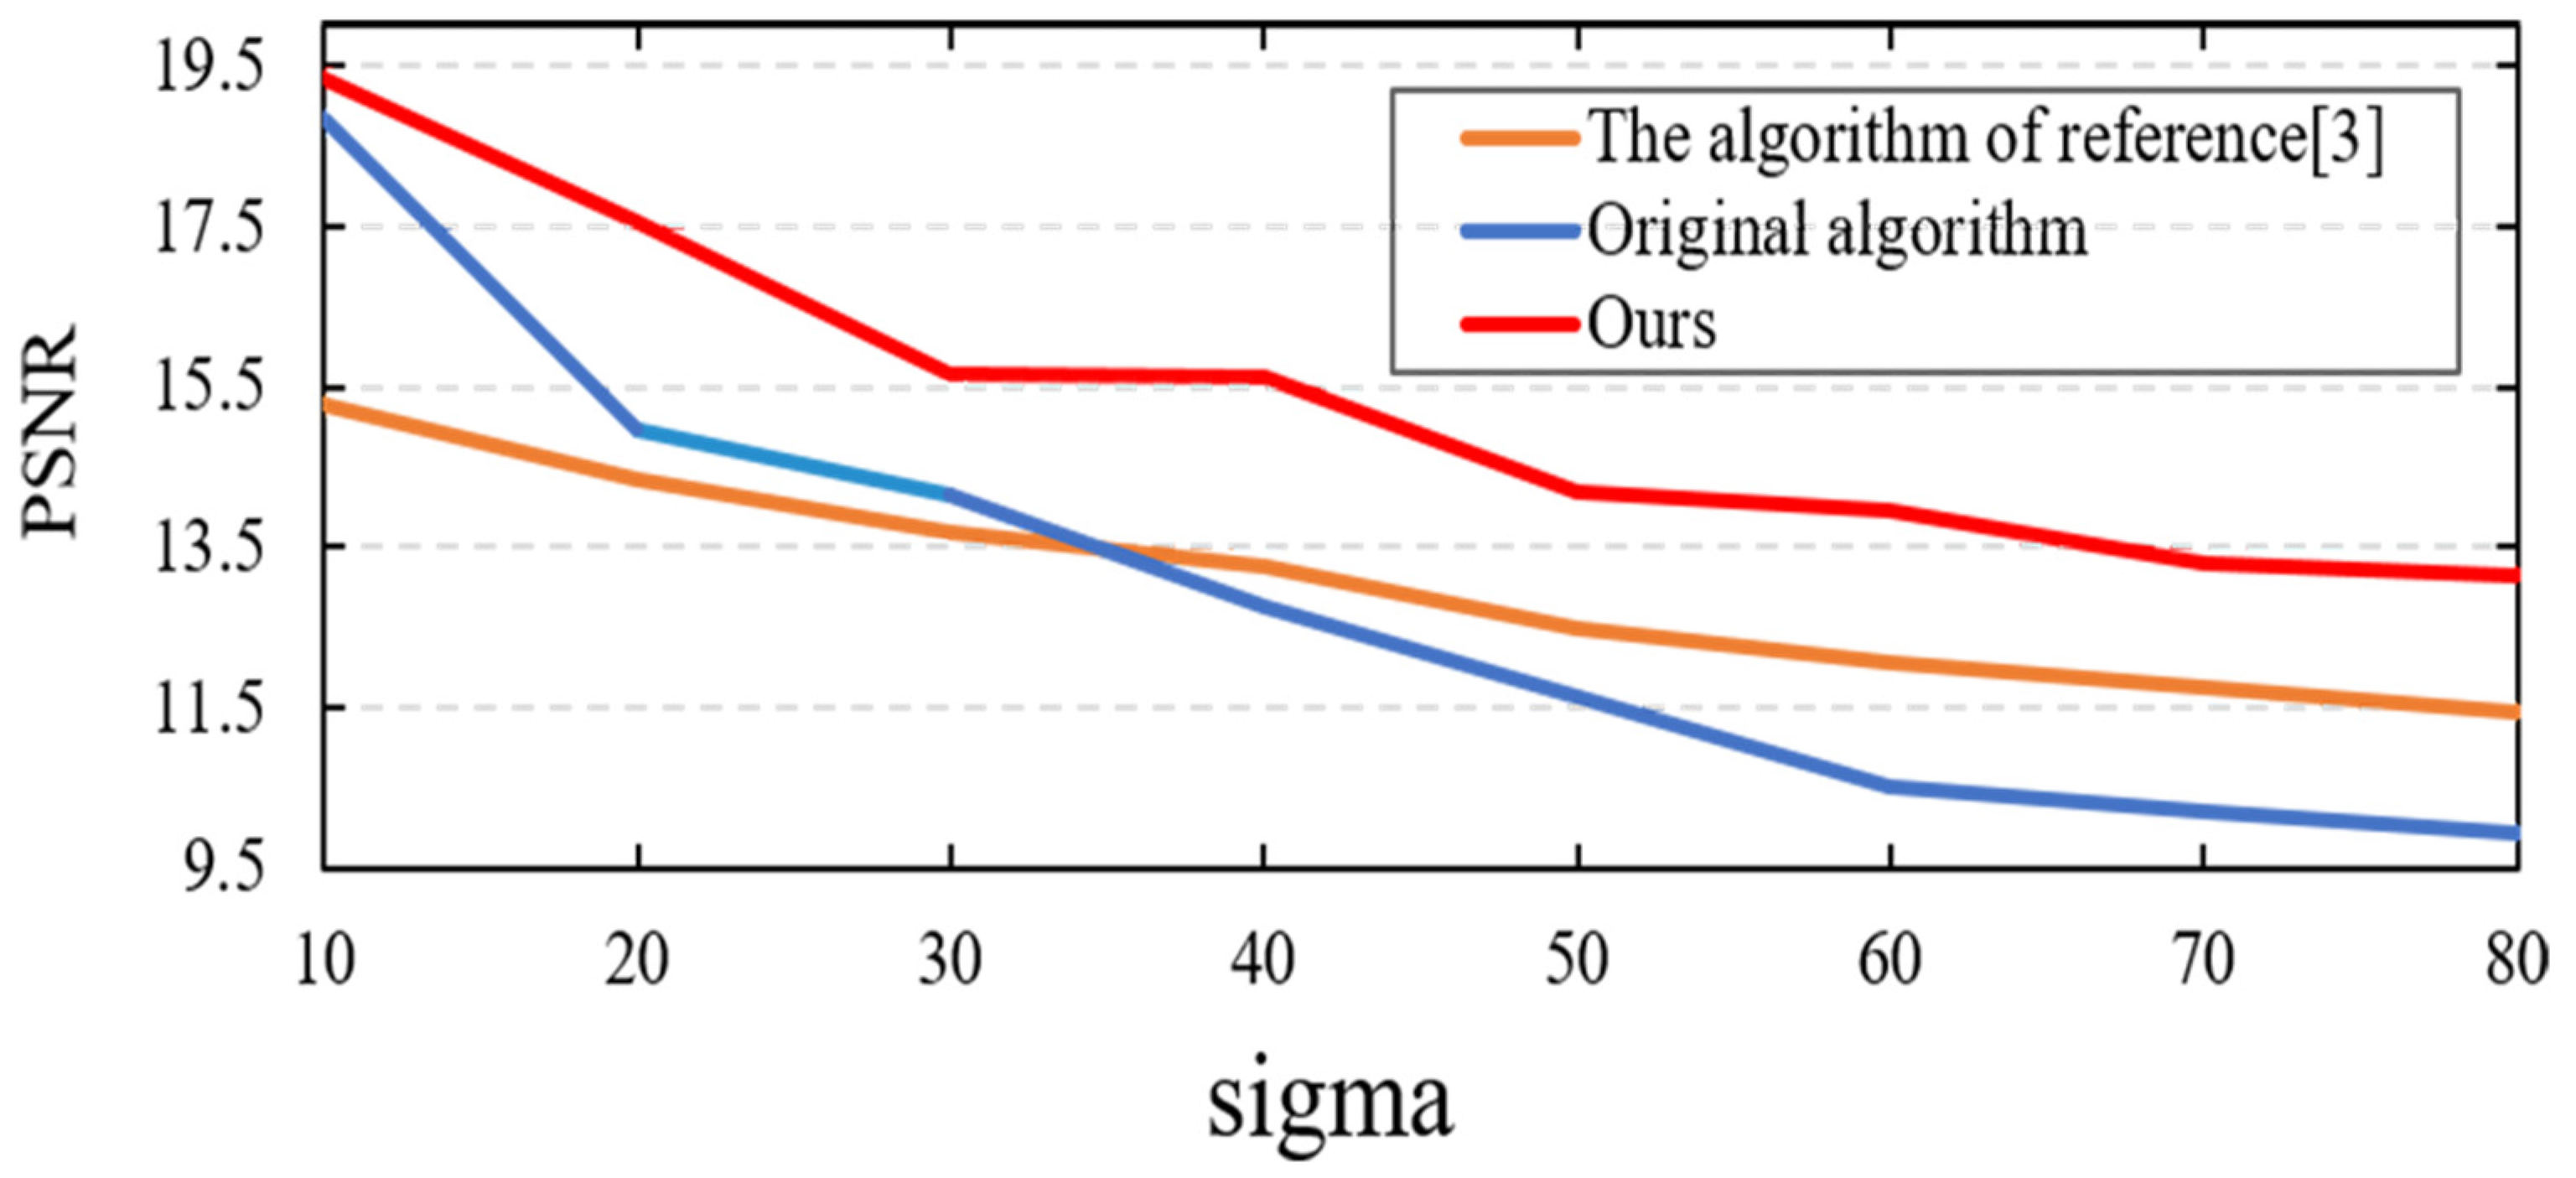
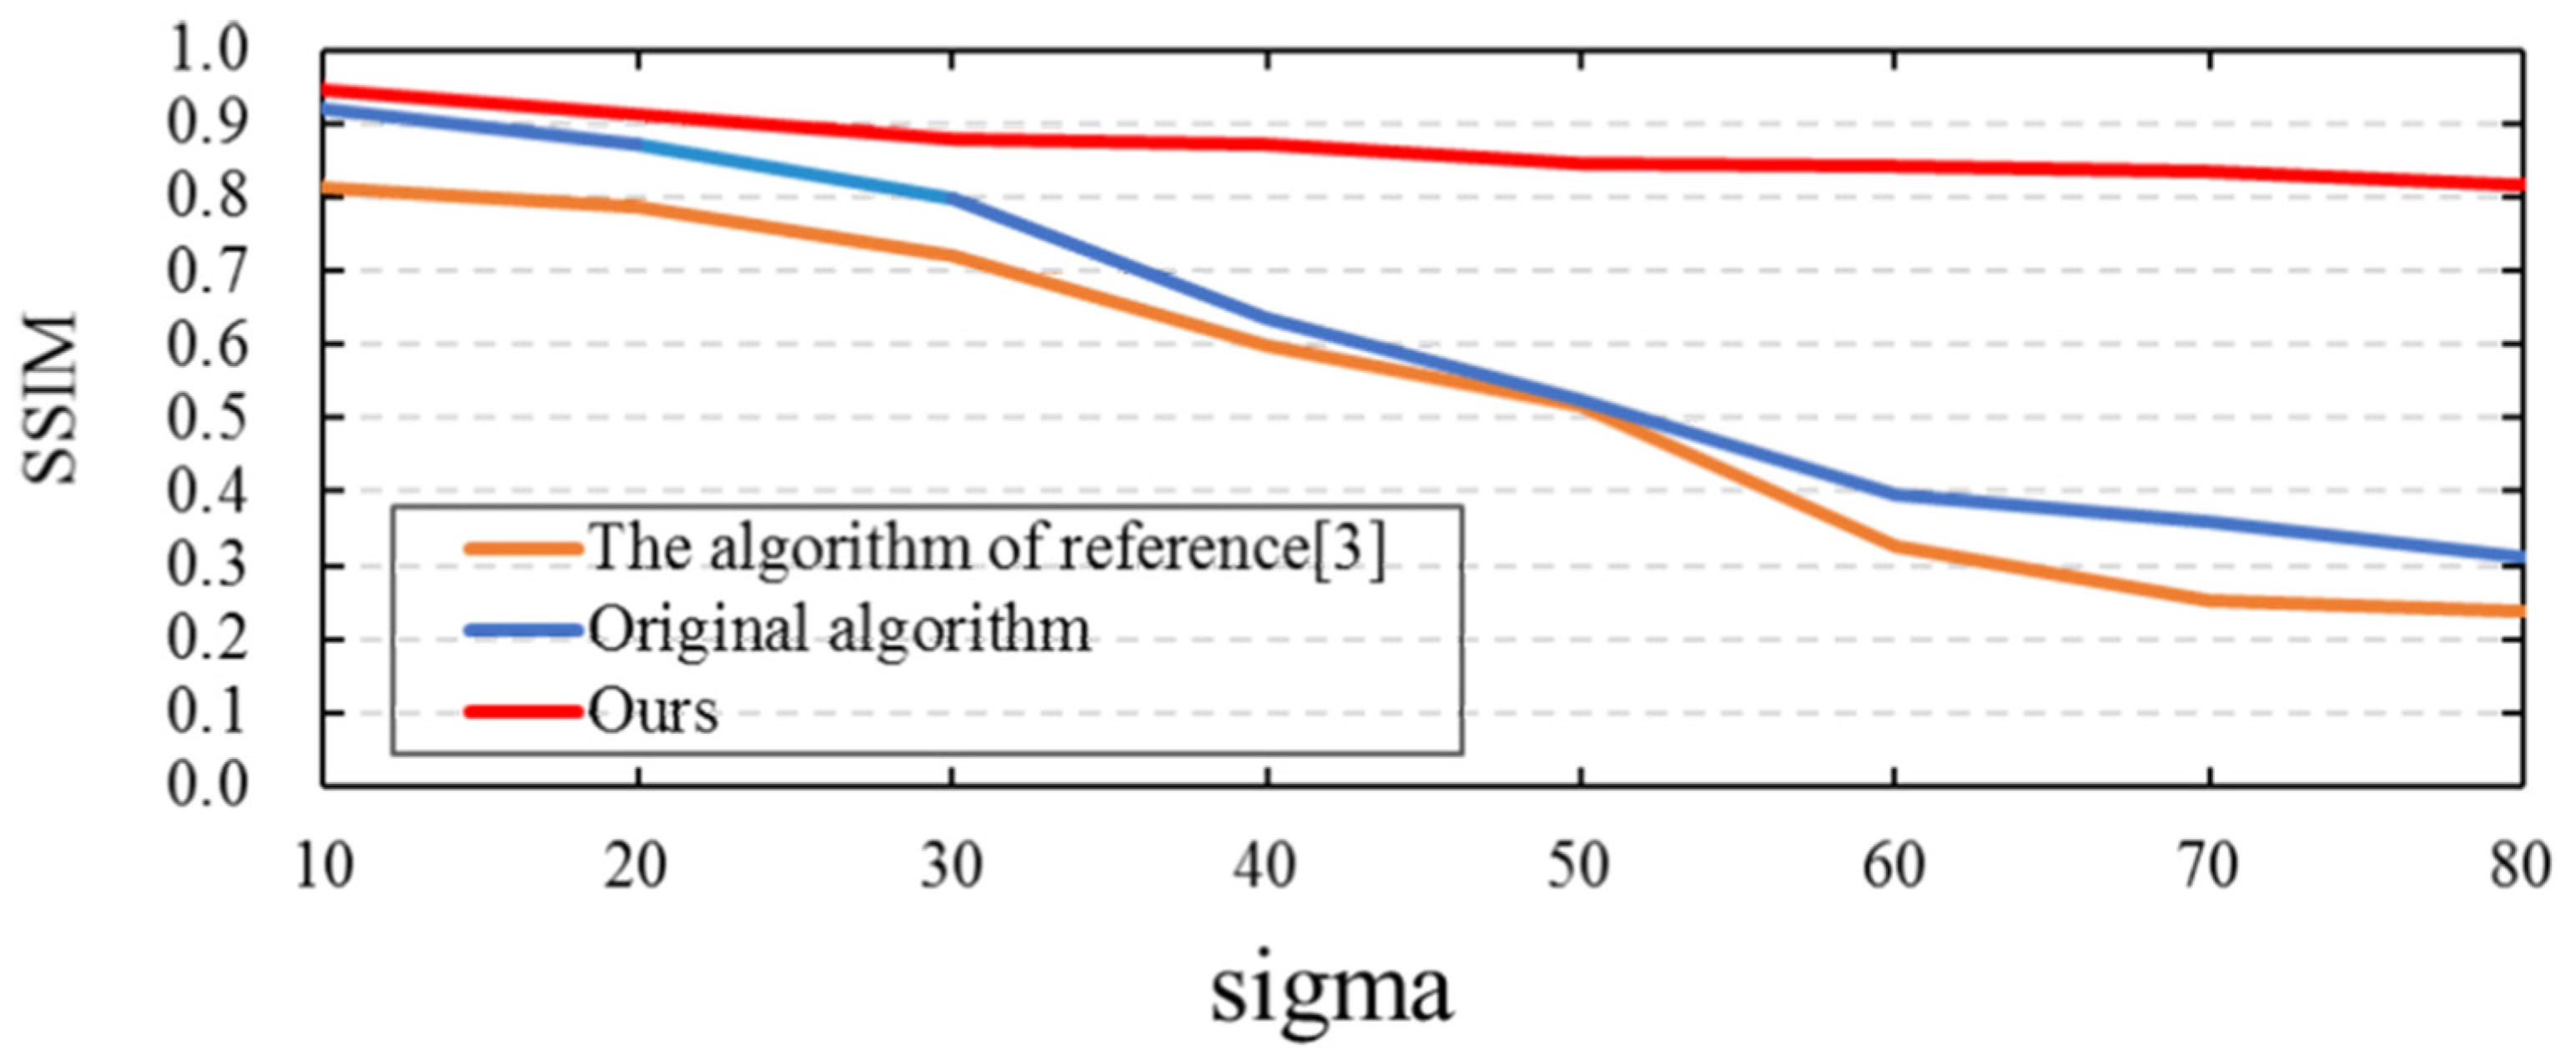
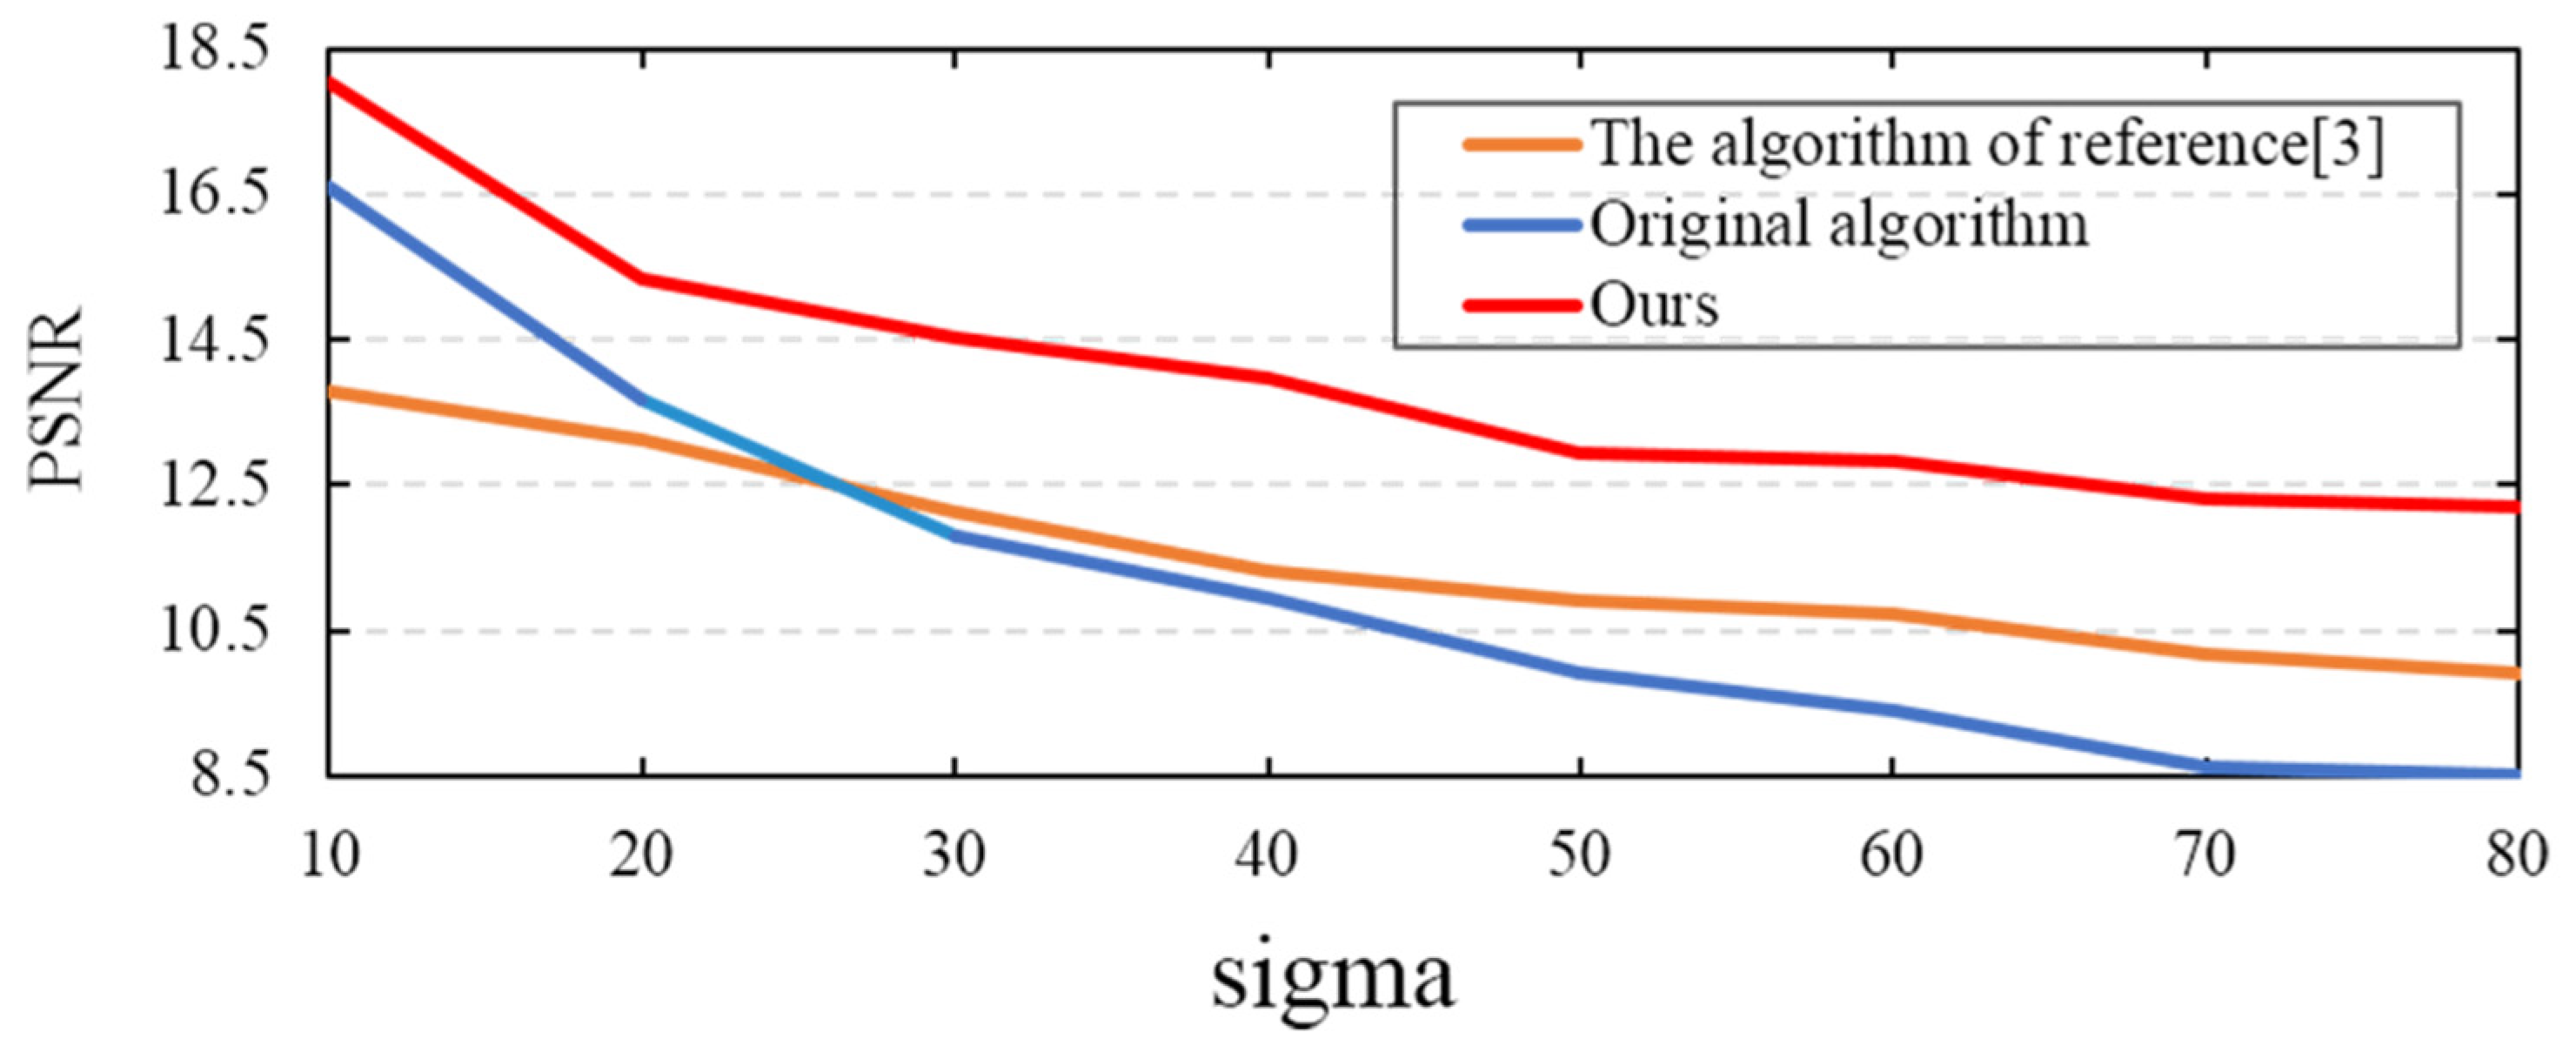
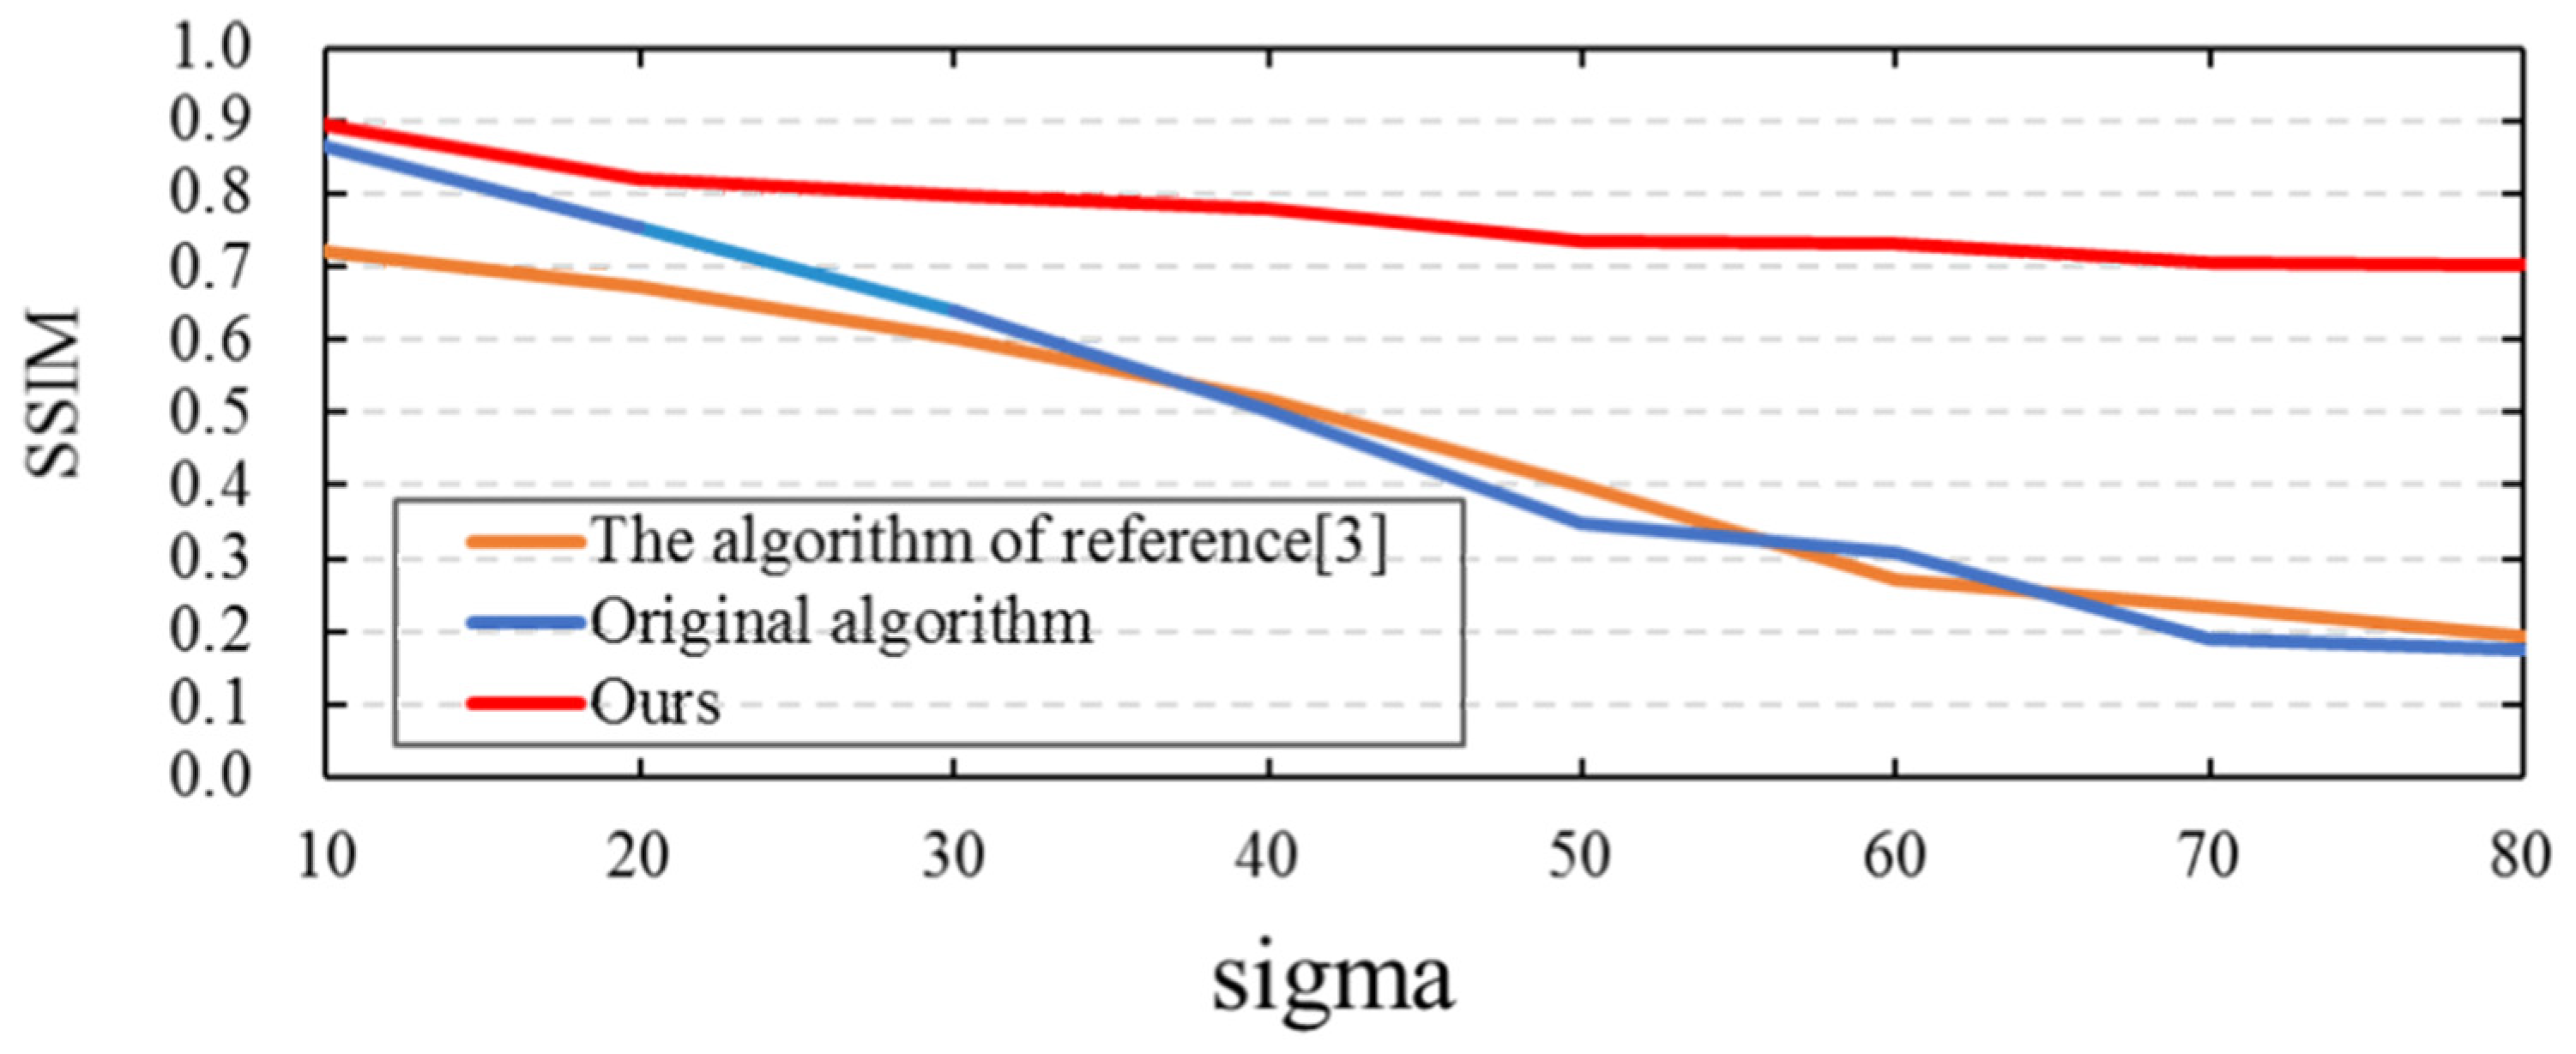
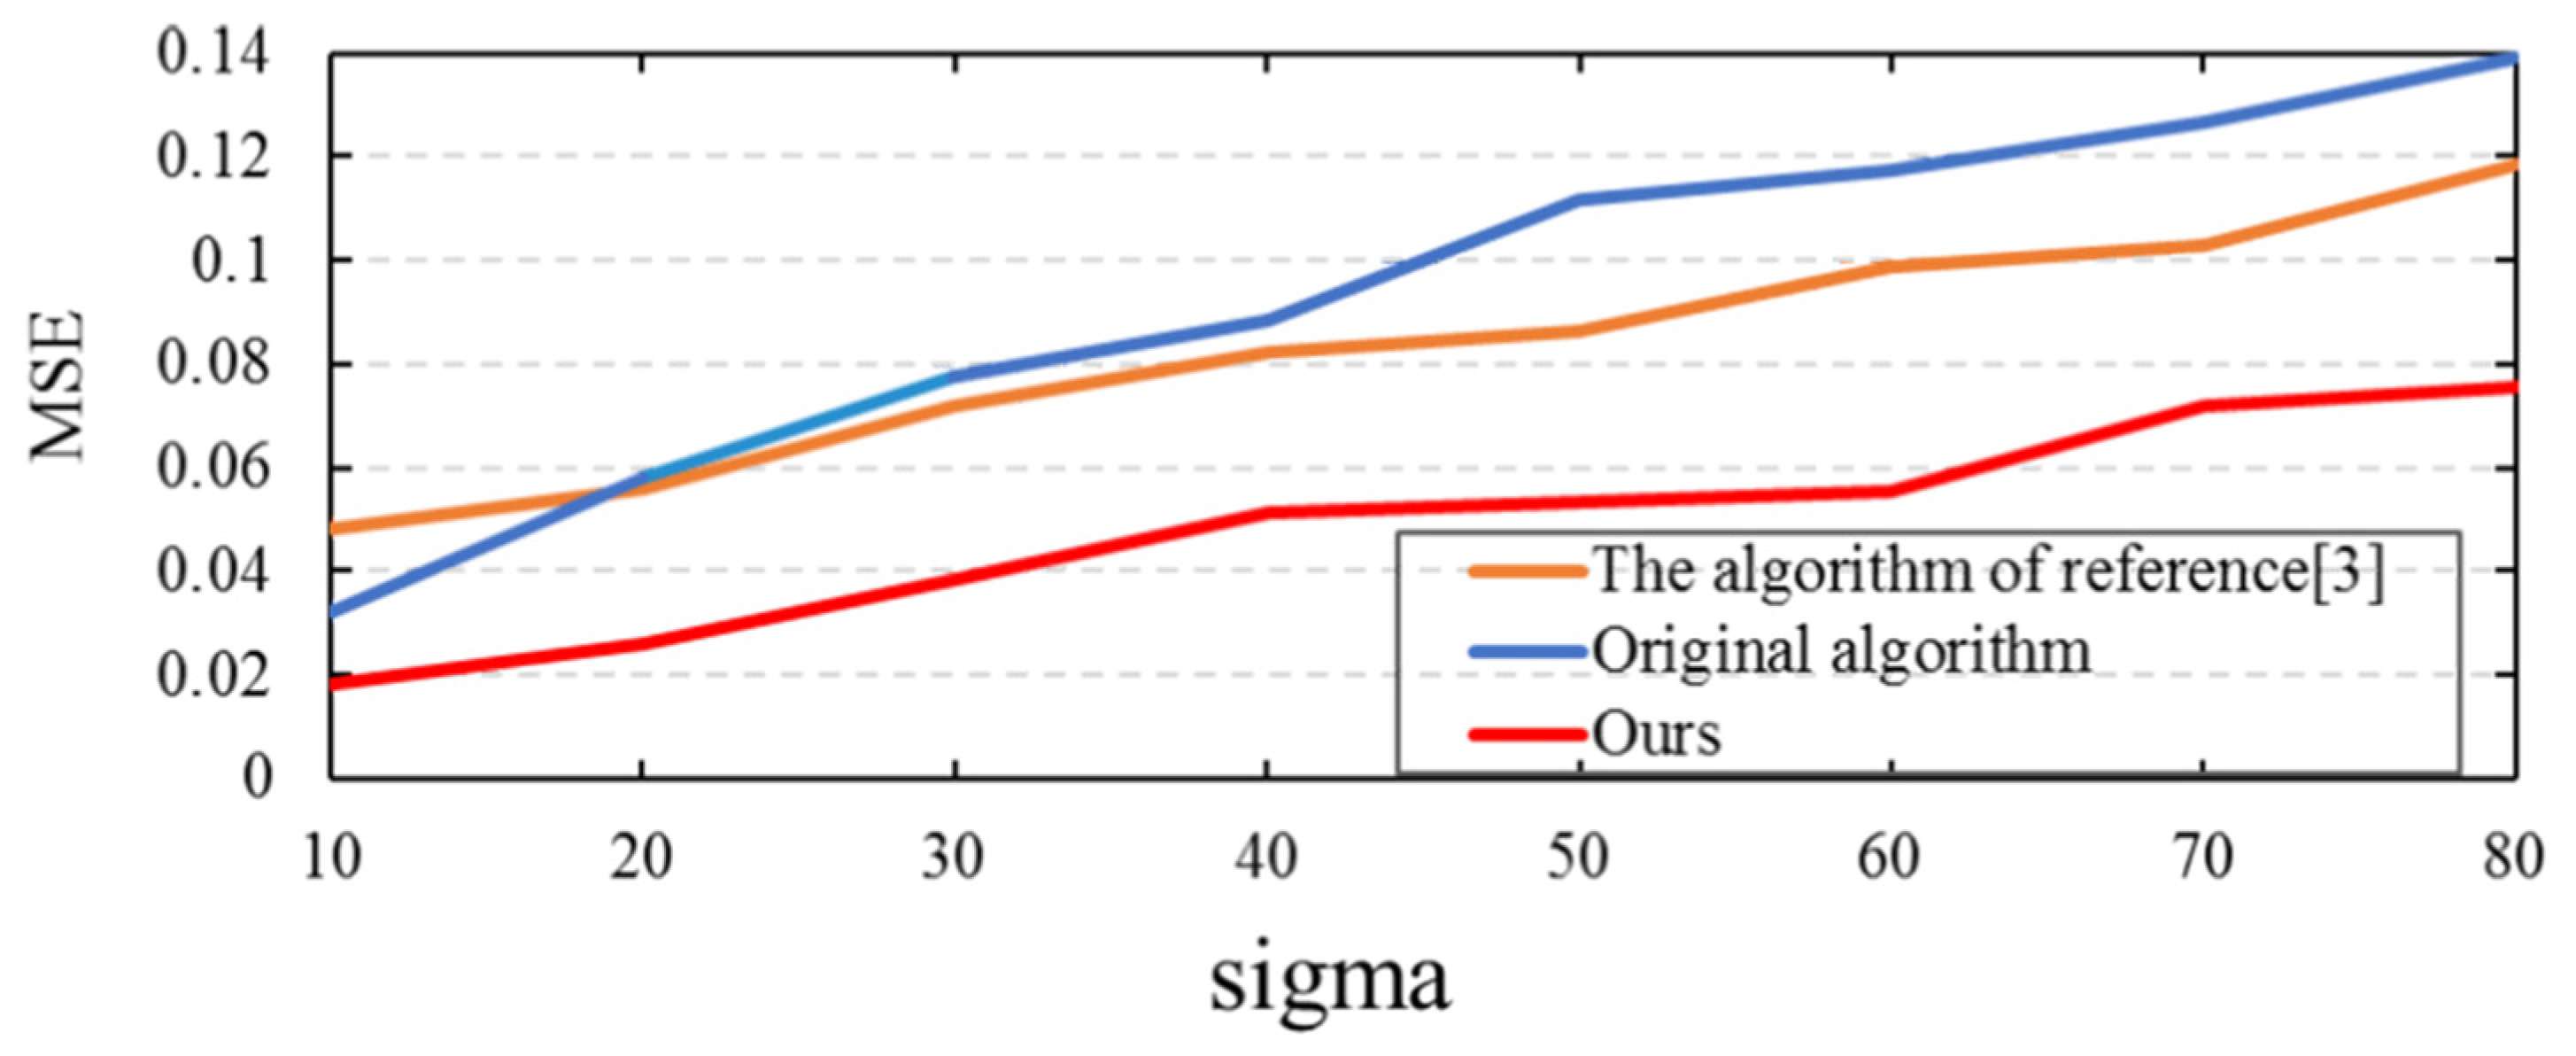
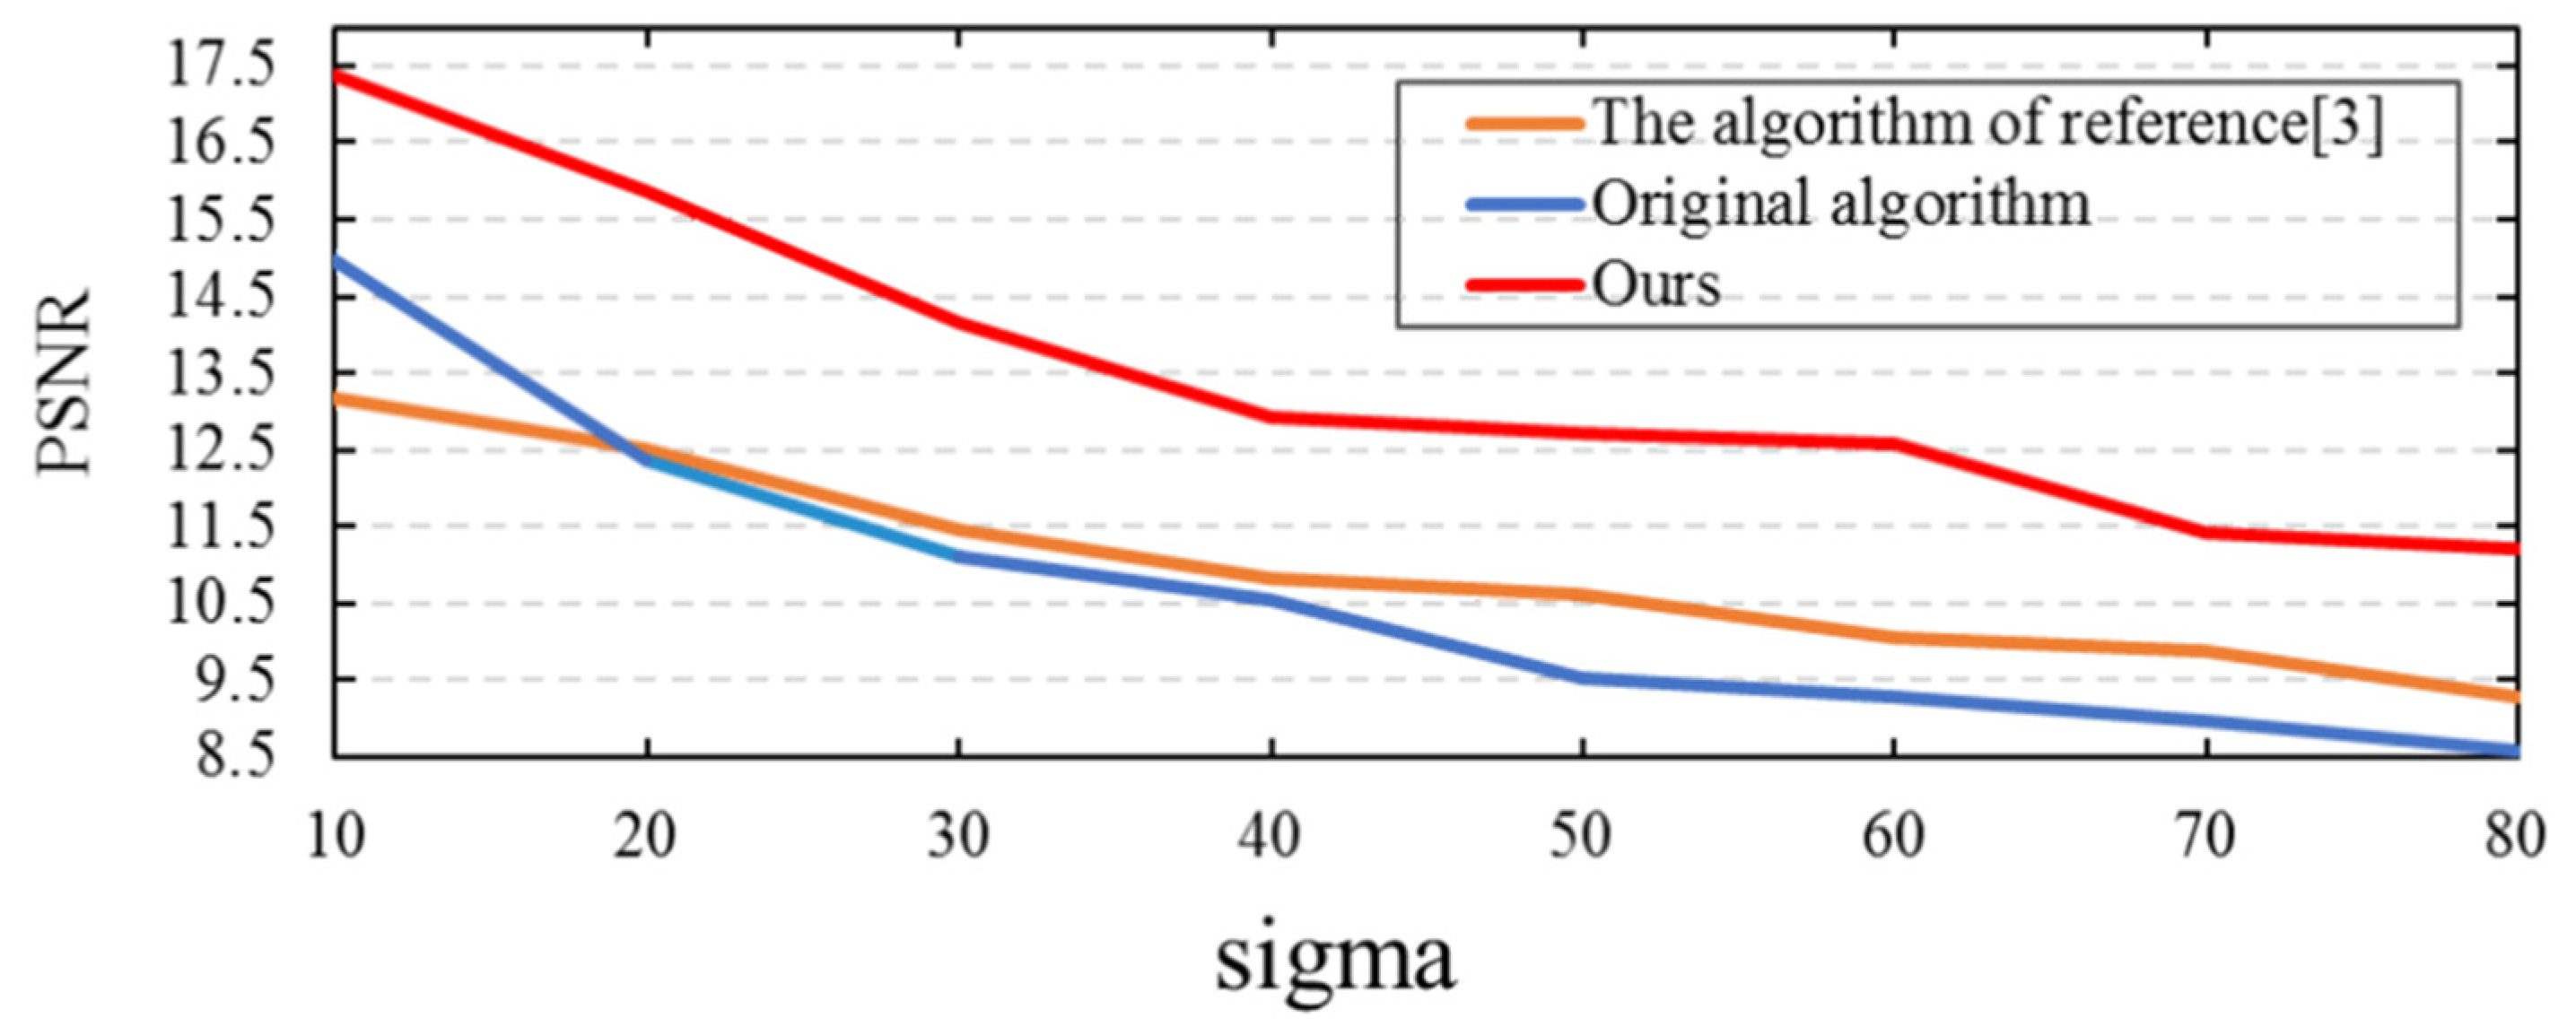
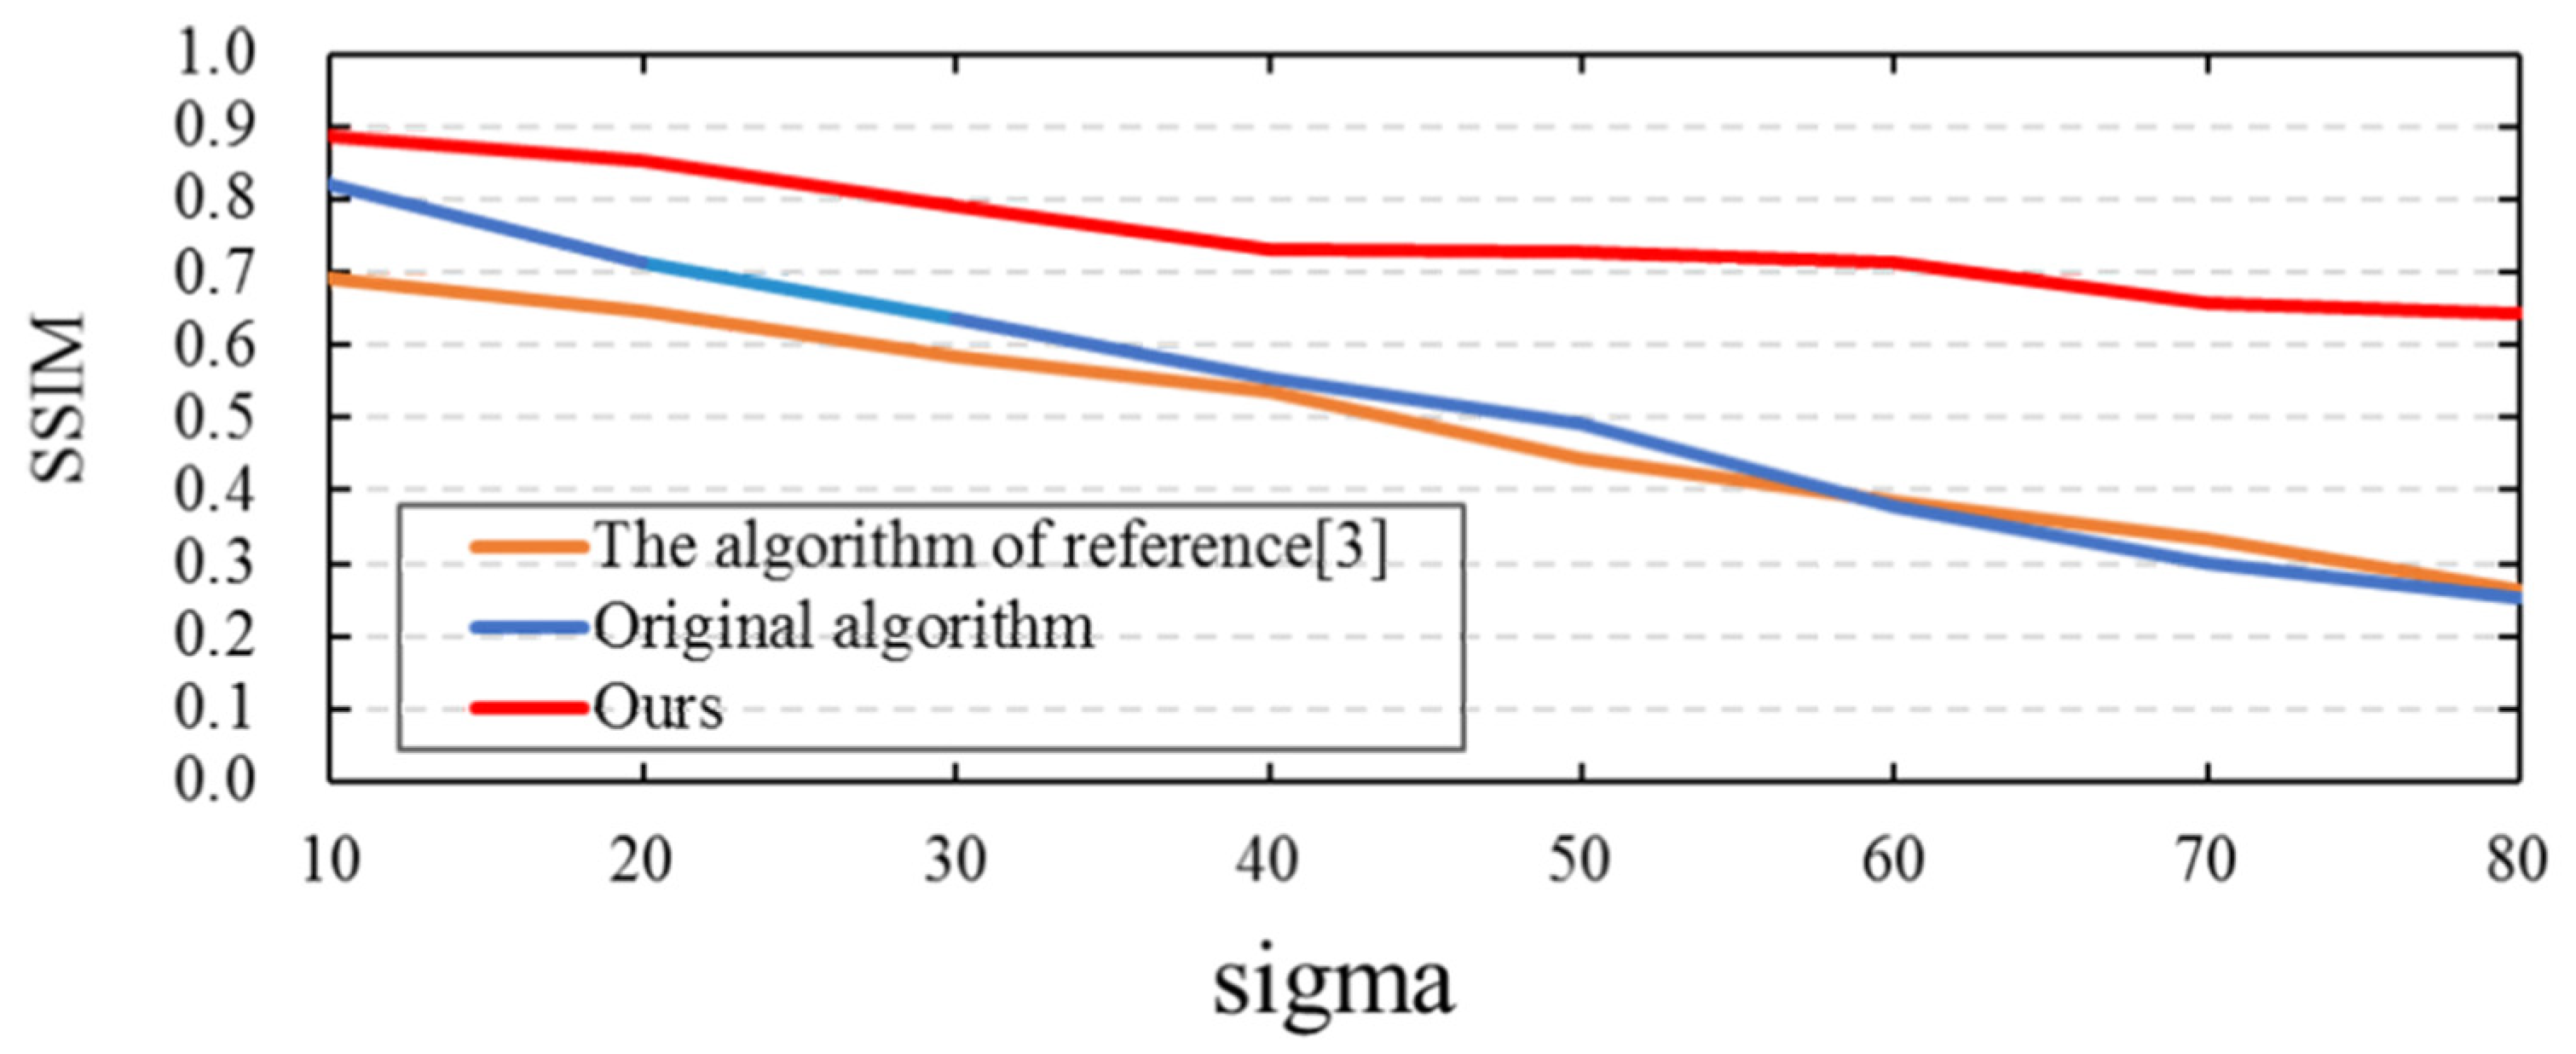
In addition, this paper also compares the mean square error (MSE), peak signal-to-noise ratio (PSNR) and structural similarity index metric (SSIM) of the three algorithms under different noise levels (Table 1, Table 2 and Table 3) and draws the corresponding line graphs for intuitive comparison (Figure 2, Figure 3 and Figure 4); “sigma” in the graph represents the standard deviation of added noise. As can be seen from the chart, the edges detected by the algorithm in this paper obtain smaller MSE, larger PSNR and SSIM values compared with other algorithms at various noise levels in the experiment, and the MSE decreases by 0.0014–0.0532, the PSNR increases by 0.5090–4.0472 dB and the SSIM increases by 0.0230–0.5833. It is worth noting that when the standard deviation of Gaussian noise is 80, compared with the original algorithm and the algorithm proposed in Reference [3], the PSNR of the algorithm in this paper increases by 3.2243 and 1.6941 dB, respectively, and the SSIM increases by 0.5029 and 0.5762, respectively.
Combined with the previous qualitative analysis, it can be seen that the results detected by the algorithm in this paper have fewer noise points and more real edges, and the detection results are less affected by noise. Both the visual effect and objective evaluation index of the algorithm in this paper are superior to the traditional Sobel operator and the algorithm in Reference [3], indicating that the proposed algorithm has stronger anti-noise performance, and the superiority of the algorithm in this paper is more obvious in the high-noise environment.
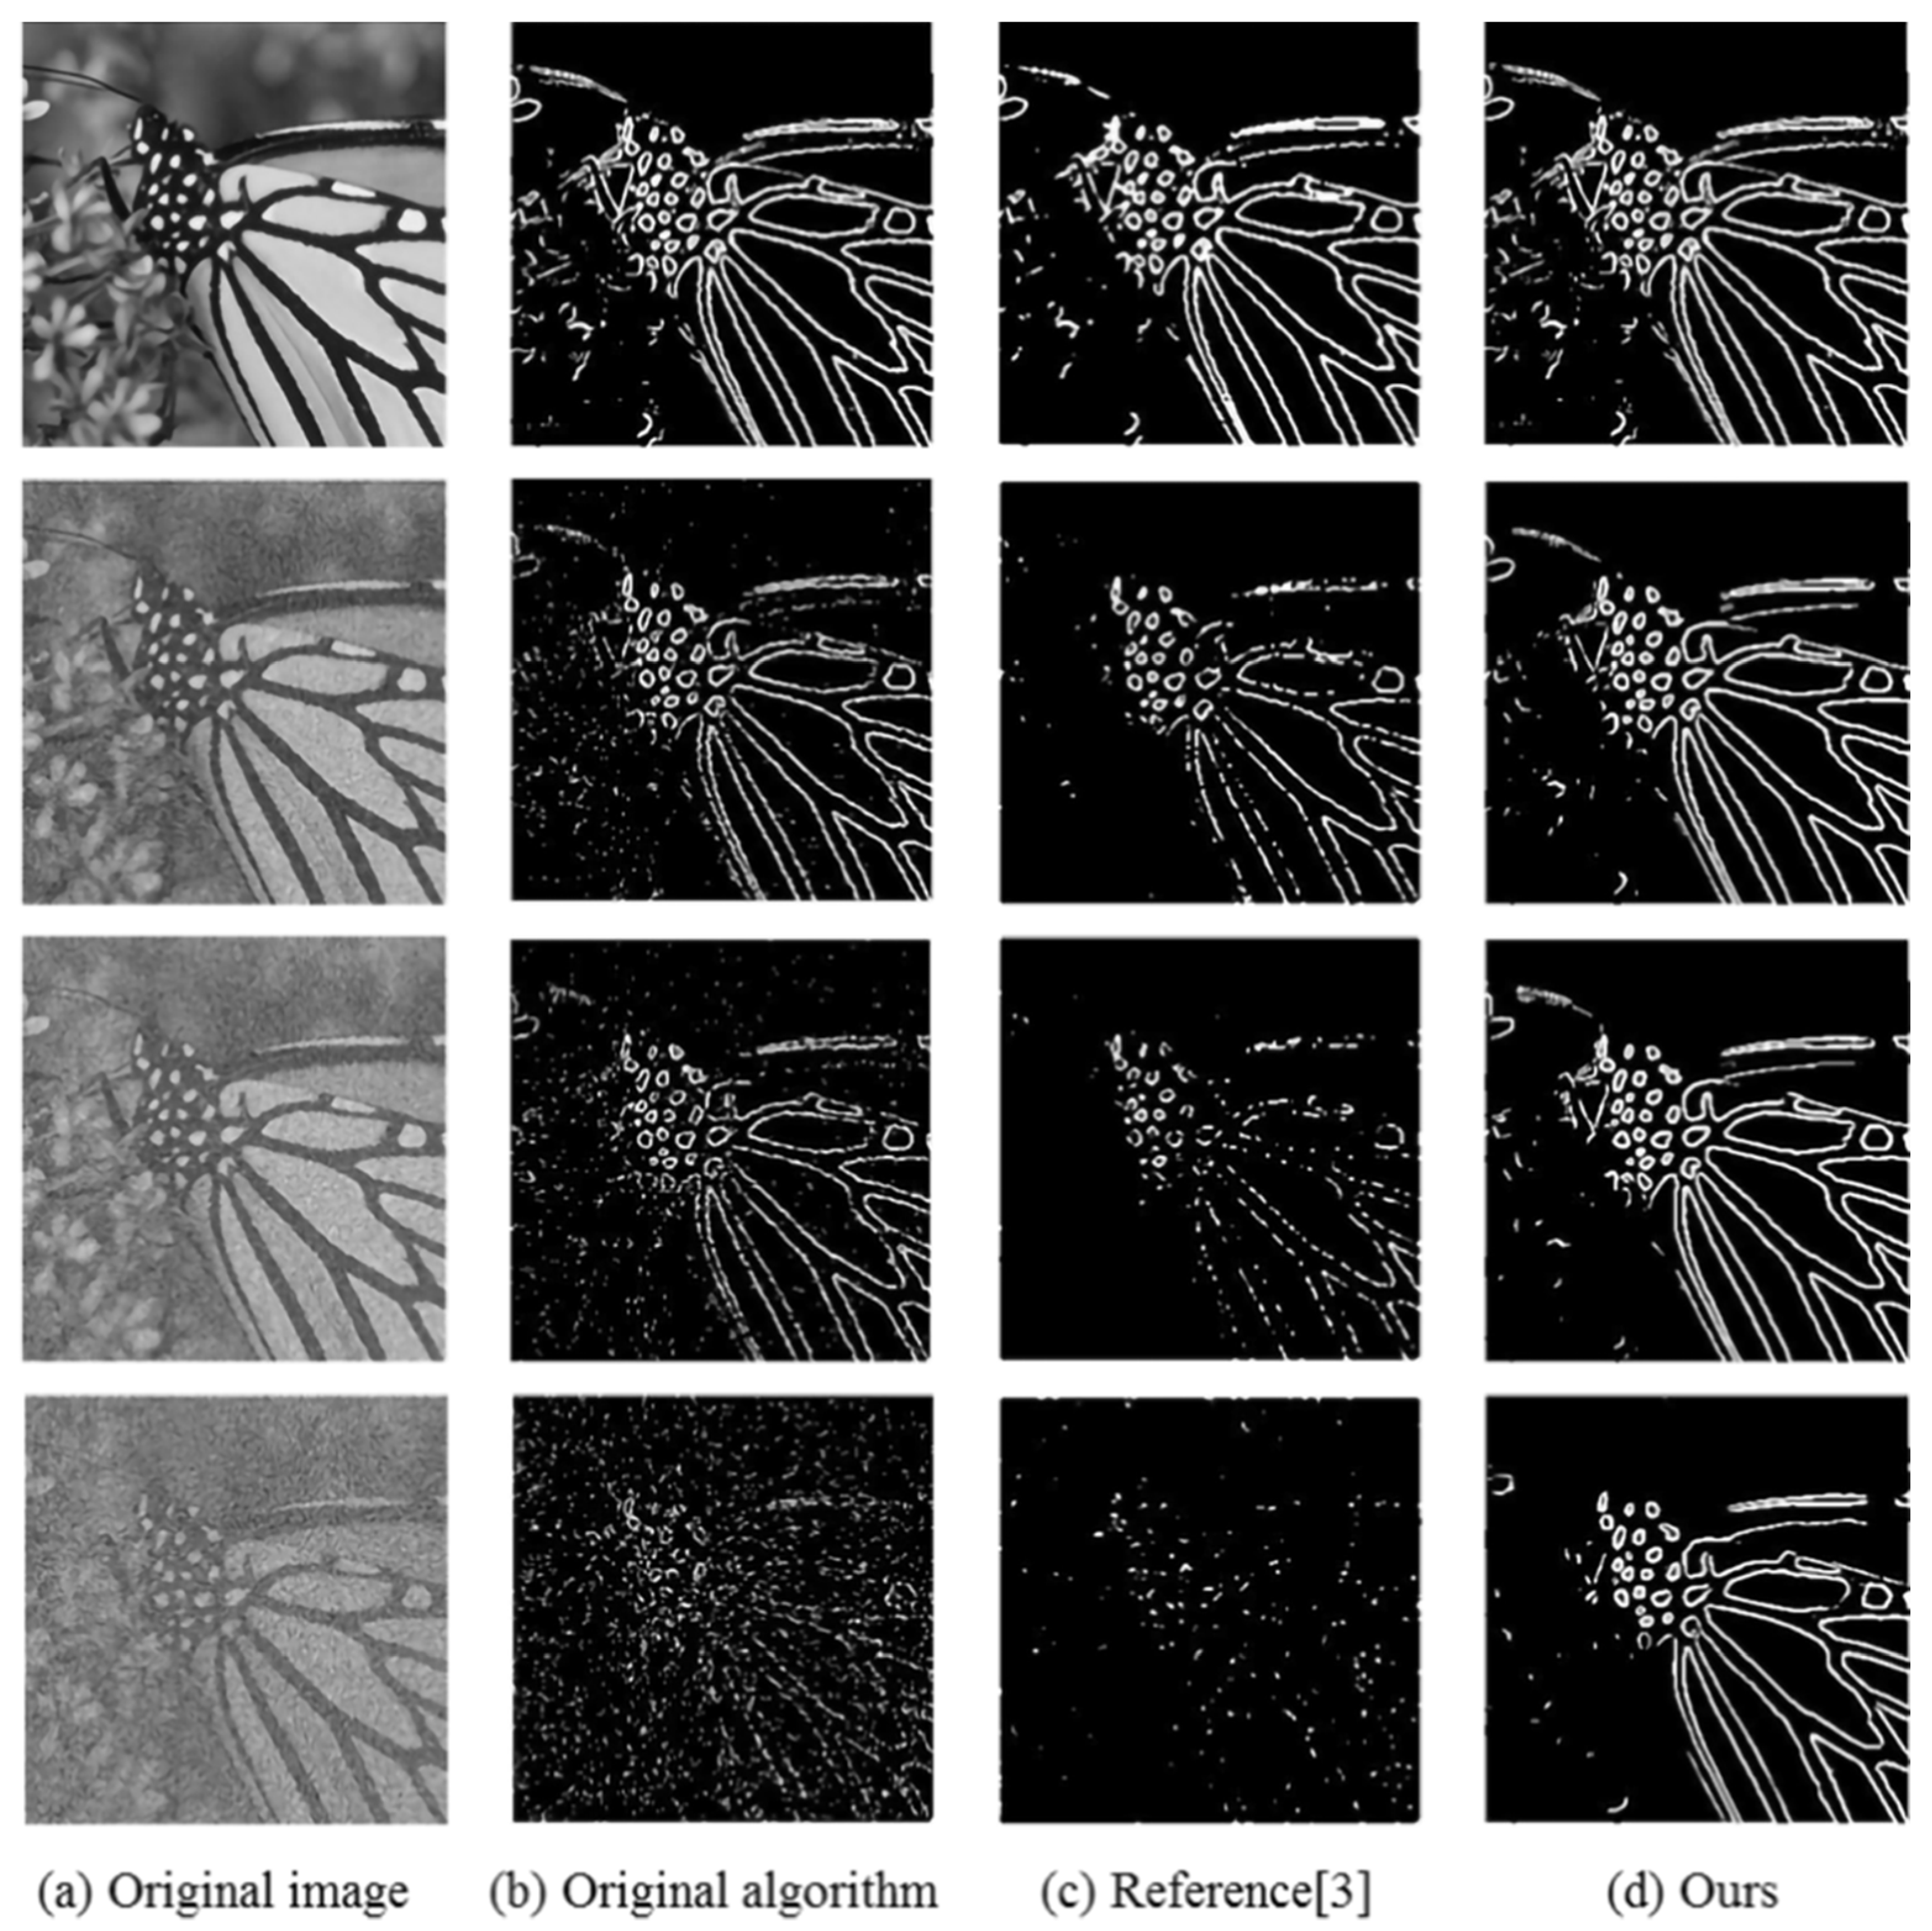
In order to eliminate the contingency of the experimental results, this paper also conducted experiments on the other two images. The detection results of the Monarch image are as follows: Figure 5 shows the detection results of the tested algorithms under different noise levels. Table 4, Table 5 and Table 6 show the values of MSE, PSNR, and SSIM of the tested algorithms, and Figure 6, Figure 7 and Figure 8 are the corresponding line graphs, respectively.
Similarly, in terms of visual effects, when Gaussian noise with standard deviations of 30 and 40 are added, compared with the traditional Sobel edge detection algorithm, there are fewer noise points in the detection results of the proposed algorithm, which indicates that the proposed algorithm has a stronger anti-noise performance. Compared with the algorithm in Reference [3], the edge detection results obtained by the proposed algorithm are clearer and more continuous, indicating that the proposed algorithm can preserve image edges better. In terms of objective evaluation indicators, the MSE of the proposed algorithm decreases by 0.0063–0.0800, the PSNR increases by 1.4580–4.2517 dB and the SSIM increases by 0.0287–0.5262. With the increase of noise intensity, the competitiveness of the algorithm in this paper is stronger.
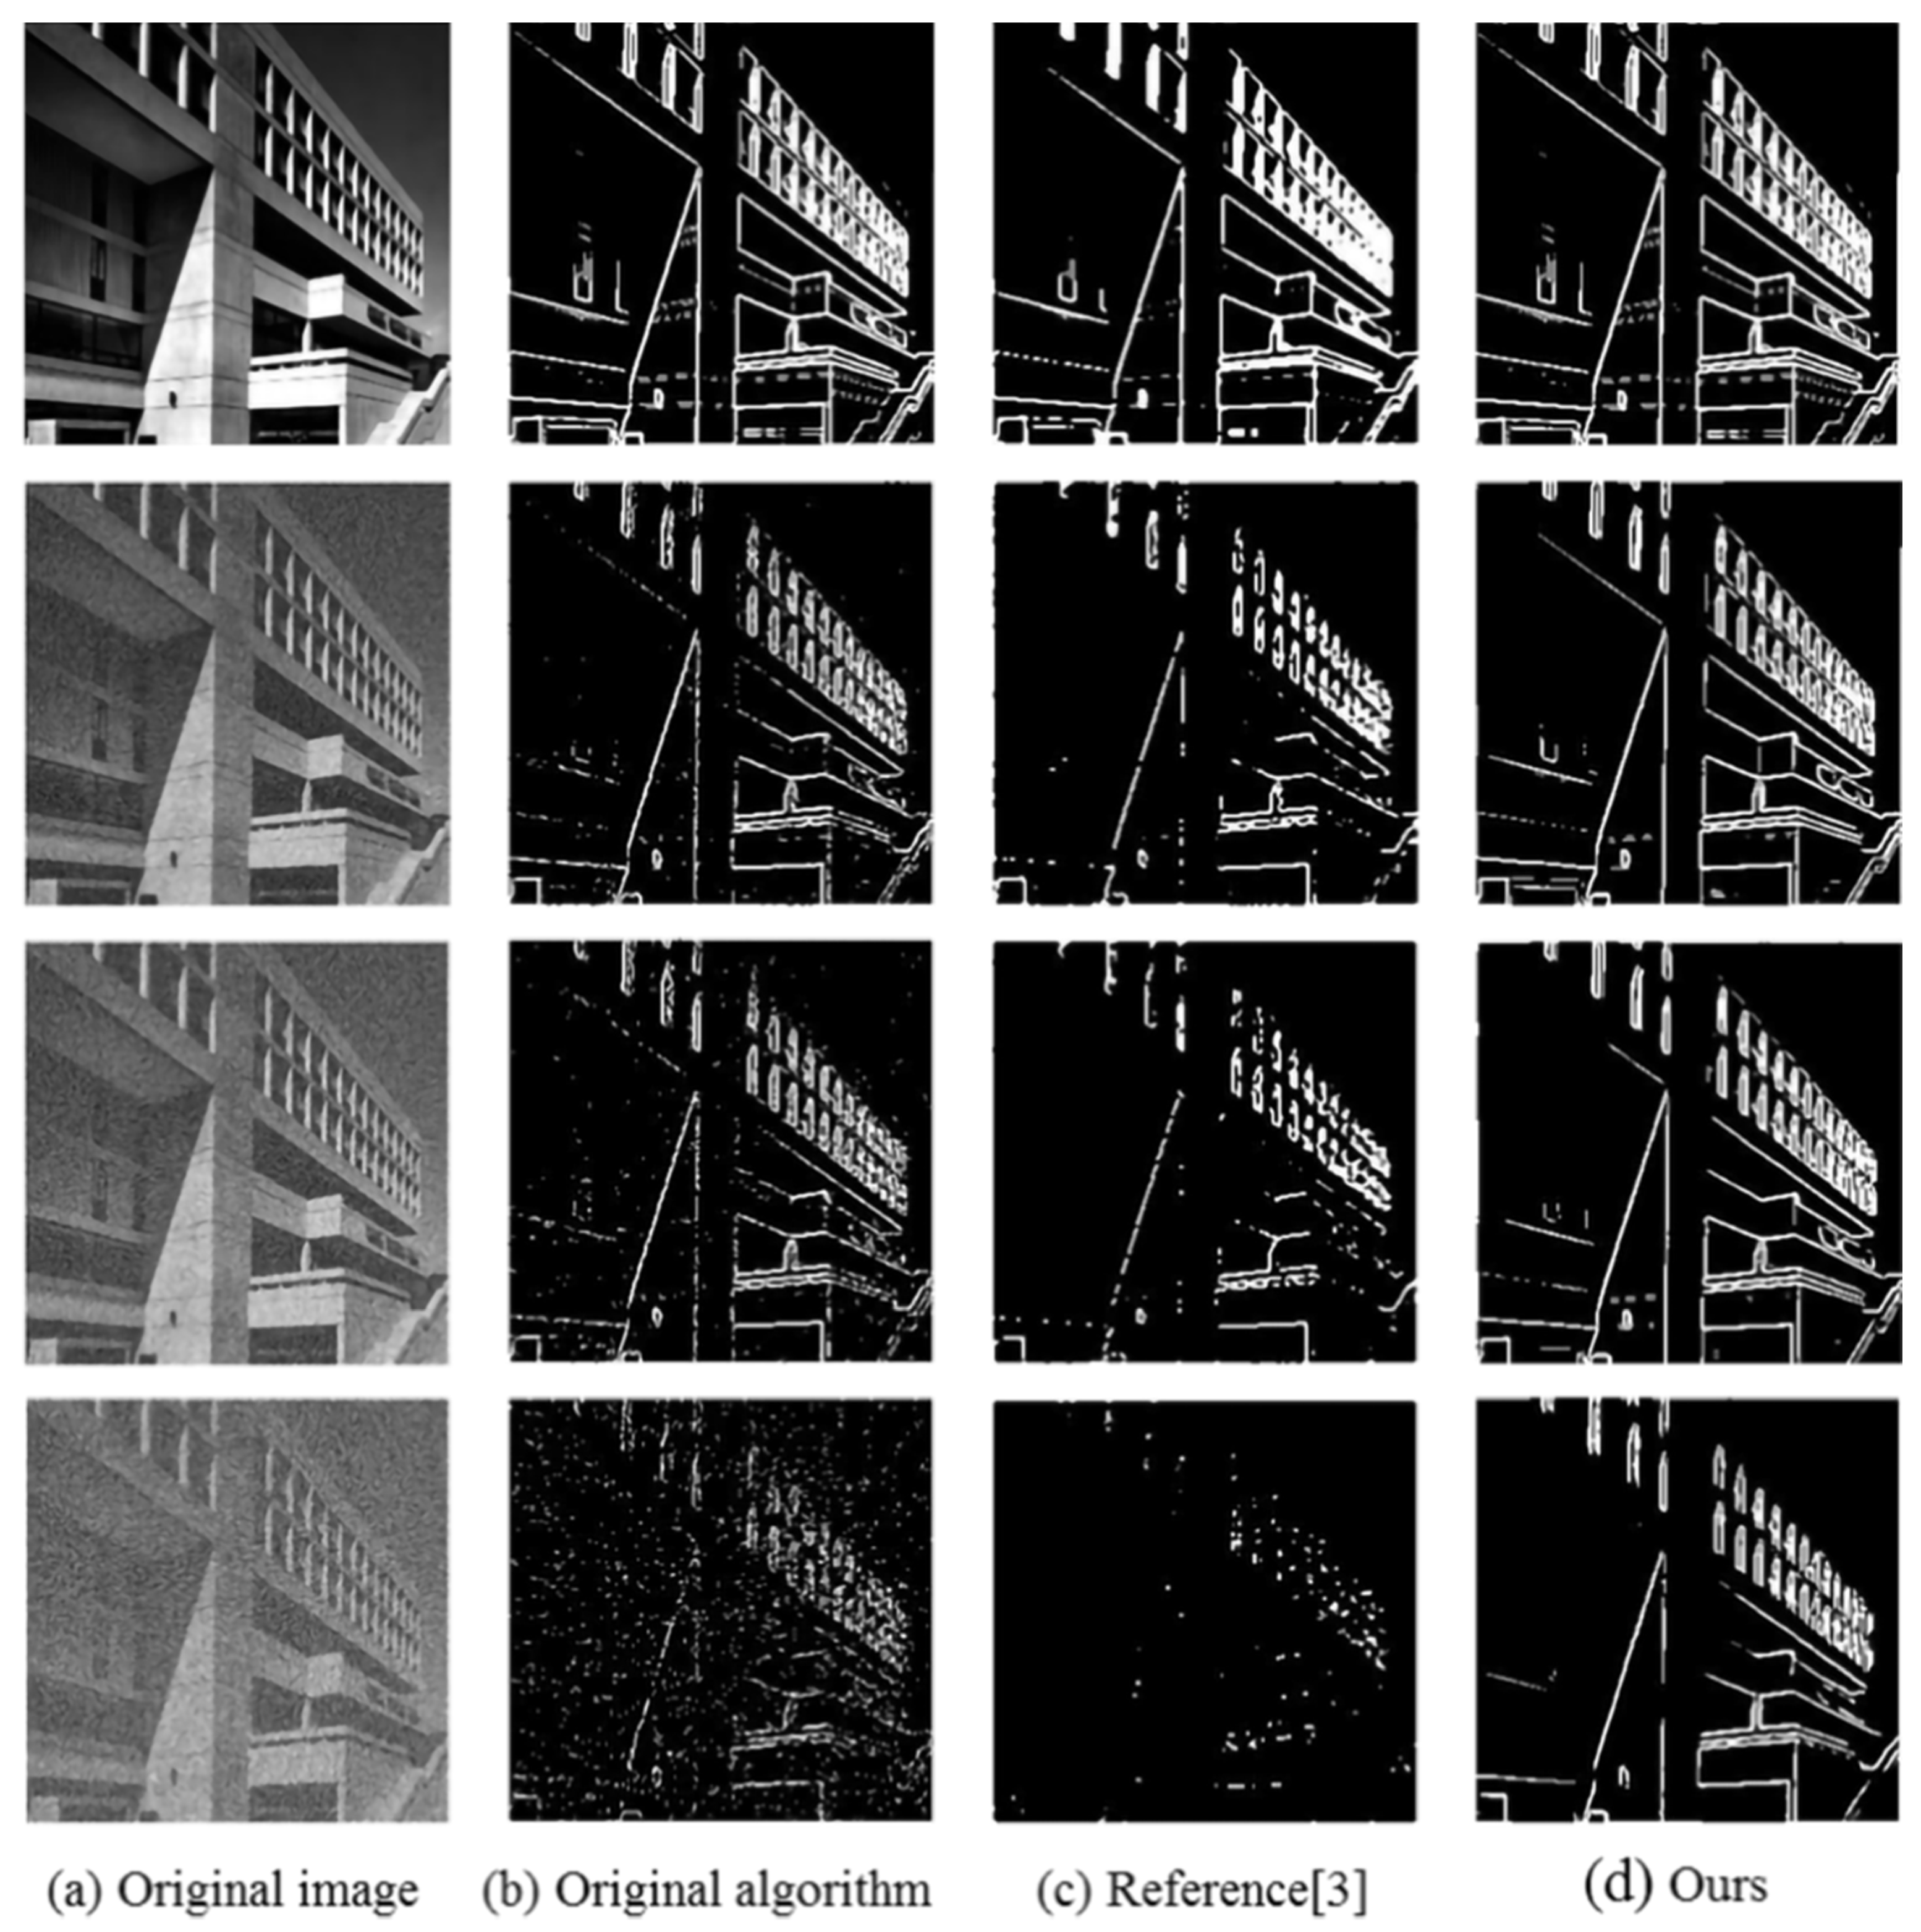
The edge detection results of the MIT image are as follows: Figure 9 shows the detection results of the tested algorithms under different noise levels. Table 7, Table 8 and Table 9 show the values of MSE, PSNR, and SSIM of the tested algorithms, and Figure 10, Figure 11 and Figure 12 are the corresponding line graphs, respectively.
In this experiment, compared with the other algorithms listed, the MSE of the proposed algorithm decreases by 0.0138–0.0633, the PSNR increases by 1.5558–4.2135 dB and the SSIM increases by 0.0663–0.3909.
The above experiments show that the proposed algorithm can effectively eliminate the influence of noise on edge detection and can retain the true edge of the image to a greater extent. The detection results are superior to other algorithms listed in this paper in terms of visual effect and objective evaluation index. The results are highly consistent after many comparative experiments.

5. Conclusions

The conventional Sobel edge detection operator can quickly and accurately extract the edge pixels of an image, which has been widely used in various image processing fields. However, when there is noise in the image, there will be many noise points in the detection results, which will affect the subsequent processing. In response to this problem, this paper proposes an improved algorithm, which combines WNNM image denoising with Sobel edge detection and utilizes the stable and excellent denoising ability of the WNNM image denoising algorithm at various noise levels to achieve the purpose of improving the anti-noise performance of the Sobel operator. The experimental results verify the effectiveness of the algorithm.
Compared with the conventional Sobel edge detection operator, the running time of the improved algorithm proposed in this paper increased. When Gaussian noise with a standard deviation of 20 is added, the running time of the three algorithms is showed in the Table 10 as follow:
The algorithm in this paper improves the anti-noise performance of the Sobel operator, and at the same time, the running time of the algorithm also increases to a certain extent. Improving the anti-noise performance of the operator and the running speed of the algorithm at the same time remains to be further studied.

Author Contributions

Conceptualization, R.T.; methodology, R.T.; software, R.T.; validation, R.T.; formal analysis, R.T., G.S.; investigation, R.T., X.L.; resources, R.T., B.Z.; data curation, R.T.; writing—original draft preparation, R.T.; writing—review and editing, R.T., G.S., X.L.; visualization, R.T.; supervision, G.S., B.Z.; project administration, G.S.; funding acquisition, G.S. All authors have read and agreed to the published version of the manuscript.

Funding

This work was supported by the National Natural Science Foundation of China (No. 61771262), Tianjin Science and Technology Major Project and Engineering (No. 18ZXRHNC00140) and Tianjin Key Laboratory of Optoelectronic Sensor and Sensor Network Technology.

Acknowledgments

The authors would like to thank all the editors and anonymous reviewers for their careful reading and insightful remarks.

Conflicts of Interest

The authors declare no conflict of interest.

References

  1. Liu, Y.; Xie, Z.; Liu, H. An Adaptive and Robust Edge Detection Method Based on Edge Proportion Statistics. IEEE Trans. Image Process. 2020, 29, 5206–5215. [Google Scholar] [CrossRef]
  2. Zhang, Y.; Han, X.; Zhang, H.; Zhao, L. Edge detection algorithm of image fusion based on improved Sobel operator. In Proceedings of the 2017 IEEE 3rd Information Technology and Mechatronics Engineering Conference (ITOEC), Chongqing, China, 3–5 October 2017; pp. 457–461. [Google Scholar] [CrossRef]
  3. Topno, P.; Murmu, G. An Improved Edge Detection Method based on Median Filter. In Proceedings of the 2019 Devices for Integrated Circuit (DevIC), Kalyani, West Bengal, India, 23–24 March 2019; pp. 378–381. [Google Scholar] [CrossRef]
  4. Yoon, J.; Lee, C. Edge Detection Using the Bhattacharyya Distance with Adjustable Block Space. Electron. Imaging 2020, 10, 349–362. [Google Scholar] [CrossRef]
  5. Chetia, R.; Boruah, S.M.B.; Sahu, P.P. Quantum image edge detection using improved Sobel mask based on NEQR. Quantum Inf. Process. 2020, 1, 21–39. [Google Scholar] [CrossRef]
  6. Sung, T.L.; Lee, H.J. Depth edge detection using edge-preserving filter and morphological operations. Int. J. Syst. Assur. Eng. Manag. 2020, 11, 812–817. [Google Scholar] [CrossRef]
  7. Xie, X. An improved industrial sub-pixel edge detection algorithm based on coarse and precise location. J. Ambient Intell Humaniz. Comput. 2020, 11, 2061–2070. [Google Scholar] [CrossRef]
  8. Raheja, S.; Kumar, A. Edge detection based on type-1 fuzzy logic and guided smoothening. Evol. Syst. 2019, 23, 349–360. [Google Scholar] [CrossRef]
  9. Shui, P.; Wang, F. Anti-Impulse-Noise Edge Detection via Anisotropic Morphological Directional Derivatives. IEEE Trans. Image Process. 2017, 26, 4962–4977. [Google Scholar] [CrossRef] [PubMed]
  10. Zheng, Z.; Zha, B.; Yuan, H.; Xuchen, Y.; Gao, Y.; Zhang, H. Adaptive Edge Detection Algorithm Based on Improved Grey Prediction Model. IEEE Access 2020, 8, 102165–102176. [Google Scholar] [CrossRef]
  11. Li, K.; Tian, Y.; Wang, B.; Qi, Z.; Wang, Q. Bi-Directional Pyramid Network for Edge Detection. Electronics 2021, 10, 329. [Google Scholar] [CrossRef]
  12. Mittal, M.; Verma, A.; Kaur, I.; Kaur, B.; Sharma, M.; Goyal, L.M.; Roy, S.; Kim, T.H. An Efficient Edge Detection Approach to Provide Better Edge Connectivity for Image Analysis. IEEE Access 2019, 7, 33240–33255. [Google Scholar] [CrossRef]
  13. Hou, L.; Qin, Y.; Zheng, H.; Pan, Z.; Mei, J.; Hu, Y. Hybrid High-Order and Fractional-Order Total Variation with Nonlocal Regularization for Compressive Sensing Image Reconstruction. Electronics 2021, 10, 150. [Google Scholar] [CrossRef]
  14. Oh, T.; Matsushita, Y.; Tai, Y.; Kweon, I.S. Fast Randomized Singular Value Thresholding for Low-Rank Optimization. IEEE Trans. Pattern Anal. Mach. Intell. 2018, 40, 376–391. [Google Scholar] [CrossRef] [Green Version]
  15. Candès, E.; Recht, B. Exact matrix completion via convex optimization. Commun. ACM 2012, 55, 111–119. [Google Scholar] [CrossRef] [Green Version]
  16. Yang, H.; Park, Y.; Yoon, J.; Jeong, B. An Improved Weighted Nuclear Norm Minimization Method for Image Denoising. IEEE Access 2019, 7, 97919–97927. [Google Scholar] [CrossRef]
  17. Gu, S.; Xie, Q.; Meng, D.; Zuo, W.; Feng, X.; Zhang, L. Weighted Nuclear Norm Minimization and Its Applications to Low Level Vision. Int. J. Comput. Vis. 2017, 121, 183–208. [Google Scholar] [CrossRef]
  18. Gu, S.; Zhang, L.; Zuo, W.; Feng, X. Weighted Nuclear Norm Minimization with Application to Image Denoising. In Proceedings of the 2014 IEEE Conference on Computer Vision and Pattern Recognition, Columbus, OH, USA, 23–28 June 2014; pp. 2862–2869. [Google Scholar] [CrossRef] [Green Version]
  19. Tang, J.; Wang, Y.; Huang, C.; Liu, H.; Al-Nabhan, N. Image edge detection based on singular value feature vector and gradient operator. Math. Biosci. Eng. 2020, 17, 3721–3735. [Google Scholar] [CrossRef]
Figure 1. Detection results of the Cameraman image by the tested algorithms at different noise levels. (a) Experimental image, and Gaussian noises with standard deviations of 0, 30, 40 and 80 are added, respectively; (b) detection result of the traditional Sobel operator; (c) detection result of the algorithm proposed in Reference [3]; (d) detection result of the algorithm in this paper.
Electronics 10 00655 g001
Figure 2. MSE line chart of the three algorithms for the Cameraman image.
Electronics 10 00655 g002
Figure 3. PSNR line chart of the three algorithms for the Cameraman image.
Electronics 10 00655 g003
Figure 4. SSIM line chart of the three algorithms for the Cameraman image.
Electronics 10 00655 g004
Figure 5. Detection results of the Monarch image by the tested algorithms at different noise levels. (a) Experimental image, and Gaussian noises with standard deviations of 0, 30, 40 and 80 are added, respectively; (b) detection result of the traditional Sobel operator; (c) detection result of the algorithm proposed in Reference [3]; (d) detection result of the algorithm in this paper.
Electronics 10 00655 g005
Figure 6. MSE line chart of the three algorithms for the Monarch image.
Electronics 10 00655 g006
Figure 7. PSNR line chart of the three algorithms for the Monarch image.
Electronics 10 00655 g007
Figure 8. SSIM line chart of the three algorithms for the Monarch image.
Electronics 10 00655 g008
Figure 9. Detection results of the MIT image by the tested algorithms at different noise levels. (a) Experimental image, and Gaussian noises with standard deviations of 0, 30, 40 and 80 are added, respectively; (b) detection result of the traditional Sobel operator; (c) detection result of the algorithm proposed in Reference [3]; (d) detection result of the algorithm in this paper.
Electronics 10 00655 g009
Figure 10. MSE line chart of the three algorithms for the MIT image.
Electronics 10 00655 g010
Figure 11. PSNR line chart of the three algorithms for the MIT image.
Electronics 10 00655 g011
Figure 12. SSIM line chart of the three algorithms for the MIT image.
Electronics 10 00655 g012
Table 1. Mean square error (MSE) of the three algorithms for the Cameraman image.
SigmaOriginal AlgorithmReference [3]Ours
100.01310.02960.0117
200.03170.03660.0175
300.03810.04280.0271
400.05290.04700.0275
500.06880.05630.0381
600.08550.06240.0401
700.09510.06650.0467
800.10150.07140.0483
Table 2. Peak signal-to-noise ratio (SNR) of the three algorithms for the Cameraman image.
SigmaOriginal AlgorithmReference [3]Ours
1018.824915.286719.3339
2014.984214.359917.5616
3014.159813.687015.6777
4012.766513.274615.6097
5011.621112.498014.1871
6010.532012.049013.9669
7010.218511.773213.3104
809.934011.464213.1583
Table 3. Structural similarity index metric (SIM) of the three algorithms for the Cameraman image.
SigmaOriginal AlgorithmReference [3]Ours
100.92040.81420.9434
200.87020.78740.9128
300.79880.72090.8771
400.63410.59840.8695
500.52330.51810.8457
600.39610.32750.8407
700.35860.25170.8350
800.31150.23820.8144
Table 4. MSE of the three algorithms for the Monarch image.
SigmaOriginal AlgorithmReference [3]Ours
100.02200.04180.0157
200.04300.04890.0292
300.06590.06110.0353
400.08060.07400.0401
500.10180.08120.0507
600.11450.08500.0520
700.13760.09570.0588
800.14010.10200.0601
Table 5. PSNR of the three algorithms for the Monarch image.
SigmaOriginal AlgorithmReference [3]Ours
1016.576413.782718.0344
2013.673313.105615.3530
3011.810012.138114.5241
4010.939611.310013.9721
509.921510.897312.9486
609.405310.714912.8442
708.622410.194812.3023
808.53139.918412.2118
Table 6. SSIM of the three algorithms for the Monarch image.
SigmaOriginal AlgorithmReference [3]Ours
100.86400.72170.8927
200.75510.67280.8204
300.63800.60320.7964
400.50440.51620.7778
500.34930.40080.7334
600.30710.27090.7313
700.18790.23410.7069
800.17520.19310.7014
Table 7. MSE of the three algorithms for the MIT image.
SigmaOriginal AlgorithmReference [3]Ours
100.03200.04820.0182
200.05780.05620.0260
300.07770.07180.0385
400.08850.08250.0512
500.11150.08650.0533
600.11740.09860.0554
700.12640.10270.0719
800.13880.11840.0755
Table 8. PSNR of the three algorithms for the MIT image.
SigmaOriginal AlgorithmReference [3]Ours
1014.943013.174317.3878
2012.375312.508415.8518
3011.099511.435314.1465
4010.526810.840512.9068
509.533110.630612.7321
609.296410.064012.5612
708.98049.877111.4329
808.58269.270911.2189
Table 9. SSIM of the three algorithms for the MIT image.
SigmaOriginal AlgorithmReference [3]Ours
100.82080.69210.8871
200.71360.64580.8511
300.63450.58330.7908
400.55550.53600.7322
500.49390.44260.7275
600.37900.38510.7142
700.29970.33200.6592
800.25100.26230.6419
Table 10. Running time of the three algorithms.
ImagesOriginal AlgorithmReference [3]Ours
Cameraman2.1110 s3.4935 s80.5785 s
Monarch2.1198 s3.6207 s80.8722 s
MIT2.2736 s3.7955 s79.2278 s
Publisher’s Note: MDPI stays neutral with regard to jurisdictional claims in published maps and institutional affiliations.

