
Intervention of Artificial Neural Network with an Improved Activation Function to Predict the Performance and Emission Characteristics of a Biogas Powered Dual Fuel Engine

 , , and
Abstract
:1. Introduction
Motivating Factor for This Research Work
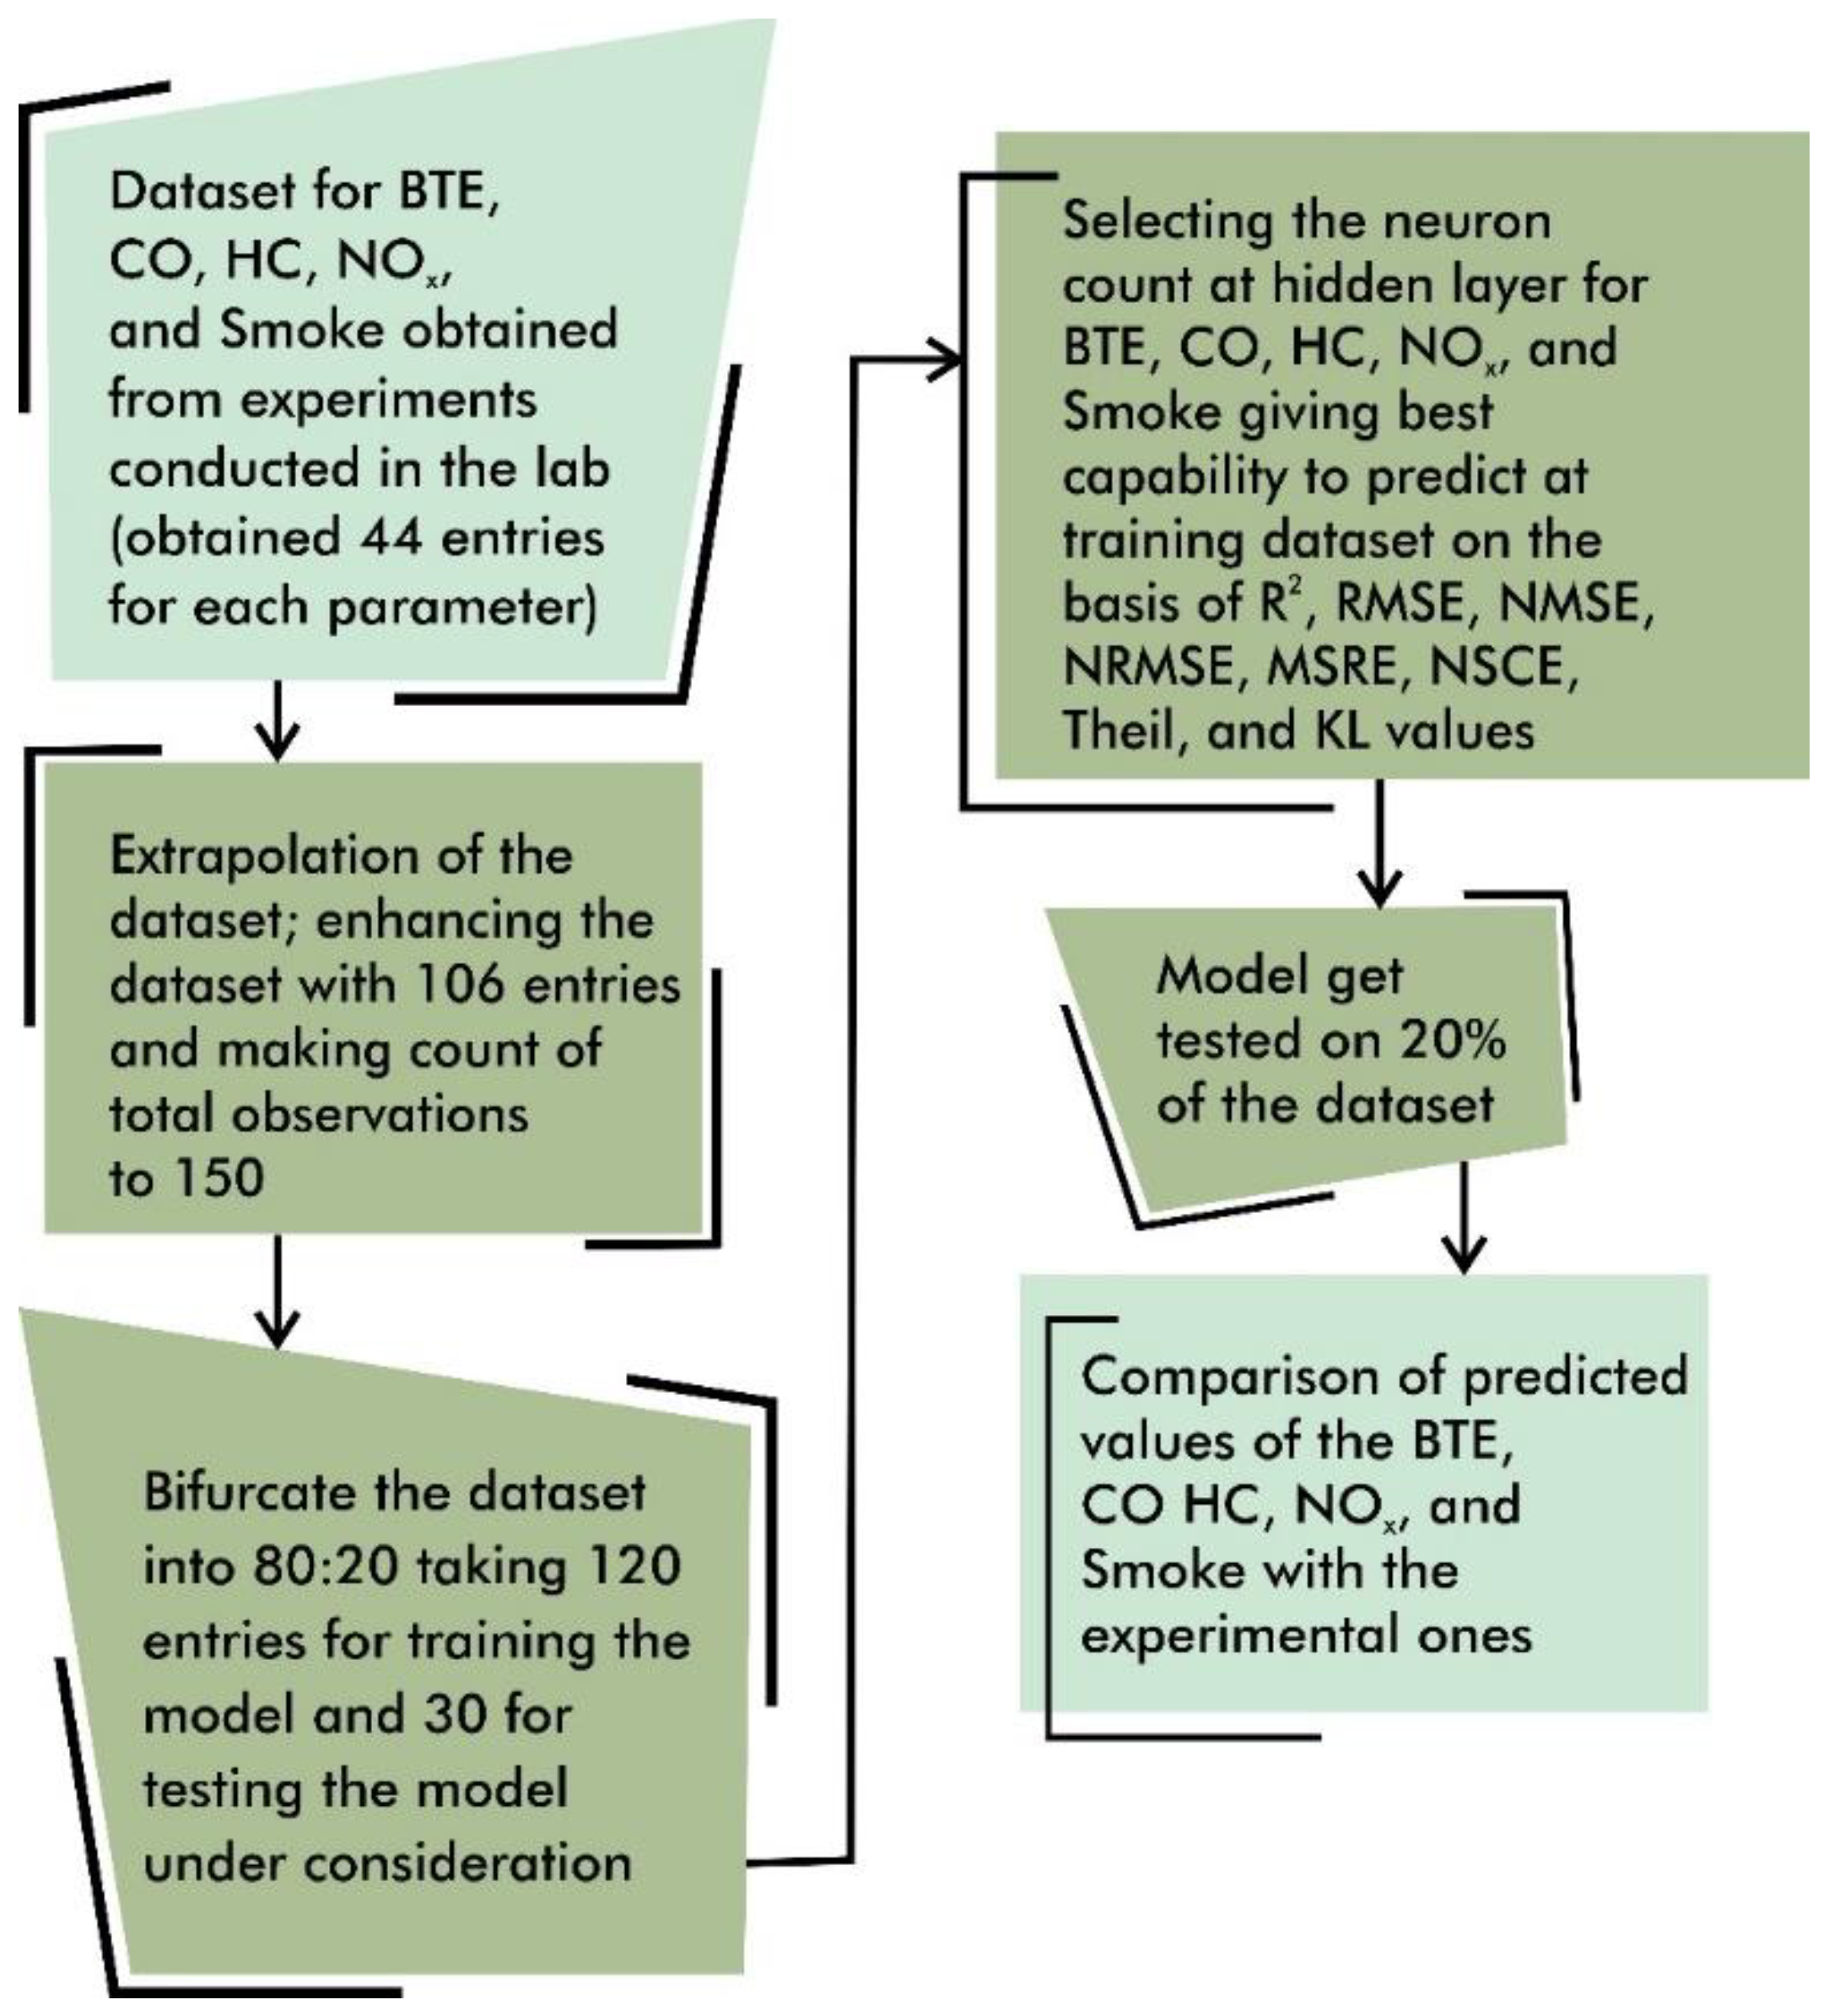
2. Materials and Methods
Experimental Setup
3. Application of Artificial Neural Network (ANN)
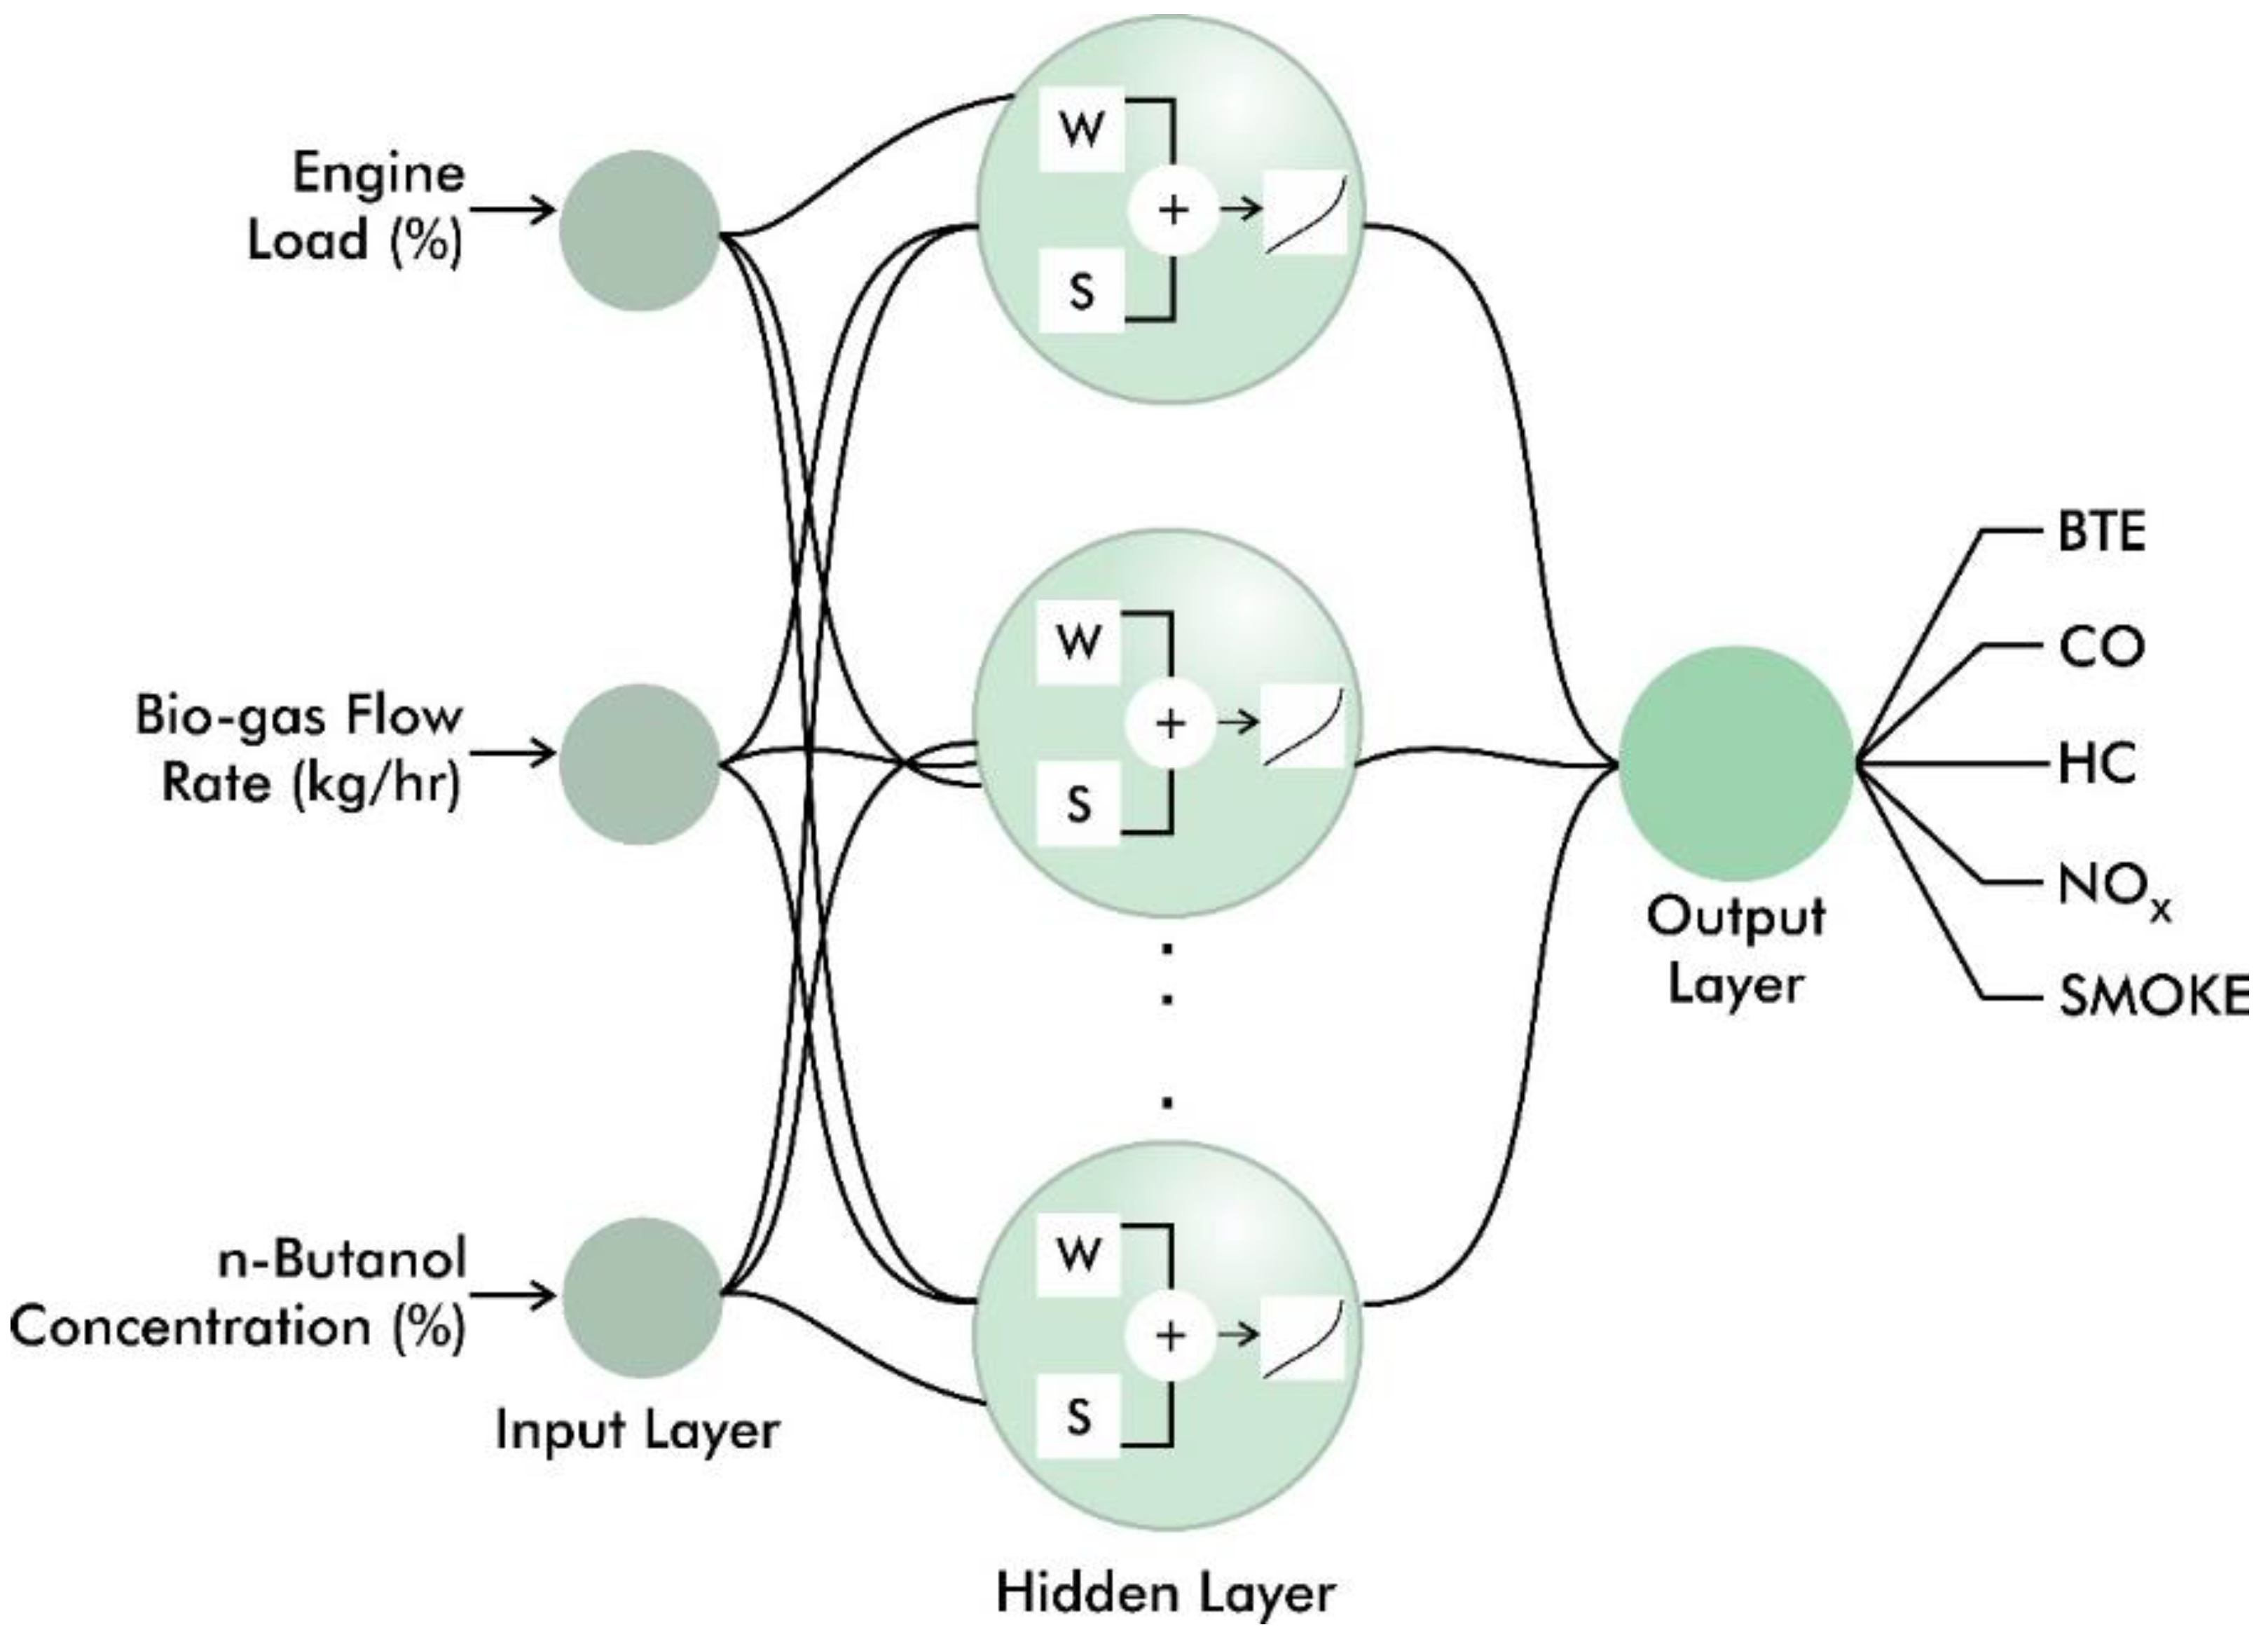
3.1. Back Propagation and ANN for Current Study
3.2. Swish Activation Function and Its Importance
3.3. Count of Neurons for the Hidden Layer in ANN
3.4. Selection among Sigmoid and Swish
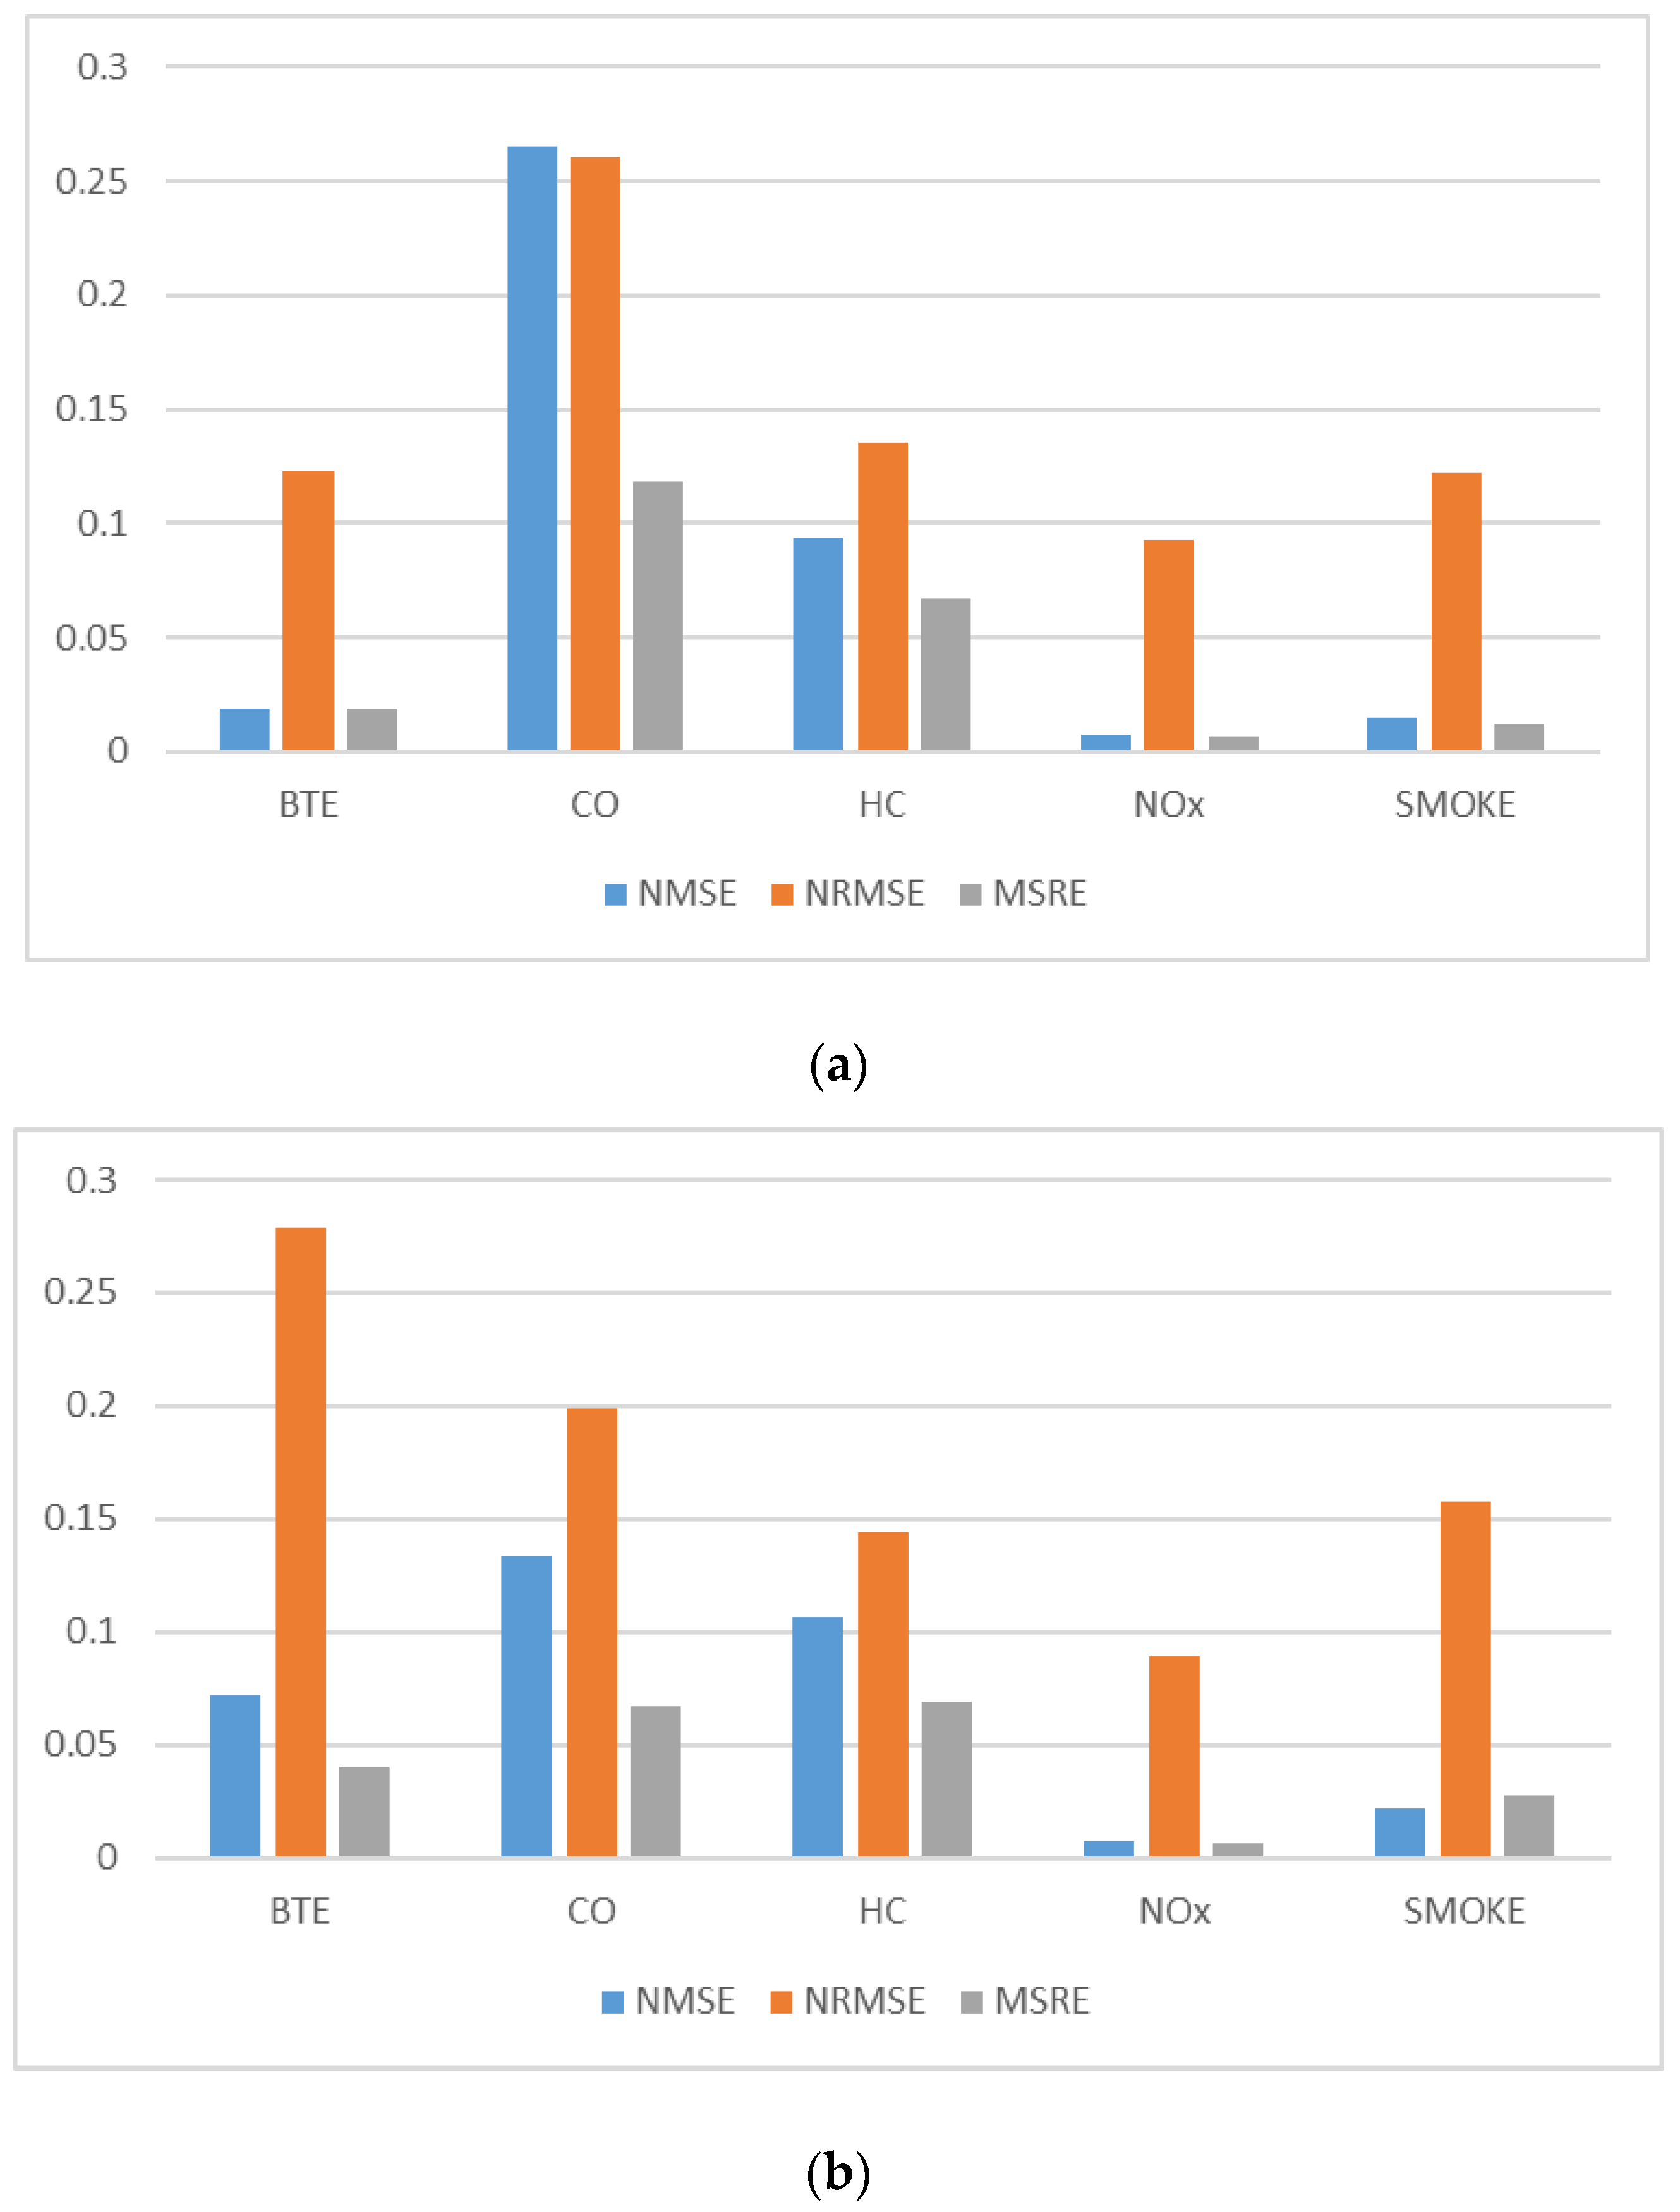
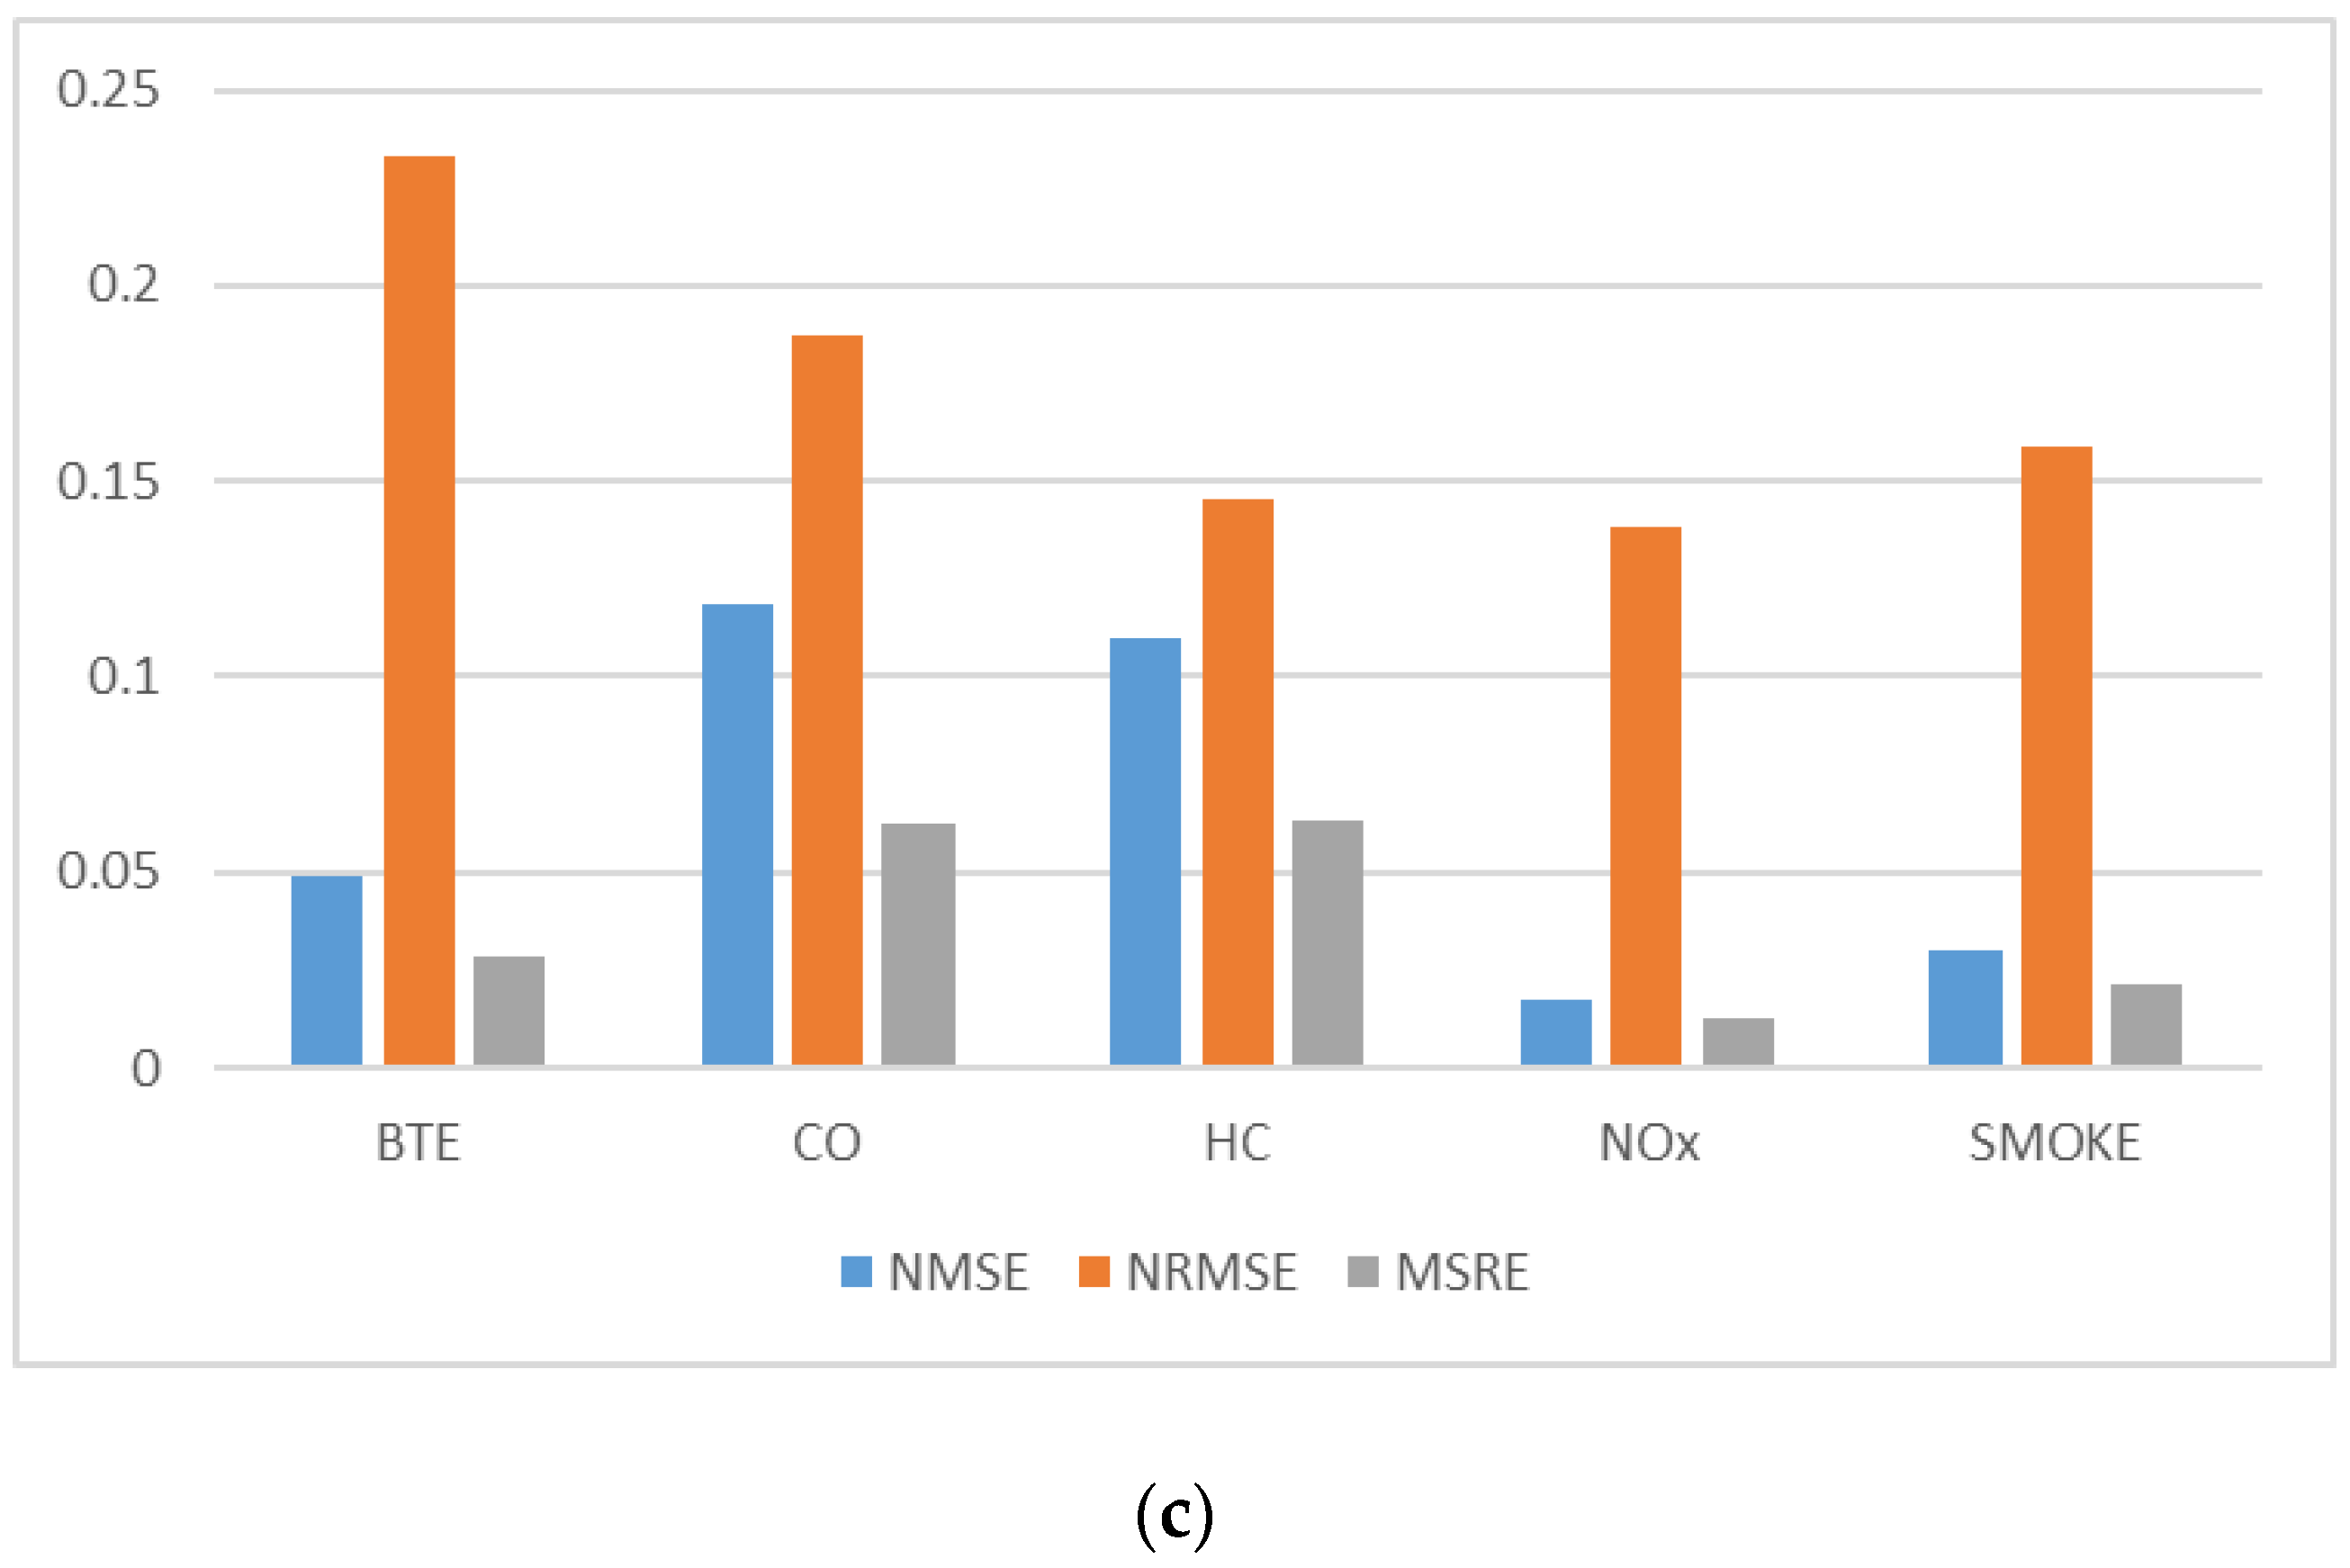
4. Model Evaluation
4.1. Metrics for Evaluation
4.2. Solver Architecture
4.3. Uncertainty Analysis for the Proposed Model
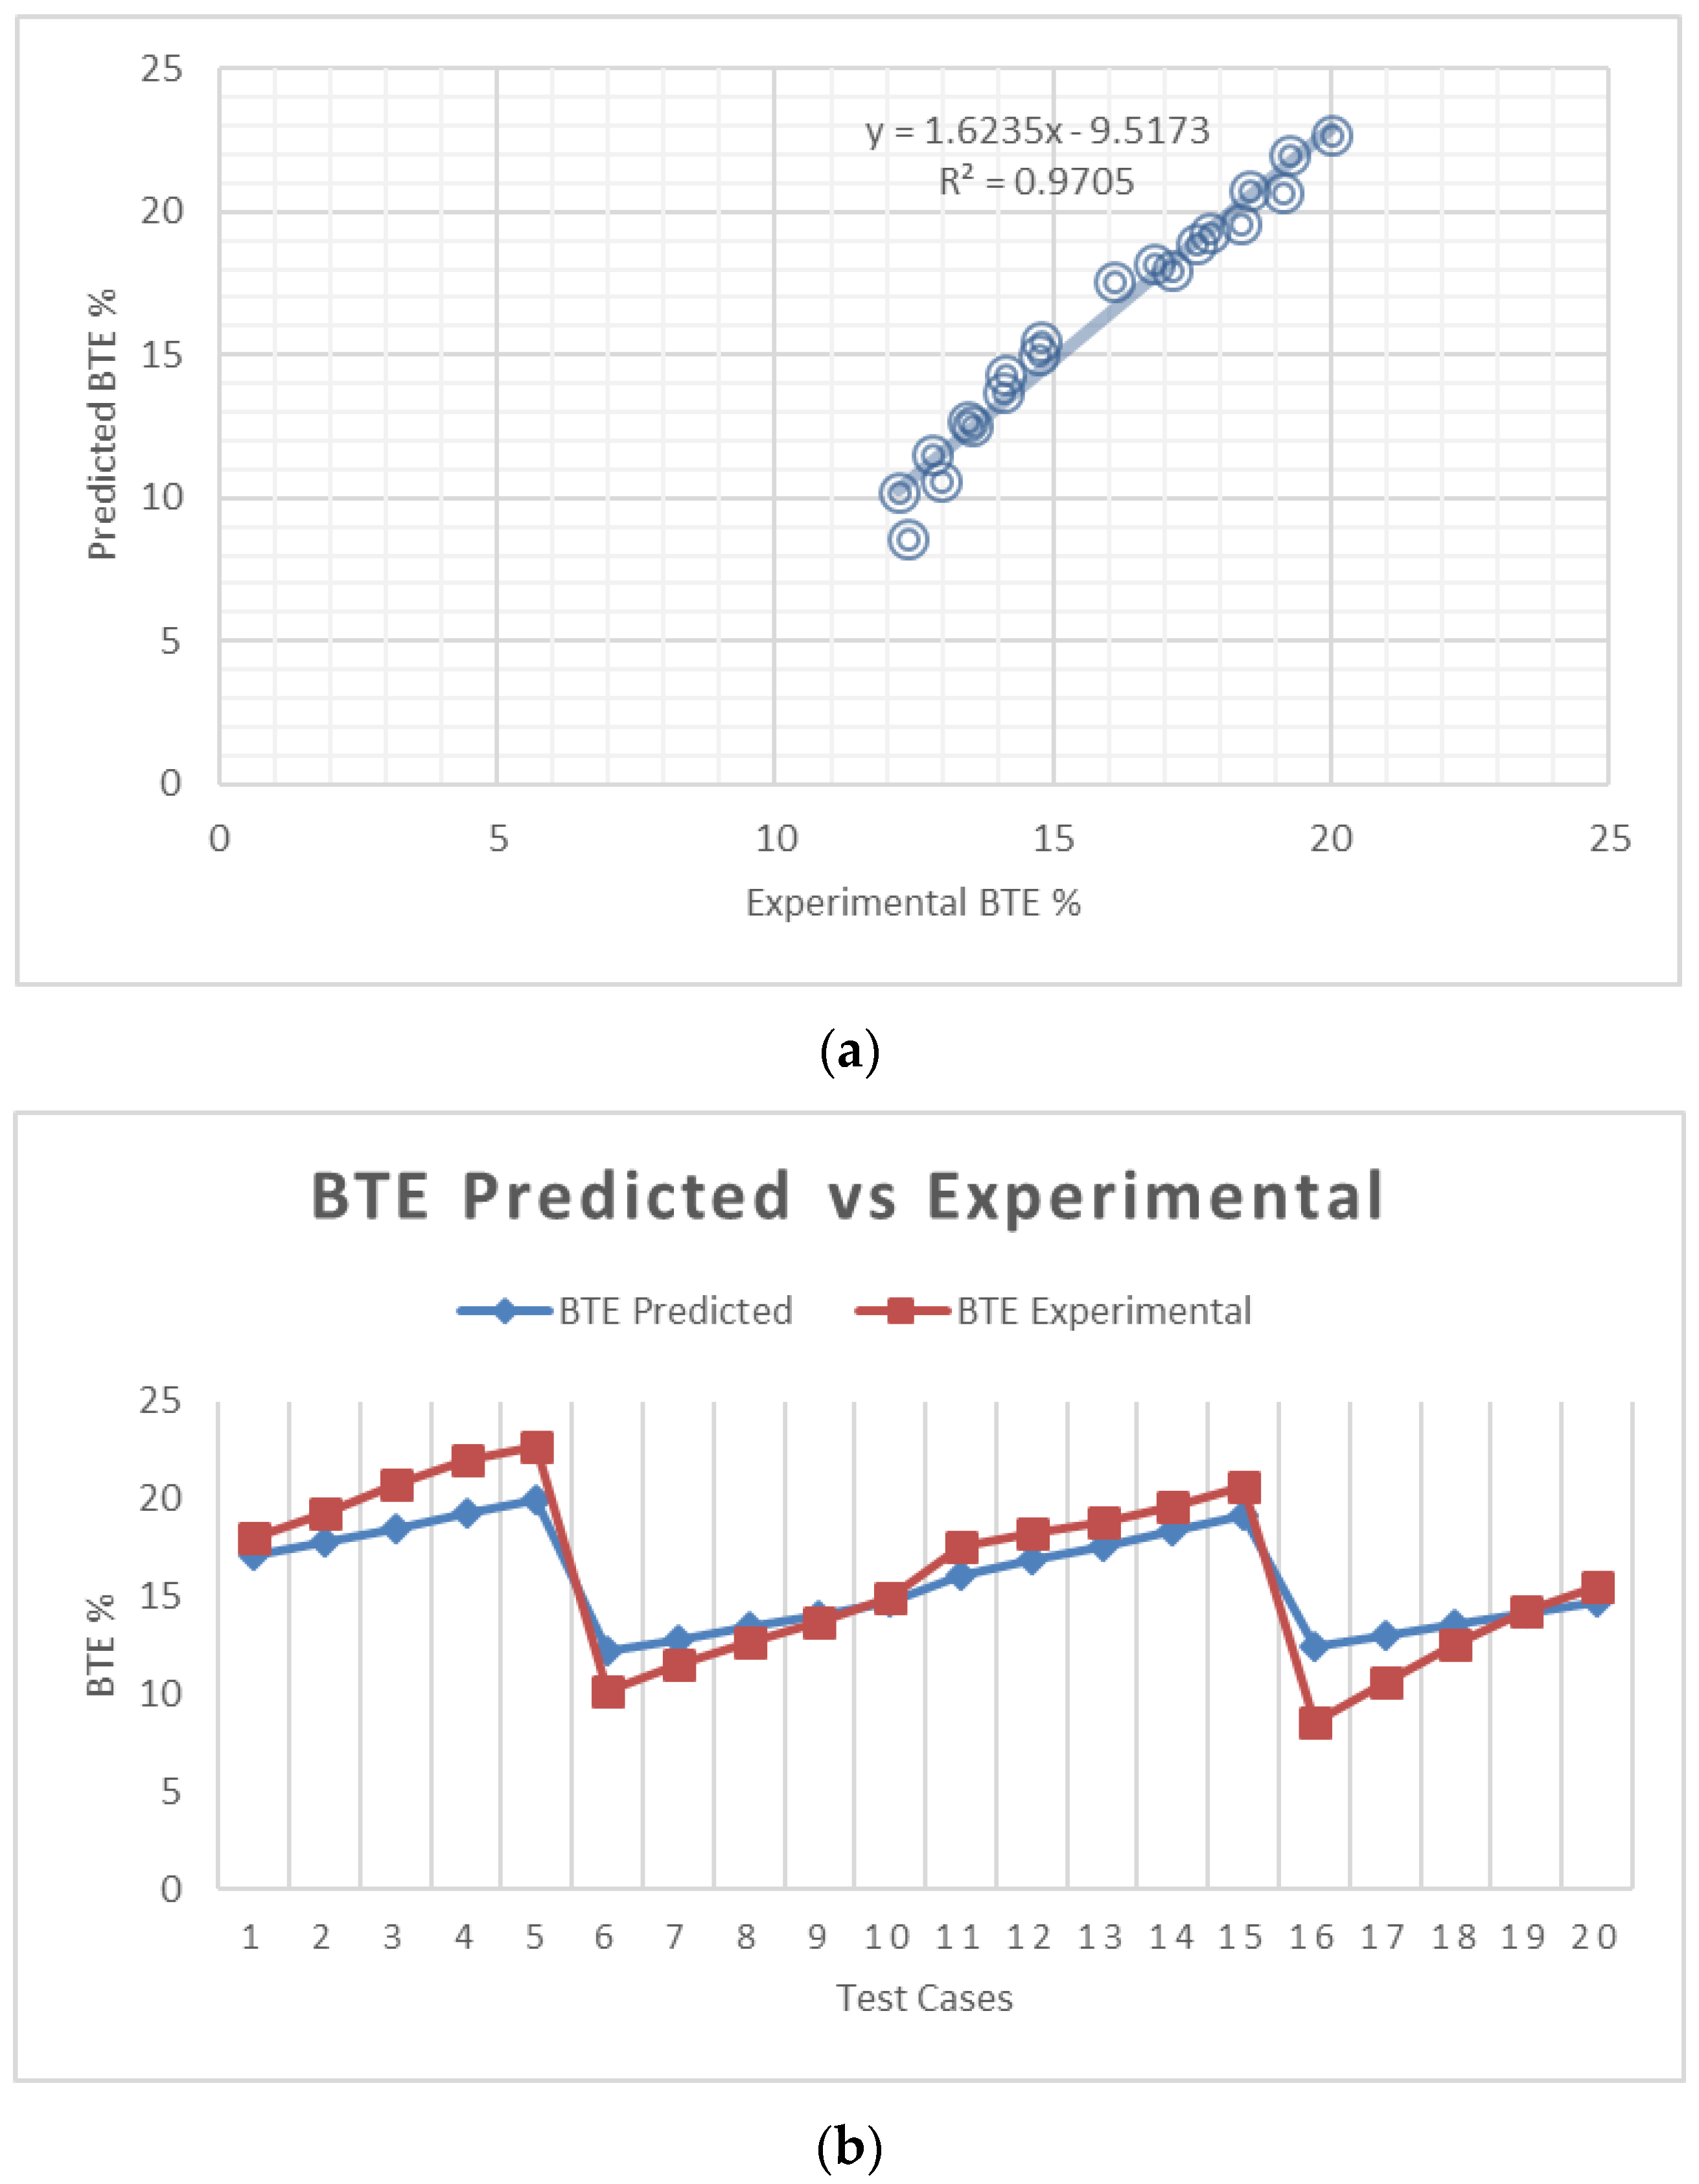
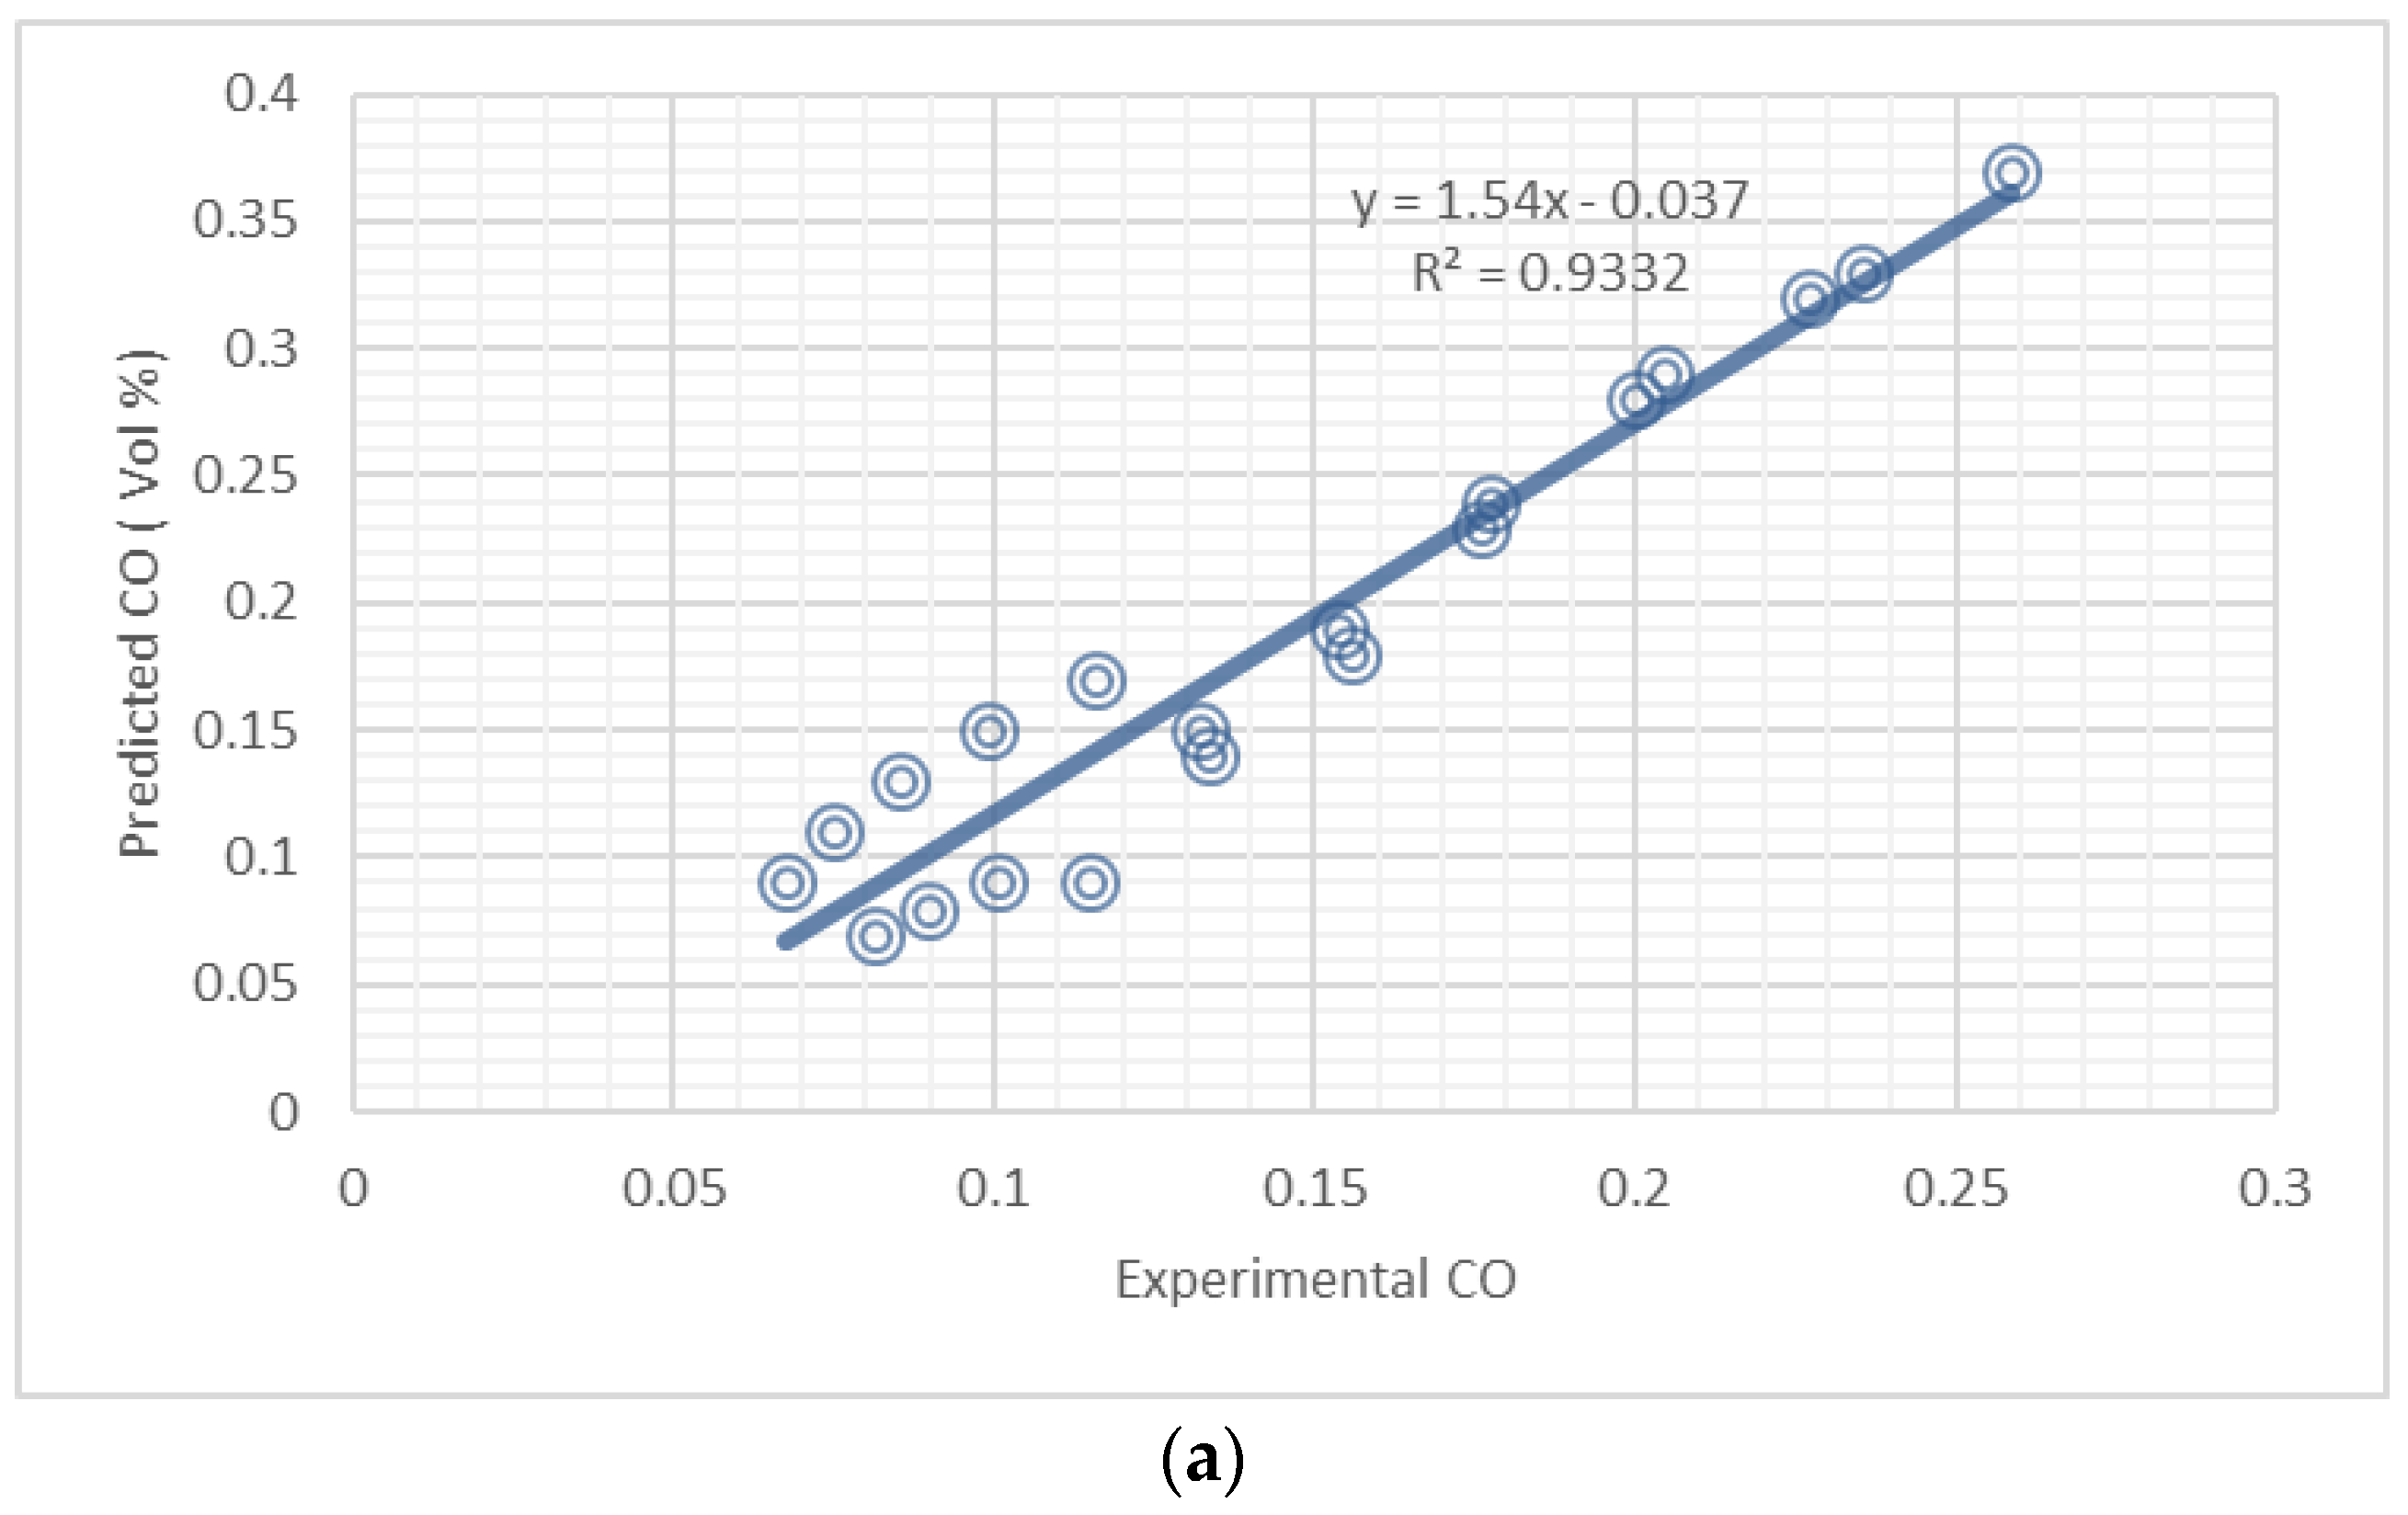
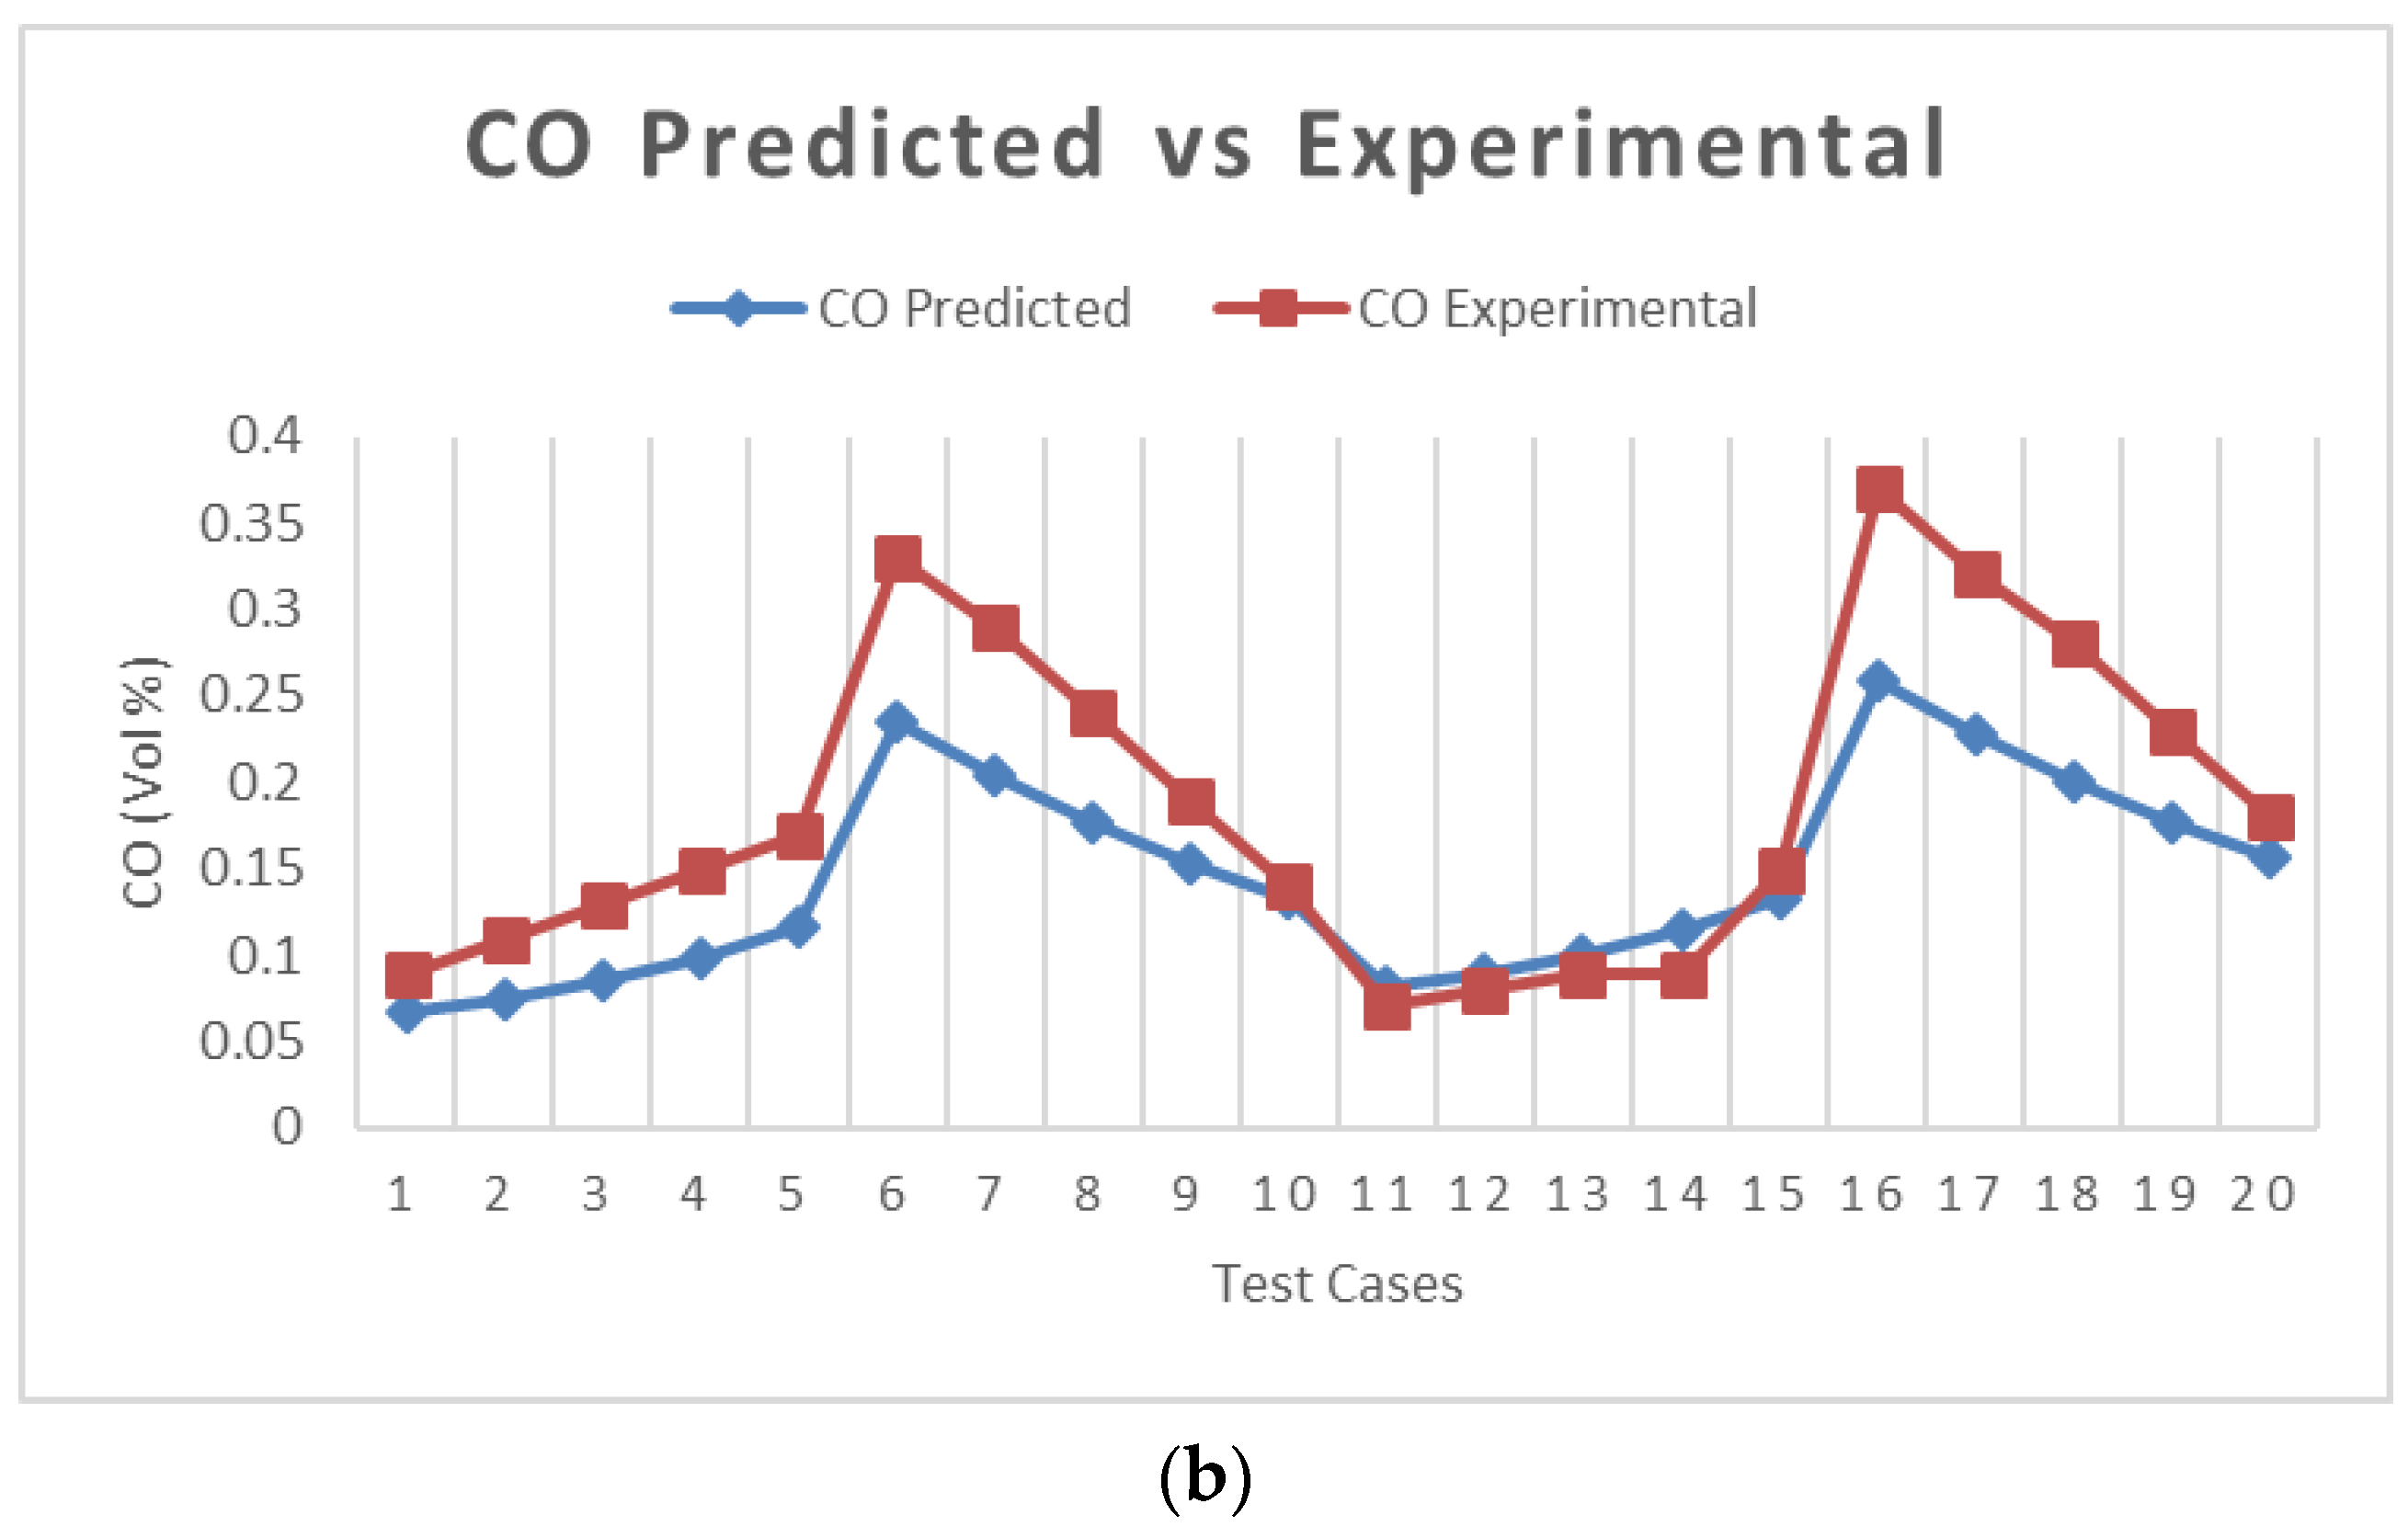
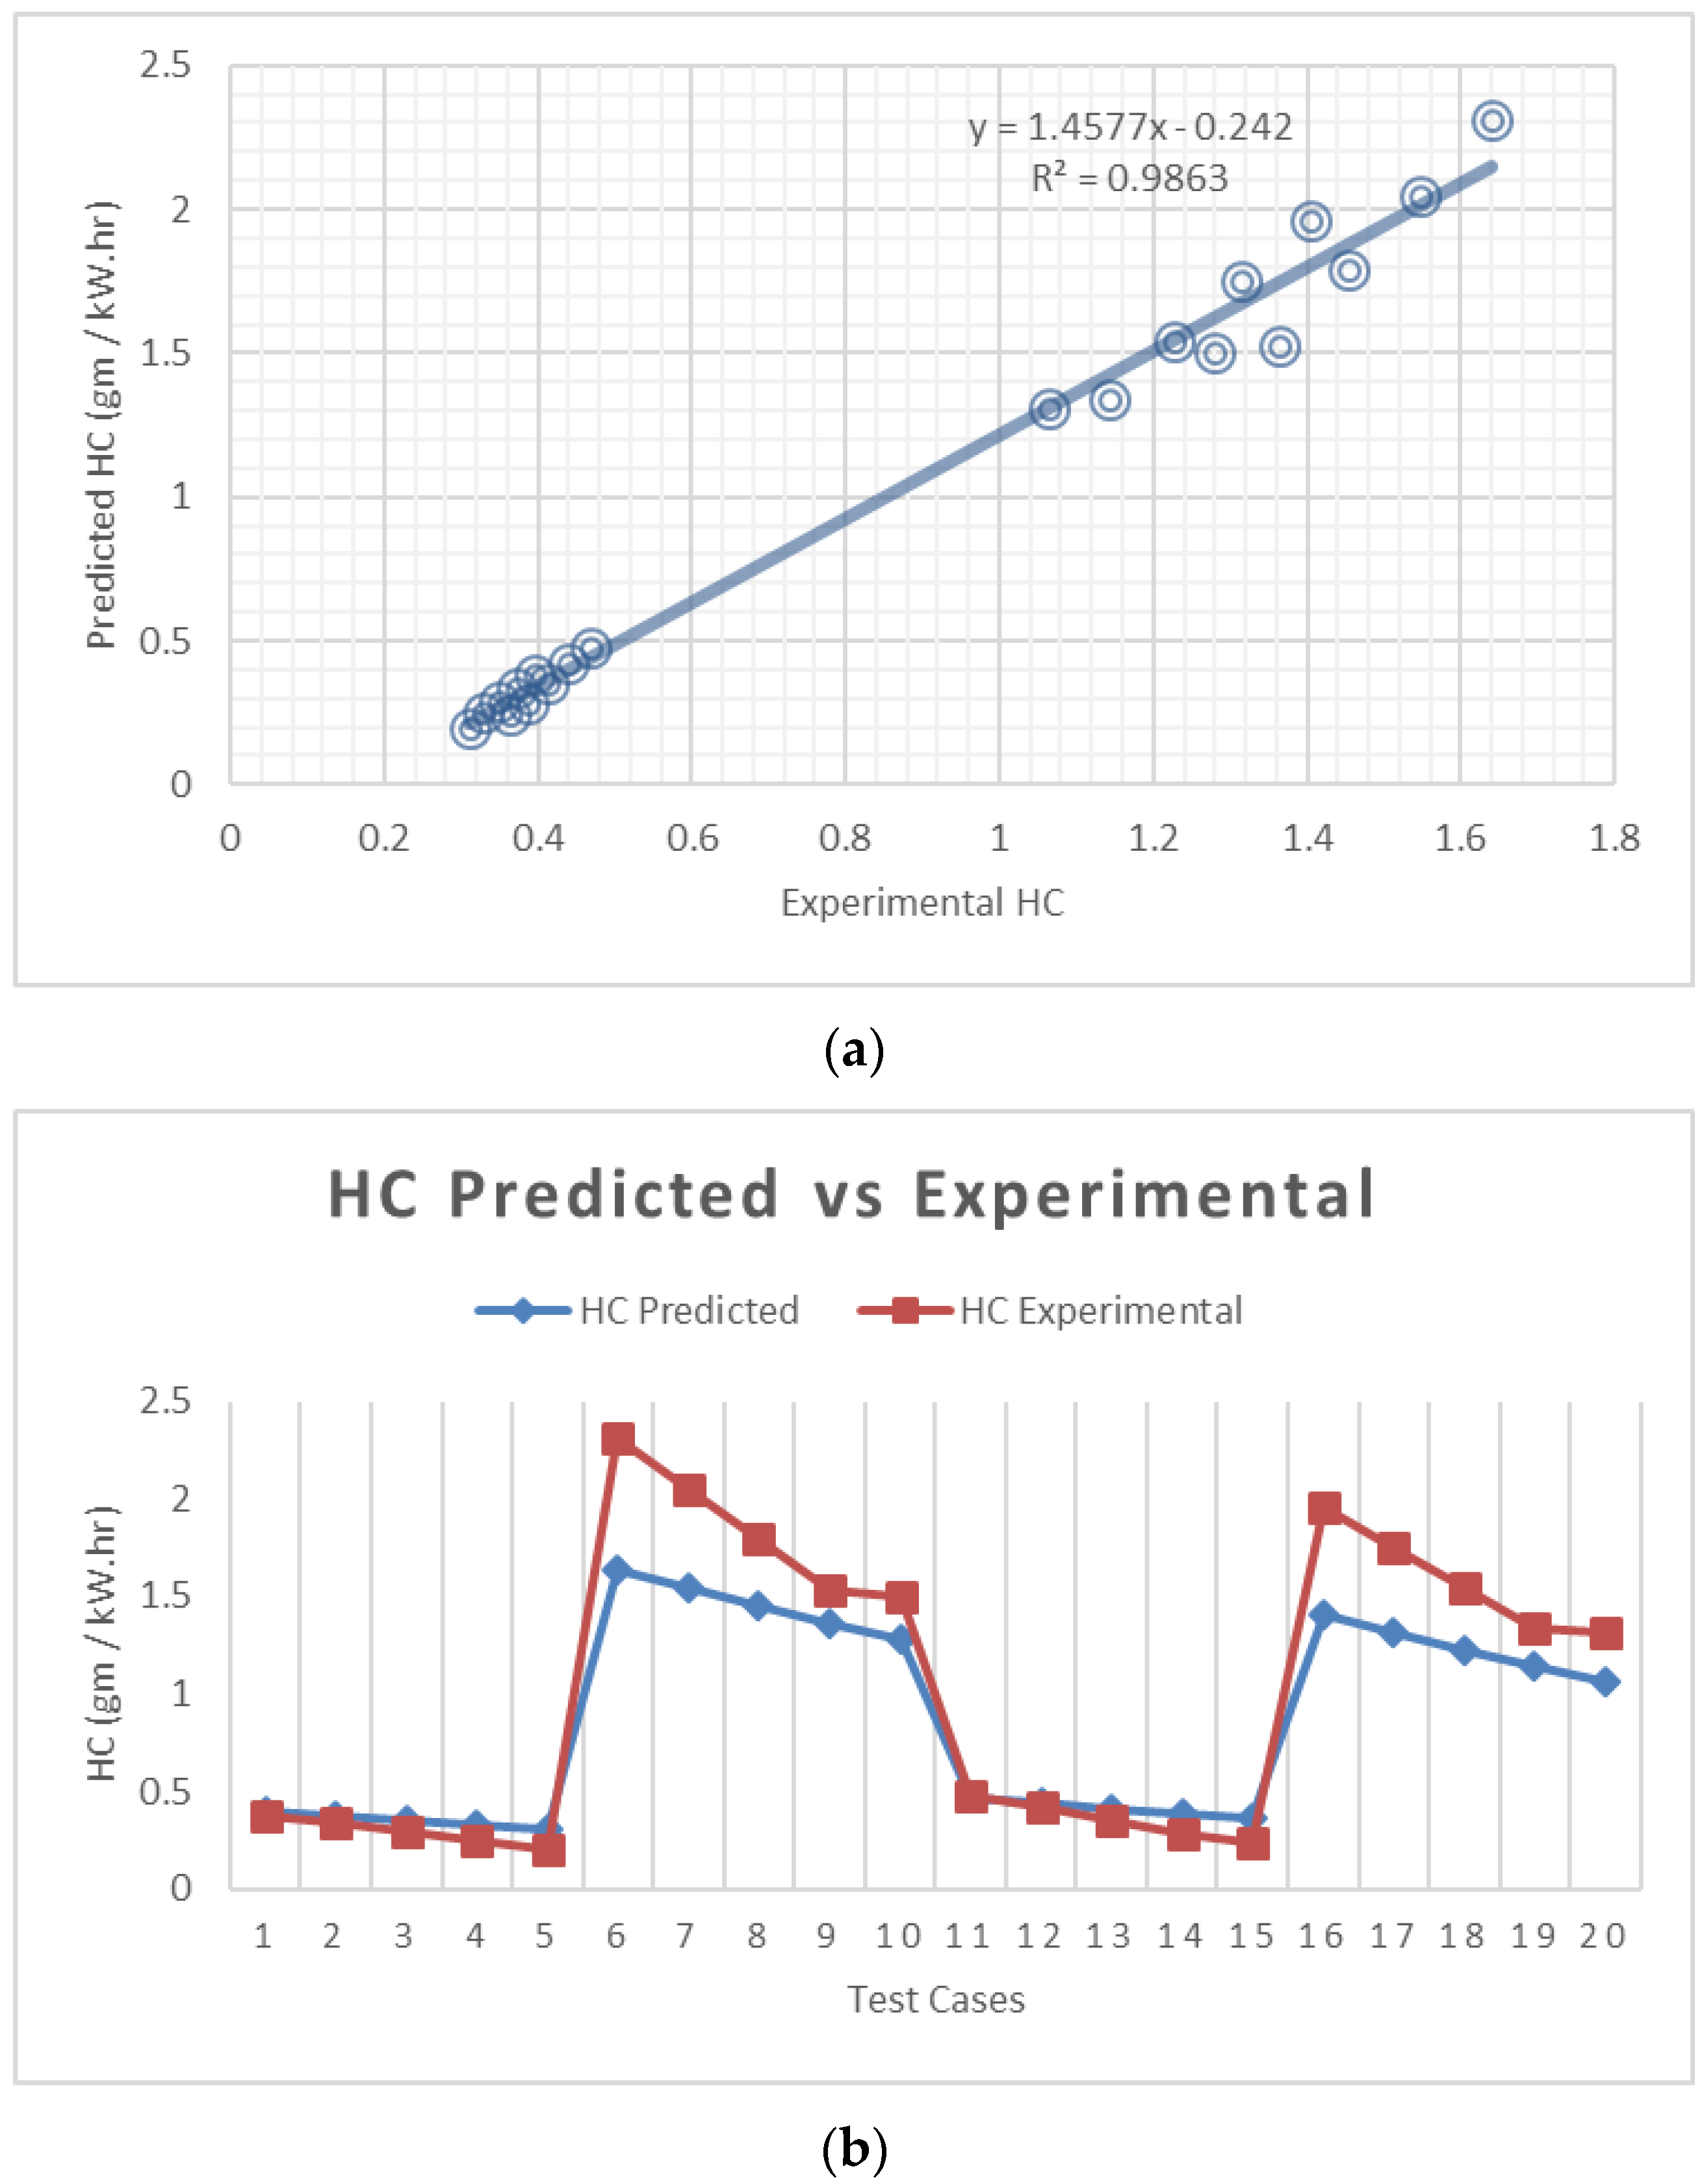
5. Results and Discussion
6. Conclusions
Author Contributions
Funding
Acknowledgments
Conflicts of Interest
References
- Roy, S.; Banerjee, R.; Bose, P.K. Performance and exhaust emissions prediction of a CRDI assisted single cylinder diesel engine coupled with EGR using artificial neural network. Appl. Energy 2014, 119, 330–340. [Google Scholar] [CrossRef]
- Banerjee, R.; Bose, P. Development of a neuro genetic algorithm based virtual sensing platform for the simultaneous prediction of NOx, opacity and BSFC in a diesel engine operated in dual fuel mode with hydrogen under varying EGR conditions. SAE Int. J. Engines 2012, 5, 119–140. [Google Scholar] [CrossRef]
- Chakraborty, A.; Roy, S.; Banerjee, R. An experimental based ANN approach in mapping performance-emission characteristics of a diesel engine operating in dual-fuel mode with LPG. J. Nat. Gas Sci. Eng. 2016, 28, 15–30. [Google Scholar] [CrossRef]
- Akkouche, N.; Loubar, K.; Nepveu, F.; Kadi, M.E.A.; Tazerout, M. Micro-combined heat and power using dual fuel engine and biogas from discontinuous anaerobic digestion. Energy Convers. Manag. 2020, 205, 112407. [Google Scholar] [CrossRef]
- Kakati, D.; Roy, S.; Banerjee, R. Development of an artificial neural network based virtual sensing platform for the simultaneous prediction of emission-performance-stability parameters of a diesel engine operating in dual fuel mode with port injected methanol. Energy Convers. Manag. 2019, 184, 488–509. [Google Scholar] [CrossRef]
- Hariharan, N.; Senthil, V.; Krishnamoorthi, M.; Karthic, S. Application of artificial neural network and response surface methodology for predicting and optimizing dual-fuel CI engine characteristics using hydrogen and bio fuel with water injection. Fuel 2020, 270, 117576. [Google Scholar] [CrossRef]
- Ağbulut, Ü.; Ayyıldız, M.; Sarıdemir, S. Prediction of performance, combustion and emission characteristics for a dual fuel diesel engine at varying injection pressures. Energy 2020, 197, 117257. [Google Scholar] [CrossRef]
- Kurtgoz, Y.; Karagoz, M.; Deniz, E. Biogas engine performance estimation using ANN. Eng. Sci. Technol. Int. J. 2017, 20, 1563–1570. [Google Scholar] [CrossRef]
- Leo, G.L.; Sekar, S.; Arivazhagan, S. Experimental investigation and ANN modelling of the effects of diesel/gasoline premixing in a waste cooking oil-fuelled HCCI-DI engine. J. Therm. Anal. Calorim. 2020, 141, 2311–2324. [Google Scholar] [CrossRef]
- Shojaeefard, M.; Etghani, M.; Akbari, M.; Khalkhali, A.; Ghobadian, B. Artificial neural networks based prediction of performance and exhaust emissions in direct injection engine using castor oil biodiesel-diesel blends. J. Renew. Sustain. Energy 2012, 4, 063130. [Google Scholar] [CrossRef]
- Shukri, M.R.; Rahman, M.; Ramasamy, D.; Kadirgama, K. Artificial Neural Network Optimization Modeling on Engine Performance of Diesel Engine Using Biodiesel Fuel. Int. J. Automot. Mech. Eng. 2015, 11, 2332–2347. [Google Scholar] [CrossRef]
- Ashok Kumar, T.; Musthafa, M.M.; Chandramouli, R.; Kandavel, T.; Mohanraj, T.; Sridharan, G. Performance characteristics of a variable compression ratio CI engine simulation using artificial neural network. Energy Sources Part A Recover. Util. Environ. Eff. 2019, 23, 1–11. [Google Scholar] [CrossRef]
- Yıldırım, S.; Tosun, E.; Çalık, A.; Uluocak, İ.; Avşar, E. Artificial intelligence techniques for the vibration, noise, and emission characteristics of a hydrogen-enriched diesel engine. Energy Sources Part A Recover. Util. Environ. Eff. 2019, 41, 2194–2206. [Google Scholar] [CrossRef]
- Oğuz, H.; Sarıtas, I.; Baydan, H.E. Prediction of diesel engine performance using biofuels with artificial neural network. Expert Syst. Appl. 2010, 37, 6579–6586. [Google Scholar] [CrossRef]
- Cay, Y. Prediction of a gasoline engine performance with artificial neural network. Fuel 2013, 111, 324–331. [Google Scholar] [CrossRef]
- Shayler, P.; Goodman, M.; Ma, T. The exploitation of neural networks in automotive engine management systems. Eng. Appl. Artif. Intell. 2000, 13, 147–157. [Google Scholar] [CrossRef]
- Papadimitriou, I.; Warner, M.; Silvestri, J.; Lennblad, J.; Tabar, S. Neural network based fast-running engine models for control-oriented applications. SAE Tech. Pap. 2005, 13, 214–233. [Google Scholar]
- Mahla, S.K.; Ardebili, S.M.S.; Sharma, H.; Dhir, A.; Goga, G.; Solmaz, H. Determination and utilization of optimal diesel/n-butanol/biogas derivation for small utility dual fuel diesel engine. Fuel 2021, 289, 119913. [Google Scholar] [CrossRef]
- Imtenan, S.; Masjuki, H.H.; Varman, M.; Fattah, I.M.R. Evaluation of n-butanol as an oxygenated additive to improve combustion-emission-performance characteristics of a diesel engine fuelled with a diesel-calophyllum inophyllum biodiesel blend. RSC Adv. 2015, 5, 17160–17170. [Google Scholar] [CrossRef]
- Yang, F.; Cho, H.; Zhang, H.; Zhang, J.; Wu, Y. Artificial neural network (ANN) based prediction and optimization of an organic Rankine cycle (ORC) for diesel engine waste heat recovery. Energy Convers. Manag. 2018, 164, 15–26. [Google Scholar] [CrossRef]
- Celebi, M.; Ceylan, M. The New Activation Function for Complex Valued Neural Networks: Complex Swish Function. In Proceedings of the 4th International Symposium on Innovative Approaches in Engineering and Natural Sciences, Samsun, Turkey, 22–24 November 2019. [Google Scholar]
- Hecht-Nielsen, R. Kolmogorov’s mapping neural network existence theorem. Proceedings of the international conference on Neural Networks. IEEE Press N. Y. 1987, 3, 11–14. [Google Scholar]
- Belman-Flores, J.M.; Ledesma, S.; Garcia, M.; Ruiz, J.; Rodríguez-Muñoz, J.L. Analysis of a variable speed vapor compression system using artificial neural networks. Expert Syst. Appl. 2013, 40, 4362–4369. [Google Scholar] [CrossRef]
- Gandomi, A.H.; Roke, D.A. Assessment of artificial neural network and genetic programming as predictive tools. Adv. Eng. Softw. 2015, 88, 63–72. [Google Scholar] [CrossRef]
- Yassin, M.A.; Alazba, A.; Mattar, M.A. Artificial neural networks versus gene expression programming for estimating reference evapotranspiration in arid climate. Agric. Water Manag. 2016, 163, 110–124. [Google Scholar] [CrossRef]
- Kshirsagar, C.M.; Anand, R. Artificial neural network applied forecast on a parametric study of Calophyllum inophyllum methyl ester-diesel engine out responses. Appl. Energy 2017, 189, 555–567. [Google Scholar] [CrossRef]
- Chen, Z.; Yang, Y. Assessing Forecast Accuracy Measures; Technical Report 2004–10; Iowa State University, Department of Statistics & Statistical Laboratory: Ames, IA, USA, 2004. [Google Scholar]


| Features | Diesel | n-Butanol | Test Scheme (ASTM) | Biogas | Test Scheme (ASTM) |
|---|---|---|---|---|---|
| Density (kg/m3)@15 °C | 840 | 810 | D4052 | 0.92 | D3588 |
| Viscosity (mm2/s)@40 °C | 2.72 | 3.64 | D445 | - | |
| Heating Value (MJ/kg) | 42.6 | 33.2 | D4809 | 26.23 | D1945 |
| Flash Point (°C) | 78 | 35 | D93 | - | |
| Fire Point (°C) | 83 | 42 | D93 | ||
| Cloud Point (°C) | −8 | # | DL500 | ||
| Pour Point (°C) | −6 | −45 | D97 | ||
| Cetane Number (CN) | 50 | 22 | D613 | ||
| Chemical Formula | C4H10O |
|---|---|
| Boiling point | 117 (°C) |
| Temperature for Auto ignition | 343 (°C) |
| Octane number | 96 |
| Oxygen | 21.62 (% by weight) |
| Latent heat of vaporization at 25 °C | 626 (kJ/kg) |
| Make | Kirloskar |
|---|---|
| Model Specifications | TV 1 |
| System used for Cooling | Water Cooled |
| Cylinder Count | 01 |
| Rated Brake Power | 5.2 kW @ 1500 rpm |
| Displacement volume | 661 (cc) |
| Rated Speed | 1500 (rpm) |
| Standard Fuel Injection Timing | 23° before TDC |
| Bore × Stroke | 87.5 × 110 (mm) |
| Compression Ratio | 17.5:1 |
| Structure of the Network Used Here | 3 inputs, 01 hidden layer, and 5 outputs |
| Percentage of Data used for training and testing | Training: 130 rows for training Testing: 20 rows for testing |
| Type of the Network | Feed Forward Back Propagation |
| Function used for Training | Backpropagation |
| Optimization Function | Adam |
| Transfer/Activation Function | Swish |
| Criteria used to Stop | On-set of enhancement in validation error will results into breaking of training network |
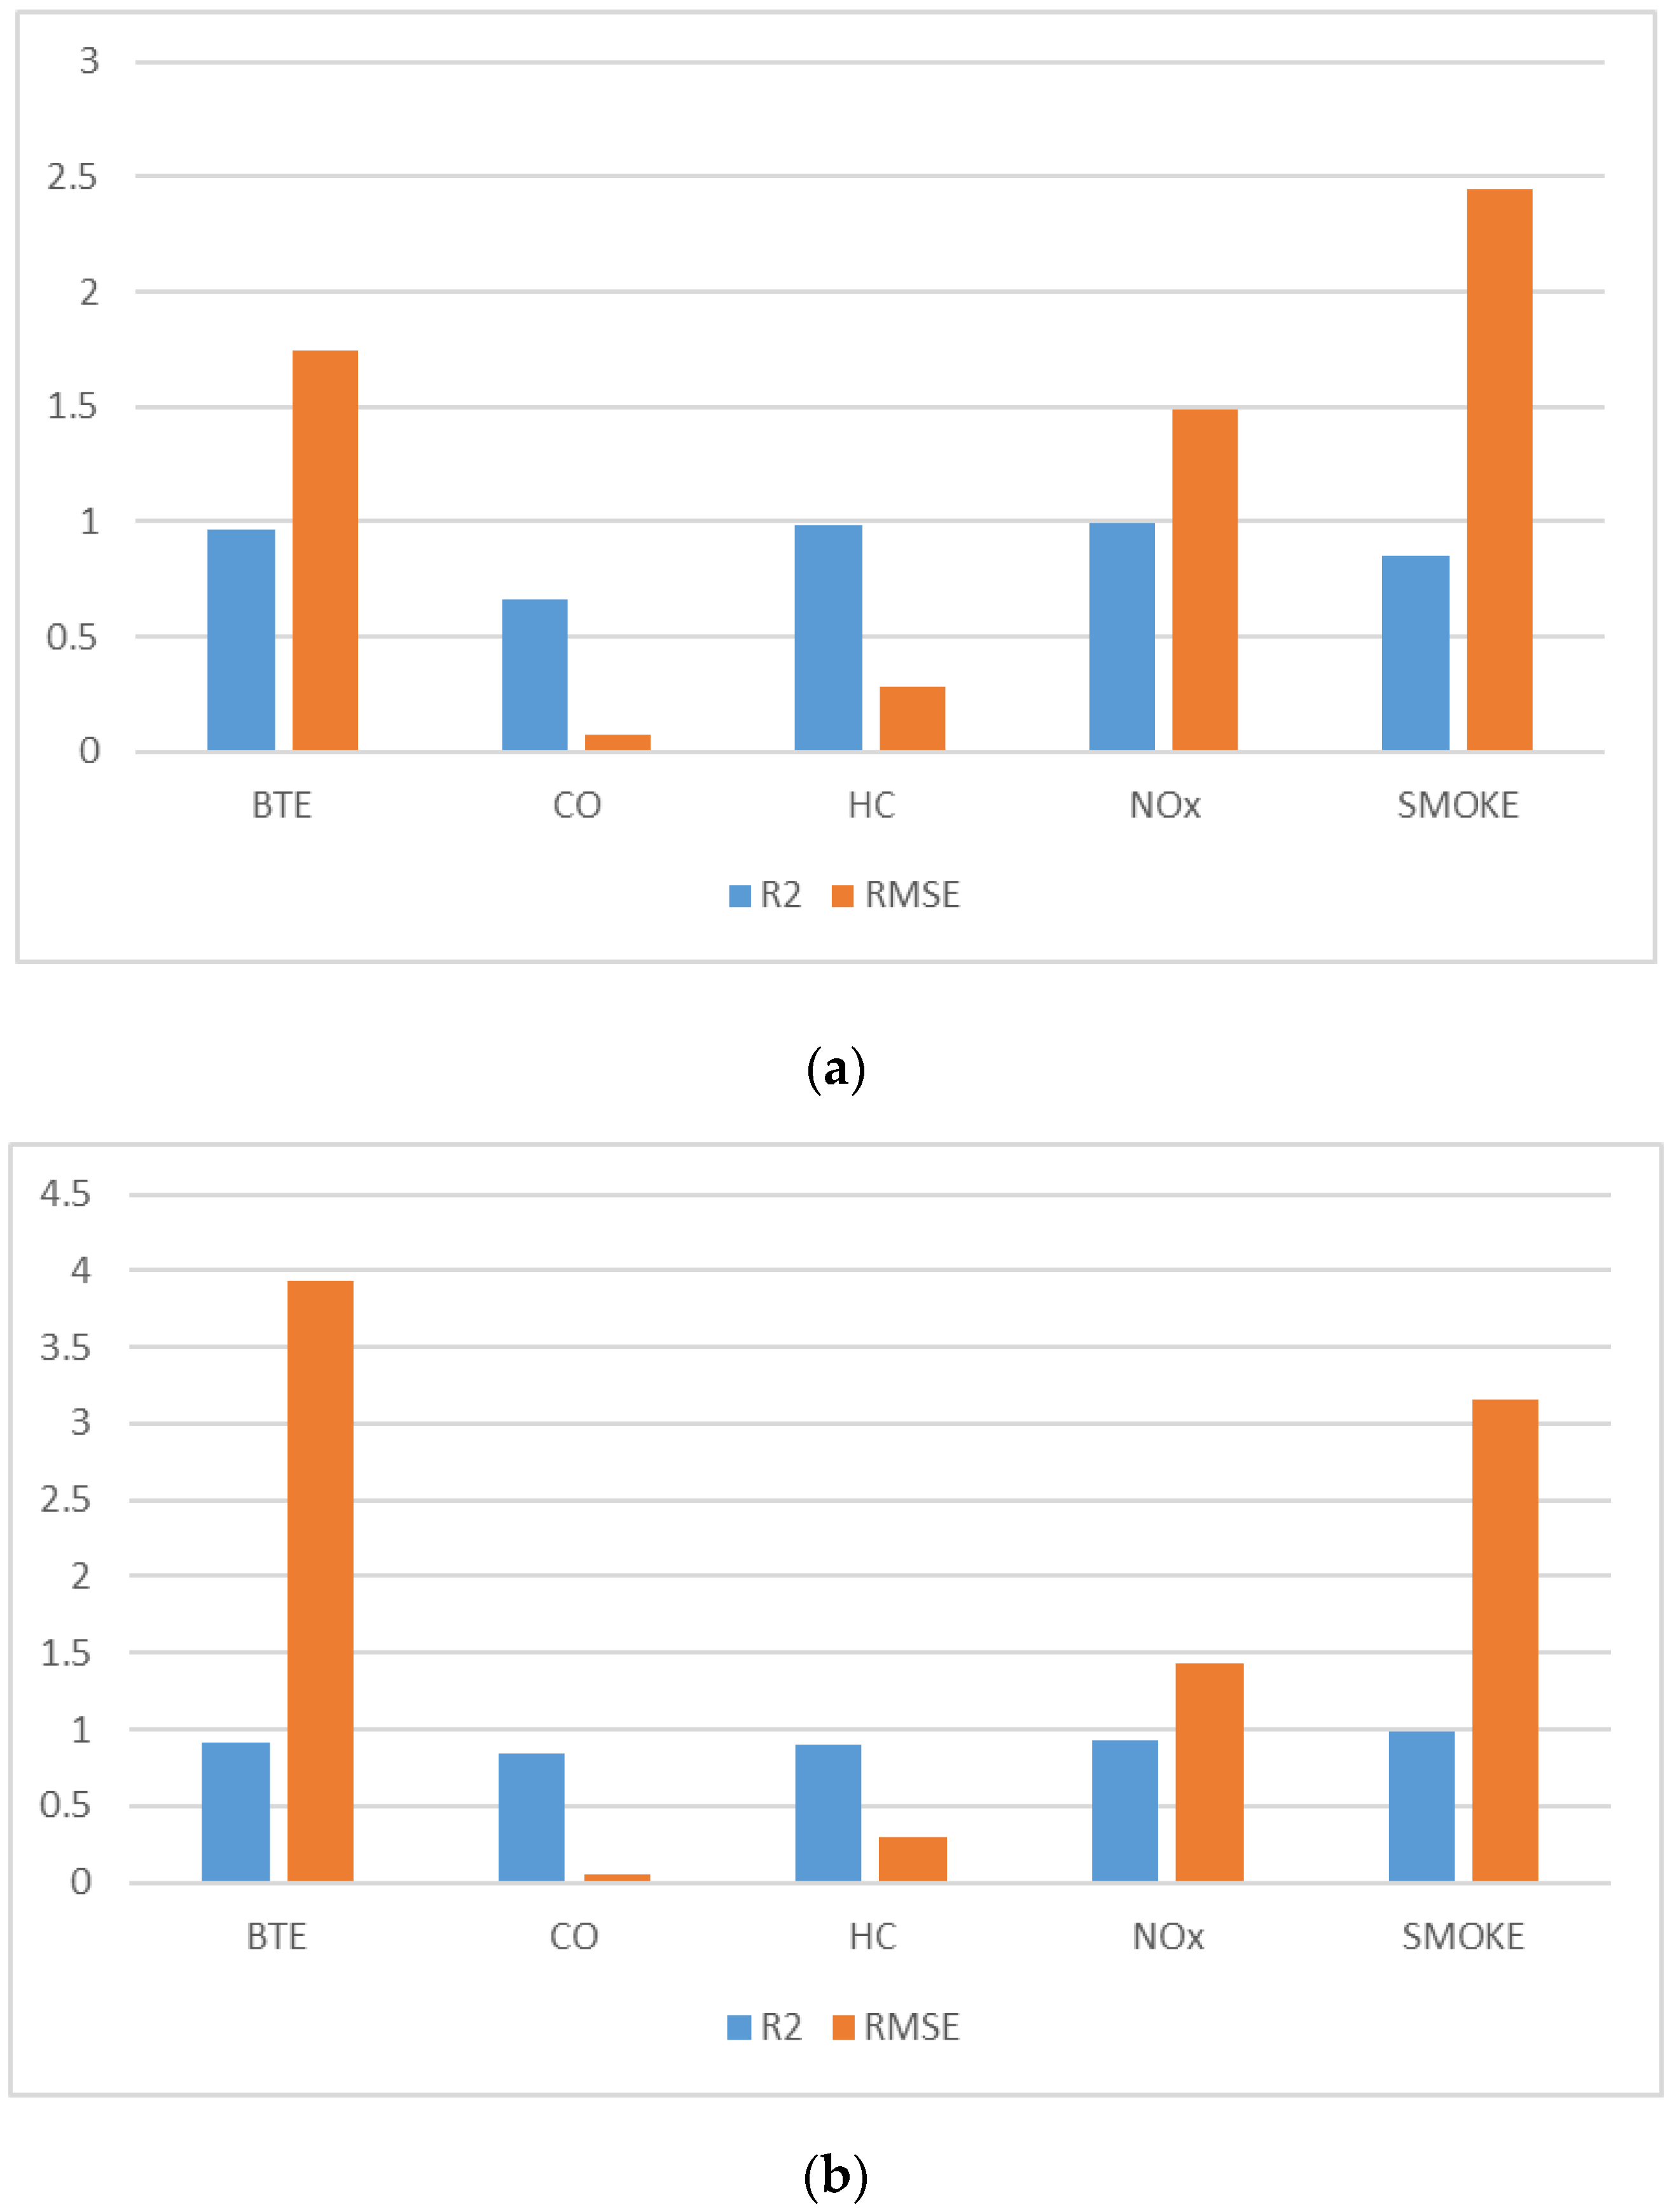
| O/P | Transfer Function (At Layer 1-2-3) | No. of Neurons | RMSE |
|---|---|---|---|
| BTE | swish | 3 | 1.741 |
| 5 | 3.927 | ||
| 7 | 3.288 | ||
| sigmoid | 3 | 15.713 | |
| 5 | 15.693 | ||
| 7 | 15.691 | ||
| CO | swish | 3 | 0.078 |
| 5 | 0.059 | ||
| 7 | 0.056 | ||
| sigmoid | 3 | 0.08 | |
| 5 | 0.067 | ||
| 7 | 0.078 | ||
| HC | swish | 3 | 0.286 |
| 5 | 0.304 | ||
| 7 | 0.307 | ||
| sigmoid | 3 | 0.69 | |
| 5 | 0.61 | ||
| 7 | 0.57 | ||
| NOx | swish | 3 | 1.491 |
| 5 | 1.435 | ||
| 7 | 2.207 | ||
| sigmoid | 3 | 16.94 | |
| 5 | 16.863 | ||
| 7 | 16.86 | ||
| Smoke | swish | 3 | 2.448 |
| 5 | 3.154 | ||
| 7 | 3.170 | ||
| sigmoid | 3 | 20.327 | |
| 5 | 20.326 | ||
| 7 | 20.31 |
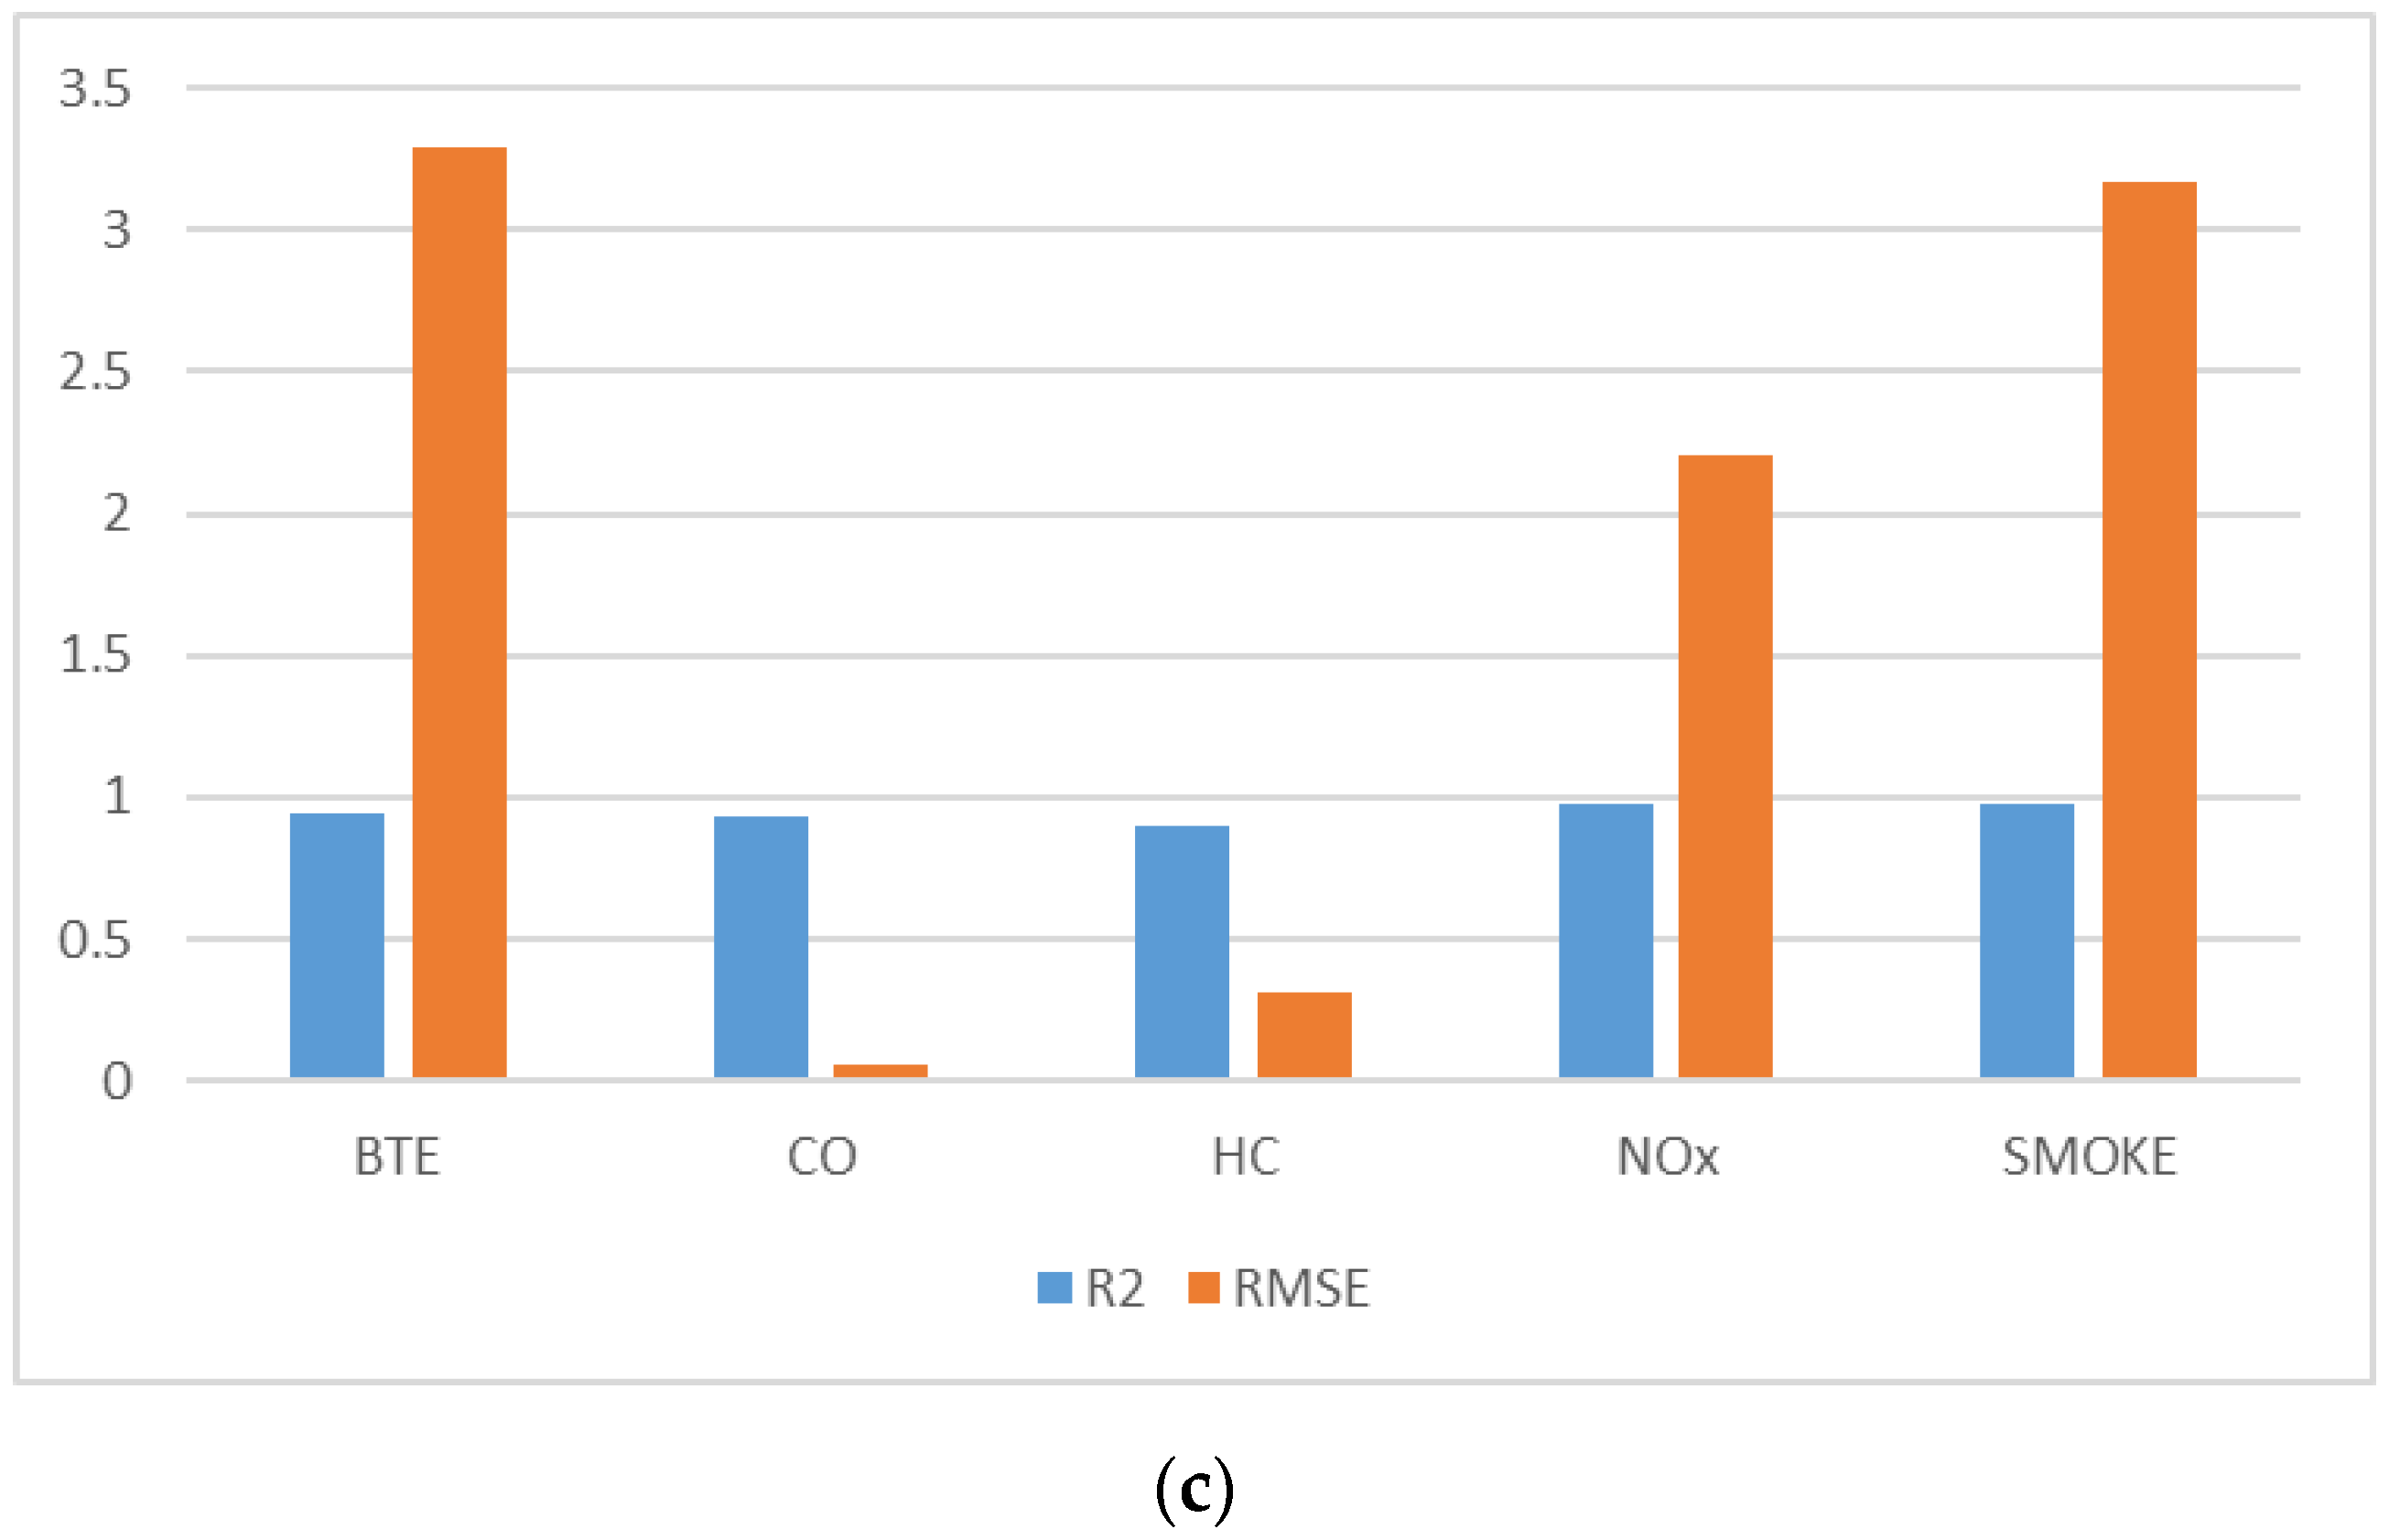
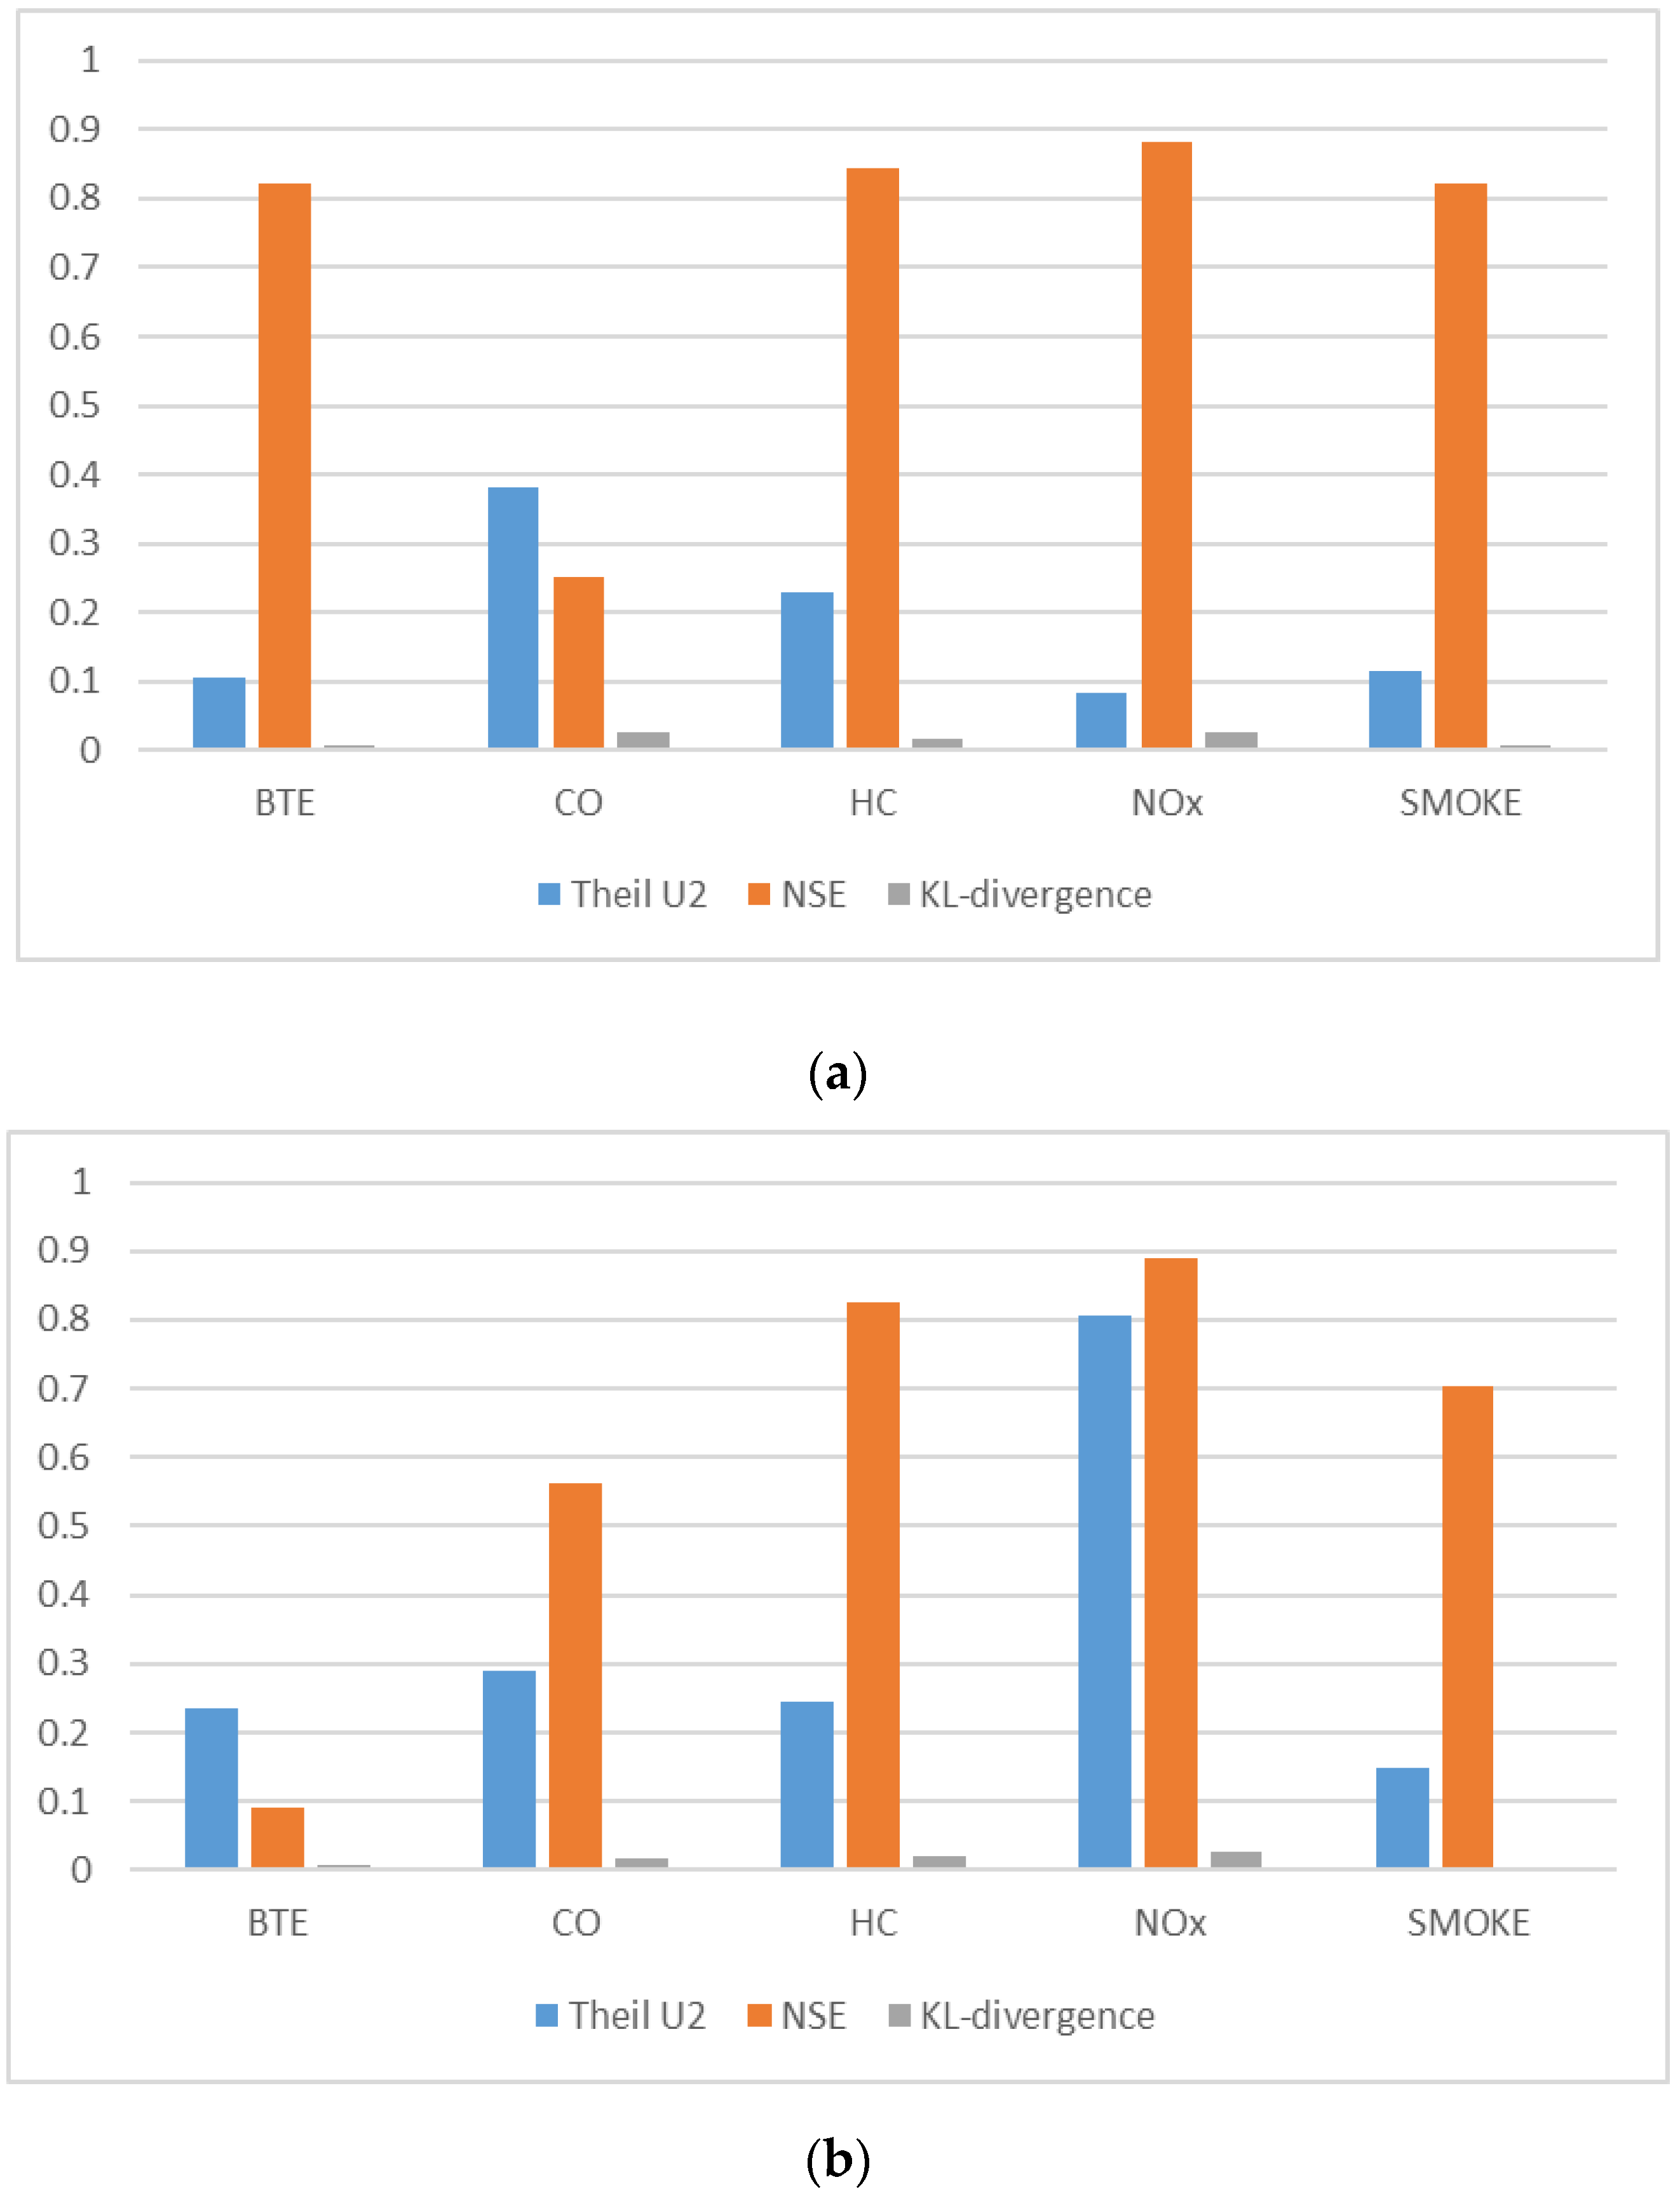
| O/P | TF (At Layer 1-2-3) | No. of Neurons | R2 | RMSE | NMSE | NRMSE | MSRE | NSCE | Theil | KL |
|---|---|---|---|---|---|---|---|---|---|---|
| BTE | swish + swish + swish | 3 | 0.9705 | 1.741 | 0.0119 | 0.1235 | 0.0193 | 0.8211 | 0.1047 | 0.0068 |
| 5 | 0.915 | 3.927 | 0.0716 | 0.2786 | 0.0405 | 0.0898 | 0.2361 | 0.008 | ||
| 7 | 0.943 | 3.288 | 0.0489 | 0.2332 | 0.0282 | 0.3618 | 0.1977 | 0.007 | ||
| CO | 3 | 0.6576 | 0.078 | 0.2652 | 0.2609 | 0.1182 | 0.2497 | 0.3802 | 0.025 | |
| 5 | 0.8475 | 0.059 | 0.1332 | 0.199 | 0.0673 | 0.5635 | 0.29 | 0.018 | ||
| 7 | 0.9332 | 0.056 | 0.1182 | 0.1872 | 0.0625 | 0.6139 | 0.2727 | 0.013 | ||
| HC | 3 | 0.9863 | 0.286 | 0.0938 | 0.1359 | 0.0673 | 0.8450 | 0.2294 | 0.016 | |
| 5 | 0.9038 | 0.304 | 0.1069 | 0.1441 | 0.0686 | 0.8256 | 0.2434 | 0.019 | ||
| 7 | 0.9006 | 0.307 | 0.1101 | 0.1457 | 0.0629 | 0.8218 | 0.246 | 0.016 | ||
| NOx | 3 | 0.9923 | 1.491 | 0.0077 | 0.0932 | 0.0067 | 0.8810 | 0.0837 | 0.027 | |
| 5 | 0.9288 | 1.435 | 0.0071 | 0.0897 | 0.0064 | 0.8898 | 0.0805 | 0.028 | ||
| 7 | 0.9813 | 2.207 | 0.0178 | 0.138 | 0.0129 | 0.7393 | 0.1239 | 0.04 | ||
| Smoke | 3 | 0.8493 | 2.448 | 0.0147 | 0.1224 | 0.0125 | 0.8209 | 0.1152 | 0.0079 | |
| 5 | 0.9817 | 3.154 | 0.0216 | 0.1577 | 0.028 | 0.7027 | 0.1484 | 0.0057 | ||
| 7 | 0.9798 | 3.170 | 0.0299 | 0.1585 | 0.0211 | 0.6997 | 0.1491 | 0.0086 |
| Parameters | Values for the Uncertainties | Computation | Cumulative Uncertainties UT (%) |
|---|---|---|---|
| BTE | 2.5, 0.11 | 2.5024 | |
| CO | 0.2, 0.27 | 0.3360 | |
| HC | 0.1, 0.23 | 0.2507 | |
| NOx | 0.2, 0.08 | 0.2154 | |
| Smoke | 1, 0.11 | 1.0060 |
Publisher’s Note: MDPI stays neutral with regard to jurisdictional claims in published maps and institutional affiliations. |
© 2021 by the authors. Licensee MDPI, Basel, Switzerland. This article is an open access article distributed under the terms and conditions of the Creative Commons Attribution (CC BY) license (http://creativecommons.org/licenses/by/4.0/).
Share and Cite
Arora, V.; Mahla, S.K.; Leekha, R.S.; Dhir, A.; Lee, K.; Ko, H. Intervention of Artificial Neural Network with an Improved Activation Function to Predict the Performance and Emission Characteristics of a Biogas Powered Dual Fuel Engine. Electronics 2021, 10, 584. https://doi.org/10.3390/electronics10050584
Arora V, Mahla SK, Leekha RS, Dhir A, Lee K, Ko H. Intervention of Artificial Neural Network with an Improved Activation Function to Predict the Performance and Emission Characteristics of a Biogas Powered Dual Fuel Engine. Electronics. 2021; 10(5):584. https://doi.org/10.3390/electronics10050584
Chicago/Turabian StyleArora, Vinay, Sunil Kumar Mahla, Rohan Singh Leekha, Amit Dhir, Kyungroul Lee, and Hoon Ko. 2021. "Intervention of Artificial Neural Network with an Improved Activation Function to Predict the Performance and Emission Characteristics of a Biogas Powered Dual Fuel Engine" Electronics 10, no. 5: 584. https://doi.org/10.3390/electronics10050584