
On the Selection of Process Mining Tools


Abstract
:1. Introduction
2. Process Mining
2.1. Process Mining Perspectives
2.2. Process Mining Types
2.2.1. Discovery
2.2.2. Conformance
2.2.3. Enhancement
2.3. Process Mining Tools
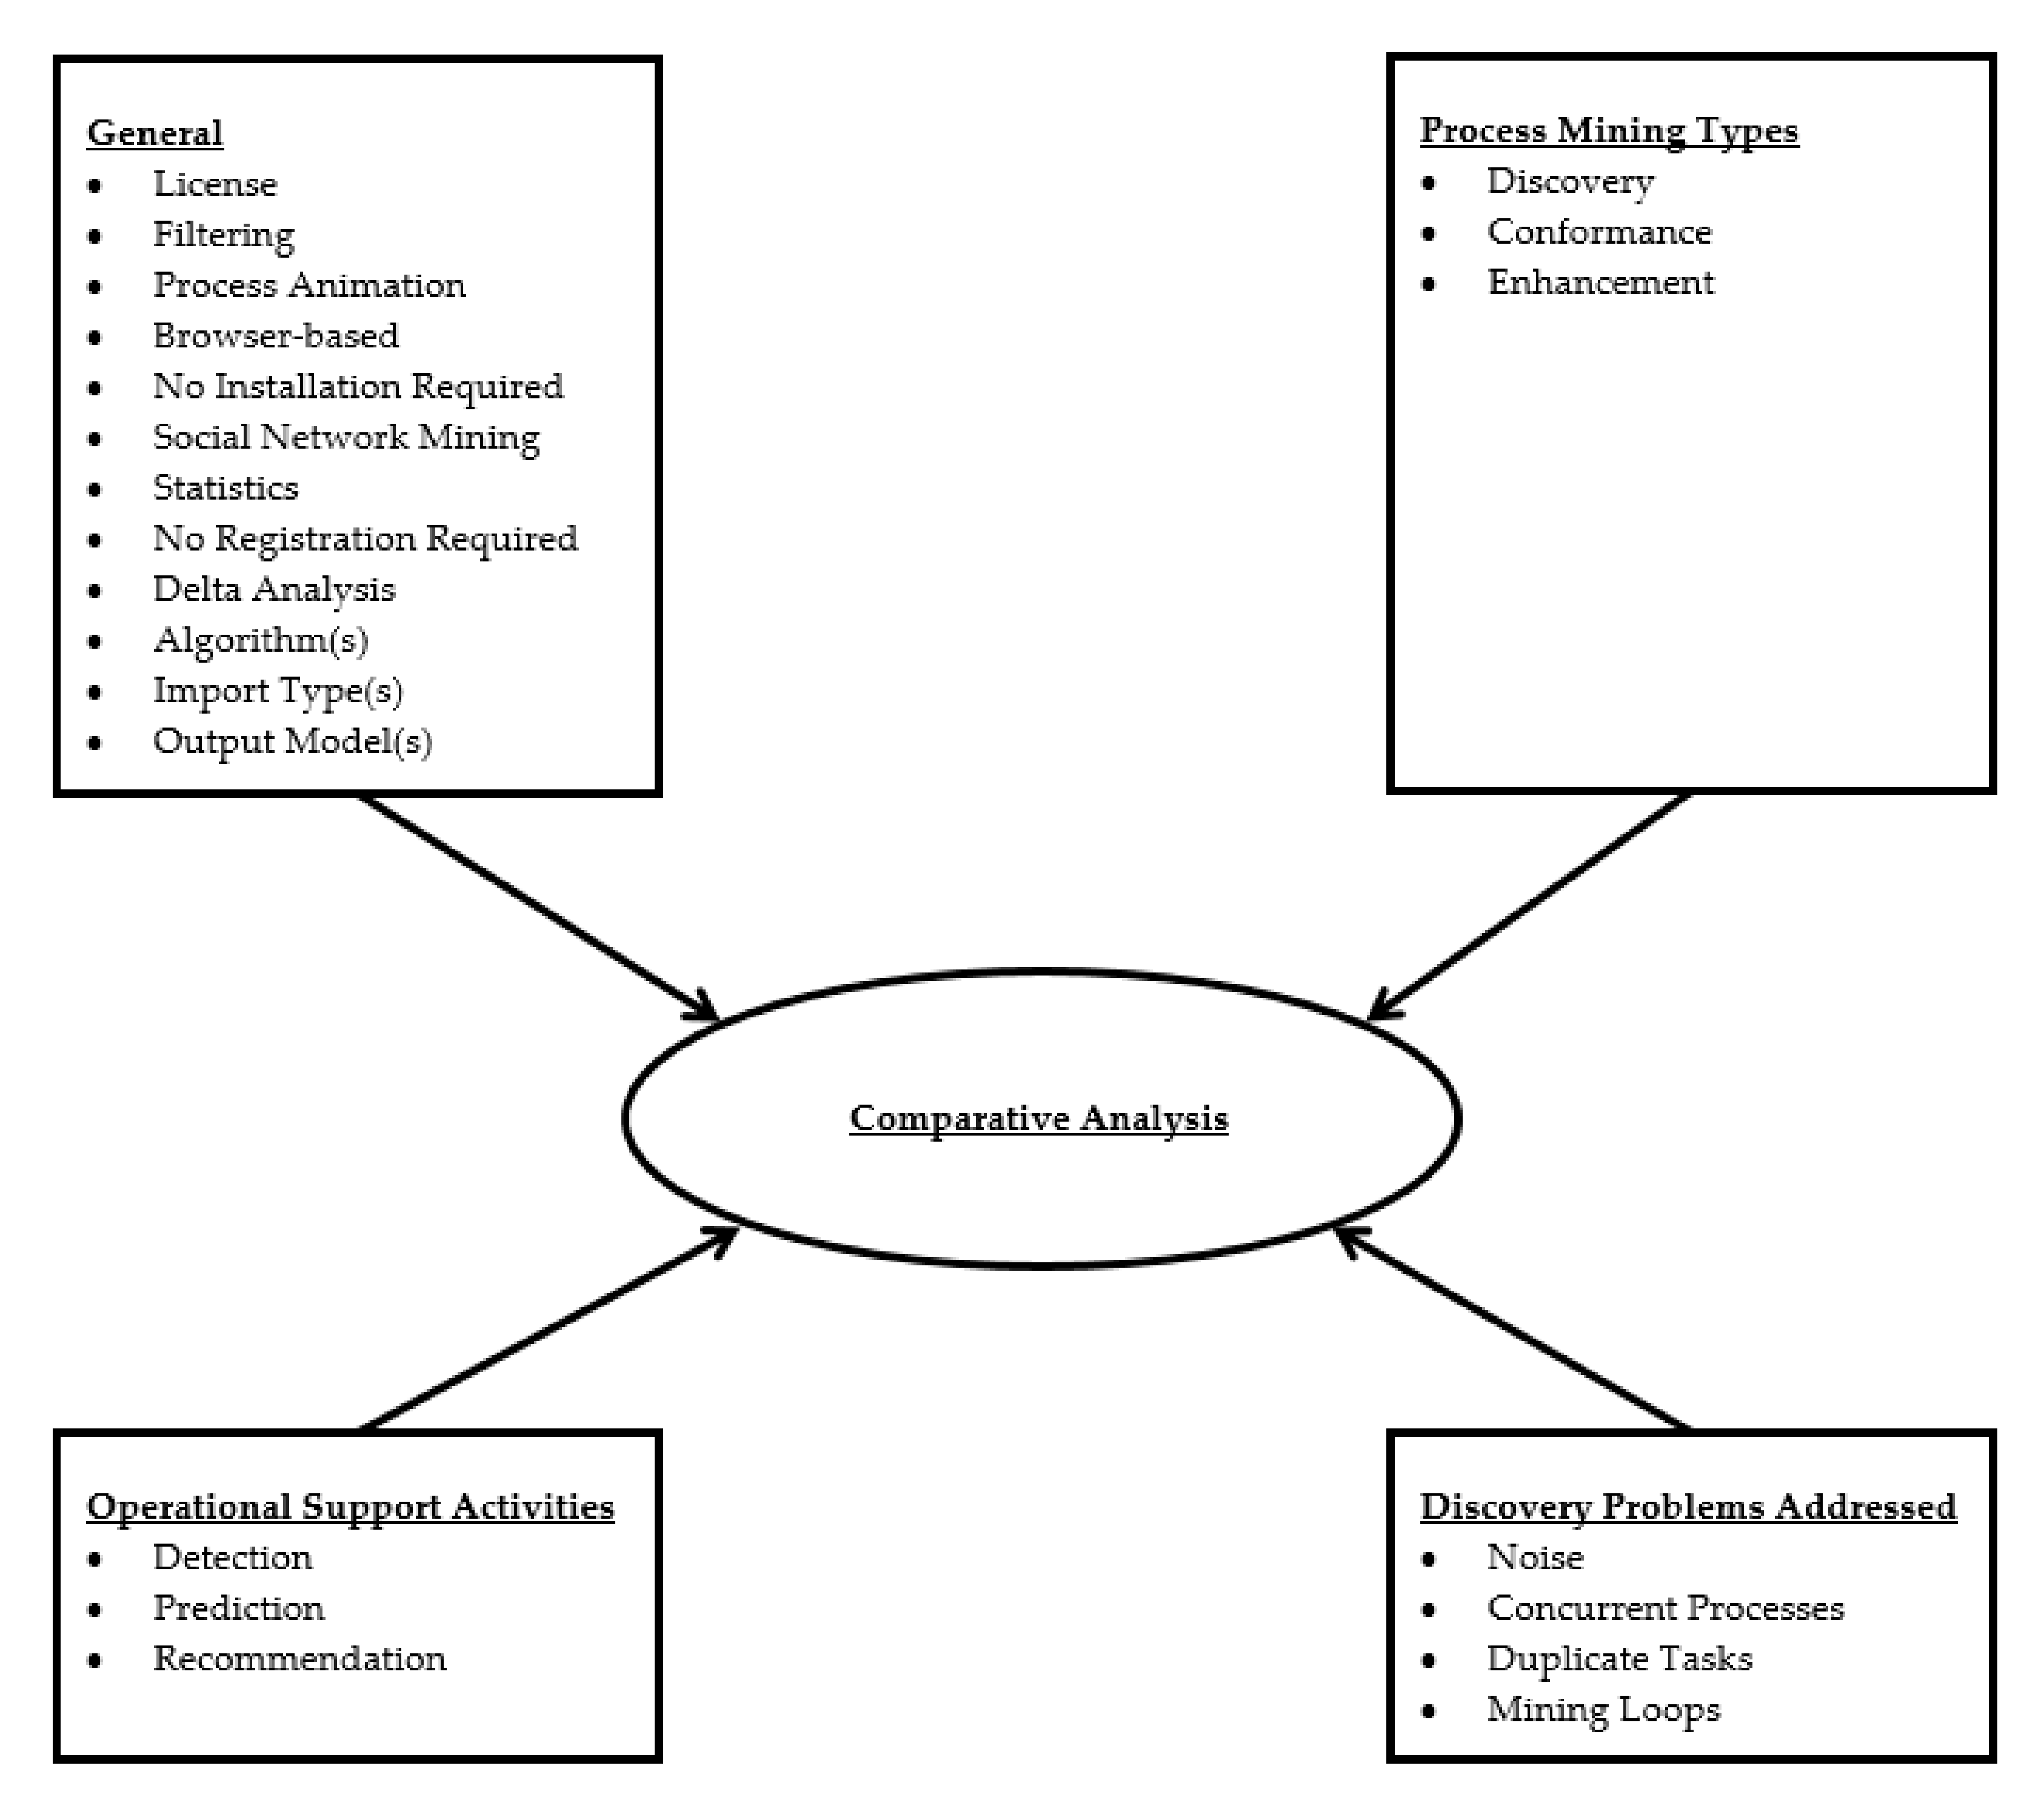
3. Comparative Analysis Criteria
- General. Includes criteria that provide general information about the software tools. In the “general” category, we classify the criteria that cannot be classified in any of the other three categories.
- Process Mining Types. Contains the three process mining types that were described in Section 2.2. These types are of great importance in the field of process mining.
- Operational Support Activities. Includes the activities used for online operational support of running cases [13].
- Discovery Problems Addressed. Contains criteria that can be used to check if the software tools can address specific discovery problems.
4. Comparative Analysis Methodology
- Phase 1: Listing of Process Mining Software Tools to Be Compared. The aim of Phase 1 is to list the process mining software tools that we want to compare. For example, we could list some of the software tools mentioned in Section 2.3.
- Phase 2: Listing of Comparative Analysis Criteria. The aim of Phase 2 is to list the criteria that we want to use for the comparative analysis of the process mining software tools listed in Phase 1. For example, we could list some of the comparative analysis criteria described in Section 3.
- Phase 3: Listing of Comparative Analysis Criteria Values per Process Mining Software Tool. The aim of Phase 3 is to list the values of each of the comparative analysis criteria listed in Phase 2 per process mining software tool listed in Phase 1. We create a double-entry table. In the header row of the table, we enter the names of the process mining software tools listed in Phase 1. In the header column of the table, we enter the comparative analysis criteria listed in Phase 2. In the remaining table cells, we enter the comparative analysis criteria values per process mining software tool. An example can be seen in Section 8.3.
- Phase 4: Selection of Software Tool(s). The aim of Phase 4 is the selection of the process mining software tool that best suits user needs. Following the completion of Phase 3, one or more of the following three methods can be used for the selection of the software tool. The methods and the reasons for selecting each method for the comparative analysis of the software tools are illustrated in Table 3.
- ○
- Ontology-based selection. The aim of this method is to select the software tool that best suits user needs from the list of the process mining software tools listed in Phase 1 by using an ontology, the comparative analysis criteria listed in Phase 2, and the values listed in Phase 3.
- ○
- Selection of Software Tool(s) Using Decision Tree. The aim of this method is to select the software tool that best suits user needs from the list of the process mining software tool(s) listed in Phase 1 by using a decision tree, the comparative analysis criteria listed in Phase 2, and the values listed in Phase 3.
- ○
- Selection of Software Tool(s) Using AHP. The aim of this method is to select the software tool that best suits user needs from the list of the process mining software tool(s) listed in Phase 1 using AHP, the comparative analysis criteria listed in Phase 2, and the values listed in Phase 3.
5. Ontology-Based Selection
- Determine the purpose of the ontology. In our case, the purpose of the ontology is the selection of the process mining software tool that best suits stakeholders’ needs by comparing any number of tools and using any number of comparative analysis criteria.
- List important terms in the ontology. Some important terms of our ontology are the software tools, the comparative analysis criteria, and their values.
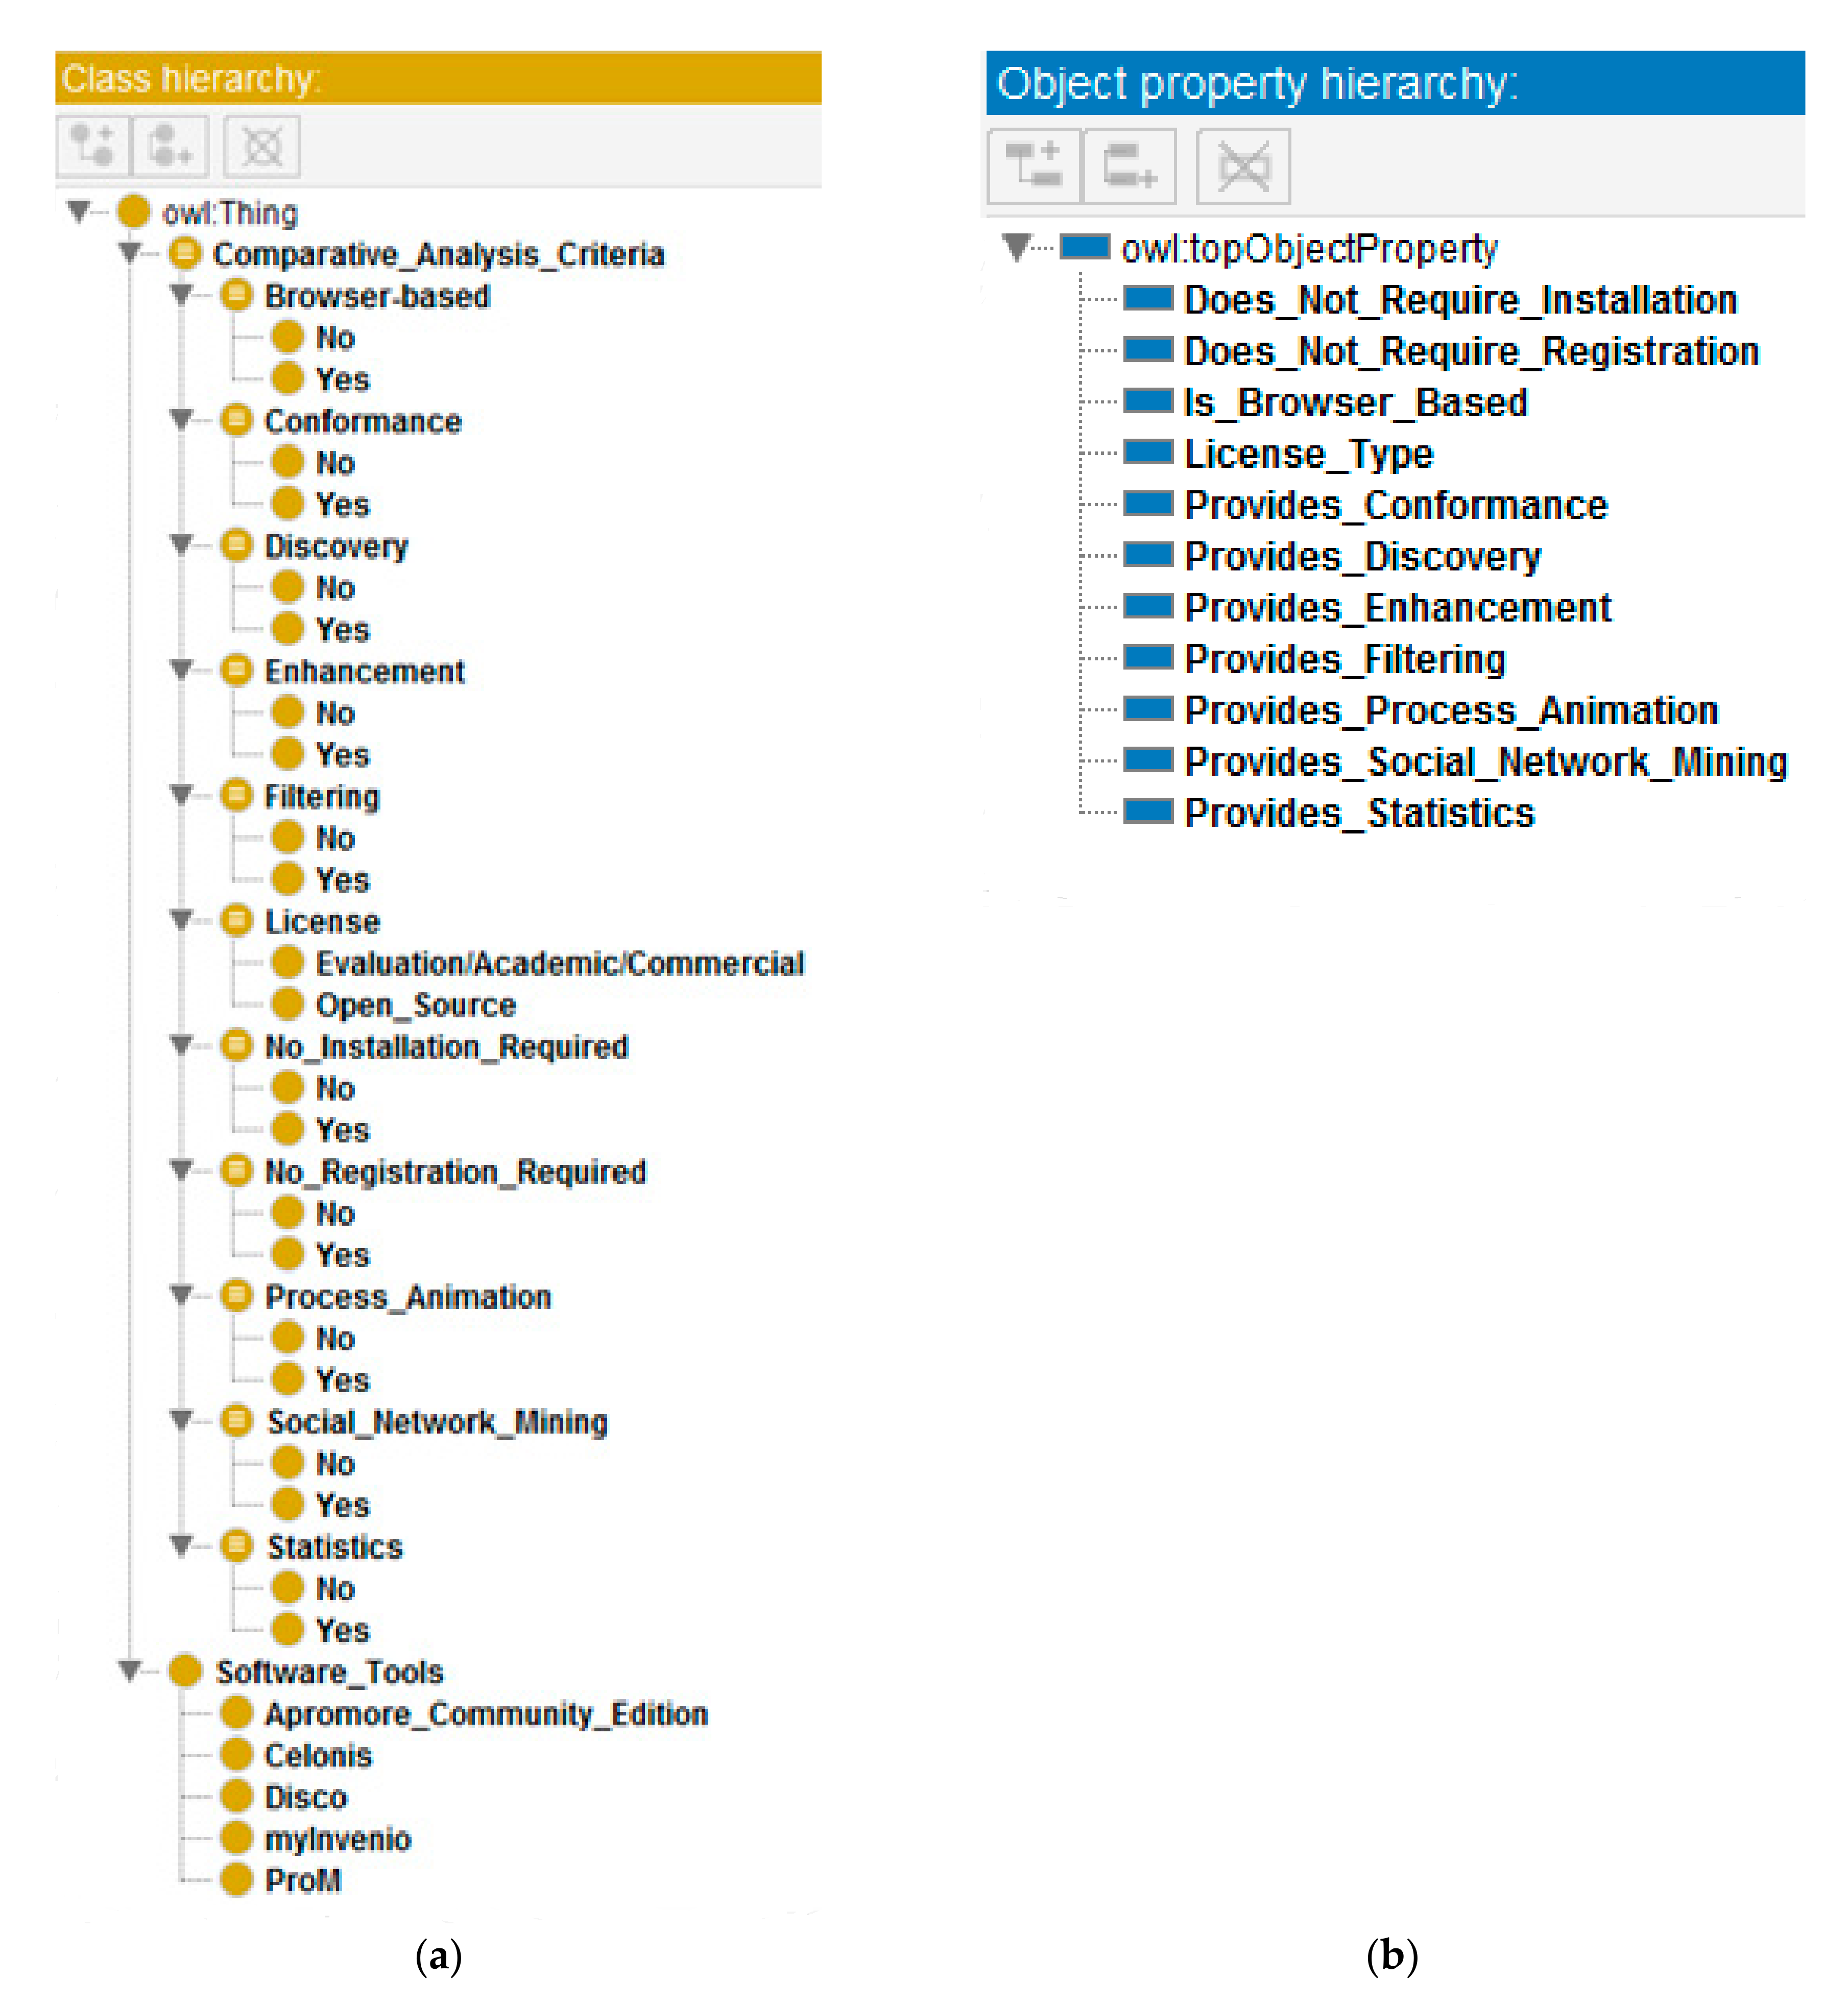
- Define the classes and their hierarchy. The terms listed in Step 2 can be used to define the classes of the ontology. We create a class for the software tools and another class for the comparative analysis criteria. We then develop the hierarchy of the classes:
- We create a class for each one of the software tools that we want to compare (e.g., we create “Disco”, “ProM”, etc., classes). We define these classes as subclasses of the software tools class.
- We create a class for each one of the comparative analysis criteria that we want to use for the comparison of the software tools (e.g., we create “Discovery”, “Conformance”, “Filtering”, “Statistics”, etc., classes). We define these classes as subclasses of the comparative analysis criteria class.
- We create a class for each one of the values of each one of the comparative analysis criteria (e.g., we create “Yes” and “No” classes for the “Filtering” criterion, etc.). We define these classes as subclasses of the respective comparative analysis criterion classes (e.g., we define “Yes” and “No” as subclasses of the “Filtering” criterion class, etc.).
- Define the properties. In this step, we define the properties of classes (e.g., “Provides_Discovery”, “Provides_Conformance”, “Provides_Filtering”, “Provides_Statistics”, etc.).
- Assign values to all the properties of all the software tools. In this step, we assign values to all the properties defined in Step 4 of all the software tool subclasses defined in Step 3 (e.g., we assign the value “Yes” to the “Provides_Filtering” property of the “ProM” subclass of the software tools class, etc.).
- Execute queries. If we create an ontology as described above and use a tool such as Protégé, we will be able to execute complex queries in order to find the suitable process mining software tool(s) (e.g., we could execute a query searching for browser-based open-source software tool(s) that provide discovery, conformance, filtering, and statistics, etc.).
6. Selection of Software Tool(s) Using Decision Tree
- Determine the purpose of the decision tree. We define a relation describing the purpose. In our case, the purpose of the decision tree is to select the software tool that best suits stakeholders’ needs by comparing any number of tools and using any number of comparative analysis criteria.
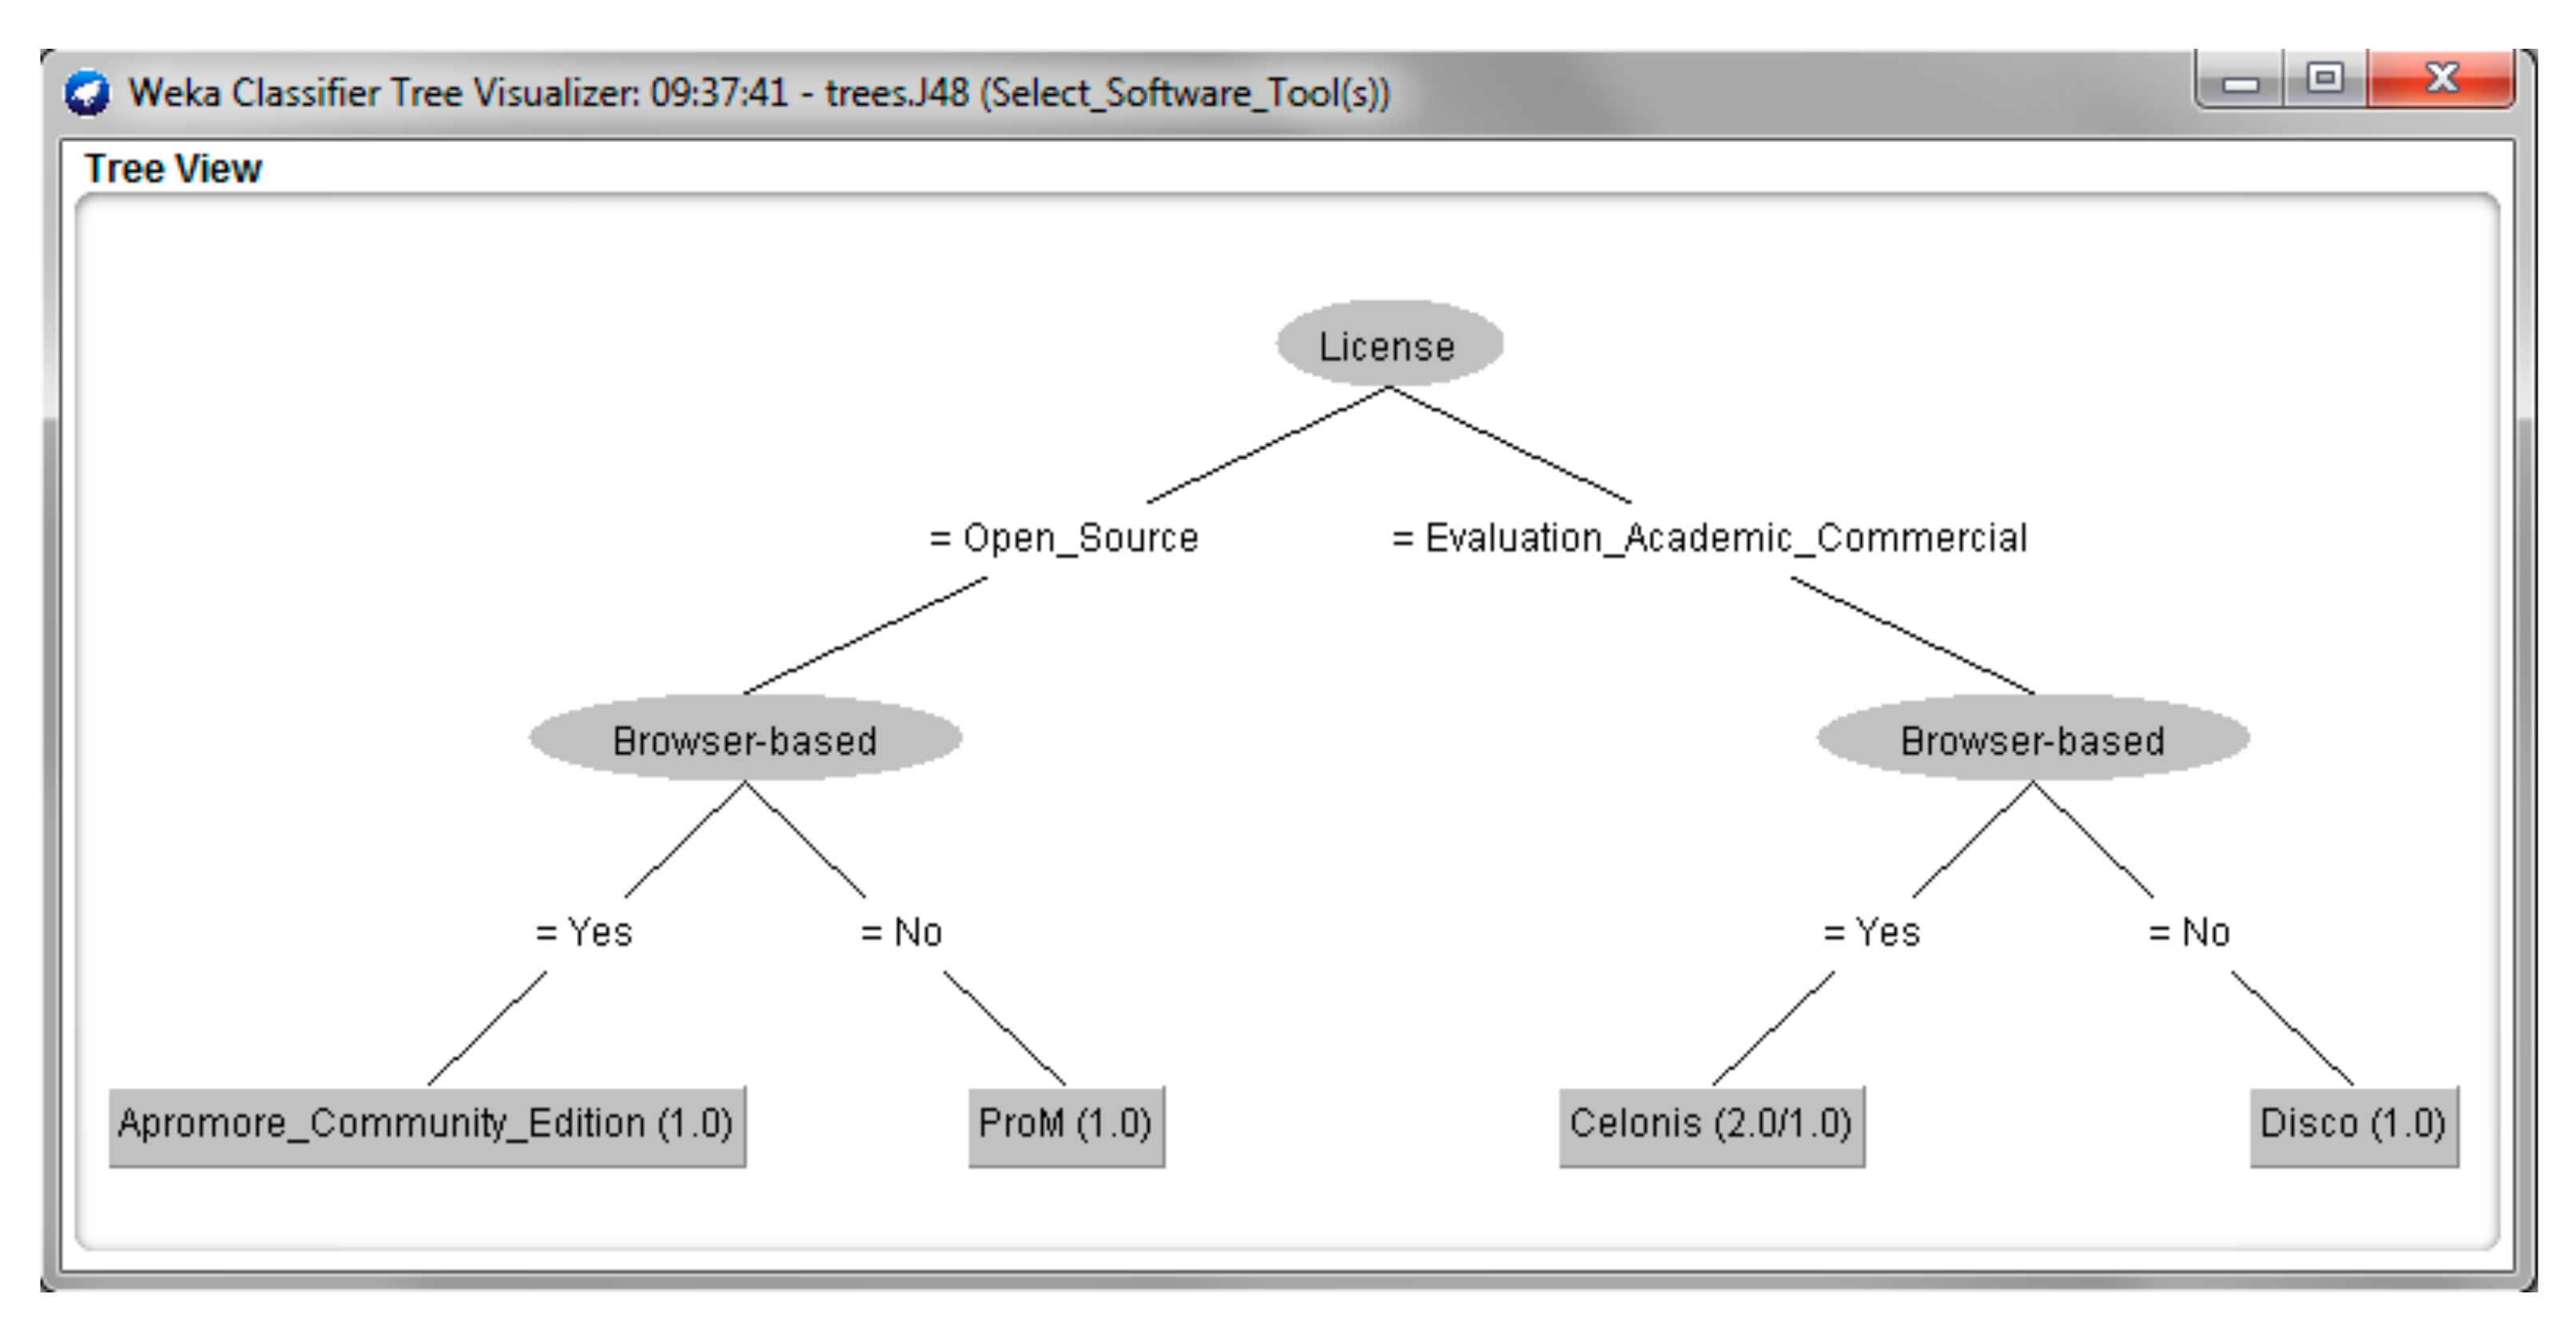
- Define the attributes. We define one attribute for each one of the comparative analysis criteria. Each attribute includes the name of the respective criterion and all its possible values. For example, we can define an attribute “Filtering {Yes, No}”, another attribute “License {Open_Source, Evaluation_Academic_Commercial}”, etc. Furthermore, the last attribute that we define describes the result. The possible values of the result attribute are all the software tools that we want to compare. For example, we can define an attribute “Result {Celonis, myInvenio, ProM}”. Software tools will be displayed as leaf nodes in the decision tree.
- Define the data. We define the different combinations of the values of all the attributes (i.e., all the different combinations of the values of all the comparative analysis criteria and the software tools). In this way, we define the resulting software tool for the different combinations of comparative analysis criteria values.For example, if, in Step 2, we have defined:
- Three attributes to describe comparative analysis criteria (e.g., “License {Open_Source, Evaluation_Academic_Commercial}”, “Filtering {Yes, No}”, and “Discovery {Yes, No}”);
- The last attribute to describe the resulting software tools (e.g., “Result {Celonis, myInvenio, ProM}”),
then the data could be:- Evaluation_Academic_Commercial, Yes, Yes, Celonis;
- Evaluation_Academic_Commercial, Yes, Yes, myInvenio;
- Open_Source, Yes, Yes, ProM.
- Create the decision tree. After the completion of Steps 1, 2, and 3, we can use an algorithm such as C4.5 and a tool such as Weka (see below) to create the decision tree. In the resulting decision tree, the root and the internal nodes represent comparative analysis criteria, the lines represent different values of the criteria, and the leaf nodes represent software tools. Using the resulting decision tree, stakeholders will be able to easily see, in a tree-like model, the software tool that best suits their needs, depending on the values of the selected criteria.
7. Selection of Software Tool(s) Using AHP
- Hierarchical analysis of the decision problem: In the first step, the ultimate goal pursued in the decision problem under study is broken down into sub-goals, which are then increasingly analyzed in the patterns of a hierarchical structure. At the top of this hierarchical structure is the ultimate goal, which, in our case, is the selection of the software tool that best suits our needs. The criteria are the comparative analysis criteria (e.g., discovery, conformance, filtering, statistics, etc.) that we want to use for the comparative analysis of the software tools. The alternatives are the leaves of the tree, which, in our case, are the software tools that we want to compare (e.g., Celonis, Disco, ProM, etc.).
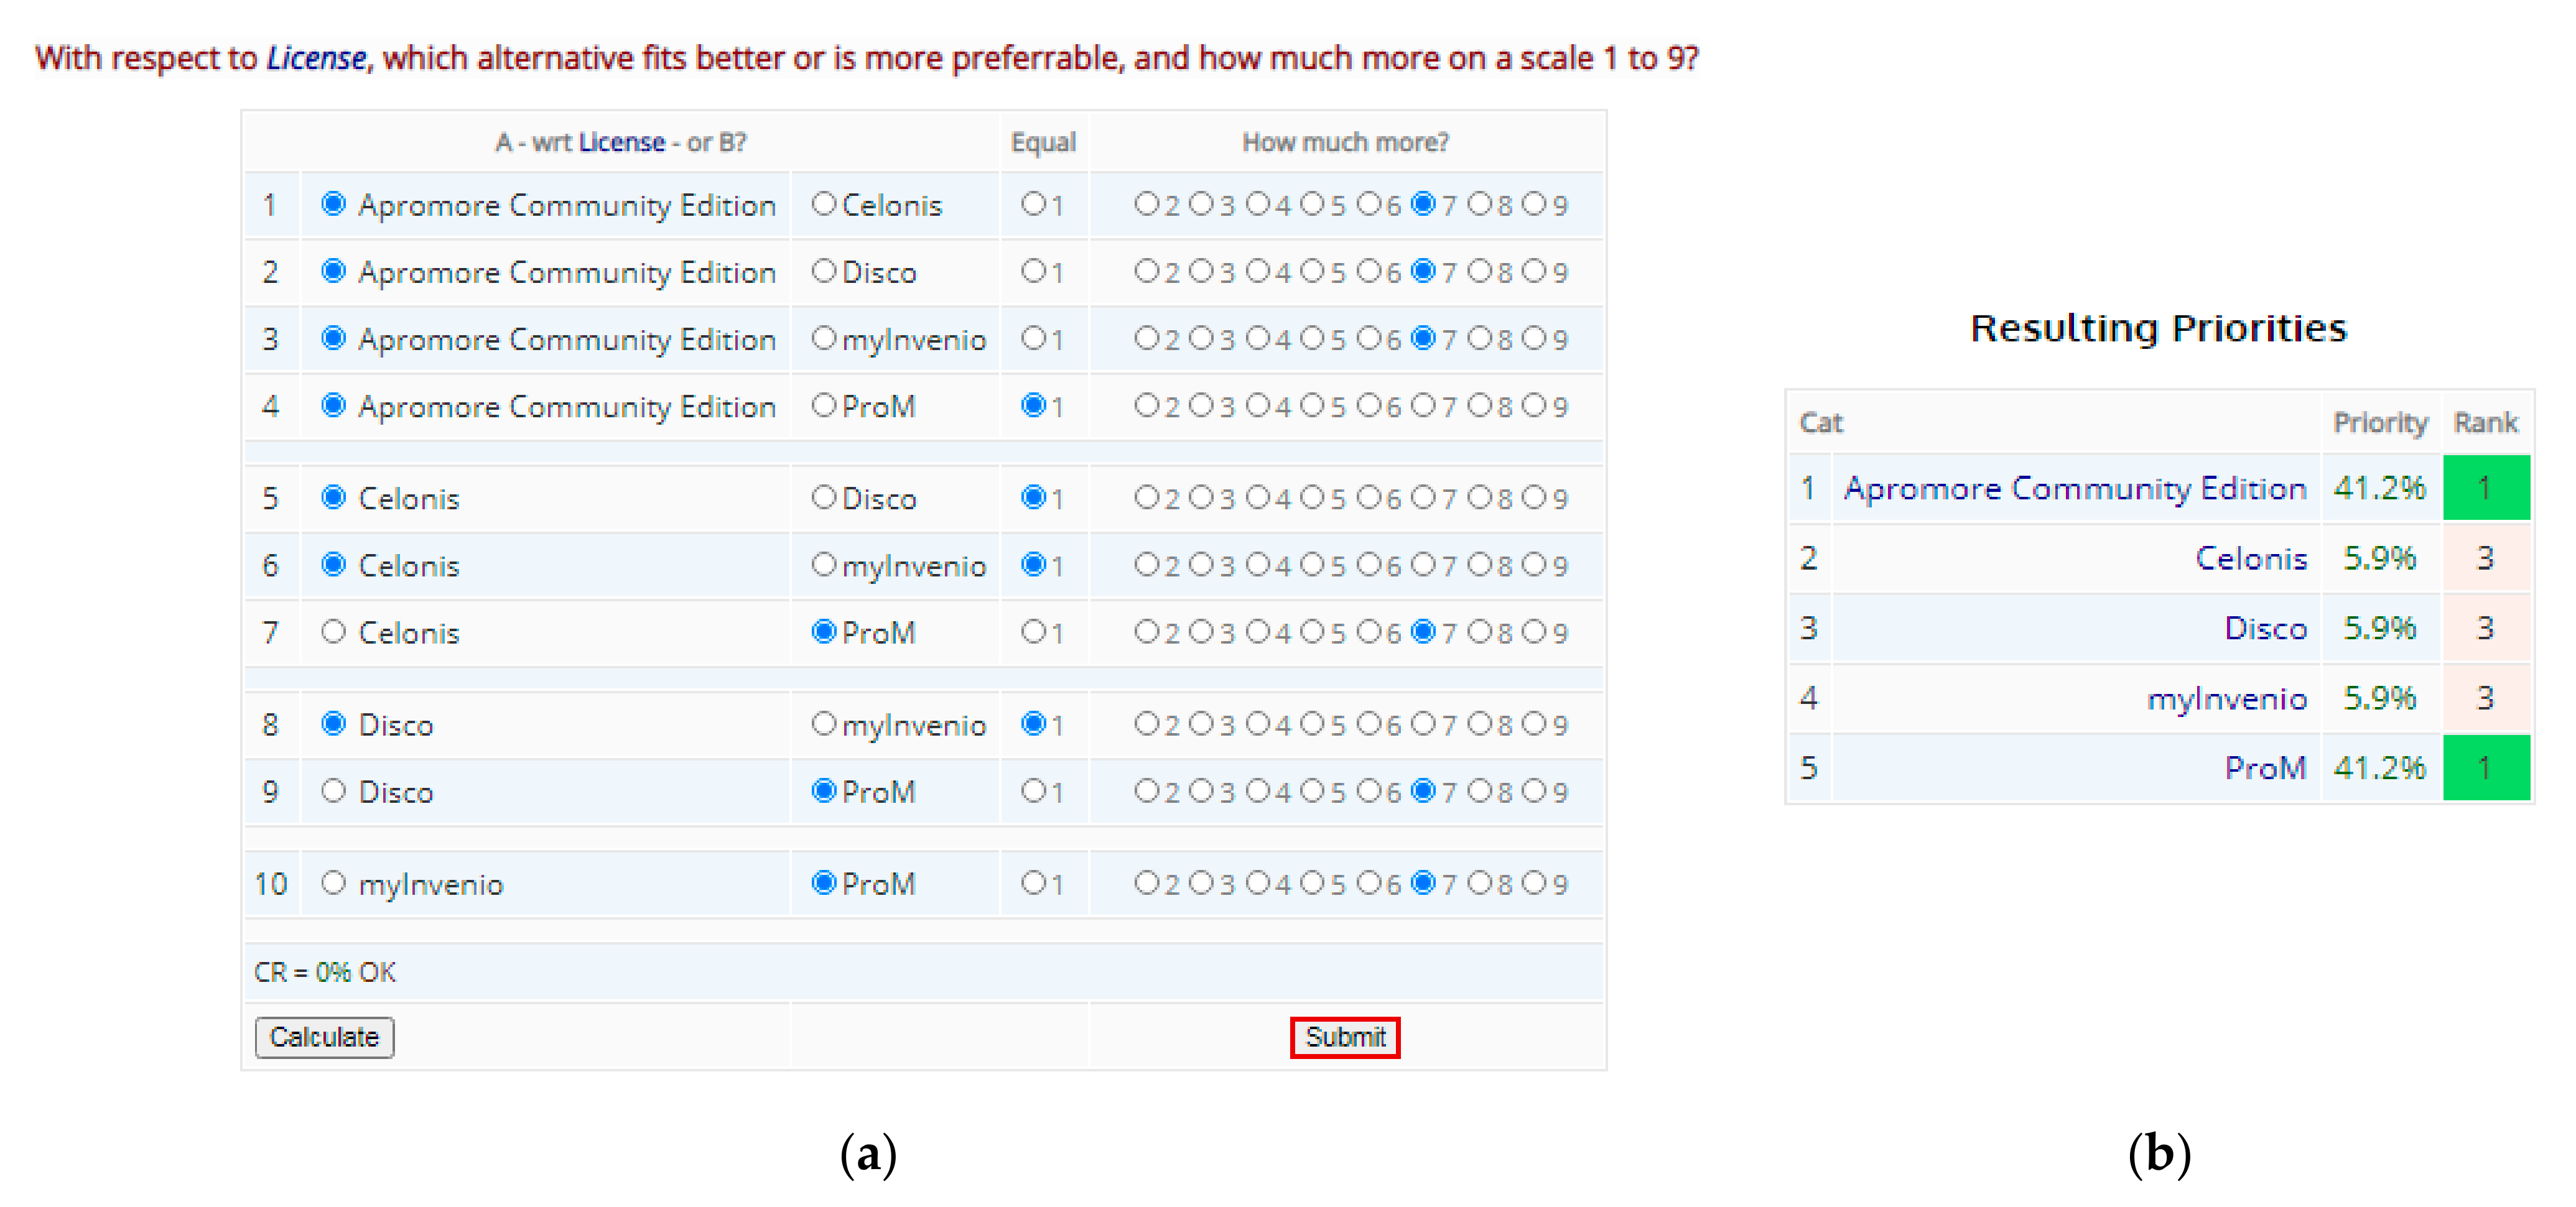
- Collection of preferences: At each level of the hierarchical structure, its elements, i.e., the criteria, are compared in pairs in terms of the degree of preference of one over the other in relation to the criterion of the immediately higher level, i.e., the parent element. This creates an array of pairs of comparisons, the number of which is the same as the number of nodes in the tree, excluding the leaves (alternatives). Therefore, in this step, we make pairwise comparisons of the comparative analysis criteria (e.g., discovery with conformance, then discovery with filtering, then discovery with statistics, etc.) concerning their importance in reaching the goal to select the software tool(s). The consistency of the collected preferences is evaluated with the Consistency Ratio (CR) [30].
- Calculation of individual priorities: In the third step, which is purely computational, the relative priorities (weights) of the comparable decision elements are calculated for each comparison table in relation to the parent element. Hence, in this step, we pairwise compare the software tools (e.g., Celonis with Disco, then Celonis with ProM, etc.) with respect to their importance for each criterion separately (e.g., discovery, etc.).
- Synthesis of the individual priorities: In the last step, which is also purely computational, the local weights of the data are synthesized, as they emerge from the individual comparison tables, into general priorities of the alternatives (leaves of the tree structure) with respect to the ultimate goal (root). Weight synthesis is performed with multiplication between bottom-up weight tables, that is, from the lowest to the highest hierarchical level. Thus, in this step, we find the software tool(s) having the highest overall priority.
8. Example
8.1. Phase 1: Listing of Process Mining Software Tools to Be Compared
- Apromore Community Edition: Apromore is an open-source collaborative business process analytics platform. Some of the advantages of Apromore are that it (i) has an easily extensible framework, where new plugins can be added to a system of advanced business process analytics capabilities [34]; (ii) provides a shared workspace of logs and models; (iii) includes a multi-log animation and flow comparison (https://apromore.org accessed on 5 February 2021).
- Celonis: Some of the advantages of Celonis are its (i) AI-driven learning, i.e., algorithms can learn from the outcomes of each recommended action in order to improve future recommendations—and, ultimately, execution capacity—over time; (ii) capability to identify process execution gaps and assess which of them have the greatest impact; (iii) capability to automate real-time interventions across systems and recommend next best actions (https://www.celonis.com/solutions accessed on 5 February 2021).
- Disco: Some of the advantages of Disco are the (i) project view, providing the ability to manage datasets and add notes for each of them; (ii) advanced mapping feature that makes configuration efficient and sorting of data fast; (iii) ability to choose between various process metric visualizations projected on a map (https://fluxicon.com/disco/ accessed on 5 February 2021).
- myInvenio: Some of the advantages of myInvenio are its (i) ability to automatically discover processes from many company data and stakeholders (e.g., CRM, ERP, etc.) by providing end-to-end process streamlining; (ii) ability to identify best performers and critical activities and resources; (iii) ability to identify process improvements and simulate process savings (https://www.my-invenio.com/ accessed on 5 February 2021).
- ProM: It is an open-source framework. Some of the advantages of ProM are that (i) it supports the development of plug-ins [17], which can be used for implementing process mining algorithms [10]; (ii) it supports a wide variety of process mining techniques. ProM is aimed largely at academic and research communities. (http://www.promtools.org/doku.php accessed on 5 February 2021).
8.2. Phase 2: Listing of Comparative Analysis Criteria
8.3. Phase 3: Listing of Comparative Analysis Criteria Values per Process Mining Software Tool
8.4. Phase 4: Selection of Software Tool(s)
8.4.1. Ontology-Based Selection
8.4.2. Selection of Software Tool(s) Using Decision Tree
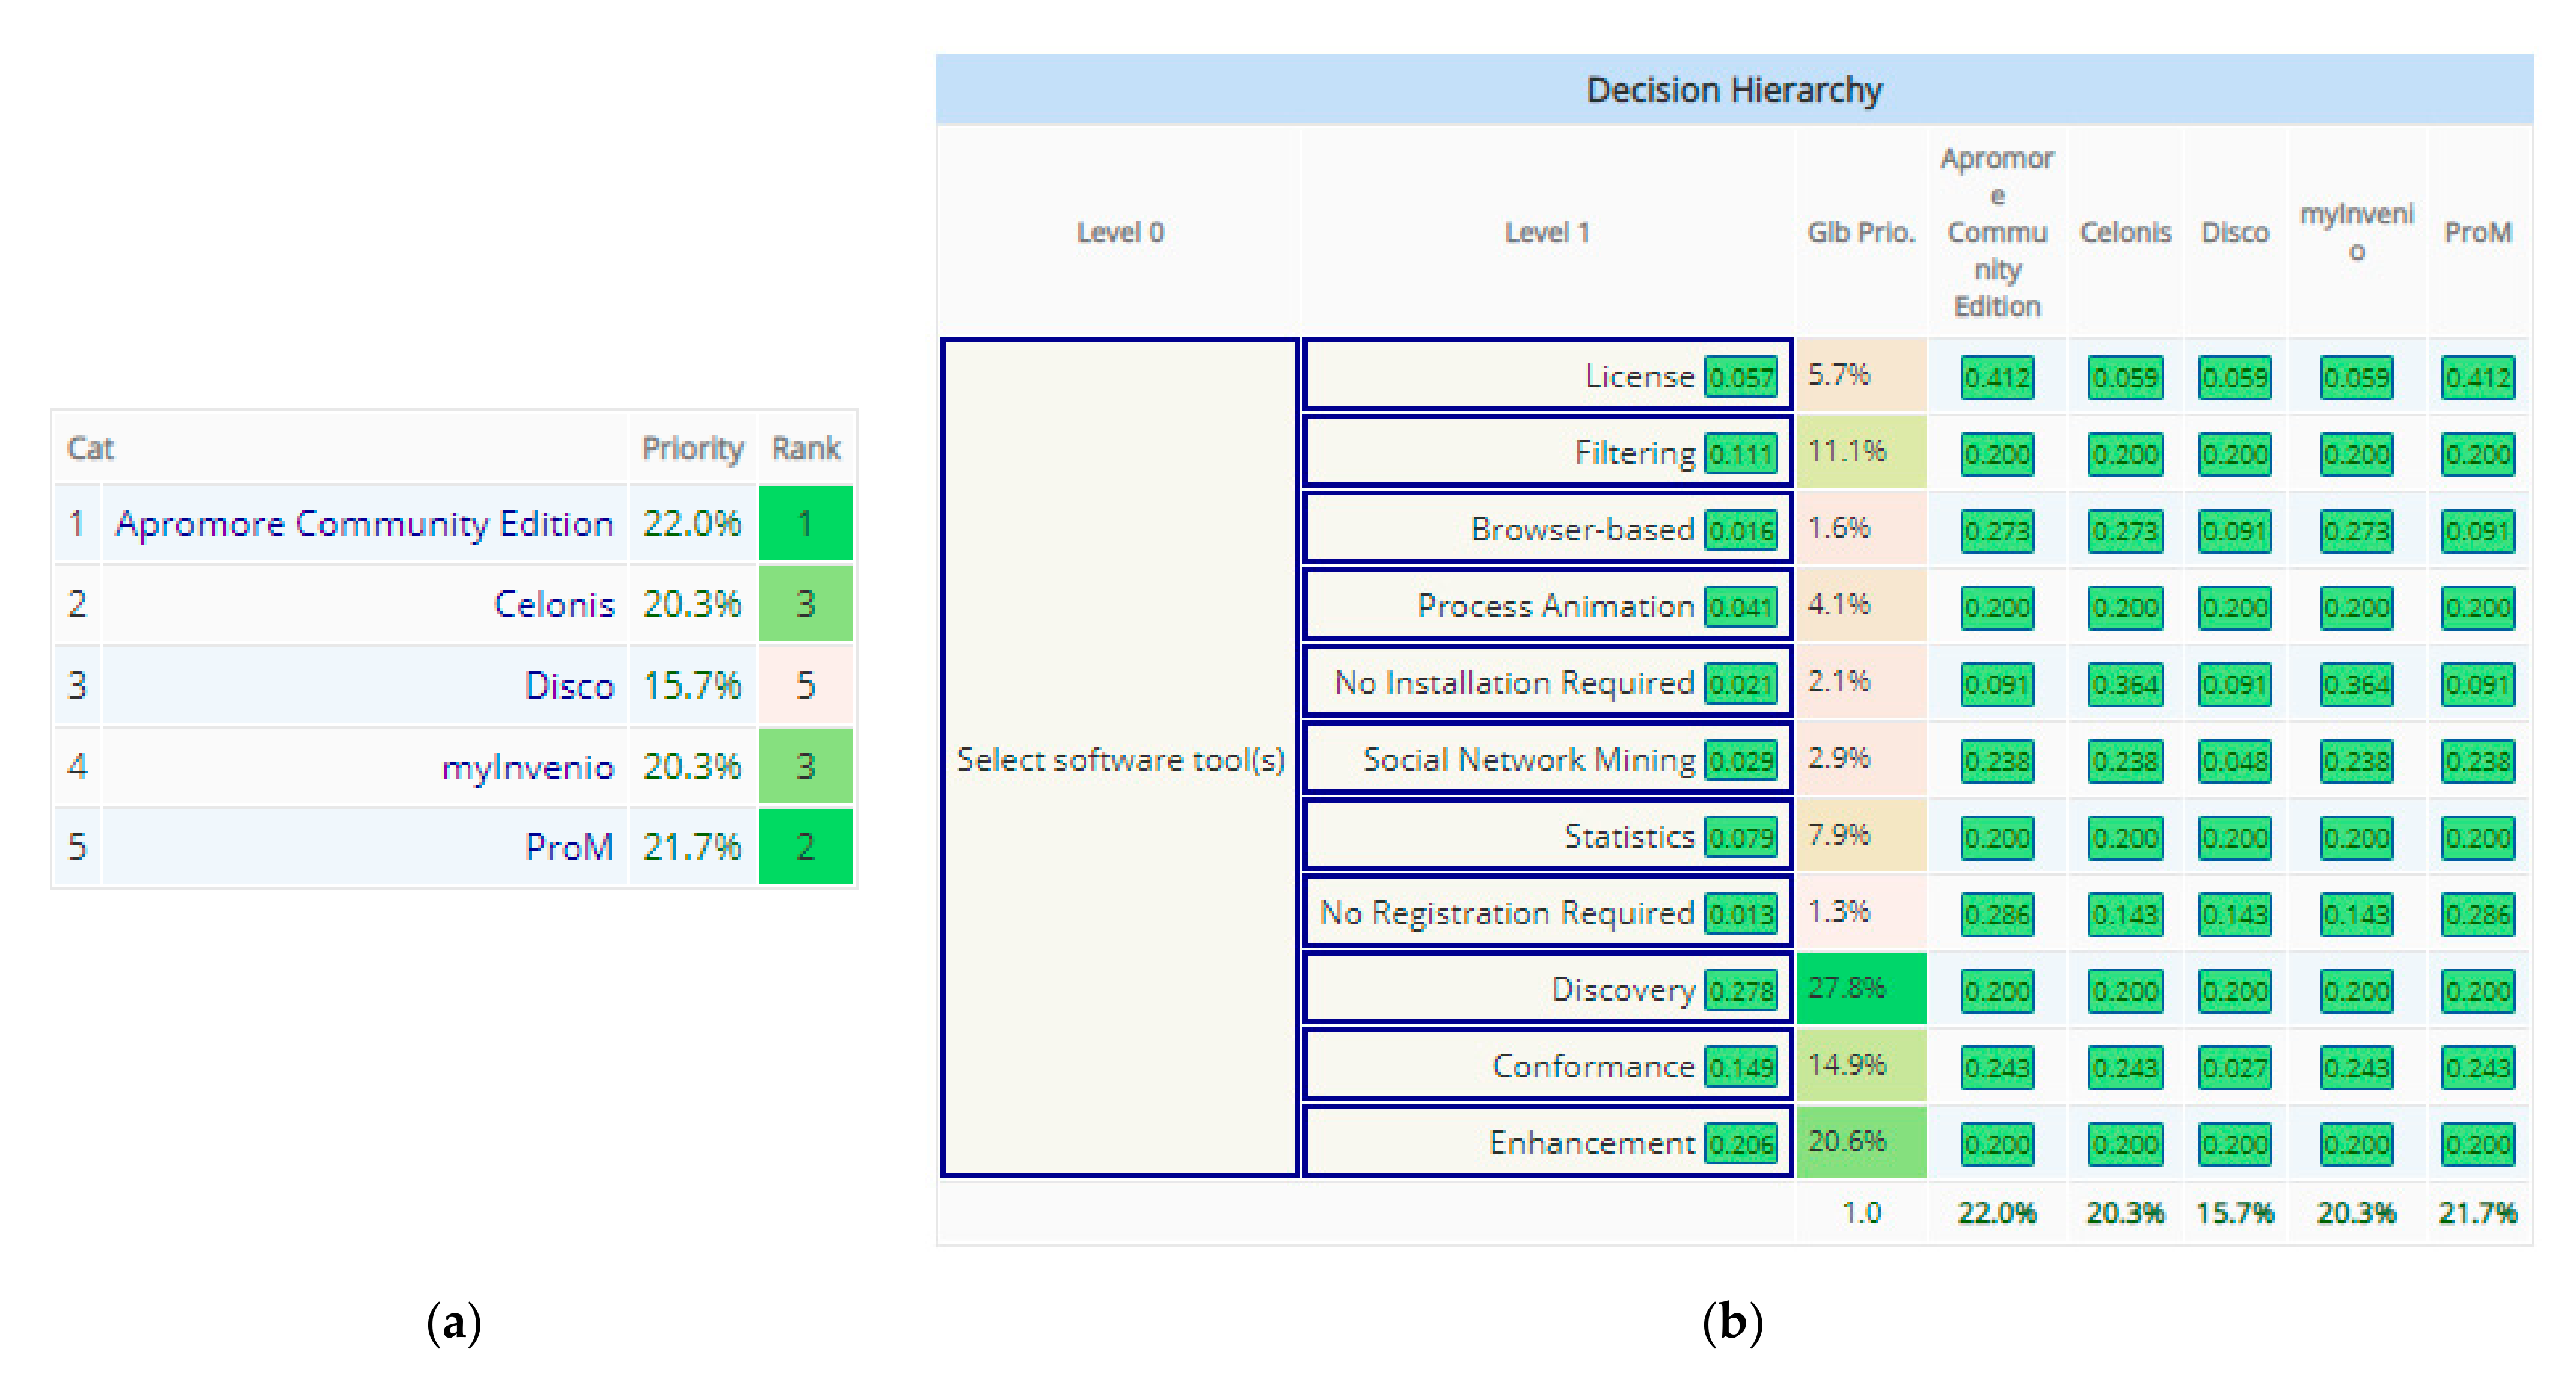
8.4.3. Selection of Software Tool(s) Using AHP
- A goal: Select software tool(s).
- Eleven Criteria: License; Filtering; Browser-based; Process Animation; No Installation Required; Social Network Mining; Statistics; No Registration Required; Discovery; Conformance; Enhancement.
- Five Alternatives (the software tools): Apromore Community Edition; Celonis; Disco; myInvenio; ProM.
- Discovery (27.8%). Discovery can be used to produce the process model of the company, using the event log [2]. The model is a prerequisite for enhancement and conformance.
- Enhancement (20.6%). Enhancement can be used to modify the process model of the company to reflect reality in a better way. Moreover, enhancement can be used to add new perspectives to the process model of the company and show bottlenecks in company processes, information about resources, service levels, throughput times, frequencies, decision rules, and quality metrics [13].
- Conformance (14.9%). Conformance can be used to detect, locate, and explain deviations in the supply chain processes of the company and to evaluate the severity of these deviations [13].
- Filtering (11.1%). Filtering can be used for displaying only specific information of the supply chain process.
- Statistics (7.9%). Statistics can be useful for providing an overview of company processes.
- License (5.7%). In our example, an open-source software tool is preferred.
- Process Animation (4.1%). Process Animation can be useful for displaying company processes and identifying bottlenecks.
- Social Network Mining (2.9%). Social Network Mining can be used for showing interactions among people, during supply chain processes.
- No Installation Required (2.1%). In our example, this criterion is not very important.
- Browser-based (1.6%). In our example, this criterion is not very important.
- No Registration Required (1.3%). In our example, this criterion is not very important.
- Apromore Community Edition (22.0%)
- ProM (21.7%)
- Celonis (20.3%)
- myInvenio (20.3%)
- Disco (15.7%)
9. Discussion
- Ontology-based selection. In this method, we select the software tool that best suits user needs, from the list of the process mining software tools listed in Phase 1, using ontology, the comparative analysis criteria listed in Phase 2, and the values listed in Phase 3.
- Selection of Software Tool(s) Using Decision Tree. In this method, we select the software tool that best suits user needs, from the list of the process mining software tools listed in Phase 1, using a decision tree, the comparative analysis criteria listed in Phase 2, and the values listed in Phase 3.
- Selection of Software Tool(s) Using AHP. In this method, we select the software tool that best suits user needs, from the list of the process mining software tools listed in Phase 1, using AHP, the comparative analysis criteria listed in Phase 2, and the values listed in Phase 3.
10. Conclusions
Author Contributions
Funding
Conflicts of Interest
References
- Van Der Aalst, W.M.; Reijers, H.A.; Weijters, A.J.M.M.; Van Dongen, B.F.; De Medeiros, A.K.A.; Song, M.; Verbeek, H.M.W. Business process mining: An industrial application. Inf. Syst. 2007, 32, 713–732. [Google Scholar] [CrossRef]
- Van Der Aalst, W.; Adriansyah, A.; De Medeiros, A.K.A.; Arcieri, F.; Baier, T.; Blickle, T.; Burattin, A. Process mining manifesto. In International Conference on Business Process Management; Springer: Berlin/Heidelberg, Germany, August 2011; pp. 169–194. [Google Scholar]
- Agarwal, N.; Singh, L. Process mining tools: A comparative analysis and review. Adv. Comput. Sci. Inf. Technol. ACSIT 2014, 1, 26–29. [Google Scholar]
- Dakic, D.; Sladojevic, S.; Lolic, T.; Stefanovic, D. Process Mining Possibilities and Challenges: A Case Study. In Proceedings of the 2019 IEEE 17th International Symposium on Intelligent Systems and Informatics (SISY), Subotica, Serbia, 12–14 September 2019; pp. 000161–000166. [Google Scholar]
- Claes, J.; Poels, G. Process mining and the ProM framework: An exploratory survey. In International Conference on Business Process Management; Springer: Berlin/Heidelberg, Germany, September 2012; pp. 187–198. [Google Scholar]
- Turner, C.; Tiwari, A.; Olaiya, R.; Xu, Y. Process mining: From theory to practice. Bus. Process. Manag. J. 2012, 18, 493–512. [Google Scholar] [CrossRef] [Green Version]
- Celik, U.; Akçetin, E. Process mining tools comparison. Online Acad. J. Inf. Technol. 2018, 9, 97–104. [Google Scholar]
- Da Silva, L.F.N. Process Mining: Application to a Case Study. 2014. Available online: https://core.ac.uk/download/pdf/143395465.pdf (accessed on 5 February 2021).
- Van der Aalst, W. MBusiness process simulation revisited. In Workshop on Enterprise and Organizational Modeling and Simulation; Springer: Berlin/Heidelberg, Germany, June 2010; pp. 1–14. [Google Scholar]
- Van Dongen, B.F.; de Medeiros, A.K.A.; Verbeek, H.M.W.; Weijters, A.J.M.M.; van Der Aalst, W.M. The ProM framework: A new era in process mining tool support. In International Conference on Application and Theory of Petri Nets; Springer: Berlin/Heidelberg, Germany, June 2005; pp. 444–454. [Google Scholar]
- Aldwairi, T.; Perera, D.; Novotny, M.A. Measuring the Impact of Accurate Feature Selection on the Performance of RBM in Comparison to State of the Art Machine Learning Algorithms. Electronics 2020, 9, 1167. [Google Scholar] [CrossRef]
- Dogan, O.; Martinez-Millana, A.; Rojas, E.; Sepúlveda, M.; Munoz-Gama, J.; Traver, V.; Fernandez-Llatas, C. Individual Behavior Modeling with Sensors Using Process Mining. Electronics 2019, 8, 766. [Google Scholar] [CrossRef] [Green Version]
- Van Der Aalst, W. Process Mining: Discovery, Conformance and Enhancement of Business Processes; Springer Science+Business Media: Berlin/Heidelberg, Germany, 2011. [Google Scholar]
- Van der Aalst, W.; Weijters, T.; Maruster, L. Workflow mining: Discovering process models from event logs. IEEE Trans. Knowl. Data Eng. 2004, 16, 1128–1142. [Google Scholar] [CrossRef]
- Rozinat, A.; Van der Aalst, W.M. Conformance checking of processes based on monitoring real behavior. Inf. Syst. 2008, 33, 64–95. [Google Scholar] [CrossRef]
- Leemans, S.J.; Fahland, D.; van der Aalst, W.M. Exploring processes and deviations. In International Conference on Business Process Management; Springer: Cham, Switzerland, September 2014; pp. 304–316. [Google Scholar]
- Van der Aalst, W.M.; van Dongen, B.F.; Günther, C.W.; Rozinat, A.; Verbeek, E.; Weijters, T. ProM: The process mining toolkit. BPM Demos 2009, 489, 2. [Google Scholar]
- Günther, C.W.; Rozinat, A. Disco: Discover Your Processes. BPM Demos 2012, 940, 40–44. [Google Scholar]
- Van der Aalst, W. Spreadsheets for business process management: Using process mining to deal with “events” rather than “numbers”? Bus. Process. Manag. J. 2018, 24, 105–127. [Google Scholar] [CrossRef] [Green Version]
- Van der Aalst, W.M.; Song, M. Mining social networks: Uncovering interaction patterns in business processes. In International Conference on Business Process Management; Springer: Berlin/Heidelberg, Germany, June 2004; pp. 244–260. [Google Scholar]
- Augusto, A.; Conforti, R.; Dumas, M.; La Rosa, M.; Maggi, F.M.; Marrella, A.; Mecella, M.; Soo, A. Automated Discovery of Process Models from Event Logs: Review and Benchmark. IEEE Trans. Knowl. Data Eng. 2019, 31, 686–705. [Google Scholar] [CrossRef] [Green Version]
- Vázquez-Barreiros, B.; Mucientes, M.; Lama, M. Mining Duplicate Tasks from Discovered Processes. In ATAED@ Petri Nets/ACSD; CEUR-WS.org: Brussels, Belgium, 2015; pp. 78–82. [Google Scholar]
- Safavian, S.R.; Landgrebe, D. A survey of decision tree classifier methodology. IEEE Trans. Syst. Man Cybern. 1991, 21, 660–674. [Google Scholar] [CrossRef] [Green Version]
- Taticchi, P.; Tonelli, F.; Cagnazzo, L. A decomposition and hierarchical approach for business performance measurement and management. Meas. Bus. Excell. 2009, 13, 47–57. [Google Scholar] [CrossRef]
- Fensel, D. Ontologies; Springer: Berlin/Heidelberg, Germany, 2001; pp. 11–18. [Google Scholar]
- Noy, N.F.; Crubézy, M.; Fergerson, R.W.; Knublauch, H.; Tu, S.W.; Vendetti, J.; Musen, M.A. Protégé-2000: An open-source ontology-development and knowledge-acquisition environment. In AMIA Annual Symposium Proceedings; American Medical Informatics Association: Washington, DC, USA, 2003; p. 953. [Google Scholar]
- Horridge, M.; Knublauch, H.; Rector, A.; Stevens, R.; Wroe, C. A Practical Guide to Building OWL Ontologies Using the Protégé-OWL Plugin and CO-ODE Tools Edition 1.0; University of Manchester: Manchester, UK, 2004. [Google Scholar]
- Peng, W.; Chen, J.; Zhou, H. An Implementation of ID3-Decision Tree Learning Algorithm. 2009. Available online: http://citeseerx.ist.psu.edu/viewdoc/download?doi=10.1.1.471.5158&rep=rep1&type=pdf (accessed on 5 February 2021).
- Brijain, M.; Patel, R.; Kushik, M.; Rana, K. A Survey on Decision Tree Algorithm for Classification. 2014. Available online: http://citeseerx.ist.psu.edu/viewdoc/download?doi=10.1.1.673.2797&rep=rep1&type=pdf (accessed on 5 February 2021).
- Mu, E.; Pereyra-Rojas, M. Understanding the analytic hierarchy process. In Practical Decision Making; Springer: Cham, Switzerland, 2017; pp. 7–22. [Google Scholar]
- Saaty, T.L. Decision making with the analytic hierarchy process. Int. J. Serv. Sci. 2008, 1, 83. [Google Scholar] [CrossRef] [Green Version]
- Goepel, K.D. Implementation of an Online Software Tool for the Analytic Hierarchy Process (AHP-OS). Int. J. Anal. Hierarchy Process. 2018, 10. [Google Scholar] [CrossRef] [Green Version]
- Goepel, K.D. AHP Online System—AHP-OS. 19 September 2019. Available online: https://bpmsg.com/academic/ahp.php (accessed on 24 December 2020).
- Fornari, F.; La Rosa, M.; Polini, A.; Re, B.; Tiezzi, F. Checking Business Process Correctness in Apromore. In International Conference on Advanced Information Systems Engineering; Springer: Cham, Switzerland, June 2018; pp. 114–123. [Google Scholar]
- Bpmsg. Available online: https://bpmsg.com/ahp/ahp-altcalc.php?n=5&t=License&c[0]=Apromore+Community+Edition&c[1]=Celonis&c[2]=Disco&c[3]=myInvenio&c[4]=ProM (accessed on 14 June 2020).
- Goepel, K.D. AHP Group Results. 3 October 2019. Available online: https://bpmsg.com/ahp/ahp-group.php?sc=qybaru (accessed on 24 December 2020).


| Name | Description |
|---|---|
| ABBYY Timeline | ABBYY Timeline is a process intelligence platform that provides process mining technology and advanced tasks. Some of its features are discovery, monitoring, analysis and prediction of process behavior, etc. (https://www.abbyy.com/timeline/ accessed on 5 February 2021). |
| Apromore | Apromore is described in Section 8.1. (https://apromore.org/ accessed on 5 February 2021). |
| ARIS Process Mining | Some of the features of ARIS Process Mining are discovery, process analysis, visualization, process improvement, use of one integrated process lifecycle tool, etc. (https://www.softwareag.com/en_corporate/platform/aris/process-mining.html accessed on 5 February 2021). |
| Celonis | Celonis is described in Section 8.1. (https://www.celonis.com/solutions/ accessed on 5 February 2021). |
| CoBeFra | CoBeFra is a comprehensive benchmarking suite that can be used in order to set up large-scale conformance-checking experiments. (http://processmining.be/cobefra/ accessed on 5 February 2021). |
| Dbminer | Dbminer is a tool that can be used for the mining of Petri nets from a behavior described as the union of several transition systems. This tool is based on the theory of (generalized) regions. (http://people.ac.upc.edu/msole/homepage/dbminer.html accessed on 5 February 2021). |
| Disco | Disco is described in Section 8.1. (https://fluxicon.com/disco/ accessed on 5 February 2021). |
| EverFlow | Some of the features of EverFlow are discovery, monitoring of process executions, visual identification of bottlenecks, inconsistencies and inefficiencies, embedded analytics, process activities, and teams optimization, etc. (https://www.icarotech.com/en/everflowen/ accessed on 5 February 2021). |
| Explora Process | Explora Process can be used for the identification of process inefficiencies affecting process costs, quality, time, and risk. It can provide tools that may improve efficiency and productivity and solve issues. Moreover, it can verify the compliance of company processes with current legislation and internal procedures and it can identify where discrepancies occur, etc. (https://www.integris.it/explora-en/#explora-process accessed on 5 February 2021). |
| LANA Process Mining | Some of the features of LANA Process Mining are process visualization, conformance checking, monitoring, root cause analysis that allows the automatic identification of the root causes of process problems, etc. (https://lanalabs.com/en/lana-process-mining/ accessed on 5 February 2021). |
| Logpickr Process Explorer 360 | Some of the features of Logpickr Process Explorer 360 are highlights on business processes, conformance, root cause analysis, end-to-end view, prediction, analysis, etc. (https://www.logpickr.com/en/product.html accessed on 5 February 2021). |
| MEHRWERK ProcessMining (MPM) | Some of the features of MEHRWERK ProcessMining (MPM) are visualization, conformance checking, root cause analysis, action and workflow management, process monitoring, and process prediction, etc. (https://mpm-processmining.com/en/mpm-processmining-digital-transformation-operational-excellence/ accessed on 5 February 2021, https://mpm-processmining.com/en/augmented-process-mining/ accessed on 5 February 2021). |
| Minit | Some of the features of Minit are root cause analysis, check process compliance, process simulation, use of custom metrics, hierarchical process mining, identification of repeating activities, process comparison, etc. (https://www.minit.io/software accessed on 5 February 2021). |
| MonkeyMiner | Some of the features of MonkeyMiner are collection, filtering, sorting, merging, and anonymization of data, discovery of process flows, discovery of new patterns and bottlenecks, reporting, etc. (https://www.monkeymining.com/home-english/ accessed on 5 February 2021). |
| myInvenio | myInvenio is described in Section 8.1. (https://www.my-invenio.com/ accessed on 5 February 2021). |
| PAFnow | Some of the features of PAFnow are visualization, process analysis, finding of root causes of abnormalities automatically, receiving notifications or automatically starting workflows in applications, etc. (https://pafnow.com/product/ accessed on 5 February 2021). |
| Process Diamond Intelligence | Some of the features of Process Diamond Intelligence are process discovery, compliance checking, finding differences in the way process instances are executed, rule specifications, dashboard, finding bottlenecks, simulation, predictive monitoring, analyses, filtering, etc. (https://processdiamond.com/product/ accessed on 5 February 2021). |
| ProM | ProM is described in Section 8.1. (http://www.promtools.org/doku.php accessed on 5 February 2021). |
| ProDiscovery | Some of the features of ProDiscovery are process map and regeneration, analysis of process pattern, various analyses, filtering and dashboard, etc. (https://www.puzzledata.com/process-mining_eng/ accessed on 5 February 2021, https://www.puzzledata.com/prodiscovery_eng/ accessed on 5 February 2021). |
| QPR ProcessAnalyzer | Some of the features of QPR ProcessAnalyzer are discovery, investigation of root causes, conformance, and long cases, building of dynamic dashboards, actions based on apps and business alerts, reporting, visualization, auditing, and compliance, etc. (http://www.qpr.com/products/qpr-processanalyzer accessed on 5 February 2021). |
| Scheer Process Mining | Some of the features of Scheer Process Mining are discovery, conformance, enhancement, etc. (https://www.scheer-group.com/en/process-mining/ accessed on 5 February 2021). |
| Signavio Process Intelligence | Some of the features of Signavio Process Intelligence are process discovery, conformance checking, task mining, process overview, etc. (https://www.signavio.com/products/process-intelligence/ accessed on 5 February 2021). |
| Skan | Some of the features of Skan are discovery, simulation, predictions, conformance, analysis, improvement, simulation, etc. (https://skan.ai/ accessed on 5 February 2021). |
| StereoLOGIC Discovery Analyst | Some of the features of StereoLOGIC Discovery Analyst are automatic extraction of business processes from business applications in real time, visualization, comparison capabilities, validation and extension of models, integration with other BPMN-enabled tools, etc. (https://www.iag.biz/services/rdm-alm-software/stereologic-discovery/ accessed on 5 February 2021). |
| UiPath Process Mining | Some of the features of UiPath Process Mining are visualization, animation, finding of bottlenecks, recommendations, monitoring, analysis, alerting, etc. (https://www.uipath.com/product/process-mining accessed on 5 February 2021). |
| Worksoft Analyze | Some of the features of Worksoft Analyze are discovery, visualization, analytics, identification of risks and inefficiencies, etc. (https://www.worksoft.com/products/worksoft-analyze accessed on 5 February 2021). |
| XMAnalyzer | Some of the features of XMAnalyzer are insight into the current operating business processes, ability to analyze sequence flow of processes based on transactions, events, or activities, graphical illustration of all process paths in one diagram, with the ability to see individual process paths, etc. (http://xmpro.com/xmpro-releases-new-ibos-process-mining-module-xmanalyzer/ accessed on 5 February 2021). |
| Criterion | Description |
|---|---|
| License | Type of license of the software tool. |
| Filtering | Check if the software tool can provide data filtering [16,17]. |
| Process Animation | Check if the software tool can provide process animation [9,18,19]. |
| Browser-based | Check if the software tool can run in a browser. |
| No Installation Required | Check if no local installation is required in order to use the software tool. |
| Social Network Mining | Check if the software tool can use the information recorded in the event log about the users that execute the activities in order to perform social network mining [20]. |
| Statistics | Check if the software tool can provide statistics. |
| No Registration Required | Check if no registration is required in order to use the software tool without restrictions. |
| Delta Analysis | Check if the software tool supports delta analysis. Delta analysis compares the reference model with the generated model in order to provide answers to problems related to business alignment [7]. |
| Algorithm(s) | Supported algorithm(s) [10,13]. |
| Import Type(s) | Supported import type(s) (e.g., csv, xls, xes) [13,18]. |
| Output Model(s) | Supported output model(s) notation (e.g., Petri nets, BPMN, Transition Systems, Fuzzy Model) [2,10,21]. |
| Discovery | Check if the software tool can provide discovery. Discovery is described in Section 2.2.1. |
| Conformance | Check if the software tool can provide conformance. Conformance is described in Section 2.2.2. |
| Enhancement | Check if the software tool can provide enhancement. Enhancement is described in Section 2.2.3. |
| Detection | Check if the software tool can detect deviations at runtime. In detection, a model is compared with a partial trace, and if a violation is detected, then an alert can be generated [13]. |
| Prediction | Check if prediction is supported. In prediction, the current case is compared to similar cases that occurred in the past. Based on this information, predictions about the events that will follow can be made [13]. |
| Recommendation | Check if the software tool supports recommendation. In recommendation, based on historic information, recommendations about the selection of the next activity can be made [13]. |
| Noise | Check if the software tool can deal with noise. Noisy, i.e., infrequent/exceptional, behavior should not be displayed in the discovered model. Stakeholders are typically interested about the main behavior. Furthermore, it is difficult to extract meaningful information by very rare activities or patterns [13]. |
| Concurrent Processes | Check if the software tool has the ability to discover and represent a model that contains concurrent processes. |
| Duplicate Tasks | Check if the software tool can address the “Duplicate Tasks” problem. “Duplicate tasks” refers to situations where multiple tasks in a process have the same label. In situations such as this, algorithms may need extra effort to find out which log events belong to which transition [22]. |
| Mining Loops | Check if the software tool can accurately discover a model that contains loops [13]. |
| Method | Reasons for Selecting the Method for the Comparative Analysis of the Software Tools |
|---|---|
| Ontology | This method supports the creation of an ontology containing the software tools, the comparative analysis criteria, and their values for each of the process mining software tools to be compared. The created ontology can then be inserted into a tool such as Protégé. In this way, the methodology supports the execution of complex queries in order to find the software tool that is most suitable for the stakeholders. For example, the execution of a query searching for the software tool(s) that provide discovery, conformance, filtering, and simulation is supported. Ontology and Protégé are described in Section 5. |
| Decision Tree | This method supports the creation of a decision tree using an algorithm such as C4.5 and the Weka Workbench. In this way, the break-down of a complex decision-making process into a number of simpler decisions is supported, providing a solution which can be easier to interpret [23]. Furthermore, the proposed methodology allows stakeholders to see in a tree-like model which software tool is most suitable for them, depending on the values of the criteria. Decision tree and the C4.5 algorithm are described in Section 6. |
| AHP | This method supports the decomposition of the decision problem into a hierarchy of more easily understood sub-problems, each of which can then be analyzed independently, using AHP. After the hierarchy is built, the various elements can be evaluated by pairwise comparing them concerning their impact on an element that exists above them in the hierarchy. For the comparisons, the judgments of the stakeholders about the relative meaning and importance of the elements can be used. Therefore, in AHP, human judgments, and not just the underlying information, can be used to perform the evaluations. The AHP converts the evaluations to numerical values. The numerical values can then be processed and compared over the entire range of the decision problem. A numerical weight or priority is generated for all of the elements in the hierarchy, allowing them to be compared to one another consistently and rationally. Afterwards, numerical priorities are calculated for all of the decision alternatives. The numerical priorities indicate the relative ability of the alternatives to achieve the goal of the decision [24] and allow users to select the software tool that is most suitable for them. AHP is described in Section 7. |
| Comparative Analysis Criteria | Apromore Community Edition | Celonis | Disco | myInvenio | ProM |
|---|---|---|---|---|---|
| License | Open Source | Evaluation/Academic/Commercial | Evaluation/Academic/Commercial | Evaluation/Academic/Commercial | Open Source |
| Filtering | ✓ | ✓ | ✓ | ✓ | ✓ |
| Browser-based | ✓ | ✓ | X | ✓ | X |
| Process Animation | ✓ | ✓ | ✓ | ✓ | ✓ |
| No Installation Required | X | ✓ | X | ✓ | X |
| Social Network Mining | ✓ | ✓ | X | ✓ | ✓ |
| Statistics | ✓ | ✓ | ✓ | ✓ | ✓ |
| No Registration Required | ✓ | X | X | X | ✓ |
| Discovery | ✓ | ✓ | ✓ | ✓ | ✓ |
| Conformance | ✓ | ✓ | X | ✓ | ✓ |
| Enhancement | ✓ | ✓ | ✓ | ✓ | ✓ |
Publisher’s Note: MDPI stays neutral with regard to jurisdictional claims in published maps and institutional affiliations. |
© 2021 by the authors. Licensee MDPI, Basel, Switzerland. This article is an open access article distributed under the terms and conditions of the Creative Commons Attribution (CC BY) license (http://creativecommons.org/licenses/by/4.0/).
Share and Cite
Drakoulogkonas, P.; Apostolou, D. On the Selection of Process Mining Tools. Electronics 2021, 10, 451. https://doi.org/10.3390/electronics10040451
Drakoulogkonas P, Apostolou D. On the Selection of Process Mining Tools. Electronics. 2021; 10(4):451. https://doi.org/10.3390/electronics10040451
Chicago/Turabian StyleDrakoulogkonas, Panagiotis, and Dimitris Apostolou. 2021. "On the Selection of Process Mining Tools" Electronics 10, no. 4: 451. https://doi.org/10.3390/electronics10040451