1. Introduction
Due to their popularity, mobile devices are becoming more and more part of our daily life. However, these devices, which handle both private and confidential data, are vulnerable to attacks by malicious people, and these are known as cyberattacks. Some of the most well-known recent examples of cyberattacks include the distributed denial of service (DDoS) attack by Mirai Botnet [
1], and the massive data hijacking carried out by the WannaCry ransomware [
2]. Therefore, this situation makes malware detection techniques worth investigating and improving. Malware can be any type of software that serves illegal purposes, such as spoofing or extortion [
3]. This is often the case with adware that sends a lot of ads. In this paper, we generally focus on mobile app malware, and therefore, we use packages to allow us to install them.
Malware can be found in Google Play, which is the official market for Android apps. Indeed, since 2015, the number of malware has increased rapidly, which has encouraged many researchers to develop a number of malware detection methods, such as antivirus available on the Google Play Store, static method, dynamic method and hybrid method, as detailed in
Section 3. However, these methods still have some limitations in terms of performance to detect the malware on the newly installed applications on Android devices, as presented in
Section 3.5.
Therefore, this paper presents an extension of our previously published research work in [
4] regarding malware detection on Android devices.
In [
4], the proposed model is based on client/server architecture to reduce the heavy computation of data on the mobile device and perform the processing remotely on the server for prediction of the newly installed applications. We focused on the static analysis method for malware detection using the random forest regression algorithm ranging from −100 (benign) to 100 (malware) to manage the uncertainty predictions. We obtained good prediction results in terms of performance with good correlation coefficients, minimum computation time, and the smallest number of errors for malware detection.
Consequently, in this paper, we propose BrainShield, a hybrid malware detection model trained on the Omnidroid dataset [
5] to reduce the attacks on Android devices, by improving the accuracy and the precision of well-known malware detection methods. More specifically, our main goal is to determine whether new samples provided to our classification model are malware or not, based on the rules previously established by the learning algorithm.
The main contributions of this paper are as follows:
Describe the architecture of the proposed Model called BrainShield, which is based on (1) a hybrid machine learning malware detection model for Android devices; (2) the fully connected neural networks (i.e., dense layers) composed of three layers (i.e., input layer, hidden layer and output layer) adopting one vector Tensorflow algorithm; and (3) a binary class classification that provides, as output, a probability value between 0 (i.e., benign apps) and 1 (i.e., malware apps);
Implement the proposed model to perform the prediction;
Provide the methodology that brings the detection results;
Train the Model with Omnidroid [
5], which is the most known and diversified dataset. This dataset contains 22,000 samples and about 32,000 features (i.e., 26,000 static features and 6000 dynamic features);
Use the machine learning techniques [
6], such as dropout and feature selection, to increase the accuracy of the proposed neural networks.
The rest of the paper is organized as follows.
Section 2 details the technical background.
Section 3 presents an overview of the existing malware detection methods for Android devices and their limitations. All the components of BrainShield’s architecture are detailed in
Section 4. In
Section 5, the implementation of the BrainShield prototype and the methodology that brings the detection results are described. In
Section 6, the results obtained in terms of accuracy, recall, precision, area under curve (AUC) and F1 score are illustrated, and a discussion of these results is presented. Finally,
Section 6 concludes the paper by emphasizing our contribution and future work.
2. Background
In this section, we introduce a set of definitions related to Android apps, machine learning, and features used by BrainShield to detect malware apps.
Malware detection is a classification problem [
7], which consists of determining the class of an app. The different classes presented in this paper are of two types: (1) malware app; and (2) benign app. Malware is an Android package kit (APK), also known as an Android app, used to serve illegal purposes, such as espionage or extortion. An app is benign if it is legitimate and harmless.
Machine learning [
8] is a discipline that consists of many different methods and objectives. We use: (1) the fully connected neural networks (i.e., dense layers) with one vector Tensorflow algorithm; the Dropout regularization on the hidden layer for reducing overfitting and improving the generalization error of deep neural networks; (2) the Sigmoid activation function on the output layer to give a probabilistic distribution between 0 and 1; and (3) the optimizer ADAM to optimize the error.
The common point of these machine learning methods is to provide them with many features, labeled for supervised learning or not for unsupervised learning, which serve as input to the learning algorithm. The quantity of data and a balance of data are very important to build a precise classification model that we adopt in our proposed model. Labeling is the act of considering an app as a malware app (i.e., value = 1) or as a benign app (i.e., value = 0). Therefore, we use the binary class classification method that gives, as output, a probability value between 0 (i.e., benign apps) and 1 (i.e., malware apps).
Features are needed in the case of supervised learning. They represent an app as faithfully as possible. Static features are those obtained using static tools, while dynamic features are those obtained using dynamic tools [
9].
Evaluation metrics [
10] are quantifiable measures, which determine if the detection model efficiently differentiates malware from benign apps. Among these metrics, let us quote the ones used for the evaluation of the performance of our proposed model. The accuracy represents the proportion of correct predictions. The precision is the proportion of correct positive predictions. A detection model producing no false positive has an accuracy of 1. The recall is the proportion of actual positive results that have been correctly identified. In addition, the recall is called the true positive rate (TPR). A detection model producing no false negative has a recall of 1. The F1 score is the harmonic mean of the precision and the recall. Therefore, this score considers both false positive and false negative. The area under the receiver operating characteristic (AUROC) curve measures the two-dimensional area underneath the receiver operating characteristic (ROC) curve. It gives an aggregate measure of performance across all classification thresholds.
3. Related Work
In this section, we present a literature review based on four categories of malware detection methods for mobile devices using the Android operating system: (1) company solutions; (2) static method; (3) dynamic method; and (4) hybrid method. At the end of this section, we present the limitations of the existing methods.
3.1. Company Solutions
In this section, we present a non-exhaustive list of the most popular Android apps, known as antivirus, available on the Google Play Store. This list provides solutions proposed by companies that have additional features to detect malicious apps.
Table 1 illustrates a comparison of these Android apps, including the descriptive information for each app, according to Google Play Store in autumn 2019, as well as the prices offered by each app publisher.
The detection methods used by Android apps and presented in
Table 1 are not known. This opacity does not allow us to develop our own detection method, but guides us to study more existing detection methods on the market. In addition, most of these Android apps provide additional functionalities besides malware detection, such as network scanner, virtual private network (VPN) service, AppLock, and permissions scanner. Typically, these features are accessible through a monthly or annual paid subscription.
Even Google Inc. cannot be certain of the 100% detection rate. Although Google Inc. made huge strides in 2019, its Google Bouncer in 2012 detection system was bypassable. Indeed, the official announcement of its existence in February 2012 [
11] caused a boom in the field of research. Several researchers have studied Google Bouncer to find out more. On 4 June 2012, Jon Oberheide and Charlie Miller [
12] presented interesting results. They were able to explore the system using a command system to search for attributes of the Bouncer environment, such as the version of the kernel running, the contents of the file system, or information on some of the devices emulated by the Bouncer environment. Against all these new and increasingly virulent threats, Google Inc. has revised its policy and established Google Play Protect [
13], which is the integrated malware protection platform for most Android devices. The Google Play Protect is supported by machine learning techniques to analyze more than 50 billion apps per day. Despite those advancements, malware is still found in the Google Play Store [
14].
3.2. Static Method
The static analysis method does not require running the app on a device. It focuses on the app code rather than on its actual behavior when it is executed, since the app code is supposed to be faithful to the app functionality.
Fournier et al. [
4] proposed a static detection method based on 151 Android system permissions trained with Waikato environment for knowledge analysis (WEKA). The model is based on training a set of 10,000 apps, consisting of 5000 benign apps and 5000 malware. Malware is from the Drebin dataset [
15] dated from 2010 to 2012. The benign apps come from the top 500 in each category of the Google Play Store. The inconvenience is that no security check was offered to verify that such apps were non-malware. In the same vein, the accuracy announced on the test set is 94.62%.
IntelliAV [
16] is an on-device malware detection system, which uses static analysis coupled with machine learning. The app is available on Google Play Store. Based on a training and validation set of 19,722 apps, including 9664 malware ones, the authors obtained a TPR of 92.5% and a false positive rate (FPR) of 4.2% on the validation set, with 1000 attributes generated by the training process. Moreover, the authors evaluated their model on a set of 2898 benign apps and 2311 malware from VirusTotal dated from February 2017. The accuracy is 71.96%.
MaMaDroid [
17] detects malware from a behavioral perspective, modeled as a sequence of abstract API calls. It is based on a static analysis system that collects API calls made by an app, and then builds a model from the sequences obtained from the call graph in the form of Markov chains. This ensures that the model is more resilient to API changes, and that the feature set is manageable in size. MaMaDroid has been tested using a dataset of 8500 benign apps, and 35,500 malware collected over a six-year period, with F-measure reaching 99%.
DroidSieve [
18] adopts a combination of features, which is suggested by authors as crucial for the robust detection of simple and obfuscated malware. Thus, syntactic features (e.g., API calls and system permissions) are integrated into such a detection method. These features have been used to build a classifier that is robust for both old and new malware, which tend to be increasingly obfuscated. To enrich all the syntactic functionalities, new features based on explicit intentions, meta-information and Dalvik Virtual Machine (DEX) files have been added. The authors created a ranking system of the most relevant features for detecting malware, where Android permissions and intents come first. The system achieves an accuracy of 99.82% with zero false positives.
FlowDroid [
19] is a tool that performs taint analysis on the app code, which enables the discovery of connections where the device’s International Mobile Equipment Identity (IMEI) is sent to a third party, using the network. It achieves 93% as recall, and 86% as precision.
Maldozer [
20] is based on the classification of raw sequences of calls to API methods, using deep learning techniques. Maldozer can be used as a malware detection system on servers, on mobile devices, and even on Internet of Things (IoT) devices. It achieves an F1-Score of 96–99% and a false positive rate of 0.06%. The datasets used were from the Malgenome project (2010–2011).
AndroGuard [
21] is a Python library that extracts various information from code, resources or the AndroidManifest.xml file from Android. It is used for static feature extraction.
3.3. Dynamic Method
The dynamic analysis method requires running the app code on a device. Dynamic analysis is used in the literature, since techniques, such as encryption, obfuscation of code, dynamic loading of code or reflection, can be implemented to avoid detection by the static analysis method. A significant number of searches attempt to work around this problem by monitoring the actions of the app in an emulator or on a real device.
TaintDroid [
22] introduces and prototypes a taint tracking method, which is widely used. The authors had to manually explore the apps, which greatly limits the number of apps that can be analyzed. Indeed, only 30 random apps have been selected.
AppsPlayground [
23] takes the concept of taint tracking and develops an intelligent method of input generation and app path for dynamic analysis, which makes the detection automatic, and where the tests are performed on emulator. On the other hand, like TaintDroid, it requires a modification of the Android operating system to track data via taint tracking. AppsPlayground was evaluated with 3968 apps from the Google Play store.
Chen et al. [
24] proposed the detection of systems based on data mining by ransomware for automatic detection. The actual behavior of the apps is controlled and generated in the call flow graph API (Application Programming Interface) as a set of functionalities.
Emulator vs. real phone [
25] offers a detailed study of the differences between the execution environments. This study is recommended to perform the detection on a real device.
DroidBox [
26] allows monitoring a wide range of events, such as file access, network traffic or DEX files loaded dynamically at runtime. DroidBox uses API 16, which covers 99.6% of smartphones according to Android. It is used for feature extraction in the context of dynamic analysis.
3.4. Hybrid Method
We define the hybrid analysis method as a method that combines static and dynamic analysis methods.
MADAM [
27] is a hybrid framework using machine learning to detect malware. It classifies them based on suspicious behavior observed at different levels of Android: kernel, application, user, and package. MADAM requires administrator privileges on the phone used, since it works at the kernel level. Thus, the authors specify that their solution is not intended for the general public, but seeks to prove the strength of such an approach (i.e., multi-level, dynamic, and on the device). The 2018 version offers real-world experiments on 2800 malware of 125 different families from three datasets.
SAMADroid [
28] uses machine learning to detect malware. It works on both local hosts (i.e., on-devices) to perform dynamic analysis, and remote hosts, to obtain static analysis and prediction. The SAMADroid client app is developed for Android devices. The dataset for neural network training is Drebin (2010–2012) [
15], which contains old malware. However, SAMADroid claims to achieve an accuracy of 99.07%.
AndroPyTool adopted by Martin et al. [
29] presents two tools that are of great importance for our own detection method: (1) the AndroPyTool framework; (2) and the Omnidroid dataset. AndroPyTool is developed in Python, and the code is hosted on GitHub. It can perform a complete extraction of static and dynamic features. It integrates the most used Android malware analysis tools (i.e., FlowDroid [
19], DroidBox [
26], AndroGuard [
21] and Strace [
30]) to perform a source code inspection, and to retrieve information on behavior when the sample is run in a controlled environment.
3.5. Limitations of the Existing Methods
Static, dynamic or hybrid approaches have the following shortcomings:
Little or no diversified features [
4,
16,
20]
Evaluation of the model based on a poor dataset in terms of sample quantities [
4];
An evaluation of the model based on a dataset containing old apps [
4,
28];
Obsolete methods due to new Android versions [
31].
For dynamic analysis, (1) manual intervention may be required [
22,
32] to guarantee full exploration of the app; and (2) the app could determine if the runtime environment is an emulation. In this case, the malicious code would not be triggered, which would prevent its detection [
23].
In addition to the previous shortcomings, hybrid approaches may have the following drawbacks: (1) the average performance; and (2) the device must be necessarily rooted.
Finally, all the methods presented above have high accuracy only if they are associated with: (1) many apps in the dataset for training and evaluation; and (2) recent malware. Indeed, any method that claims to achieve an accuracy of around 99%, while using old databases for evaluating the model, is considered to be obsolete.
4. BrainShield
In this section, we present the proposed hybrid malware detection model called BrainShield. BrainShield consists of three components: (1) dataset; (2) neural networks; and (3) client/server architecture.
4.1. Dataset
Omnidroid has obtained, thanks to AndroPyTool [
29], a hybrid malware detection tool. The Omnidroid dataset [
5] is selected for its static and dynamic features. To the best of our knowledge, it is the most diversified existing dataset in terms of types of features (i.e., static or dynamic). The static features are permissions, receivers, services, activities, Application Programming Interface (API) calls, API packages, opcodes, system commands and FlowDroid, whereas the dynamic features are opennet, sendnet, fdaccess, dataleaks, recvnet, cryptousage, and dexclass. Moreover, this dataset is balanced in terms of a number of copies, sample dates, and features. In addition, the number of apps in this dataset is significant, since there are 22,000 samples, as well as the number of features, is substantial: 25,999 static features and 5932 dynamic features. Omnidroid’s samples date from 2012 to 2018, which covers a long period.
Moreover, we define a test set, which allows us to avoid over-fitting on the validation set. The test set is used at the very end of learning, and only once, to verify that the model can adapt to new samples. We have chosen to distribute our dataset as follows:
70% (15,400) for the training set;
15% (3300) for the validation set;
15% (3300) for the test set.
4.2. Neural Networks
The use of neural networks is preferred, since it offers advantages of adaptation to new samples, which cannot be overlooked, unlike traditional detection systems operating with security rules. In particular, we chose to use fully connected neural networks (i.e., dense layers) with one vector Tensorflow algorithm. We build our model with three layers: (1) one input layer; (2) one hidden layer; and (3) one output layer. We use: (1) the Relu activation function on the input layer, which, as input, the features (i.e., static and dynamic) collected from the Omidroid dataset [
5]; (2) the Dropout regularization on the hidden layer for reducing overfitting and improving the generalization error of deep neural networks; (3) the Sigmoid activation function on the output layer to give a probabilistic distribution between 0 and 1; and (4) the optimizer ADAM to optimize the error. During the training, we aim to minimize the loss function [
33]. In our case, it is the binary cross entropy, which measures the performance of a classification model whose output is a probability value between 0 (i.e., benign apps) and 1 (i.e., malware apps). The binary cross entropy is denoted in Equation (1) [
33]: This is example 1 of an Equation:
where p is the predicted probability observation and y is the binary indicator (0 or 1). To carry out good training on a dataset, it is necessary to adjust certain parameters, called hyperparameters, such as (1) the number of iterations (i.e., 200) as presented in
Section 6; the dropout rate (i.e., 0.3), the learning rate (i.e., 0.002) and the activation function (i.e., Relu) proposed by Keras [
34]; and (3) the number of neurons as input, as discussed in
Section 5.2.1.
4.3. Architectural Design
A client/server architecture is chosen, in order to perform more flexibility with solutions and to use the feature extraction tools. Static, dynamic and hybrid proposed methods can be executed separately. Moreover, dynamic methods need to run the apps on a device, thus it makes sense to run the app in a specific environment. This device can be a real phone or a virtual machine.
BrainShield’s architecture consists of two parts, as shown in
Figure 1: (1) client; and (2) server.
The client is the Android device on which the apps must be analyzed;
The server is the place on which malware is detected, and it is developed with Python. Feature extraction and prediction are done on the server.
After feature extraction, each app corresponds to a feature vector. This vector is the input of the neural networks. The architecture is common to the static method, dynamic method, and hybrid method. The differences between these three methods rely on the static and dynamic feature extractions, as well as on the neural networks. Indeed, AndroGuard [
21] is used for static features, while DroidBox [
26] is used to extract dynamic features. The hybrid prediction is based on both static and dynamic features.
Chen et al. [
24] proposed the detection of systems based on data mining by ransomware for automatic detection. The actual behavior of the apps is controlled and generated in the call flow graph API as a set of functionalities.
Emulator vs. real phone [
25] offers a detailed study of the differences between the execution environments. This study is recommended to perform the detection on a real device.
DroidBox [
26] allows monitoring a wide range of events, such as file access, network traffic, or DEX files loaded dynamically at runtime. DroidBox uses API 16, which covers 99.6% of smartphones according to Android. It is used for feature extraction in the context of dynamic analysis.
5. Implementation
In this section, we present the architecture of BrainShield’s prototype and the steps of the implementation to perform the prediction. Then, we provide the methodology that brings the detection results.
5.1. BrainShield’s Prototype Implementation
The architecture of BrainShield’s prototype, as shown in
Figure 1, is divided into two parts: (1) the client; (2) and the server.
The client is the Android app written in Kotlin 1.3.70 (
https://kotlinlang.org/ (accessed on 20 November 2021)) that runs on the Huawei P20 Lite (ANE-LX3) (Huawei, Shenzen, China) phone;
The server is a Python 3.7.6 app (Python, Wilmington, DE, USA) developed with Flask 1.1 that runs on an Amazon server. This is an Ubuntu Server 18.04 LTS (HVM), SSD Volume, type t2.xlarge server with 4 vCPUs, x86_64 architecture, 16384 MiB of RAM and 16 GB of SSD memory.
In this architecture, we present the nine steps to perform the prediction, as shown in
Figure 2: (1) labelling by assigning a class as benign or malicious to each app; (2) training the fully connected neural networks; (3) acquisition of APKs to be able to predict unknown apps; (4) client sends the analysis request to the server; (5) server returns the missing APKS to the client; (6) client sends APKs missing on the server; (7) feature extraction on the server; (8) prediction provided by the neural network for each app; and (9) sending prediction to the client.
Figure 3 depicts how we train the neural networks. We first load the database and then randomly shuffle it to have different sets of malicious and benign applications between each different training. After choosing the features, setting some parameters, creating our neural network and splitting the database into three groups, the neural network training can take place. The number of iterations can be varied, and then we finish by evaluating the neural network on the test set.
5.2. Methodology
We present hereafter the methodology, which consists of four parts: (1) hyperparameter tuning; (2) feature selection; (3) impact of feature selection; and (4) relabeling.
5.2.1. Hyperparameter Tuning
This section describes how to set the training hyperparameters values of our proposed model BrainShield based on the neural networks to detect malware.
As initial settings, the dropout rate (i.e., 0.3), the learning rate (i.e., 0.002) and the activation function (i.e., Relu) are by default proposed by Keras [
34]. Moreover, the number of 50 iterations and the number of 1119 neurons as input are chosen as those large enough to have viable results and to complete hundreds of training in a suitable time. The final values of hyperparameters are illustrated in
Table 2.
In order to obtain the best value for the epoch number (i.e., number of iterations), we consider 7 values for the epoch number (i.e., 50, 100, 150, 200, 250, 300, 400), and we compare the different results of training using the evaluation metrics (i.e., the accuracy, the recall, the precision, the AUC, and the F1 score). The results are obtained from statistical averages over 10 training sessions and are illustrated in
Figure 4. Such results show that the evaluation metrics are being improved for up to 250 iterations. Then, for higher values of epoch number, no improvement in the evaluation metrics is observed (e.g., 70 training sessions with a total duration of 157 min were performed).
Hereafter, we justify the choice of (1) the dropout rate; (2) the learning rate; (3) the number of neurons, and (4) the activation functions.
Dropout Rate
In the same vein, we vary the value of the dropout rate from 0 (no dropout at all) to 0.9 (we forget 90% between each epoch) to obtain its best value. In
Figure 5, we observe that a dropout rate of 0.3 makes it possible to obtain the best accuracy, as well as the best F1 score.
Learning Rate
A too high learning rate may result in exceeding the minimum value of the loss function, while a too low learning rate may lead to an unnecessary too long learning process [
35]. In order to obtain the appropriate learning rate value, we vary the learning rate from 0.00002 to 0.2.
Figure 6 illustrates that neural networks with the default value of 0.002, as well as those with the value of 0.0002, enable us to obtain the best results, in terms of F1 Score. In this context, we choose to keep the default value of 0.002, as proposed by Keras. Indeed, both recall and AUC are being improved for detecting the false negatives (malware not detected), which constitutes the basis of malware detection.
Number of Neurons
In order to obtain the best value for the number of neurons as input, we vary the number of neurons from 10 to 4359 neurons. To attain these limits, we started by choosing a number of neurons equal to the number of features (i.e., 3359). Then, we increased and decreased this number with a pace of 250. Moreover, when the number of neurons is less than 100, we tightened the pace. In
Figure 7, we observe that increasing the number of neurons above the number of features does not improve the results, in terms of accuracy, recall, precision, AUC, as well as F1 score. In addition, we can notice that the results are roughly the same from 3359 neurons to 350 neurons. Beyond this threshold, the results deteriorate. In light of such results, we estimate that the minimum number of neurons as input must be equal to 10% of the number of features to keep the same results.
Activation Function
In order to choose the activation function allowing us to obtain the best results, we choose to compare all the activation functions offered by Keras [
34]. Depending on the dataset, each activation function has its advantages and disadvantages. In
Figure 8, we note that all the activation functions barely give the same results, except the softmax and the linear activation functions.
5.2.2. Feature Selection
Omnidroid initially consists of 25,999 static features. In
Table 3, we present three distributions of different features. The initial distribution is Omnidroid, to which no filter is applied. The other two distributions come from the results of the selection method that we proposed.
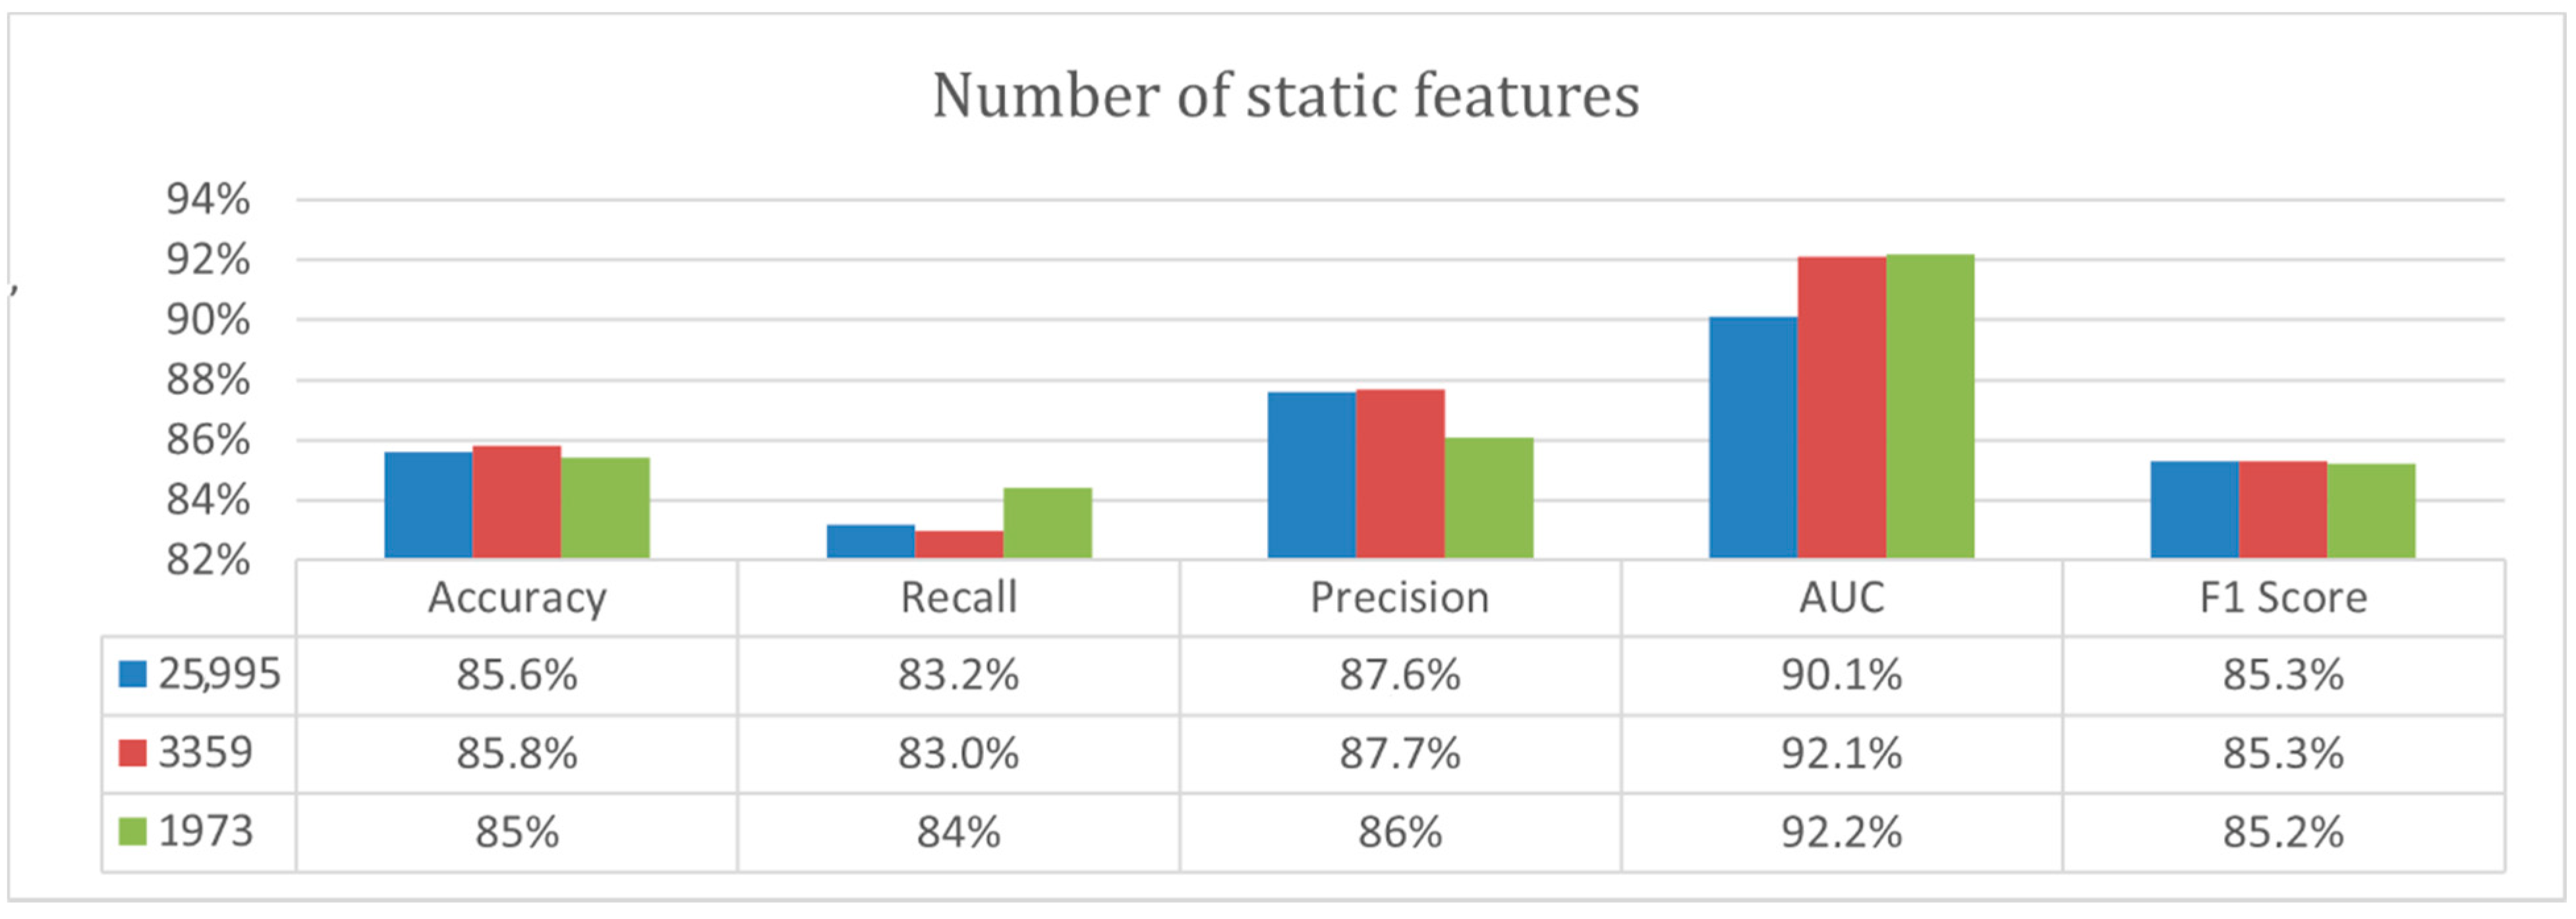
Step 1 consists of removing the empty features, as well as eliminating the features for which the sum of features of an app is equal to 1. In other words, only one feature over 25,999 is equal to 1. As a result, the number of features gets reduced from 25,999 to 3359. The first step proposed is therefore relevant.
Step 2 consists of removing the features whose sum does not exceed 220 for permissions, opcodes, API calls, system commands, and activities; and which does not exceed 22 for services, receivers, API packages and for FlowDroid, thus going from 3359 to 1973. The objective is to reduce the size of the dataset to allow faster training, as well as greater simplicity when loading the dataset into the RAM. We noticed a reduction of 96.8% in loading time. Although the results for the recall and precision assessment metrics are different in
Figure 9, the F1 score shows that the results are very similar for the dataset of 25,999 and 3359 features, and we lose 0.1% of F1 score for that of 1973 features. Therefore, we confirm that the empty columns do not allow the neural network to improve the detection results. These features, although not useful for learning, slow down the learning time and considerably increase the allocated resources.
We now try a selection of static features, using Pearson’s correlation method [
36]. It allows us to select the features with the highest correlation between the features and the malware or benign apps. In
Figure 10, we observe that the selection of features with Pearson’s correlation enables us to improve the results obtained from the model with 3359 features. Indeed, the neural networks of 1680 and 840 features enable us to obtain an F1 score of 86.44%, compared to 85.3% in
Figure 9.
In the same vein, the approach that we propose for the selection of static features is carried out for the selection of dynamic features. According to this approach, we remove the features whose columns are empty or equal to 1, which reduces the number of features from 5.932 to 3722, as illustrated in
Table 4.
In
Figure 11, we note that 2210 dynamic features of Omnidroid are empty. To obtain the dataset of the 310 most diverse features, we remove all the features whose sum was less than or equal to 20. In
Figure 11, we note an improvement in the results for 3722 features, which is not the case for 310 features, as presented in
Table 3. In this context, we have chosen to keep 3722 dynamic features.
5.2.3. Impact of Feature Selection
Figure 12 illustrates the impact of the number of features on the accuracy, showing the differences when training and validating a model with 3359 and 840 static features, respectively.
In particular, we observe that the reduction in the number of features makes it possible to increase the accuracy on the training set and the validation set. Indeed, the training curve and the validation curve of the model with 840 features are above the training curve and the validation curve of the model with 3359 features, respectively.
5.2.4. Relabeling
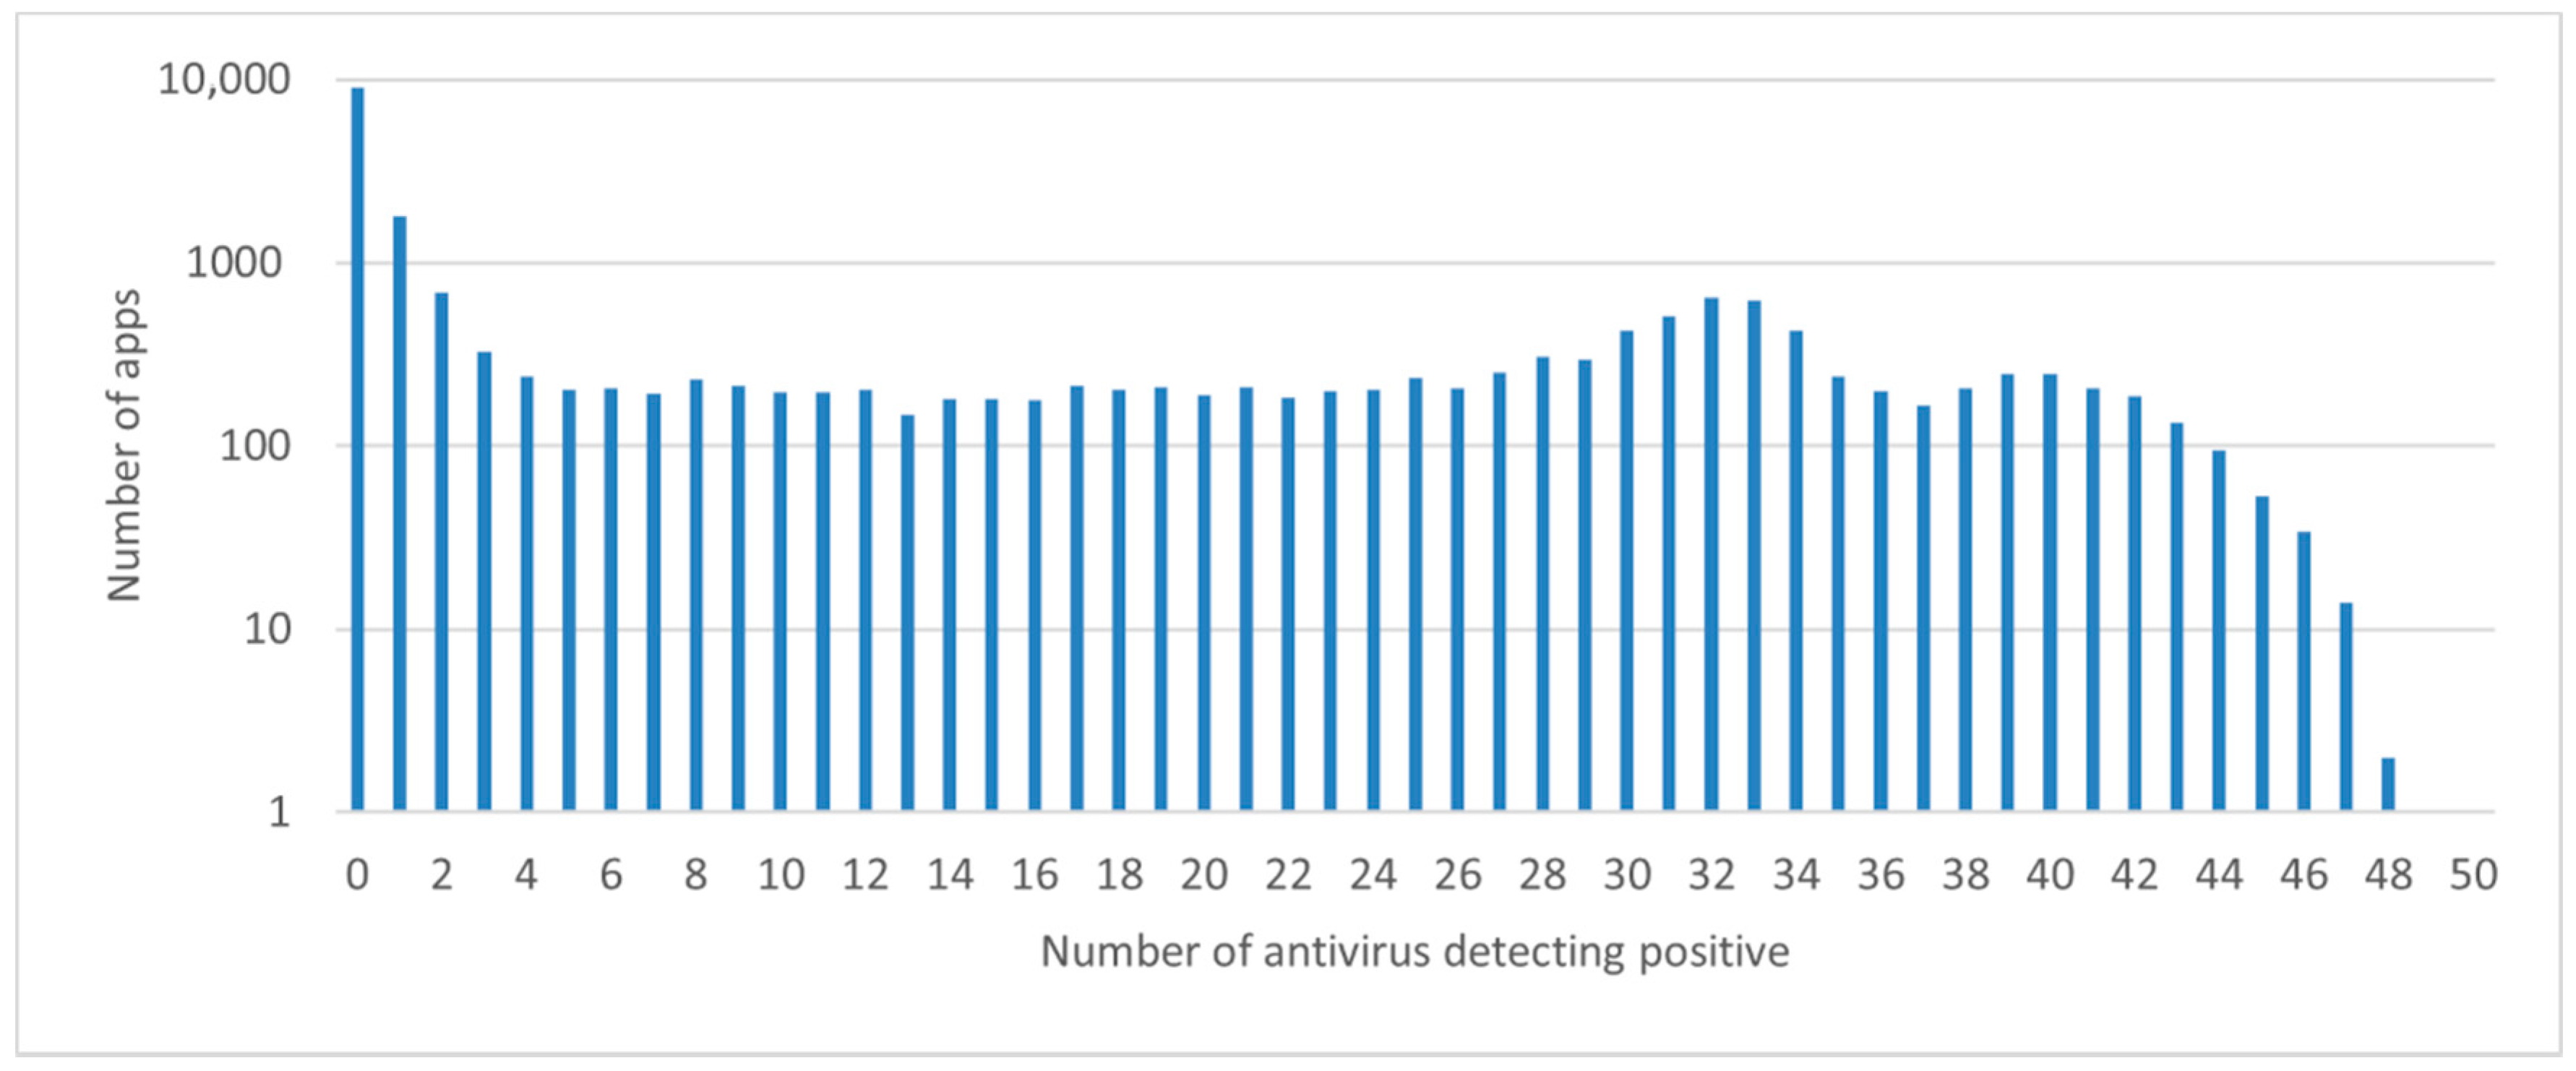
The Omnidroid dataset was labeled by VirusTotal with a threshold ε equal to 1. This threshold ε represents the number of antiviruses that detects an app as malicious. Thus, a threshold ε set to 1 means that if only one of the sixty antiviruses on VirusTotal detects an app as malicious, then this app will be labeled as malicious in Omnidroid. Therefore, we track the number of apps detected by antivirus according to the number of antiviruses.
The results in
Figure 13 are valid as of September 2019. We used the VirusTotal service [
37] thanks to an academic API, to obtain a report for each app identified by its hash. Therefore, such results date from little more than a year and a half after the initial results obtained by [
29]. Thus, we notice that a year and half later, only 9024 apps are detected as benign, with a threshold ε equal to 1, which corresponds to 0 antivirus on the abscissa axis. In addition, we note that 1807 apps are classified as malware, even though only one antivirus has detected them as malicious. A threshold ε equal to 2 would have been enough to classify them as benign.
In
Figure 14 and
Figure 15, the representations are based on 22,000 app reports from September 2019, which are collected using a python script and a VirusTotal academic key. We have relabeled Omnidroid for static trainings by setting the threshold ε from 1 to 4 for 2018′s reports, and from 1 to 10 for 2019′s reports.
In
Figure 14, we note an improvement in the results following the relabeling. We deduce that there have been new scans of antivirus among VirusTotal for a year and a half, and that this has an impact on the detection of malware.
Moreover, we have relabeled Omnidroid for dynamic trainings in
Figure 15, but this time by varying the threshold ε from 1 to 6 for the reports. As with static relabeling, we notice an improvement in the results following dynamic relabeling. In particular, the recall is the metric that is improved the most (i.e., up to 10%). Relabeling has made it possible to detect more malware that were previously undetected by Omnidroid labeling.
6. Results
Following the relabeling, we set the number of iterations to the value that enables us to obtain the best scores for each type of neural network.
Table 2 shows the final values of the hyperparameters.
The static feature selection was achieved with a manual method consisting in removing the empty features from 25,999 to 3359 features, as well as with Pearson’s Correlation, from 3359 to 840 features.
Table 5 illustrates the results of the static neural network on the test set.
Table 6 presents the results of the dynamic neural network on the test set.
Table 7 shows the results of the hybrid neural network on the test set.
7. Discussion
We have chosen the Android operating system, since it is the most widely used operating system in the world, with more than 80% of the mobile market [
38]. Moreover, the results presented in
Figure 16 are valid on the date of the samples in the dataset. For a reminder, the collection of malware is registered in Omnidroid dates from 2012 to 2018. We have observed the relabeling impact clearly with more recent reports from VirusTotal on the evaluation metrics. Accordingly, we can wonder what will happen to the accuracy and the precision of neural networks in several years.
Moreover, the apps may have evolved too much to be run on an API 16 emulator, which is that of DroidBox [
26], the tool for extracting dynamic features. API 16 (summer 2012) enables to run of relatively old apps for the period of summer 2020. However, it is possible that app developers consider this API too old and set the API minimum to 21. Thus, it would be impossible to run their apps on the emulator. However, this can be an advantage, since we can analyze old apps. In addition, the extraction of dynamic features can be difficult in the context of apps requiring identification (Facebook, Instagram, WhatsApp, Messenger type apps, etc.). In fact, the automatic feature extraction tool would be blocked at the displaying of identification, and would not be able to explore all the app’s functionalities. As a reminder, the emulator has a feature called Monkey that enables us to randomly click on the screen to simulate user clicks. The extracted features would be either nonexistent or in too little representative quantity to be able to make a prediction. This is an intrinsic limitation of dynamic analysis.
8. Conclusions
We have proposed static, dynamic and hybrid methods for detecting malware targeting Android mobile devices. Our three methods are based on fully connected neural networks trained by the Tensorflow/Keras libraries. The static network, reaching an accuracy of 92.9% and a precision of 91.1%, is trained on 840 static features. The dynamic neural network, reaching an accuracy of 81.1% and a precision of 83.4%, is trained on 3722 dynamic features. The hybrid neural network, reaching an accuracy of 91.1% and a precision of 91.0%, is trained on 7081 features (i.e., 3359 statics and 3722 dynamics). Feature selection techniques are used, such as Pearson correlation and a manual method. In addition, we have presented that 22,636 static features and 2210 dynamic features of the Omnidroid dataset are empty for a total of 24,846 out of 31,931 (i.e., 77.81%).
As future work, this research could be generalized to other operating systems, such as iOS, which represents about 20% of the mobile market [
38]. At that point, new tools for extracting static and dynamic features should be developed, in order to build a new dataset that we would be labeled by using VirusTotal. In addition, all results related to the learning techniques, the evaluation metrics, as well as the hyperparameter configuration, could be reused for training the neural networks. For further research, it would be necessary to update the dataset with the most recent labelling techniques, and to develop an automation tool for updating neural networks automatically.
Author Contributions
Conceptualization, C.R., F.E.K., R.B. and S.P.; methodology, C.R., F.E.K., R.B. and S.P.; software, C.R. and F.E.K.; validation, C.R., F.E.K., R.B. and S.P.; formal analysis, C.R. and F.E.K.; data curation, C.R. and F.E.K.; writing—original draft preparation, F.E.K.; writing—review and editing, F.E.K.; visualization, F.E.K.; supervision, S.P.; project administration, S.P. All authors have read and agreed to the published version of the manuscript.
Funding
This research was funded by Natural Sciences and Engineering Research Council of Canada (NSERC), Prompt Quebec, Flex Groups and Q-Links.
Data Availability Statement
Acknowledgments
We would like to express our gratitude to Flex Groups teams for their technical support.
Conflicts of Interest
The authors declare no conflict of interest. The funders had no role in the design of the study; in the collection, analyses, or interpretation of data; in the writing of the manuscript, or in the decision to publish the results.
References
- Woolf, N. DDoS Attack that Disrupted Internet was Largest of its Kind in History, Experts Say. Available online: https://www.theguardian.com/technology/2016/oct/26/ddos-attack-dyn-mirai-botnet (accessed on 7 September 2021).
- Fruhlinger, J. What is WannaCry Ransomware, How Does it Infect, and Who was Responsible? Available online: https://www.csoonline.com/article/3227906/what-is-wannacry-ransomware-how-does-it-infect-and-who-was-responsible.html (accessed on 7 September 2021).
- MalwareBytes. Malware. Available online: https://fr.malwarebytes.com/malware/ (accessed on 10 September 2021).
- Fournier, A.; El Khoury, F.; Pierre, S. A Client/Server Malware Detection Model Based on Machine Learning for Android Devices. IoT 2021, 2, 355–374. [Google Scholar] [CrossRef]
- AI + DA. OmniDroid Dataset Individual Features V2. Available online: http://aida.etsisi.upm.es/download/omnidroid-dataset-v1/ (accessed on 12 September 2021).
- Machine Learning Glossary. Available online: https://developers.google.com/machine-learning/glossary (accessed on 10 September 2021).
- Machine Learning Crash Course. Available online: https://developers.google.com/machine-learning/crash-course/classification/ (accessed on 10 September 2021).
- Witten, I.H.; Frank, E. Data mining: Practical machine learning tools and techniques with Java implementations. ACM Sigmod. Record. 2002, 31, 76–77. [Google Scholar] [CrossRef]
- Tounsi, W. Cybervigilance et Confiance Numérique: La Cyber Sécurité à l’ère du Cloud et des Objets Connectés; ISTE Group: London, UK, 2019; pp. 1–238. [Google Scholar]
- Microsoft. Évaluation des Performances d’un Modèle Dans Azure Machine Learning Studio (Classique). 2021. Available online: https://github.com/MicrosoftDocs/azure-docs.fr-fr/blob/master/articles/machine-learning/classic/evaluate-model-performance.md (accessed on 19 September 2021).
- Lockheimer, H. Android and Security. Available online: https://googlemobile.blogspot.com/2012/02/android-and-security.html (accessed on 11 September 2021).
- Oberheide, J. Dissecting Android’s Bouncer. Available online: https://duo.com/blog/dissecting-androids-bouncer (accessed on 11 September 2021).
- Android. Google Play Protect. Available online: https://www.android.com/intl/en_ca/play-protect/ (accessed on 11 September 2021).
- Then, E. BeiTaAd Adware Discovered in 238 Google Play Store Apps. Available online: https://www.slashgear.com/beitaad-adware-discovered-in-238-google-play-store-apps-05579281/ (accessed on 12 September 2021).
- Arp, D.; Spreitzenbarth, M.; Hübner, M.; Gascon, H.; Rieck, K.; Siemens, C. Drebin: Effective and explainable detection of android malware in your pocket. In Proceedings of the NdSS Symposium, San Diego, CA, USA, 23–28 February 2014; pp. 23–26. Available online: https://www.ndss-symposium.org/wp-content/uploads/2017/09/11_3_1.pdf (accessed on 14 September 2021).
- Ahmadi, M.; Sotgiu, A.; Giacinto, G. IntelliAV: Building an Effective On-Device Android Malware Detector. 2018. Available online: http://arxiv.org/abs/1802.01185 (accessed on 17 September 2021).
- Onwuzurike, L.; Mariconti, E.; Andriotis, P.; De Cristofaro, E.; Ross, G.; Stringhini, G. Mamadroid: Detecting android malware by building markov chains of behavioral models. ACM Trans. Priv. Secur. 2019, 22, 1–34. [Google Scholar] [CrossRef] [Green Version]
- Suarez-Tangil, G.; Dash, S.K.; Ahmadi, M.; Kinder, J.; Giacinto, G.; Cavallaro, L. Droidsieve: Fast and accurate classification of obfuscated android malware. In Proceedings of the Seventh ACM on Conference on Data and Application Security and Privacy (CODASPY ‘17), Scottsdale, AZ, USA, 22–24 March 2017; pp. 309–320. [Google Scholar] [CrossRef] [Green Version]
- Arzt, S.; Rasthofer, S.; Fritz, C.; Bodden, E.; Bartel, A.; Klein, J.; Le Traon, Y.; Octeau, D.; McDaniel, P. Flowdroid: Precise context, flow, field, object-sensitive and lifecycle-aware taint analysis for android apps. ACM SIGPLAN Not. 2014, 49, 259–269. [Google Scholar] [CrossRef]
- Karbab, E.B.; Debbabi, M.; Derhab, A.; Mouheb, D. MalDozer: Automatic framework for android malware detection using deep learning. In Proceedings of the Fifth Annual DFRWS Europe, Florence, Italy, 21–23 March 2018; pp. S48–S59. [Google Scholar] [CrossRef]
- Kali Tutorials, Androguard: Reverse Engineering, Malware and Goodware Analysis of Android Applications. 2019. Available online: https://kalilinuxtutorials.com/androguard/ (accessed on 12 September 2021).
- Enck, W.; Gilbert, P.; Han, S.; Tendulkar, V.; Chun, B.-G.; Cox, L.P.; Jung, J.; McDaniel, P.; Sheth, A.N. TaintDroid: An information-flow tracking system for realtime privacy monitoring on smartphones. ACM Trans. Comput. Syst. (TOCS) 2014, 32, 1–29. [Google Scholar] [CrossRef]
- Rastogi, V.; Chen, Y.; Enck, W. AppsPlayground: Automatic security analysis of smartphone applications. In Proceedings of the Third ACM Conference on Data and Application Security and Privacy, San Antonio, TX, USA, 18–20 February 2013; pp. 209–220. [Google Scholar] [CrossRef]
- Chen, Z.-G.; Kang, H.-S.; Yin, S.-N.; Kim, S.-R. Automatic ransomware detection and analysis based on dynamic API calls flow graph. In Proceedings of the International Conference on Research in Adaptive and Convergent Systems (RACS’17), Krakow, Poland, 20–23 September 2017; pp. 196–201. [Google Scholar] [CrossRef]
- Alzaylaee, M.K.; Yerima, S.Y.; Sezer, S. Emulator vs. real phone: Android malware detection using machine learning. In Proceedings of the 3rd ACM on International Workshop on Security and Privacy Analytics (IWSPA ‘17), Scottsdale, AZ, USA, 24 March 2017; pp. 65–72. [Google Scholar] [CrossRef] [Green Version]
- The Honeynet Project. Droidbox: An Android Application Sandbox for Dynamic Analysis. Available online: https://www.honeynet.org/projects/active/droidbox/ (accessed on 12 September 2021).
- Saracino, A.; Sgandurra, D.; Dini, G.; Martinelli, F. MADAM: Effective and Efficient Behavior-based Android Malware Detection and Prevention. IEEE Trans. Dependable Secur. Comput. 2018, 15, 83–97. [Google Scholar] [CrossRef] [Green Version]
- Arshad, S.; Shah, M.A.; Wahid, A.; Mehmood, A.; Song, H.; Yu, H. SAMADroid: A Novel 3-Level Hybrid Malware Detection Model for Android Operating System. IEEE Access 2018, 6, 4321–4339. [Google Scholar] [CrossRef]
- Martín, A.; Lara-Cabrera, R.; Camacho, D. Android malware detection through hybrid features fusion and ensemble classifiers: The AndroPyTool framework and the OmniDroid dataset. Sci. Inf. Fusion 2019, 52, 128–142. [Google Scholar] [CrossRef]
- Utilisation de Strace. Available online: https://source.android.com/devices/tech/debug/strace (accessed on 12 September 2021).
- Enck, W.; Ongtang, M.; McDaniel, P. On lightweight mobile phone application certification. In Proceedings of the 16th ACM conference on Computer and communications security, Chicago, IL, USA, 9–13 November 2009; pp. 235–245. [Google Scholar] [CrossRef] [Green Version]
- Yan, L.K.; Yin, H. DroidScope: Seamlessly reconstructing the OS and Dalvik semantic views for dynamic Android malware analysis. In Proceedings of the 21st ACM USENIX Conference on Security Symposium, Security’12, Bellevue, WA, USA, 8–10 August 2012; p. 29. [Google Scholar]
- Docs. Loss Functions. Available online: https://ml-cheatsheet.readthedocs.io/en/latest/loss_functions.html (accessed on 12 September 2021).
- Keldenich, T. Fonction D’activation, Comment ça Marche? 2021. Available online: https://inside-machinelearning.com/fonction-dactivation-comment-ca-marche-une-explication-simple/ (accessed on 12 September 2021).
- Machine Learning Crash Course. Reducing Loss: Learning Rate. 2020. Available online: https://developers.google.com/machine-learning/crash-course/reducing-loss/learning-rate (accessed on 12 September 2021).
- Chatterjee, S. Good Data and Machine Learning. 2017. Available online: https://towardsdatascience.com/data-correlation-can-make-or-break-your-machine-learning-project-82ee11039cc9 (accessed on 12 September 2021).
- VirusTotal. Available online: https://support.virustotal.com (accessed on 12 September 2021).
- MMA. Android S’approche des 80% de Parts de Marché. 2019. Available online: https://www.mobilemarketing.fr/android-sapproche-des-80-de-parts-de-marche/ (accessed on 12 September 2021).
Figure 1.
Architecture of BrainShield.
Figure 1.
Architecture of BrainShield.
Figure 2.
Steps of BrainShield.
Figure 2.
Steps of BrainShield.
Figure 3.
Pseudocode for training the neural network.
Figure 3.
Pseudocode for training the neural network.
Figure 4.
Epoch number comparison.
Figure 4.
Epoch number comparison.
Figure 5.
Dropout rate comparison.
Figure 5.
Dropout rate comparison.
Figure 6.
Learning rate comparison.
Figure 6.
Learning rate comparison.
Figure 7.
Number of neurons comparison.
Figure 7.
Number of neurons comparison.
Figure 8.
Activation functions comparison.
Figure 8.
Activation functions comparison.
Figure 9.
Static Omnidroid dataset vs. static Omnidroid simplified.
Figure 9.
Static Omnidroid dataset vs. static Omnidroid simplified.
Figure 10.
Feature selection with Pearson Correlation.
Figure 10.
Feature selection with Pearson Correlation.
Figure 11.
Dynamic Omnidroid dataset vs. dynamic Omnidroid simplified.
Figure 11.
Dynamic Omnidroid dataset vs. dynamic Omnidroid simplified.
Figure 12.
Impact of feature selection on accuracy.
Figure 12.
Impact of feature selection on accuracy.
Figure 13.
Scans on VirusTotal of 22,000 apps.
Figure 13.
Scans on VirusTotal of 22,000 apps.
Figure 14.
Static relabeling comparison.
Figure 14.
Static relabeling comparison.
Figure 15.
Dynamic relabeling comparison.
Figure 15.
Dynamic relabeling comparison.
Figure 16.
Detection results comparison.
Figure 16.
Detection results comparison.
Table 1.
List of antivirus software on Google Play Store.
Table 1.
List of antivirus software on Google Play Store.
| Play Store Name | Publisher | Free App | Price | Number of Downloads |
|---|
| Security Master | Cheetah Mobile | Yes | 20 $/year | 500,000,000+ |
| AVG Antivirus | AVG Mobile | Yes | 16 $/year | 100,000,000+ |
| Avast Antivirus | Avast Software | Yes | 13 $/year | 100,000,000+ |
| Kaspersky Mobile | Kaspersky Lab | Yes | 20 $/year | 50,000,000+ |
| Security Center | Hyper speed | Yes | No | 50,000,000+ |
| Mobile Security | ESET | No | 7 $/year | 10,000,000+ |
| McAfee | McAfee LLC | No | 41 $ | 10,000,000+ |
| Malware Bytes | Malwarebytes | No | 14 $/year | 10,000,000+ |
| Norton Antivirus | Norton Mobile | Yes | 20 $/year | 10,000,000+ |
| Sophos Mobile | Sophos Limited | Yes | No | 1,000,000+ |
Table 2.
Final values of hyperparameters.
Table 2.
Final values of hyperparameters.
| Epoch Number | Static | Dynamic | Hybrid |
|---|
| Epoch number | 200 | 250 | 200 |
| Learning rate | 0.002 | 0.002 | 0.002 |
| Dropout rate | 0.5 | 0.5 | 0.5 |
| Batch size | 512 | 512 | 512 |
| Number of features | 840 | 2800 | Static: 840; Dynamic: 2800 |
| Number of neurons as input | 280 | 933 | Static: 280; Dynamic: 933 |
| Loss function | Binary crossentropy | Binary crossentropy | Binary crossentropy |
| Activation function | Relu | Relu | Relu |
| Function of prediction | Sigmoid | Sigmoid | Sigmoid |
Table 3.
Static features repartition.
Table 3.
Static features repartition.
| | Initial | Step 1 | Step 2 |
|---|
| Features | Nb | % | Nb | % | Nb | % |
| Receivers | 6415 | 24.7 | 216 | 6.4 | 171 | 8.7 |
| Activities | 6089 | 23.4 | 27 | 0.8 | 1 | 0.1 |
| Permissions | 5501 | 21.2 | 710 | 21.1 | 82 | 4.2 |
| Services | 4365 | 16.8 | 82 | 2.4 | 3 | 0.2 |
| API calls | 2129 | 8.2 | 1914 | 57.0 | 1369 | 69.4 |
| FlowDroid | 961 | 3.7 | 95 | 2.8 | 83 | 4.2 |
| Opcodes | 224 | 0.9 | 224 | 6.7 | 221 | 11.2 |
| API Packages | 212 | 0.8 | 0 | 0.0 | 0 | 0.0 |
| Commands | 103 | 0.4 | 91 | 2.7 | 43 | 2.2 |
| Total | 25,999 | 100 | 3359 | 100 | 1973 | 100 |
Table 4.
Dynamic features repartition.
Table 4.
Dynamic features repartition.
| | Initial | Step 1 | Step 2 |
|---|
| Features | Nb | % | Nb | % | Nb | % |
| Opennet | 1483 | 25.0 | 862 | 23.2 | 0 | 0.0 |
| Sendnet | 1186 | 20.0 | 718 | 19.3 | 0 | 0.0 |
| Fdaccess | 937 | 15.8 | 630 | 16.9 | 0 | 0.0 |
| Dataleaks | 867 | 14.6 | 509 | 13.7 | 134 | 43.2 |
| Recvnet | 837 | 14.1 | 540 | 14.5 | 0 | 0.0 |
| Cryptousage | 488 | 8.2 | 369 | 9.9 | 156 | 50.3 |
| Dexclass | 134 | 2.3 | 94 | 2.5 | 20 | 6.5 |
| Total | 5932 | 100 | 3722 | 100 | 310 | 100 |
Table 5.
Static results.
| | Accuracy | Precision | Number of Features |
|---|
| Martin et al. [29] | 89.3% | 89.3% | 25,999 |
| Proposed model | 92.9% | 92.1% | 840 |
| Gain | 3.6% | 2.8% | 96.8% |
Table 6.
Dynamic results.
Table 6.
Dynamic results.
| | Accuracy | Precision | Number of Features |
|---|
| Martin et al. [29] | 78.6% | 78.6% | 5932 |
| Proposed model | 81.1% | 83.4% | 3722 |
| Gain | 2.5% | 4.8% | 37.3% |
Table 7.
Hybrid results.
| | Accuracy | Precision | Number of Features |
|---|
| Martin et al. [29] | 89.7% | 89.7% | Static: 25,999; Dynamic: 5932 |
| Proposed model | 91.1% | 91% | Static: 3359; Dynamic: 3722 |
| Gain | 1.4% | 1.3% | 77.8% |
| Publisher’s Note: MDPI stays neutral with regard to jurisdictional claims in published maps and institutional affiliations. |
© 2021 by the authors. Licensee MDPI, Basel, Switzerland. This article is an open access article distributed under the terms and conditions of the Creative Commons Attribution (CC BY) license (https://creativecommons.org/licenses/by/4.0/).


