Article

Segmentation of Overlapping Grape Clusters Based on the Depth Region Growing Method

1
Key Laboratory of Modern Agricultural Equipment and Technology, Ministry of Education, Jiangsu University, Zhenjiang 212013, China
2
School of Electronic Engineering, Changzhou College of Information Technology, Changzhou 213164, China
*
Author to whom correspondence should be addressed.
Electronics 2021, 10(22), 2813; https://doi.org/10.3390/electronics10222813
Submission received: 15 September 2021 / Revised: 3 November 2021 / Accepted: 10 November 2021 / Published: 16 November 2021
(This article belongs to the Collection Electronics for Agriculture)

Abstract

:
Accurately extracting the grape cluster at the front of overlapping grape clusters is the primary problem of the grape-harvesting robot. To solve the difficult problem of identifying and segmenting the overlapping grape clusters in the cultivation environment of a trellis, a simple method based on the deep learning network and the idea of region growing is proposed. Firstly, the region of grape in an RGB image was obtained by the finely trained DeepLabV3+ model. The idea of transfer learning was adopted when training the network with a limited number of training sets. Then, the corresponding region of the grape in the depth image captured by RealSense D435 was processed by the proposed depth region growing algorithm (DRG) to extract the front cluster. The depth region growing method uses the depth value instead of gray value to achieve clustering. Finally, it fils the holes in the clustered region of interest, extracts the contours, and maps the obtained contours to the RGB image. The images captured by RealSense D435 in a natural trellis environment were adopted to evaluate the performance of the proposed method. The experimental results showed that the recall and precision of the proposed method were 89.2% and 87.5%, respectively. The demonstrated performance indicated that the proposed method could satisfy the requirements of practical application for robotic grape harvesting.

1. Introduction

Grapes are one of the most popular fruits in the world. With the rapid development of the grape industry, Chinese grape planting areas and yields have substantially increased in recent decades. Commonly, the grapes could be divided into two categories: wine grapes and table grapes. For grapes used for wine, there is no need to consider the shedding of berries and the damage to the clusters during the picking process, which is more suitable for non-selective mechanized picking methods. However, for the picking of table grapes, it is necessary to consider that there may be fruit loss and berries injured during the picking process. Therefore, the large-scale, non-selective mechanical picking method is not suitable for the harvest of table grapes. Usually, the harvesting of table grapes is performed manually, which is a labor-intensive and time-consuming procedure [1].
However, the shortage of labor, the aging of the population, and the declining birthrate are not the only bottlenecks encountered in the development of agriculture but they are also some of the difficulties faced encountered in the development of all labor-intensive industries in the world. With the development of robot technology, the best strategy for solving this problem is to use robots instead of farmers to harvest table grapes. For harvesting robots, fast and accurate identification and positioning of the grapes, especially the identification and segmentation of overlapping grape clusters, is the prerequisite and key technical step for picking fruit successfully.
The accurate recognition of grapes has attracted the attention of many scholars and has been widely studied. In [1], Zernike moments and color information were applied in order to develop an SVM classifier for detecting red grapes successfully, but these methods have had a disappointing result for white grapes with less than 50% of correct classification. Reis et al. proposed a system for detecting bunches of grapes in color images, which could achieve 97% and 91% correct classifications for red and white grapes, respectively [2]. The system mainly includes the following three steps to realize the detection and location of the grapes: color mapping, morphological dilation, and the detection of black areas and stems. In [3], a detector named DeepGrapes was proposed to detect white grapes from low-resolution color photos. In order to greatly reduce the final number of weights of the detector, weave layers were used to replace the generally used combined layers in the classifier. The detector could reach an accuracy of 96.53% on the dataset created by the author, which is free of charge and can be accessed from www.researchgate.net. Liu et al. utilized color and texture information as the feature to train an SVM classifier for the recognition of grapes [4]. The algorithm mainly includes three steps: image preprocessing, SVM classifier training, and image segmentation in the test set. Image preprocessing includes Otsu threshold segmentation, denoising, shape filtering, and so on, which are not only used for the training set but are also applied to the test set. Experiment results demonstrated that the classifier could reach an accuracy of 88% and recall of 91.6% on two red grape datasets (Shiraz and Cabernet Sauvignon). In 2015, a fuzzy c-means clustering method with an accuracy of 90.33% was proposed in [5]. The H channel of the HSV image was clustered using the fuzzy c-means clustering algorithm to segment grape objects. The initial clustering center of fuzzy c-means clustering is optimized using the artificial bee colony algorithm to accelerate the clustering speed and reduce iteration steps. In the next year, another paper by the same research team applied the AdaBoost framework to construct four weaker classifiers into a strong classifier, which significantly improved the detection performance. In the test stage, after the test image was processed by the classifier, the region threshold method and morphology filtering were used to eliminate noise and the final average detection accuracy was 96.56%.
The above studies mainly focused on the recognition of the grape and did not involve the segmentation of overlapping clusters. However, the overlapping of grape clusters in the vineyard is inevitable, especially in the trellis cultivation mode. For the robotic harvesting of grapes, grape characteristics, such as softness and irregular shape, make it unfeasible to grasp the fruit directly, and grasping and cutting the peduncle of the grape is an alternative method for harvesting. The recognition and location of the peduncle then became particularly important. However, at present, the method of recognition and location of the peduncle is based on the location of the whole grape cluster. This makes the segmentation of overlapping clusters more important, especially the extraction of the front cluster, as it is the basis of subsequent peduncle recognition and location. There has also been a lot of research into the segmentation of overlapping fruit.
Chinchuluun R. et al. realized the segmentation of overlapping citrus using two steps. First, the citrus area was obtained by color information, and then the overlapping fruits were segmented using the marker-controlled watershed algorithm [6]. In [7], based on morphological operation, texture analysis, and random Hough transform, the mangoes in the image were extracted and the overlapping mangoes were further segmented by ellipse fitting. In [8], a method based on edge curvature analysis was proposed for the recognition of overlapping tomatoes. The curvature anomaly points were eliminated first, then the complete contour of the tomato was reconstructed using circular regression of the filtered points. A method based on convex hulls was proposed in [9] to segment overlapping apples. In the research, the contour of overlapping occluded fruits was reconstructed by the Spline interpolation algorithm. Lu J. et al. adopted three indicators that included length, curvature, and convexity to filter the effective segment of the contour of citrus fruits and further reconstructed the contour of the occluded fruit by ellipse fitting [10]. In addition, there were also some studies for the segmentation of overlapping grape clusters. For the segmentation of double grape clusters, Luo et al. proposed a method based on the geometric characteristics of overlapping grape contours [11]. First, the grape region was extracted by k-means clustering on the H component of the HSV color space and the contour was extracted based on the clustered grape region. Then, a geometric model was established to obtain the contour intersection points of double overlapping grape clusters using profile analysis such that the regional pixels of double grape clusters were separated by a line connecting double intersection points. In [12], Liu et al. proposed a method based on the improved Chan-Vese model to extract the front grape cluster. In the grape recognition stage, they also used the k-means clustering on the H component of the HSV color space to obtain the grape region. However, in the overlapping clusters segmentation stage, an improved Chan–Vese model was applied to extract the front cluster from the overlapping grape clusters and obtain a fine contour. In addition, they also performed contour analysis of the grape region obtained in the recognition stage to obtain the center point of the target cluster, which was necessary for the use of the Chan–Vese model.
The above research is mainly based on the gray, or geometric, characteristics of the edges to segment the overlapping fruits. Although these methods have achieved good segmentation results for different fruits under different conditions, there are still problems such as little occlusion, relatively simple background, and a small number of overlapping fruits, which make it difficult to meet the practical needs of harvesting robots in natural environments. In addition, the method of fitting using circles or ellipses can only obtain a rough approximate contour rather than an accurate contour. Further, the calculation procedures of contour-analysis-related methods are too complicated and can only handle relatively simple fruit overlapping situations.
To address the issue of the complicated calculation procedure, the existing method could only handle a double overlapping situation. In this study, a simple method is proposed for the segmentation of overlapping grape clusters on a trellis. The segmentation of grape overlapping on trellises was taken as the research object, and a simple method was proposed to deal with double overlapping and multiple overlapping. The main work of this study are as follows:
(1)
A semantic segmentation model was trained by our own annotated dataset for the recognition of grapes.
(2)
The idea of transfer learning was adopted to improve the segmentation performance of the semantic segmentation model.
(3)
Based on the idea of the region growing algorithm, a depth-based region growing method (DRG) was proposed to extract the front cluster of overlapping grape clusters.
The remainder of the article is organized as follows. In Section 2 the motivation of the proposed method is given. In Section 3, the sketch and the detailed procedure of the proposed method are presented. In addition, Section 4 presents the experiment method and materials, and a comprehensive discussion based on the results of the experiment. Finally, a conclusion of the research and the future work are given in Section 5.

2. Motivation

With the rapid development of deep learning, a variety of networks have been proposed and have achieved remarkable achievements in various fields, including in agriculture. In contrast to the conventional image process method, deep learning can automatically learn the hierarchical feature expression hidden deep in the images, avoiding the tedious procedures to extract and optimize handcrafted features [13]. In the field of agriculture, networks such as Mask R-CNN and YOLO series are usually adopted for target detection and have achieved good effects for mangoes [14,15], strawberries [16], and apples [17]. However, some other models are used for classification such as AlexNet and GoogLeNet. The application of deep learning in image processing can be divided into three classes: (1) target classification, that is, to determine the category of the target in the image, such as for fruit variety recognition, disease variety recognition, and fruit grading; (2) target detection, that is, detecting and locating the target in the image that is commonly used in target detection models including R-CNN, Fast R-CNN, Faster R-CNN YOLO, etc., which are often used to detect fruits or disease in the image; (3) semantic segmentation, which can accurately determine the category of each pixel. For example, in [18], the finely trained DeepLabV3+ could represent the background pixels as black and the target as red. In summary, the model related to target recognition is not applicable to this research. In addition, the target-detection-related model generally generates a bounding box in the image to locate the grape, which cannot obtain the contours of the target. Since the accurate segmentation of the grape region is the prerequisite for the segmentation of overlapping grapes, the target-detection-related model is also not suitable for this research. Compared with classification and target detection, semantic segmentation can achieve pixel-level segmentation of targets, which is more suitable for this work. However, there are a variety of semantic segmentation models such as U-Net, FCN, SegNet, PSPNet, and DeepLab series, etc. Among the various semantic segmentation models, DeepLabV3+ had been extensively used in many studies [18,19,20] and can obtain more accurate contours. Therefore, DeepLabV3+ was chosen as the model for the recognition of grapes.
To extract the front cluster of overlapping grape clusters, it is necessary to find the difference between the front cluster and the occluded cluster, and the more significant the difference, the better the segmentation result. Therefore, our main goal was to find the biggest difference between overlapping grape clusters. From the front view two overlapping clusters of grapes can be seen, as shown in Figure 1a. As they are grapes of the same variety, their colors are basically the same, so it is difficult to distinguish them from each other by color information. However, when we observe the relationship between the camera and the overlapping grape clusters from another angle, as shown in Figure 2, the distance between the two grape clusters and the camera is different in terms of spatial position. From Figure 2, we can intuitively observe that the distance from the front grape cluster to the camera is less than the distance from the occluded grape cluster to the camera. With the problem of overlapping grape clusters segmentation, if we use the camera that can obtain the target distance and make use of the difference of the distance between the overlapping grape clusters and the camera, the difficulty of the problem will be greatly reduced. Fortunately, with the continuous development of sensor technology, many low-cost RGBD cameras are emerging. Among them, the Intel RealSense series is widely used in various fields for different applications. In this research, the RealSense D435 was chosen as the sensor to capture RGB and depth data.
Due to the high similarity in color and gray level between overlapping grape clusters, the depth between them relative to the camera is highly different. Therefore, based on this point, we propose an algorithm, the depth region growing method, to extract the front grape cluster of the overlapping grape clusters. The conventional region growing algorithm is a serial region segmentation method based on gray similarity and gray discontinuity. Its basic idea is to gather pixels with similar properties to form a region. Compared with the conventional region growing method, the basic idea of the proposed depth region growing method is similar, except that the color or gray similarity is replaced by the depth similarity. The main idea and procedures of the depth region growing algorithm are shown in Figure 3. Firstly, one pixel of the front grape cluster is selected as the seed point as shown in Figure 3b. The depth similarity between the seed point and its adjacent points (4 or 8 neighborhood points) is then evaluated as shown in Figure 3c. If the similarity conditions are met, it is considered that the compared point belongs to the front grape cluster and continues to take the adjacent point of the grown points for similarity comparison with the seed point. After a round of growing, the complete front grape cluster can be obtained, as shown in Figure 3d.

3. Methodology

The main procedure of the proposed algorithm for the segmentation of overlapping grape clusters is shown in Figure 4. First, the RGB image is input into the finely trained semantic segmentation model (DeepLabV3+) to realize the pixel-level segmentation of grape clusters. The grape region is then mapped to the preprocessed depth data to determine the grape region in the depth map, and the depth-based region growth method proposed in this paper is then implemented to obtain the front cluster and fill the holes inside the extracted region. Finally, the contours of the extracted region are extracted and mapped back to the original RGB image.

3.1. Recognition of Grape Clusters Based on DeepLabV3+

3.1.1. DeepLabV3+ Network

DeepLabV3+ is a semantic segmentation neural network designed by Liang Chieh Chen et al. [21] in 2018 and is based on DeepLabV3. DeepLabV3+ is now widely used in various complex scenes for target segmentation, such as for skin lesions, road potholes, and weeds [22,23,24]. The network is composed of two parts: the encoder and the decoder, as shown in Figure 5. In the encoder module, the input image first passes through the atrous convolution, which is a powerful tool that allows the extraction of the features computed by deep convolutional neural networks at an arbitrary resolution. In addition, the atrous convolution can greatly reduce the complexity and obtain similar (or better) performance. A simple yet effective decoder concatenates the low-level features from the network backbone with the upsample encoder features, then several 3 × 3 convolutions and upsampling by a factor of 4 are applied to refine the segmentation results along the object boundaries. In addition, the model applies depthwise separable convolution to increase the number of feature acquisition layers and suppress the number of model parameters.

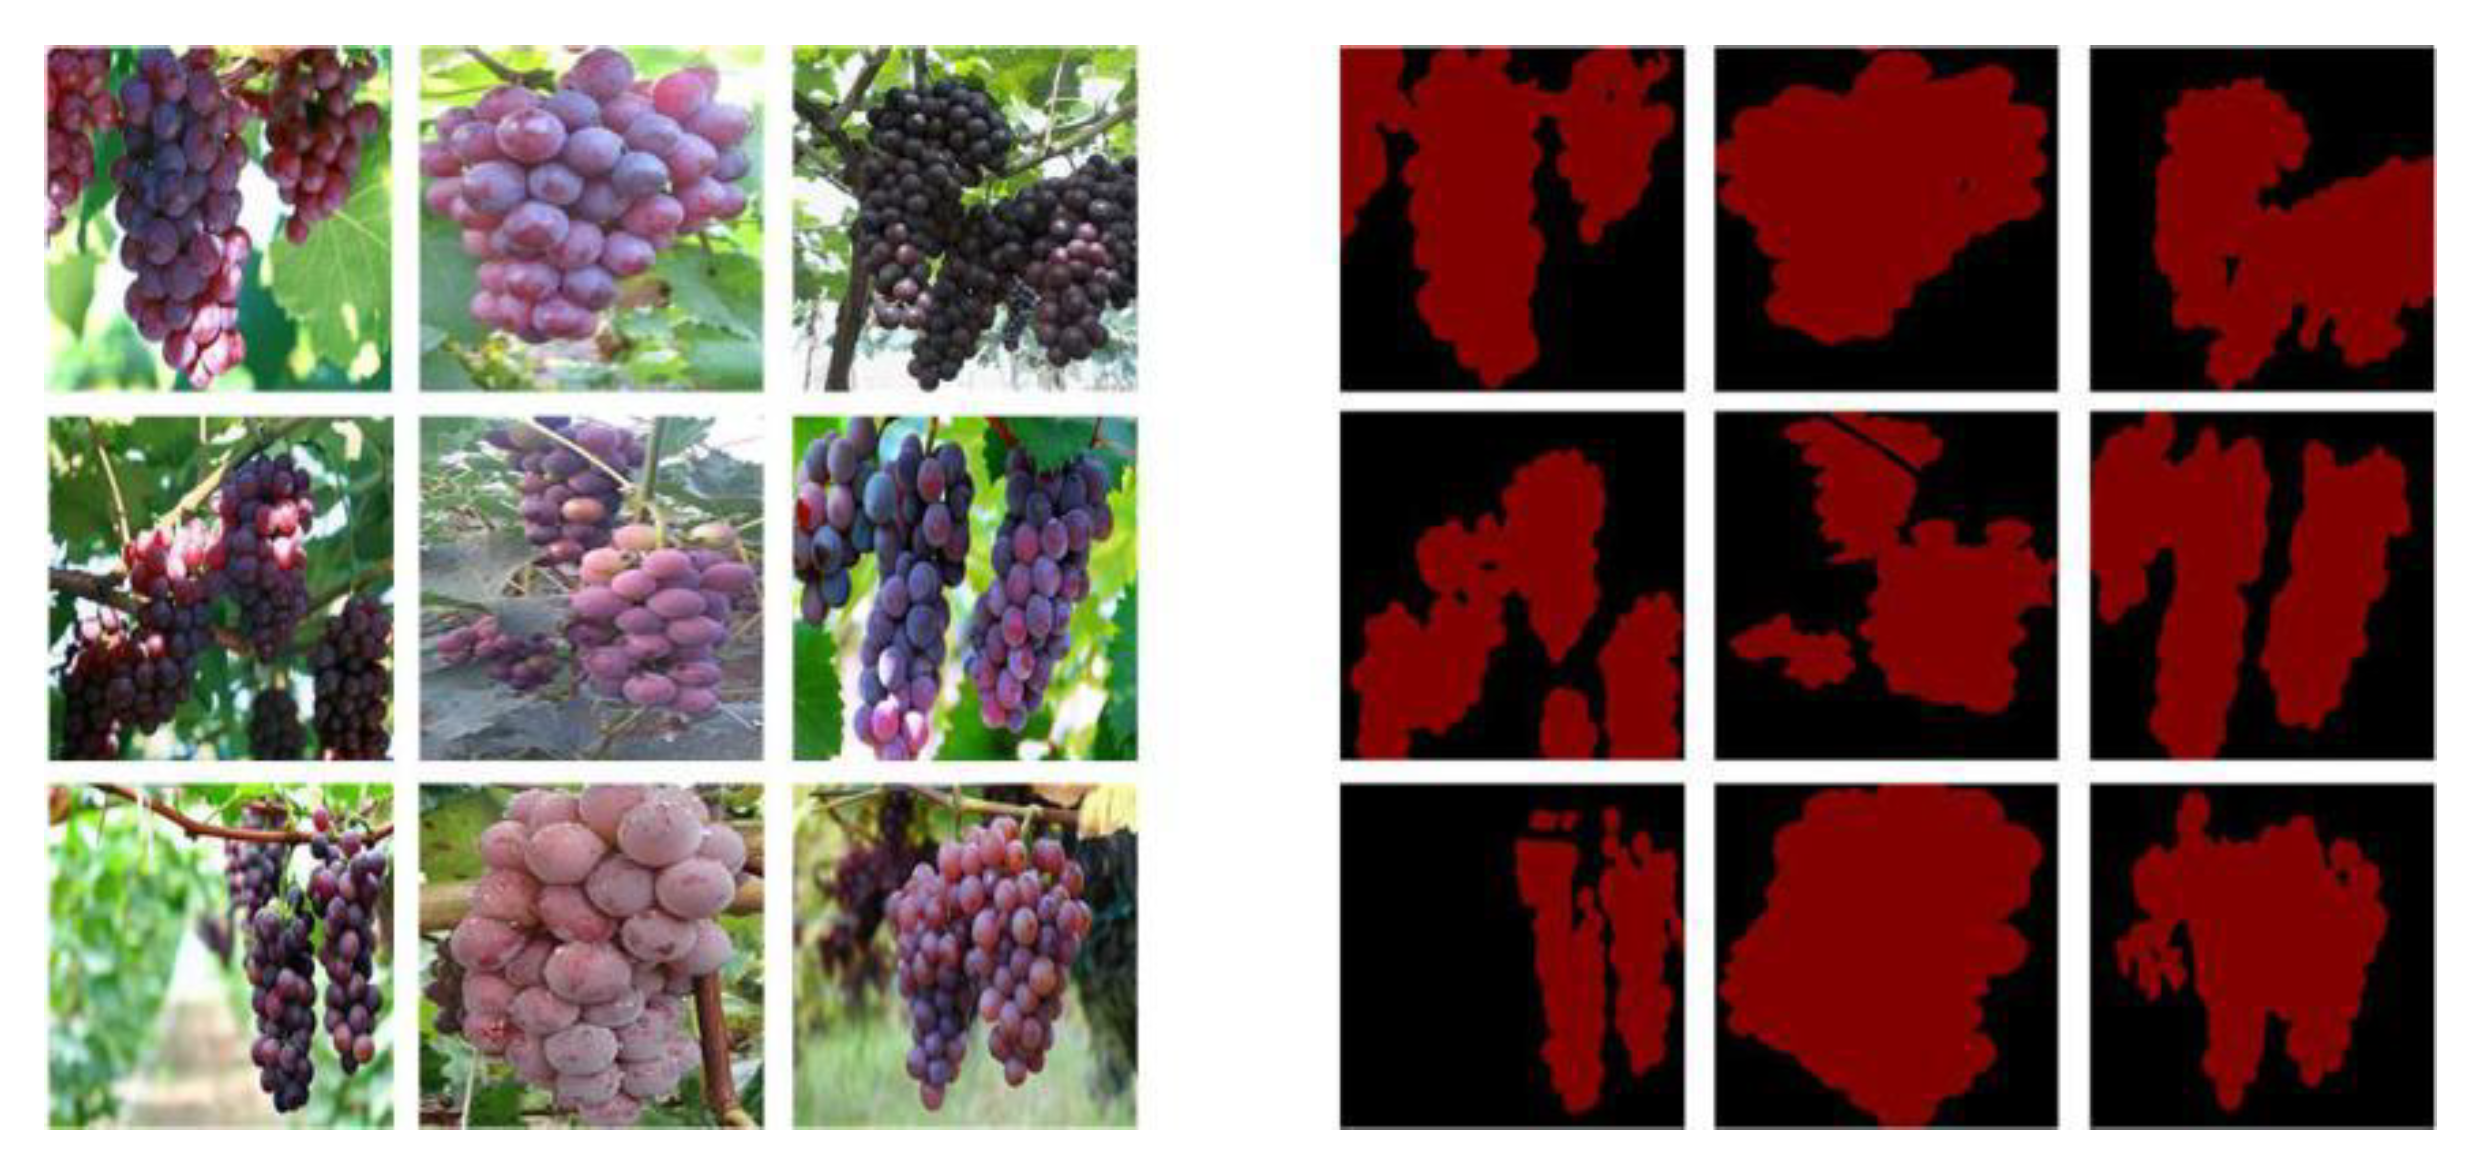
3.1.2. Image Annotation

The LabelMe software was used to annotate the dataset, which is boring and time-consuming work. The grape clusters were annotated as red, while the background pixels were annotated as black. By the procession of LabelMe, all the three-channel images were converted to one-channel images. The corresponding area of grape cluster regions were set to one and the background region was set to zero. This was because the adopted network could only process one-channel labeled images in the supervised learning training stage, rather than three-channel color images.

3.1.3. Data Argument

Data argument is a common method used to expand the amount of data and improve the generalization ability of the model in deep learning. It improves the robustness of the model and also prevent overfitting in the training stage. By applying translation, flipping, and adding noise disturbance to the original collected images, the number of images can be increased from 300 to 1200, which greatly improves the quality and quantity of the dataset. Part of the labeled images and original images in the dataset are shown in Figure 6.

3.1.4. Transfer Learning

Generally, a large dataset is necessary to train a deep network from scratch. However, with the established dataset of only a few images it was impossible to train the DeepLabV3+ from scratch, and it was easy to cause over fitting. In addition, the huge consumption of computing resources and time was also inevitable. To address the above issues, transfer learning was adopted to allow the DeepLabV3+ to be able to segment grapes with high accuracy on the condition that only a small dataset was provided. The basic idea of transfer learning is to transfer the knowledge gained in other fields to a new task [25]. In order to implement the transfer learning, the DeepLabV3+ was first trained on the PASCAL VOC2012, which contained tens of thousands of images with 20 classes. Furthermore, the established dataset was applied to finely tune the pretrained model by setting it to discard the parameters of the last learnable layer and freeze the parameters of the other layers. In particular, in order to make the pretrained network compliant to our task, the number of the last convolution kernels should be adjusted into the predicted category. In our case, two categories should be predicted, i.e., background and grape, then the number of the last convolution kernels should be set as two.

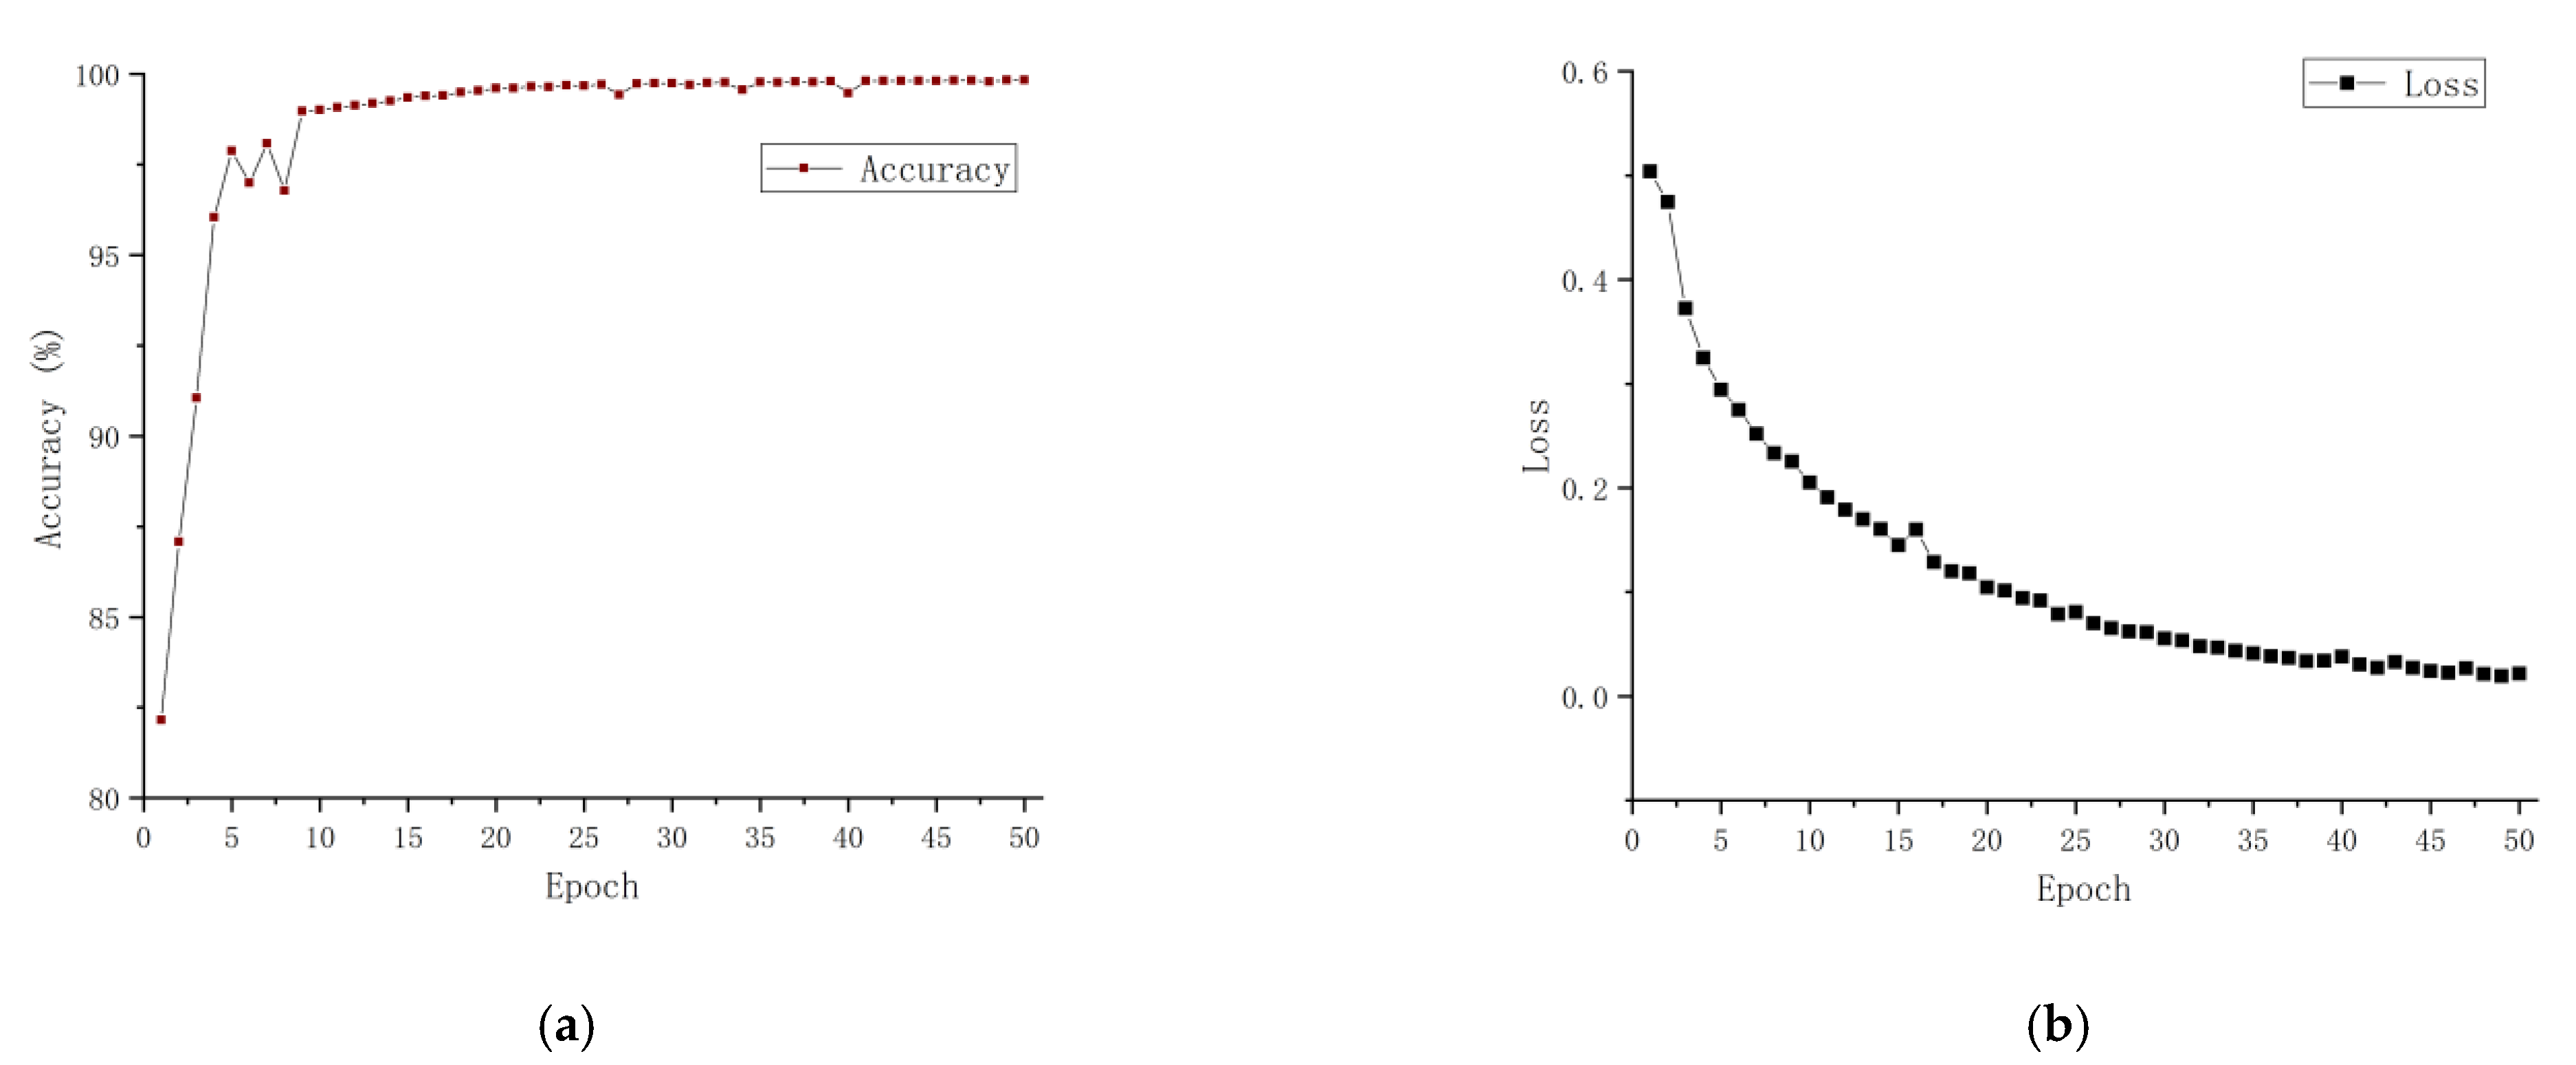
3.1.5. Model Training

Table 1 shows the parameters used for training the DeepLabV3+ network. Figure 7 shows the accuracy and loss curves obtained on the training dataset. The polylearning rate strategy was adopted, and the learning rate of each iteration was obtained using Equation (1). In addition, the train batch size was set to 16, the weight decay was set to 0.00004, and the momentum was set to 0.9.
L R = I n i t i a l L R ( 1 i t e r max i t e r ) p o w e r .
where L R is learning rate, I n i t i a l L R is the initial learning rate, i t e r is the current number of iterations, max i t e r is the maximum number of iterations, and p o w e r is the exponent of the power operation.

3.1.6. Recognition of the Grape Clusters

Once DeepLabV3+ was trained on the dataset, it had a strong semantic segmentation ability to recognize the grape clusters. The input image, as shown in Figure 8a, is processed by DeepLabV3+ and the output image is shown in Figure 8b. It can be seen that some black holes were contained inside the grape-cluster area, as shown in Figure 8b. This was because the DeepLabV3+ could realize pixel-level semantic segmentation, and the model could distinguish each pixel in the input image and determine whether it was grape or background. Comparing it with the original picture, we can see that the black hole area is the background through the gap between grape berries. Therefore, the model accurately segmented these pixels into the background rather than grape clusters.

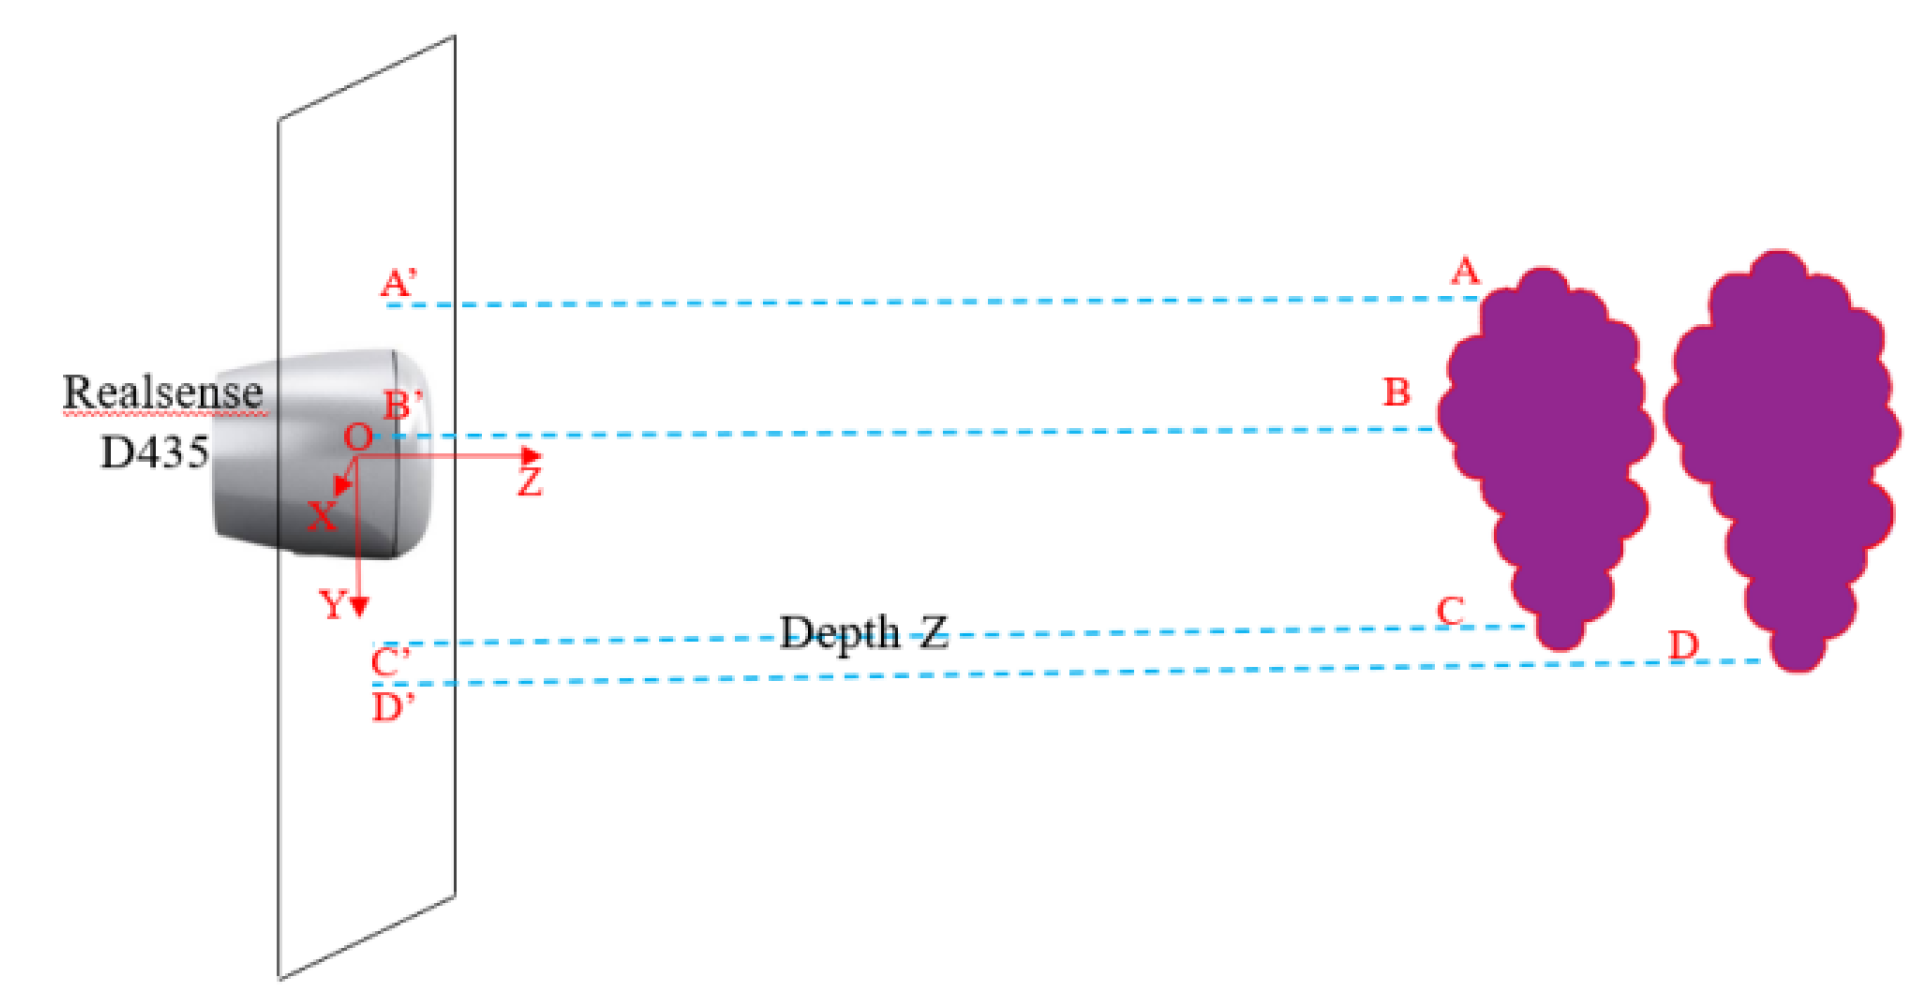
3.2. Extraction of the Front Cluster

3.2.1. Preprocessing of the Depth Map

There were many zeros in the original captured depth image. These zeros were not the actual distance of the target but some invalid values, as shown in Figure 9a. The existence of these zeros will have had a significant impact on the proposed algorithm, considering the effective range of RealSense D435 and the workspace of a commonly used manipulator. Therefore, to eliminate the influence of these zeros, a preprocessing operation was adopted for the depth image where all the zeros were replaced by 2 m. In addition, all the points with values greater than 2 m were also replaced with 2 m and the results are shown in Figure 9b.

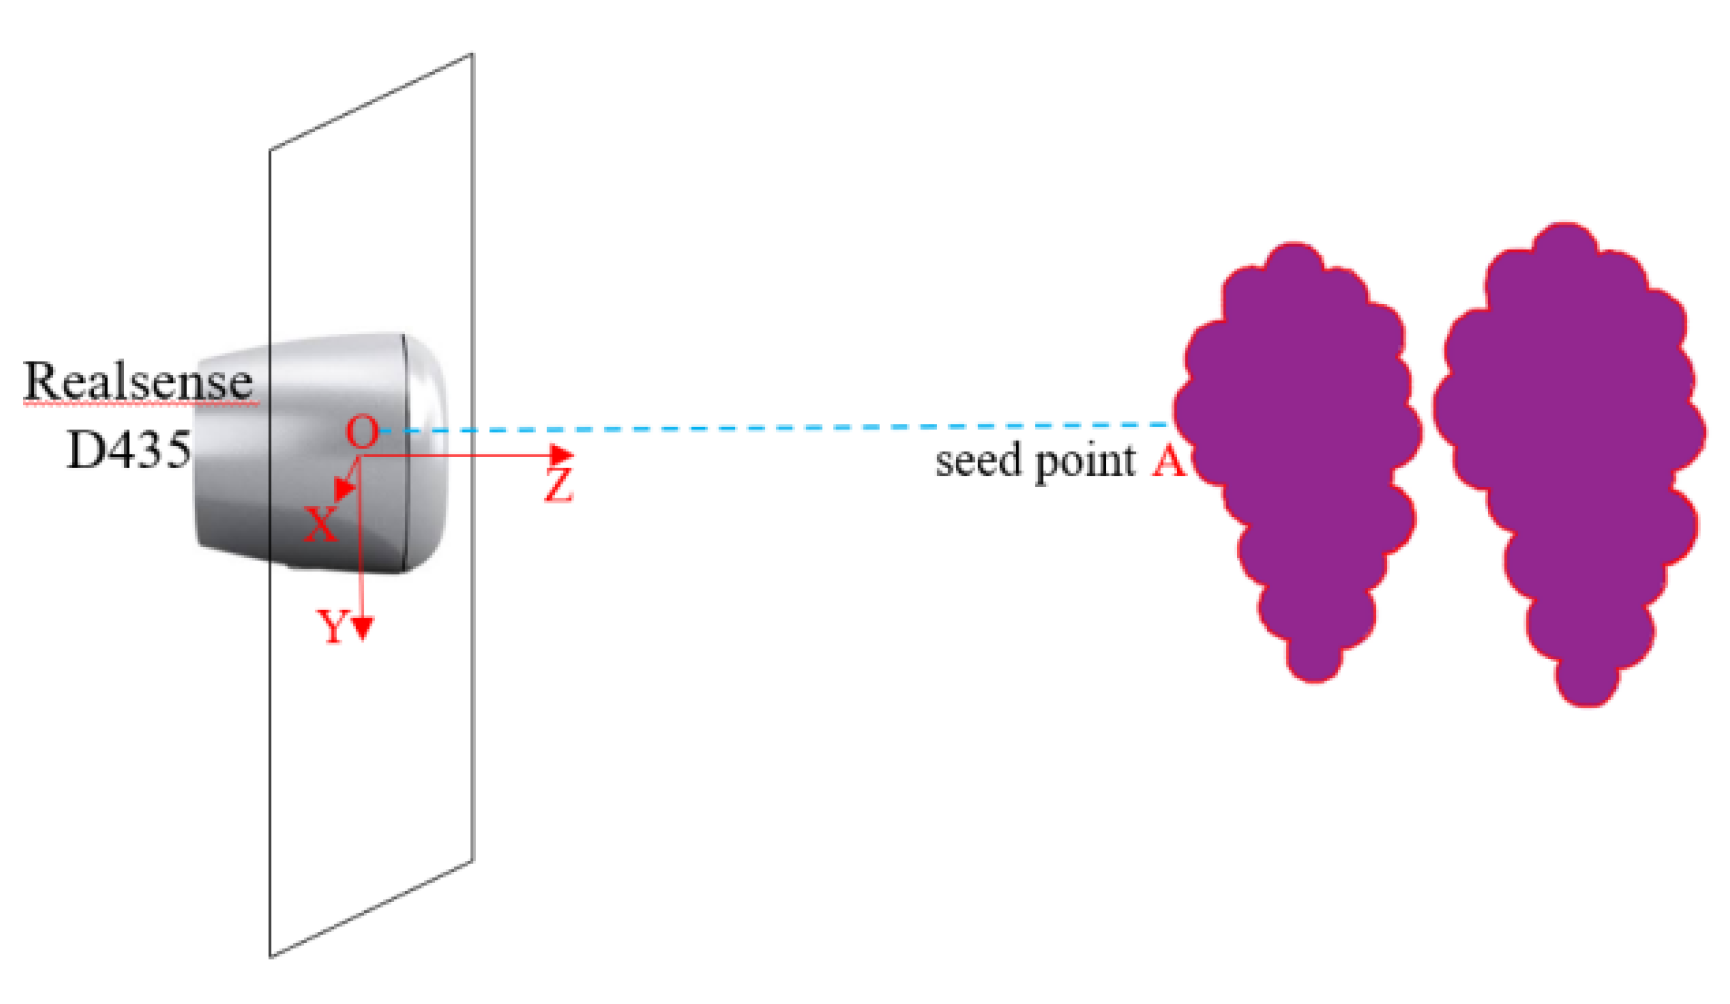
3.2.2. Selection of the Seed Point

The region growing method needs to select a seed point from which to calculate the starting of growing. In the conventional region growing method, the seed point is selected interactively or fixedly. The former method has poor flexibility and needs manual intervention, which is not conducive to the robot’s automatic operation. In addition, the position of grape clusters in the image is random; hence it is impossible to select a fixed point in the image as the seed point. According to the purpose of this study, i.e., to extract the front cluster of overlapping grape clusters, as shown in Figure 10, the nearest point (A) between the overlapping clusters and RealSense D435 was selected as the seed point.

3.2.3. Selection of the Similarity Threshold

Similarity was the key to determine whether an adjacent pixel could be integrated into the grown area. For the conventional region growing method, the similarity is generally measured by the difference of the gray value of different pixels, while for the proposed algorithm the difference of depth value of different pixels was used to measure the similarity. We randomly selected some Kyoho grape clusters to measure their respective diameters and took the average radius as the similarity threshold. This meant that starting from the seed point, when the distance between the adjacent point and the seed point was less than the similarity threshold, the point was judged to belong to the same cluster as the seed point.
To obtain the similarity threshold, ten bunches of Kyoho grapes were randomly selected. According to the observation, three possible maximum diameters were selected and measured with a vernier caliper. The maximum diameter was recorded as the maximum diameter of this bunch of grapes (one decimal reserved). As shown in Figure 11, the mean diameter was 107.6 mm, with variations of 78–132 mm. Therefore, 58.8 mm (107.6/2) was chosen as the similarity threshold.

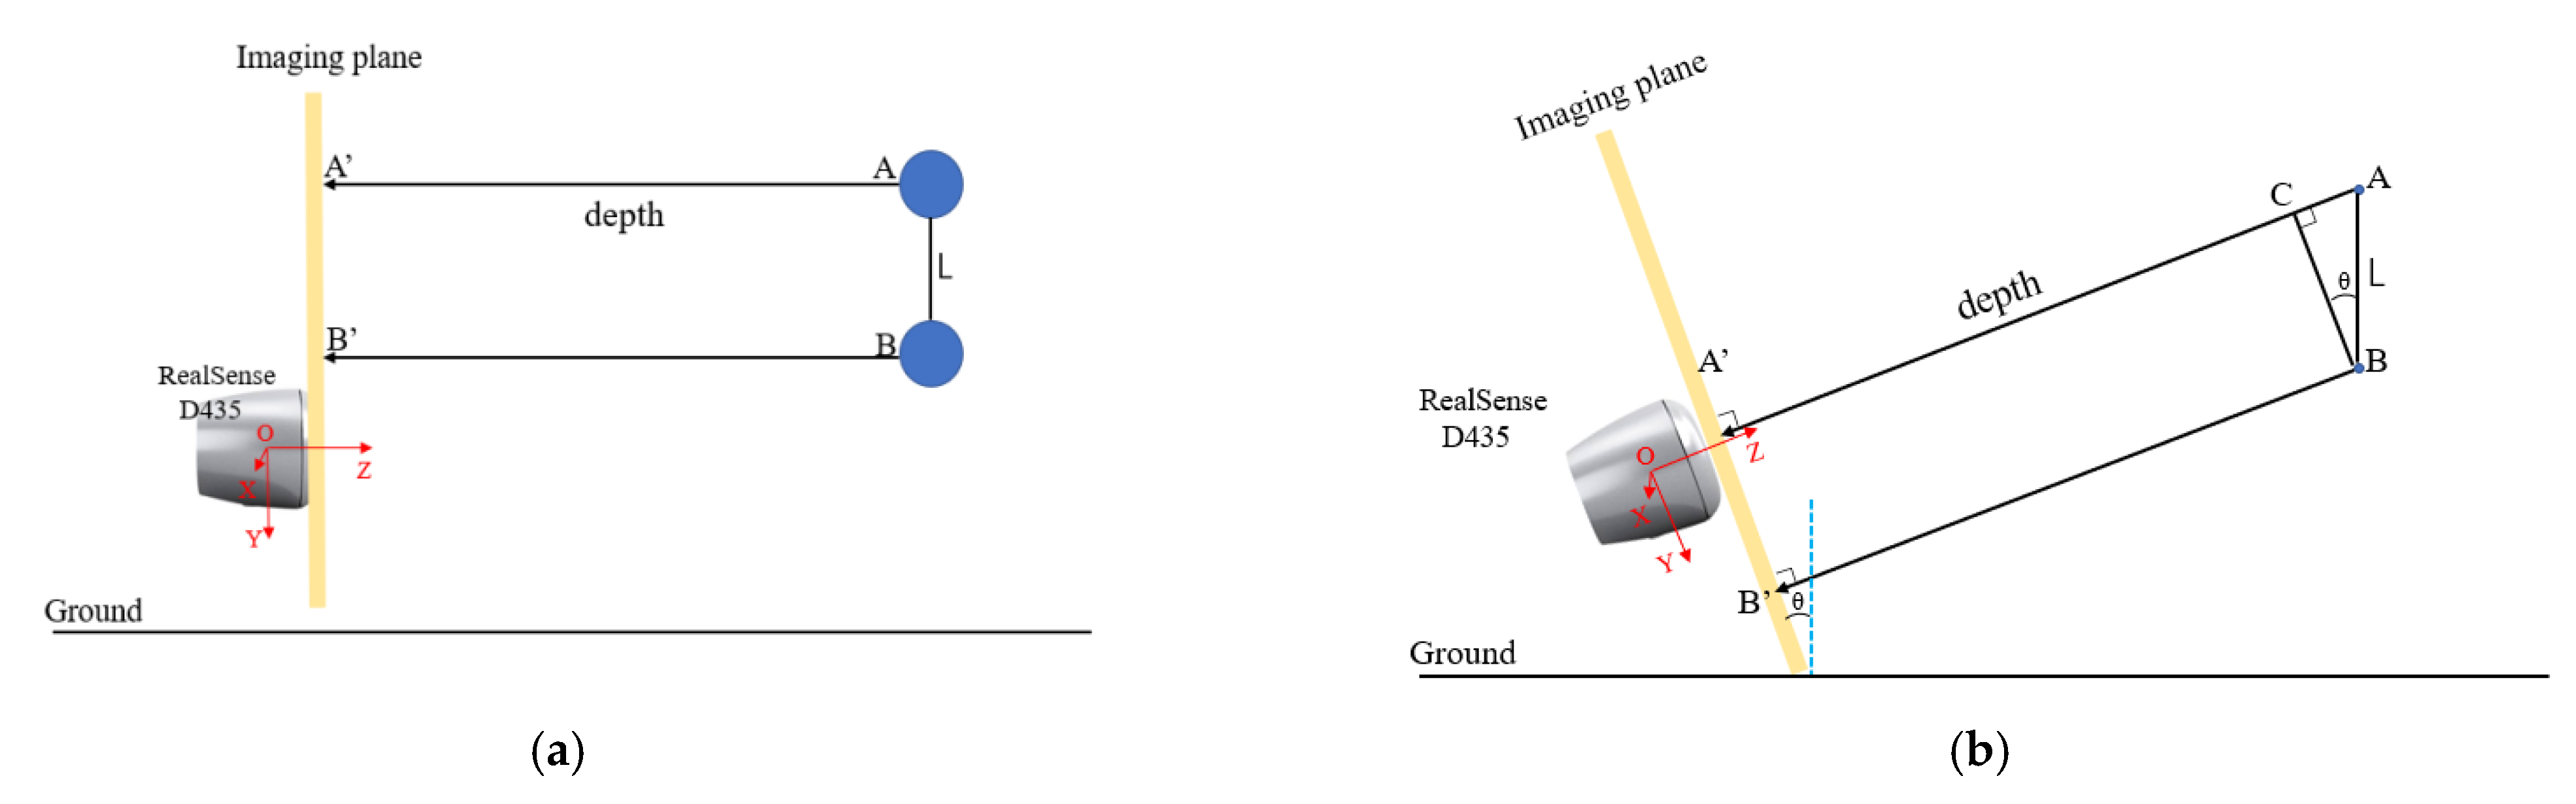
3.2.4. The Effect of Camera Tilt Angle

As shown in Figure 12, the RealSense D435 was placed on a triangle bracket and faced a white wall to capture the depth image of the wall. When the optical axis of the camera was perpendicular to the white wall, the depth image captured was as shown in Figure 12a, and the image captured by the camera at a certain pitch angle was as shown in Figure 12b. The color of the depth image was linear with depth value. The color of the depth image in Figure 12a was the same, indicating that the depth values from each point of the white wall to the camera were the same, while the color of the upper part of the depth image in Figure 12b was obviously different from the lower part, which indicated that the depth values were different.
The reason for the phenomenon shown in Figure 12 is that the value of depth pixel in the depth image represented the distance of an object to the imaging plane of the RealSense camera rather than to the actual RealSense, as shown in Figure 13.
Owing to the imaging characteristics of the RealSense mentioned above, the tilt angle of the camera when it captured the target will have had a great impact on the performance of the proposed depth-based region growing algorithm. As shown in Figure 14a, assuming that the imaging plane was perpendicular to the ground, two points A and B in the coordinate system of the RealSense D435 differed only by L on the O Y axis. According to the imaging characteristics of the depth image, the depth value of A and B should have been equal, i.e., A A = B B .
Suppose that the camera was rotated in the counterclockwise direction by an angle of θ ° , as shown in Figure 14b. The depth value of A and B were then no longer equal. The relationship of depth value of A and B is as follows:
A A = A C + C A ,
according to the geometric relationship shown in Figure 14b,
C A = B B ,
then,
A A = A C + B B .
Equation (2) indicates that due to the tilt of the camera, there is a depth difference AC between points A and B on the depth image. According to the principle of trigonometric, we can obtain:
A C = L sin ( θ ) ,
where A C is the depth difference, and θ is the tilt angle of the RealSense camera.
Equation (5) shows that the depth difference between A and B in the depth image is influenced by two factors θ And L .
It was assumed that point A was the highest point from the grape cluster to the ground, B was the lowest point, and A B was perpendicular to the horizontal plane. Then L was the length of the grape cluster. Therefore, the depth difference between A and B was related to the tilt angle of the camera and the length of the grape cluster. Figure 15 shows the length of 10 randomly selected grape clusters (Kyoho). The length varied from 227 mm to 258 mm, and the average value was 242 mm. Taking the average value into Equation (1), we can obtain:
A C = 242 × sin ( θ ) .
Equation (6) indicated that the depth difference for front grape cluster extraction is only related to the tilt angle of the RealSense. When θ is 0, there was no depth difference, and the segmentation performance was the best. With the increase in tilt angle, the greater the depth difference was the more influence there was on segmentation performance.
Therefore, when installing the camera on the robot, the optical axis of the camera should be parallel to the horizontal plane as far as possible, to reduce the impact of camera tilt angle on the segmentation effect. However, the robot working site was not horizontal and was often rugged. The rigid interconnection of the camera and the robot inevitably produced a tilt angle of the camera. We assumed that the tilt angle in the actual robot operation was between −15° and +15°, and we tested the influence of the tilt angle on the proposed algorithm. It should be noted that our assumption was reasonable. Figure 1b shows the grape planting and cultivation environment. Although the ground was not completely flat, the inclination angle generated by the robot operating in this environment should not have exceeded the range we assumed.

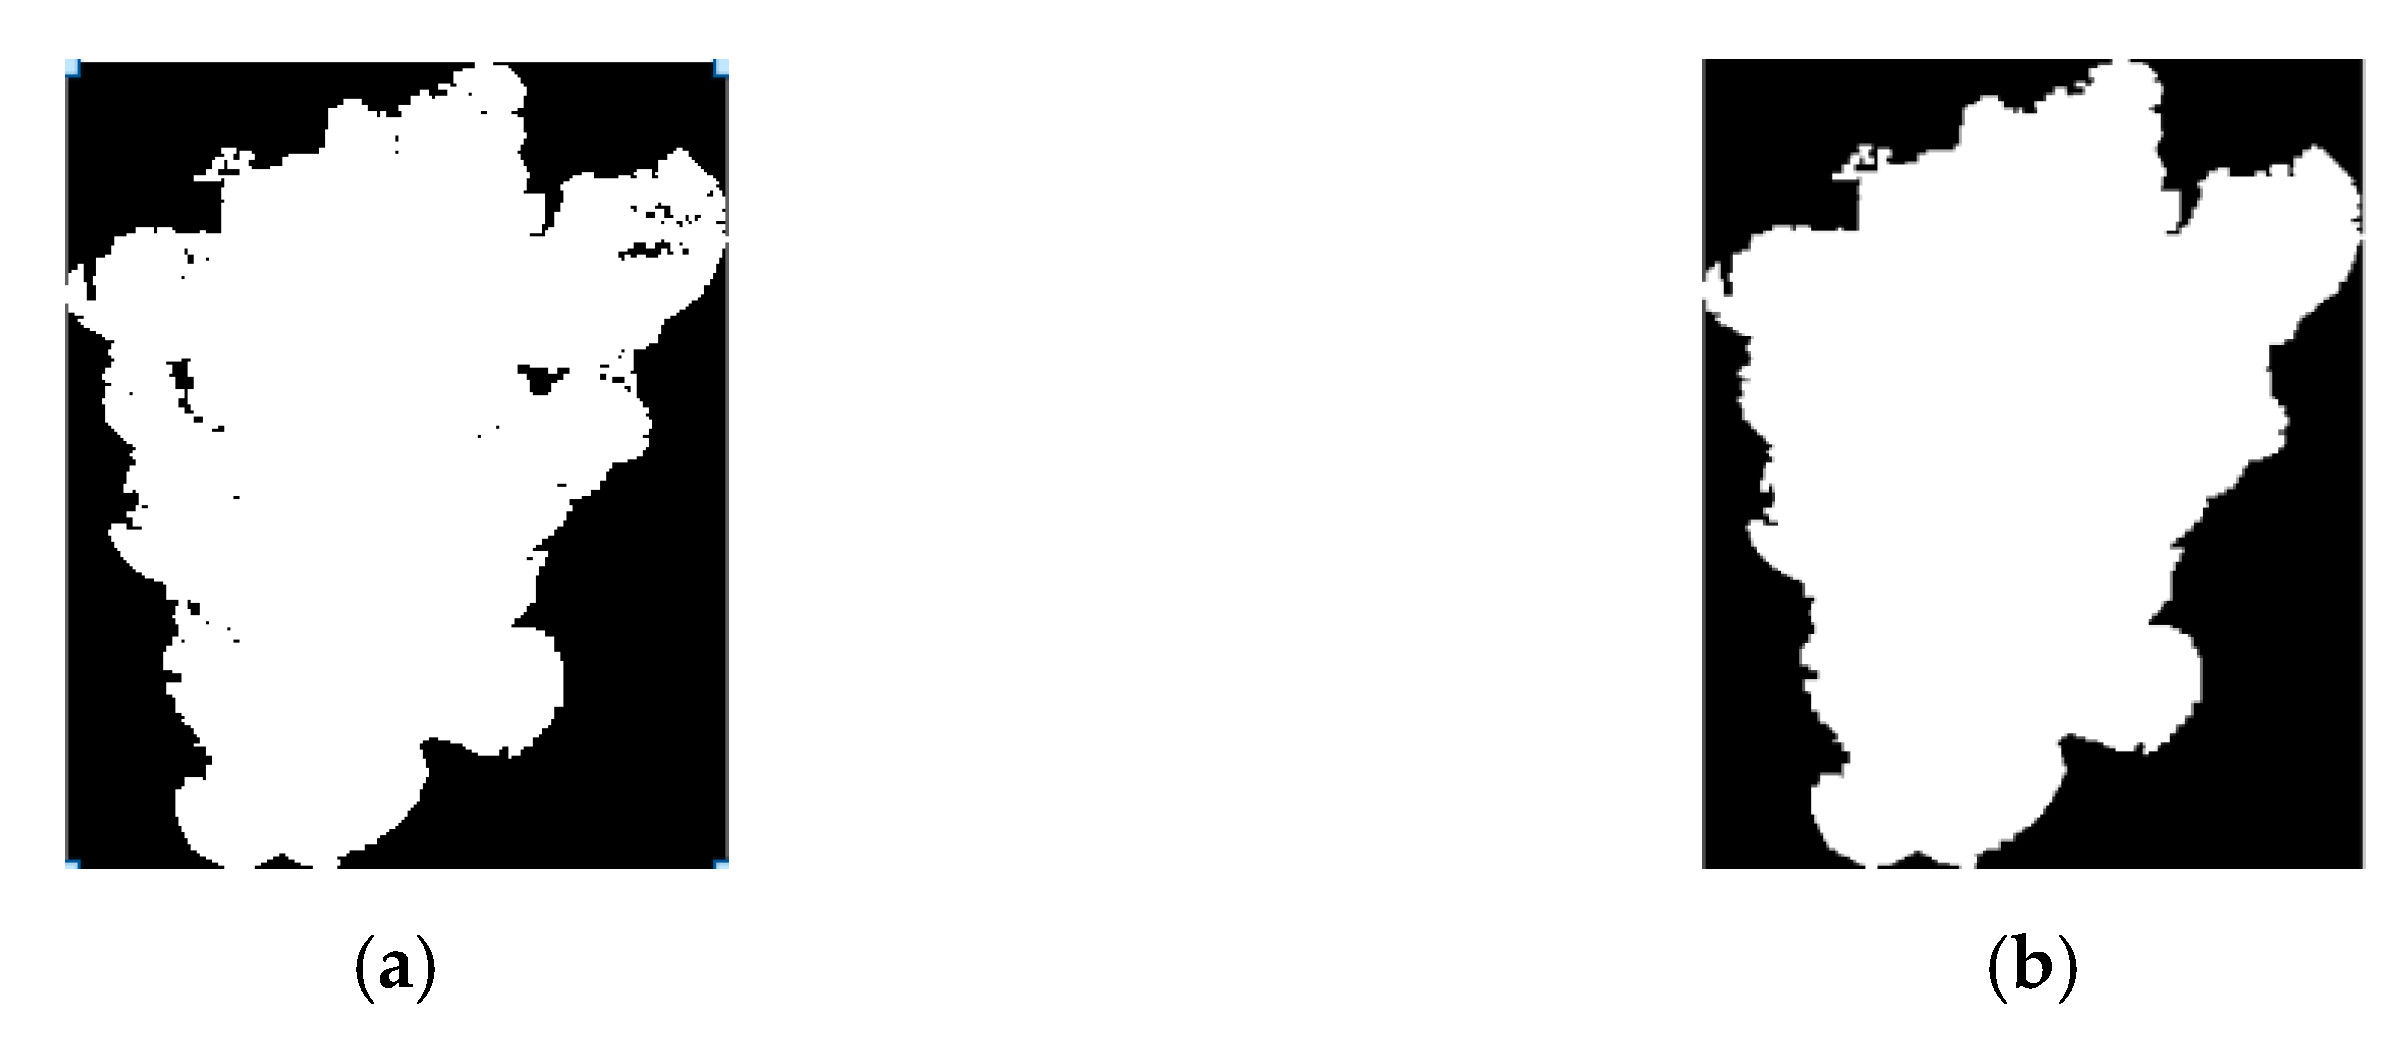
3.2.5. The Extraction of the Front Grape Cluster

By applying the proposed algorithm to the grape region in the depth image, the front cluster of the overlapping clusters could be obtained. However, there are some holes inside the region, as shown in Figure 16a. Two reasons are responsible for these black holes: 1. The output image of the DeepLabV3+ network contained black holes, and the proposed algorithm did not deal with such areas on the depth image, so that such black holes were retained. 2. The proposed depth region growing method failed to extract all pixels of the front grape cluster due to a lack of depth values in the region. For the accurate extraction of the subsequent contours of the whole front cluster, the holes needed to be filled, and the hole-filled front cluster was as shown in Figure 16b.

3.2.6. The Extraction of the Contour

When the front cluster of the overlapping cluster was determined the contour could be obtained, as shown in Figure 17a. In order to visually observe the extraction effect, the contour was mapped back to the RGB image, as shown in Figure 17b. It can be seen that the method proposed in this article could not only obtain the front cluster but also that a finer contour could be obtained.

4. Experiments Result and Discussion

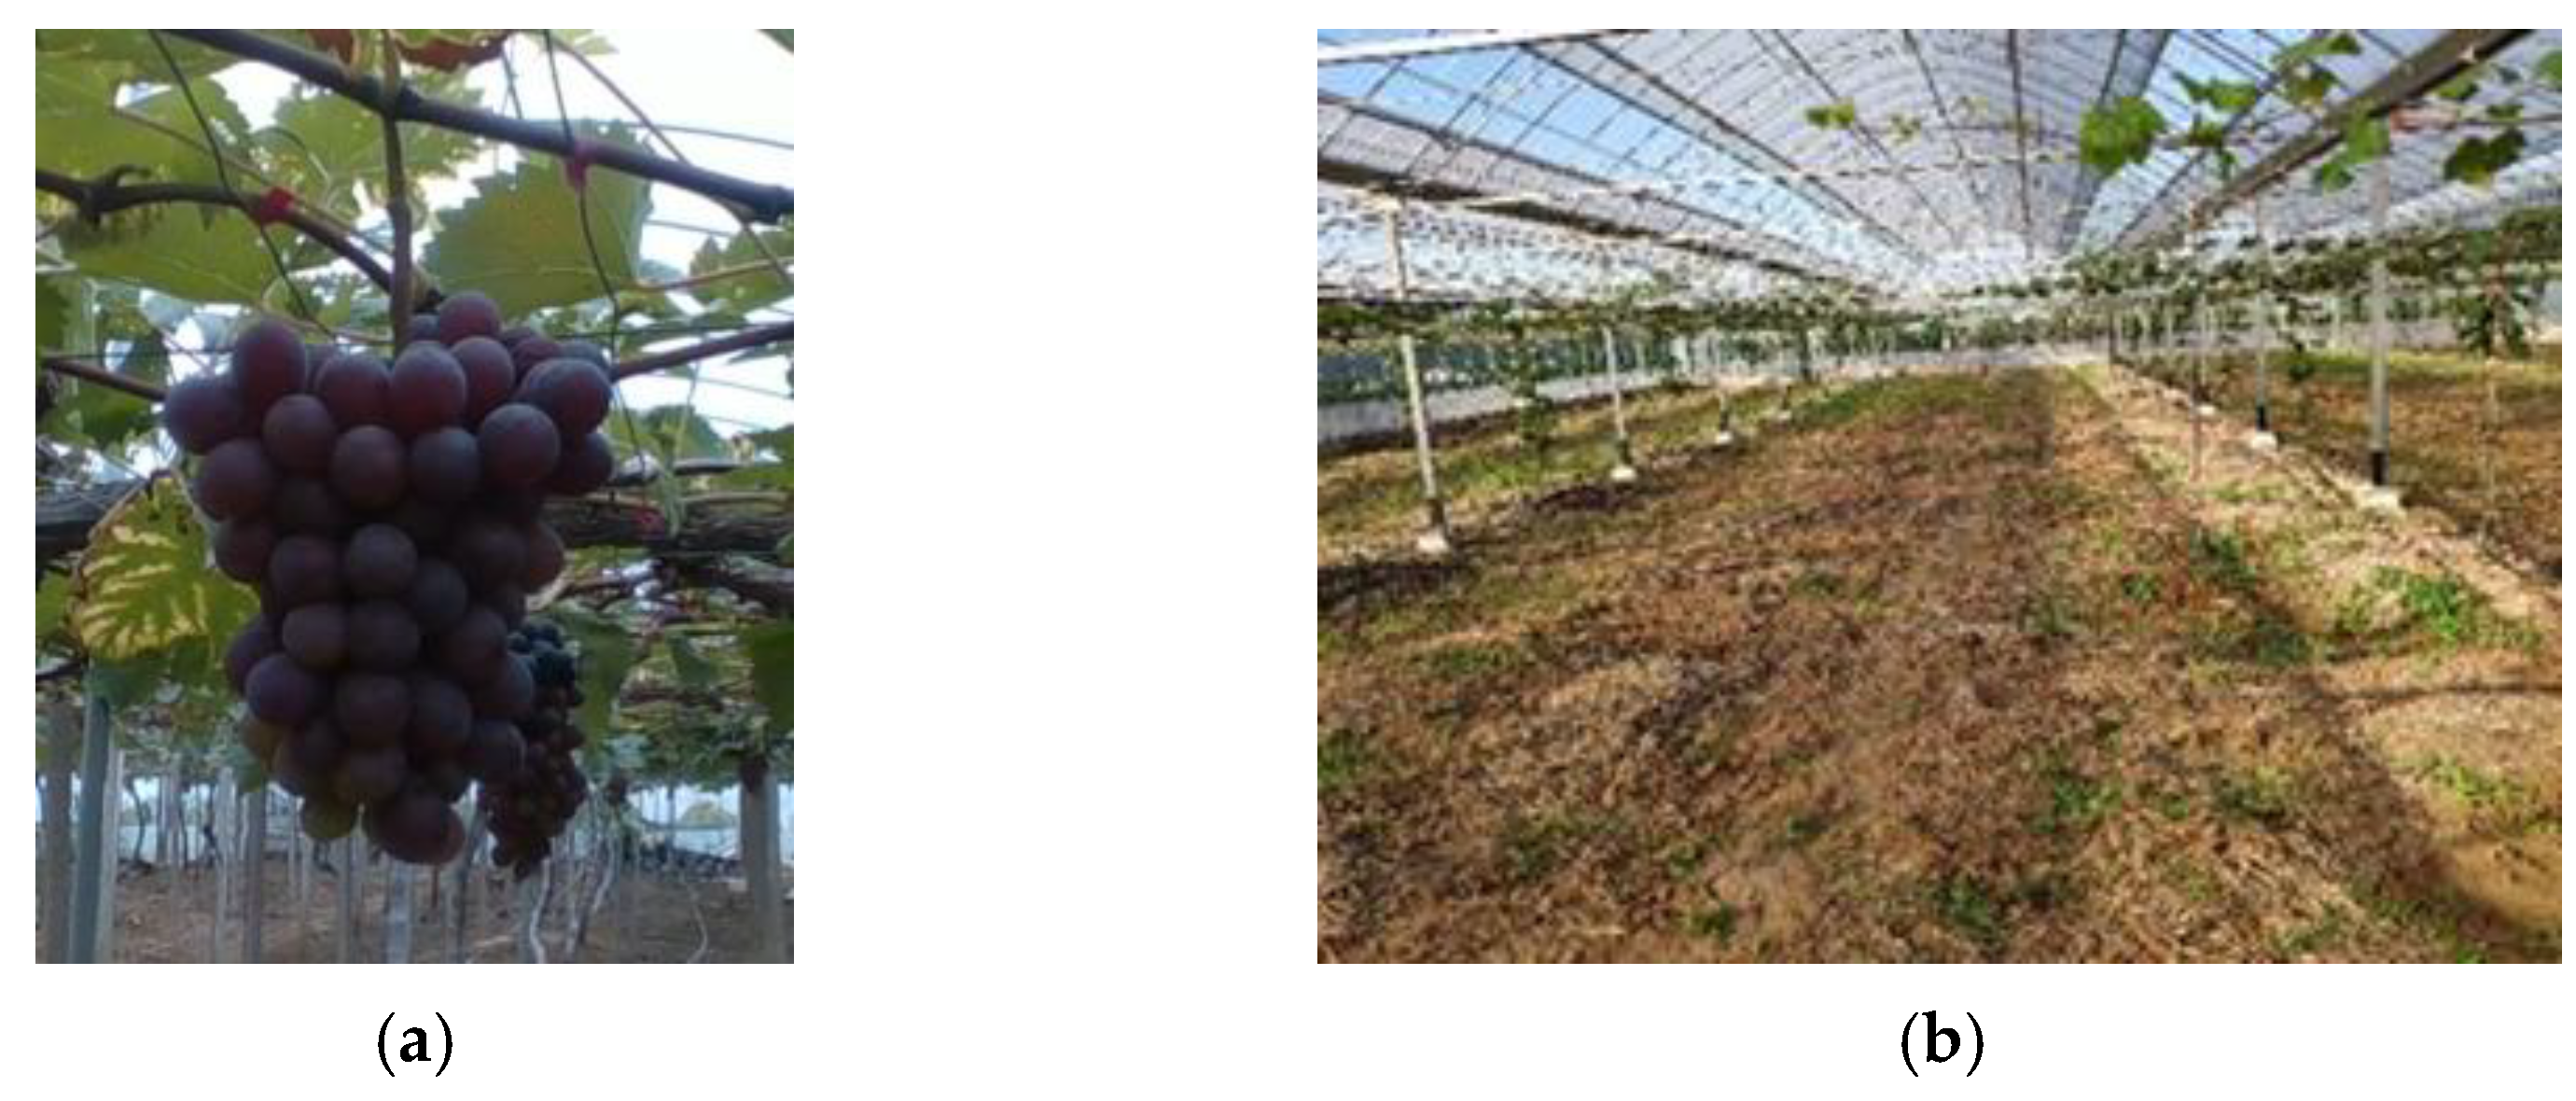
4.1. Data-Acquisition Materials and Method

The dataset used for the DeepLabV3+ training was established by another study performed by our research group [26]. All the images used to verify the proposed algorithm were captured by the RealSense D435 (as shown in Figure 18a) at the vineyards of LaoFang, Jurong, Zhenjiang, and Jiangsu, under different light conditions (front light, backlight, cloudy, rainy, etc.).
The maximum diameter and length of randomly selected grape clusters were measured by a digital display vernier caliper (measuring range: 0–300 mm, resolution: 0.01 mm).
The images used to verify the effect of the camera tilt on the proposed algorithm were captured by a method as shown in Figure 19. Xsense MTi-300 (as shown in Figure 18b) was attached to the back of the RealSense D435, forming a rigid body to keep both in the same altitude. The altitude of MTi-300 could be transmitted to the laptop through a USB interface in real time and displayed in the MT manager software.

4.2. Dataset and Evaluation Metrics

4.2.1. The Performance of DeepLabV3+ to Segment Grapes

A total of 35 images were adopted to evaluate the performance of the finely trained DeepLabV3+ network. Among them, 20 images were collected at random shooting angles to evaluate the overall performance of the proposed algorithm, and the other 15 images collected at different specific angles were used for the robustness of the algorithm to different shooting angles of the cameras. The benchmark dataset was obtained by manually annotating with the LabelMe software. Two metrics, i.e., IoU and F1 score were chosen to evaluate the segmentation performance on the test dataset. The meaning of IoU is shown in Figure 20, and the equation of IoU is:
I o U = T P T P + F P + F N ,
where T P is the number of true positive pixels of the segmented grape region, F P is the number of false positive pixels of the segmented grape region, and F N the number of pixels that are not segmented but actually belong to the grape region.
The F1 Score is a harmonic metric, which takes into account both the recall and precision of the classification model. The equation of the F1 Score is as follows:
F 1 S c o r e = 2 × r e c a l l × p r e c i s i o n r e c a l l + p r e c i s i o n ,
where recall is defined as follows:
r e c a l l = T P T P + F N ,
and precision is defined as follows:
p r e c i s i o n = T P T P + F P .
As shown in Table 2, the IoU of the trained model on the test dataset was 97.32%. The F1 score is shown in Figure 21 with a value of 0.9863. The results showed that the DeepLabV3+ trained by PASCAL VOC2012 and combined with our dataset could extract grape cluster pixels with high accuracy. In addition, only 98 ms were needed to process a single image, which can met the real-time demand for agriculture application.

4.2.2. The Performance of Extracting the Front Grape Cluster

Twenty overlapping grape-cluster image samples captured under different conditions were selected to evaluate the method proposed in this research. First, the front cluster in the selected samples was manually annotated as the reference. Then, the result obtained was combined by the proposed algorithm with the reference to calculate the evaluation metrics, i.e., precision and recall.
The experimental results are shown in Figure 22 and some of the extraction results are shown in Figure 23. The recall varied from 77.2% to 94% and the precision from 67.1% to 97.5%. The mean recall and precision were 89.2% and 87.5%, respectively. Although there were differences in the performance of different samples, the proposed algorithm could achieve a satisfactory performance and could achieve the accurate extraction of front grapes.

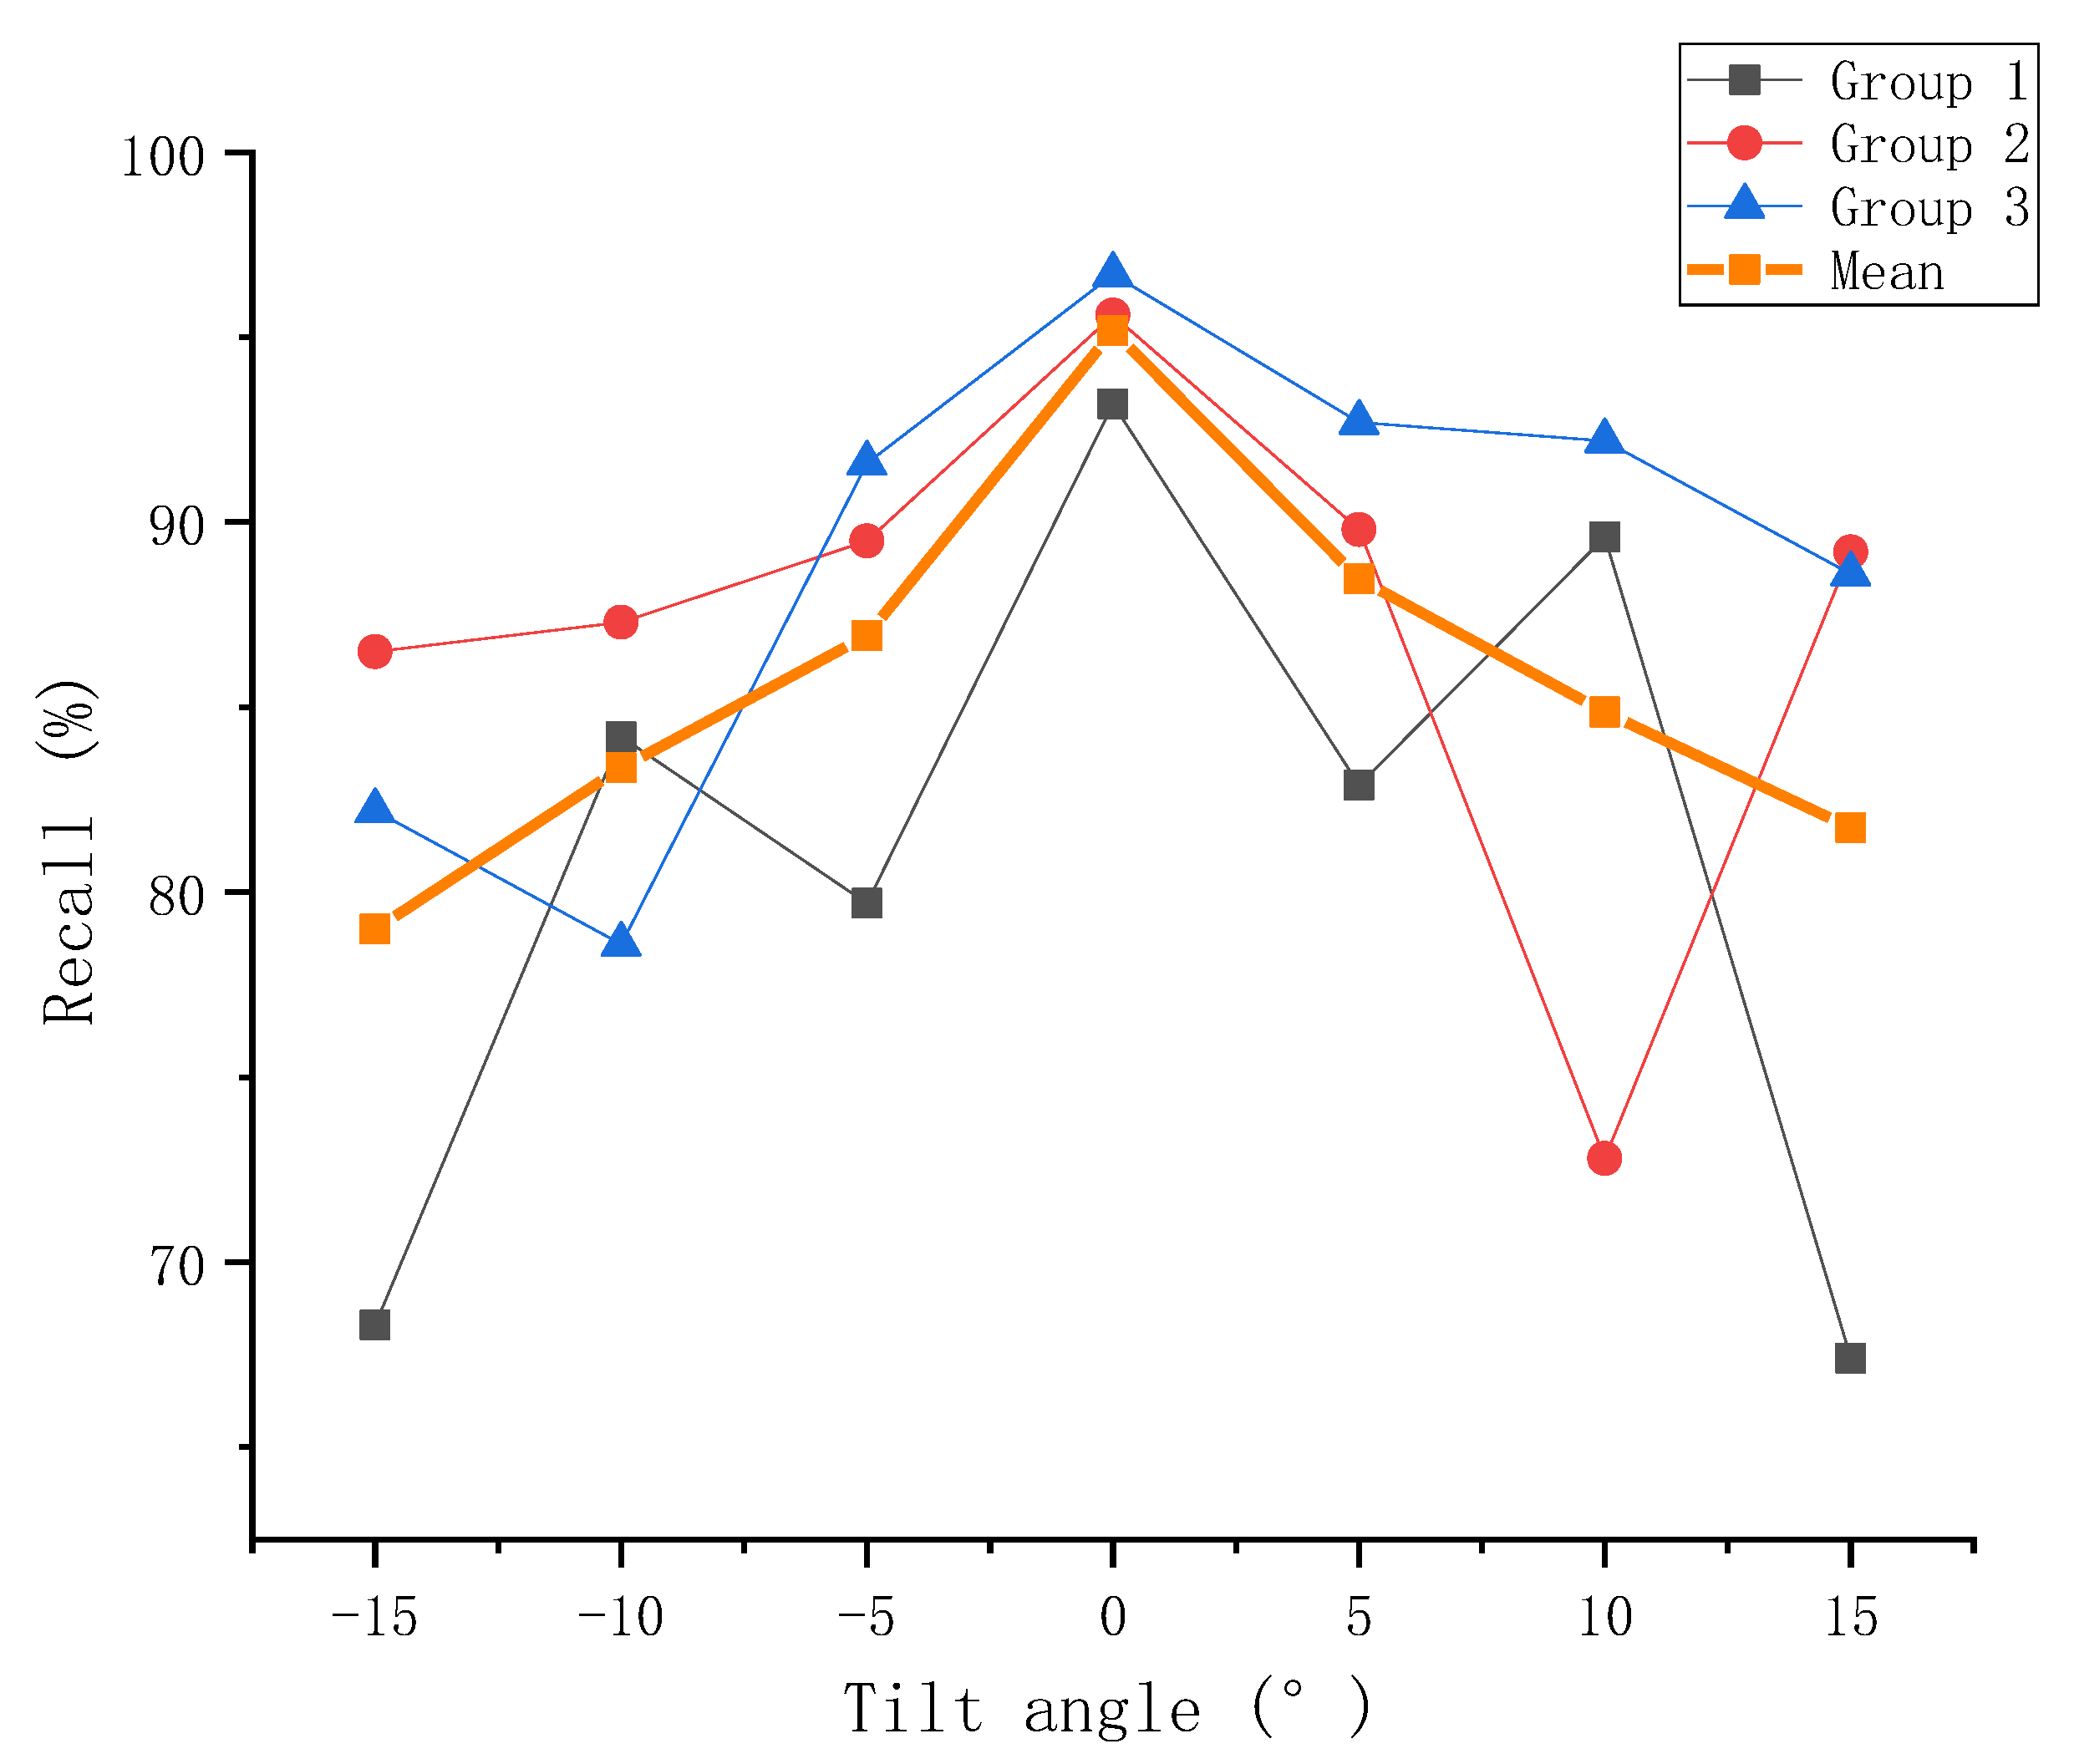
4.2.3. The Effect of the Tilt Angle of the Camera

To evaluate the effect of camera tilt angle on the proposed algorithm, three group tests were conducted in the experiment. In each group, from −15° to 15° at intervals of 5°, an image was randomly selected for testing (−15°, −10°, −5°, 0°, 5°, 10°, and 15°, 7 × 3 = 21 images in total). Two metrics, recall and precision, were adopted to evaluate the performance, the definition of recall and precision are shown in Equations (8) and (9).
Figure 24 shows the precision of the proposed algorithm at each tilt angle of the camera. Although the precision decreased with the tilt angle increase, the decrease was not significant, and the mean precision was as high as 87.1%. The analysis found that two reasons may have led to the mentioned phenomenon: (1) only when the distance between the front cluster and covered clusters was small, would the depth difference caused by the camera tilt have made it possible to identify the occluded cluster region as the front cluster, as shown in Figure 23c; (2) based on the shape characteristic of the grape cluster and the rule of seed point selection, the seed point was usually located in the middle region zone of the cluster, which could weaken the size of the depth difference to a certain extent.
Figure 25 shows the recall of the proposed algorithm at each tilt angle of the camera. The average recall was 85.6%. Although there was no obvious rule from the test results of each group, it could be seen from the mean curve that when the angle was 0°, the highest recall could be obtained. Additionally, with the increase in tilt angle in a positive or negative direction, the recall decreased. The main reason for the decrease in recall was that when the tilt angle was large enough, the upper or lower region of the front cluster was easily lost, as shown in Figure 23d, which affected the recall and caused a decrease in precision.

4.2.4. The Performance of Extracting the Front Grape Cluster

Table 3 demonstrates the performance of some other studies on fruit segmentation. The research in [11,12] is related to the segmentation of overlapping grapes under the natural environment. The proposed method is also applicable to the datasets adopted in these two articles. The research in [11] proposed a simple algorithm to segment the overlapping clusters with a recall of 88.7%, but it could not extract the fine contours. The method proposed in the literature [12] produced an accurate contour of the front grape and achieved a slightly better performance than that obtained in our case; however, its calculation process was more complex than that of the method proposed in our research and literature [11], which would inevitably lead to huge consumption of computing resources. Furthermore, the proposed method could not only deal with the overlap of two clusters of grapes but could also achieve a satisfactory performance in the case of the overlapping of multiple clusters of grapes (as shown in Figure 23b), which has obvious advantages compared with the method proposed in the literature [11,12]. In addition, references [27,28,29] contain the method used on apples and blueberries for multiple fruit segmentation and it achieved good segmentation performance. The algorithm was proposed for grapes that are cultivated on trellises, and the effect on the fruits of other varieties remains to be verified. These methods could only segment the overlapping fruits (instance segmentation) and could not indicate the front fruits (which were easily picked by the robot). However, using such an instance segmentation method to obtain the individual fruit first, and further using depth information, we may be able to find a simpler method to achieve our research objectives, which is worthy of further study. In addition, the authors of [28] carried out research on the maturity of blueberries, which also provides an important reference for our future research.

5. Conclusions and Future Work

Accurate recognition of grape clusters, especially the extraction the front grape cluster of overlapping clusters, is the key technology of the grape picking robot. This study focused on the segmentation of overlapping grape clusters based on depth information. When the tilt angle of the camera was 0°, the proposed method could achieve an average precision of 87.1% and recall of 85.6%. Furthermore, even when the camera was tilted with a angle of −15°, the proposed method could still obtain a similar performance. The experiment results indicated the proposed approach could effectively extract the front cluster of overlapping clusters.
However, grape clusters have characteristics such as softness, irregular shape, and ease of injury, which preclude the end effector from grasping the fruit directly and implementing twisting, pulling, or other picking methods. For the harvesting of grapes, grasping and cutting the peduncle of the grape may be a more suitable method. Therefore, it is not enough to only segment the grape clusters, but the corresponding cutting point on the peduncle also needs to be further recognized and located on each cluster. In the future, work will be focused on the detection and location of the peduncle and its cutting point, especially the utilization of depth information is to be explored. In addition, compared with the RealSense D435, an IMU unit could be added to D435i, which could obtain the pose of the camera. Based on the transformation relationship between the current pose and optimal pose of the camera, the sourced and captured data could be reconstructed as the data when the camera is not tilted. Combined with the reconstructed data and the proposed method, we believe the performance could be further improved. In addition, the use of more information such as depth information, rather than just using RGB information to train the DeepLabV3+ model, may further improve the segmentation performance, which also requires further research to confirm it.

Author Contributions

Conceptualization, Y.P. and J.L.; methodology, Y.P. and S.Z.; software, Y.P.; writing—original draft preparation, Y.P.; writing—review and editing, Y.P.; supervision, J.L.; funding acquisition, J.L. All authors have read and agreed to the published version of the manuscript.

Funding

The research was funded by grants from the National Science Foundation of China (Grant No. 31971795), A Project Funded by the Priority Academic Program Development of Jiangsu Higher Education Institutions (No. PAPD-2018-87), Project of Faculty of Agricultural Equipment of Jiangsu University (4111680002), and Project of CCIT Key Laboratory of Industrial IoT (No. KYPT201803Z).

Conflicts of Interest

The authors declare no conflict of interest.

References

  1. Chamelat, R.; Rosso, E.; Choksuriwong, A.; Rosenberger, C.; Laurent, H.; Bro, P. Grape detection by image processing. In Proceedings of the IECON 2006—32nd Annual Conference on IEEE Industrial Electronics, Paris, France, 6–10 November 2006; pp. 3697–3702. [Google Scholar]
  2. Reis, M.J.; Morais, R.; Peres, E.; Pereira, C.; Contente, O.; Soares, S.; Valente, A.; Baptista, J.; Ferreira, P.J.S.; Cruz, J.B. Automatic detection of bunches of grapes in natural environment from color images. J. Appl. Log. 2012, 10, 285–290. [Google Scholar] [CrossRef] [Green Version]
  3. Śkrabánek, P. DeepGrapes: Precise Detection of Grapes in Low-resolution Images. IFAC PapersOnLine 2018, 51, 185–189. [Google Scholar] [CrossRef]
  4. Liu, S.; Whitty, M. Automatic grape bunch detection in vineyards with an SVM classifier. J. Appl. Log. 2015, 13, 643–653. [Google Scholar] [CrossRef]
  5. Luo, L.; Zou, X.; Yang, Z.; Li, G.; Song, X.; Zhang, C. Grape image fast segmentation based on improved artificial bee colony and fuzzy clustering. Trans. CSAM 2015, 46, 23–28. [Google Scholar]
  6. Chinchuluun, R.; Lee, W.S. Citrus yield mapping system in natural outdoor scenes using the watershed transform. In Proceedings of the 2006 ASAE Annual Meeting, Boston, MA, USA, 19–22 August 2006. [Google Scholar]
  7. Rizon, M.; Yusri, N.A.N.; Kadir, M.F.A.; bin Mamat, A.R.; Abd Aziz, A.Z.; Nanaa, K. Determination of mango fruit from binary image using randomized Hough transform. In Proceedings of the Eighth International Conference on Machine Vision (ICMV 2015), Barcelona, Spain, 19–21 November 2015; p. 987503. [Google Scholar]
  8. Peng, H.; Wu, P.; Zhai, R.; Liu, S.; Wu, L.; Jing, X. Image segmentation algorithm for overlapping fruits based on disparity map. Trans. Chin. Soc. Agric. Mach. 2012, 43, 167–173. [Google Scholar]
  9. Song, H.; Zhang, C.; Pan, J.; Yin, X.; Zhuang, Y. Segmentation and reconstruction of overlappedapple images based on convex hull. Trans. Chin. Soc. Agric. Eng. 2013, 29, 163–168. [Google Scholar]
  10. Lu, J.; Sang, N. Detecting citrus fruits and occlusion recovery under natural illumination conditions. Comput. Electron. Agric. 2015, 110, 121–130. [Google Scholar] [CrossRef]
  11. Luo, L.; Tang, Y.; Lu, Q.; Chen, X.; Zhang, P.; Zou, X. A vision methodology for harvesting robot to detect cutting points on peduncles of double overlapping grape clusters in a vineyard. Comput. Ind. 2018, 99, 130–139. [Google Scholar] [CrossRef]
  12. Liu Ping, Z.Y.; Zhang, T.; Hou, J. Algorithm for recognition and image segmentation of overlapping grape cluster in natural environment. Trans. Chin. Soc. Agric. Eng. 2020, 36, 161–169. [Google Scholar]
  13. Lottes, P.; Behley, J.; Milioto, A.; Stachniss, C. Fully convolutional networks with sequential information for robust crop and weed detection in precision farming. IEEE Robot. Autom. Lett. 2018, 3, 2870–2877. [Google Scholar] [CrossRef] [Green Version]
  14. Koirala, A.; Walsh, K.; Wang, Z.; McCarthy, C. Deep learning for real-time fruit detection and orchard fruit load estimation: Benchmarking of ‘MangoYOLO’. Precis. Agric. 2019, 20, 1107–1135. [Google Scholar] [CrossRef]
  15. Xu, Z.-F.; Jia, R.-S.; Sun, H.-M.; Liu, Q.-M.; Cui, Z. Light-YOLOv3: Fast method for detecting green mangoes in complex scenes using picking robots. Appl. Intell. 2020, 50, 4670–4687. [Google Scholar] [CrossRef]
  16. Yu, Y.; Zhang, K.; Liu, H.; Yang, L.; Zhang, D. Real-time visual localization of the picking points for a ridge-planting strawberry harvesting robot. IEEE Access 2020, 8, 116556–116568. [Google Scholar] [CrossRef]
  17. Kuznetsova, A.; Maleva, T.; Soloviev, V. Using YOLOv3 algorithm with pre-and post-processing for apple detection in fruit-harvesting robot. Agronomy 2020, 10, 1016. [Google Scholar] [CrossRef]
  18. Peng, H.; Xue, C.; Shao, Y.; Chen, K.; Xiong, J.; Xie, Z.; Zhang, L. Semantic Segmentation of Litchi Branches Using DeepLabV3+ Model. IEEE Access 2020, 8, 164546–164555. [Google Scholar] [CrossRef]
  19. Zhang, D.; Ding, Y.; Chen, P.; Zhang, X.; Pan, Z.; Liang, D. Automatic extraction of wheat lodging area based on transfer learning method and deeplabv3+ network. Comput. Electron. Agric. 2020, 179, 105845. [Google Scholar] [CrossRef]
  20. Sharifzadeh, S.; Tata, J.; Sharifzadeh, H.; Tan, B. Farm Area Segmentation in Satellite Images Using DeepLabv3+ Neural Networks. In Proceedings of the International Conference on Data Management Technologies and Applications, Prague, Czech Republic, 26–28 July 2019; pp. 115–135. [Google Scholar]
  21. Chen, L.-C.; Zhu, Y.; Papandreou, G.; Schroff, F.; Adam, H. Encoder-decoder with atrous separable convolution for semantic image segmentation. In Proceedings of the European Conference on Computer Vision (ECCV), Munich, Germany, 8–14 September 2018; pp. 801–818. [Google Scholar]
  22. Azad, R.; Asadi-Aghbolaghi, M.; Fathy, M.; Escalera, S. Attention deeplabv3+: Multi-level context attention mechanism for skin lesion segmentation. In Proceedings of the European Conference on Computer Vision, Glasgow, UK, 23–28 August 2020; pp. 251–266. [Google Scholar]
  23. Wu, H.; Yao, L.; Xu, Z.; Li, Y.; Ao, X.; Chen, Q.; Li, Z.; Meng, B. Road pothole extraction and safety evaluation by integration of point cloud and images derived from mobile mapping sensors. Adv. Eng. Inform. 2019, 42, 100936. [Google Scholar] [CrossRef]
  24. Wang, A.; Xu, Y.; Wei, X.; Cui, B. Semantic segmentation of crop and weed using an encoder-decoder network and image enhancement method under uncontrolled outdoor illumination. IEEE Access 2020, 8, 81724–81734. [Google Scholar] [CrossRef]
  25. Manzo, M.; Pellino, S. Fighting together against the pandemic: Learning multiple models on tomography images for COVID-19 diagnosis. AI 2021, 2, 261–273. [Google Scholar] [CrossRef]
  26. Peng, Y.; Wang, A.; Liu, J.; Faheem, M. A Comparative Study of Semantic Segmentation Models for Identification of Grape with Different Varieties. Agriculture 2021, 11, 997. [Google Scholar] [CrossRef]
  27. Wang, D.; Xu, Y.; Song, H.; He, D.; Zhang, H. Fusion of K-means and Ncut algorithm to realize segmentation and reconstruction of two overlapped apples without blocking by branches and leaves. Trans. Chin. Soc. Agric. Eng. 2015, 31, 227–234. [Google Scholar]
  28. Ni, X.; Li, C.; Jiang, H.; Takeda, F. Deep learning image segmentation and extraction of blueberry fruit traits associated with harvestability and yield. Horticult. Res. 2020, 7, 1–14. [Google Scholar] [CrossRef] [PubMed]
  29. Kang, H.; Chen, C. Fruit detection, segmentation and 3D visualisation of environments in apple orchards. Comput. Electron. Agric. 2020, 171, 105302. [Google Scholar] [CrossRef] [Green Version]
Figure 1. Trellis cultivation environment of grapes. (a) The front view of the overlapping grape clusters, and (b) the grape cultivation environment.
Electronics 10 02813 g001
Figure 2. The side view of the overlapping grape clusters.
Electronics 10 02813 g002
Figure 3. The steps of the proposed depth region method. (a) The overlapping grape clusters, (b) the seed point, (c) region growing, and (d) the extracted front cluster.
Electronics 10 02813 g003
Figure 4. The sketch of the proposed method.
Electronics 10 02813 g004
Figure 5. The structure of the DeepLabV3+ network.
Electronics 10 02813 g005
Figure 6. Annotated images and original images in the dataset.
Electronics 10 02813 g006
Figure 7. Accuracy and loss curves obtained on the training dataset. (a) The accuracy curve, and (b) the loss curve.
Electronics 10 02813 g007
Figure 8. The input image and output image of DeepLabV3+. (a) The input image, and (b) the output image of the network.
Electronics 10 02813 g008
Figure 9. The preprocessing of the original depth image. (a) Original depth data, and (b) the preprocessed depth data.
Electronics 10 02813 g009
Figure 10. The selection of the seed point.
Electronics 10 02813 g010
Figure 11. The diameter of the randomly selected grape clusters.
Electronics 10 02813 g011
Figure 12. Different camera tilt angles for the white wall depth map. (a) The optical axis is perpendicular to the wall. (b) The optical axis is not perpendicular to the wall.
Electronics 10 02813 g012
Figure 13. The meaning of depth value of the RealSense D435.
Electronics 10 02813 g013
Figure 14. Relationship between depth value and camera tilt angle. (a) No depth difference occurred, and (b) depth difference occurred.
Electronics 10 02813 g014
Figure 15. The length of the randomly selected grape clusters.
Electronics 10 02813 g015
Figure 16. Extraction of the front grape cluster. (a) Front cluster with holes, and (b) the front cluster with no holes.
Electronics 10 02813 g016
Figure 17. The contour of the front cluster. (a) Contour of the front cluster, and (b) contour of front cluster in RGB image.
Electronics 10 02813 g017
Figure 18. Instruments and equipment used for image capture. (a) RealSense D435, and (b) XSENS MTi-300.
Electronics 10 02813 g018
Figure 19. Images captured with different camera tilt angles.
Electronics 10 02813 g019
Figure 20. The meaning of the IoU metric.
Electronics 10 02813 g020
Figure 21. F1 score on the ROC plot.
Electronics 10 02813 g021
Figure 22. Recall and precision of test samples.
Electronics 10 02813 g022
Figure 23. Example of segmentation result of overlapping grape clusters. (a,b) The successful examples, and (c,d) the failed examples.
Electronics 10 02813 g023
Figure 24. Precision of test samples with different tilt angles.
Electronics 10 02813 g024
Figure 25. Recall of test samples with different tilt angle.
Electronics 10 02813 g025
Table 1. Training parameters of DeepLabV3+.
ParametersValue
BackboneXception
Initial learning rate0.004
Learning power0.9
Epoch50
Weight decay0.00004
momentum0.9
Table 2. Segmentation performance of DeepLabV3+.
IoU (%)Mean Time (ms)
97.3298
Table 3. Some other studies on fruit segmentation.
No.ReferenceDatasetFruit TypePerformance
1Luo et al. [11]30 images containing double overlapping grape clusters.GrapeRecall: 88.7%
2Liu et al. [12]22 images (11 target grapes on the left and 11 on the right) captured from a vineyard.GrapeRecall: 89.71%
3Wang et al. [27]20 double overlapping apple images.AppleRecall: 96.08%
4Ni et al. [28]724 blueberry images captured under different background conditions.BlueberryMask accuracy: 90.04%
5Kang et al. [29]400 RGB-D images and 800 RGB images captured in an apple orchard.AppleRecall: 86.8%
6The proposed method-GrapeRecall: 89.2%
Publisher’s Note: MDPI stays neutral with regard to jurisdictional claims in published maps and institutional affiliations.

