Article

Estimation of Tire Mileage and Wear Using Measurement Data

1
Ph.D. Program of Electrical and Communications Engineering, Feng-Chia University, Taichung 40724, Taiwan
2
Automotive Research and Testing Center, Changhua 50544, Taiwan
3
Department of Electronic Engineering, Feng-Chia University, Taichung 40724, Taiwan
4
Kenda Tire Taiwan, Changhua 51064, Taiwan
*
Author to whom correspondence should be addressed.
Electronics 2021, 10(20), 2531; https://doi.org/10.3390/electronics10202531
Submission received: 21 August 2021 / Revised: 14 October 2021 / Accepted: 14 October 2021 / Published: 17 October 2021
(This article belongs to the Special Issue Automotive Electronics)

Abstract

:
Tire mileage and wear provide important information for vehicle applications. There are more and more studies discussing intelligent tires, but few focus on the role of tire mileage and wear. The conventional tire pressure monitoring system (TPMS) is one of the intelligent tire applications, but there has been no significant advancement in recent years in this regard. In order to increase the additional functions of intelligent tire applications, we propose a method that estimates the mileage and wear information of tires. The proposed method uses a three-axis sensor and a Hall sensor to implement the function. The proposed method also has a low power design to reduce the power consumption of the Hall sensor. The experimental results show the trend of tire wear status, rendering this method effective. This method also requires more accurate mileage information to support tire wear estimation. This experiment found that the correct rate of the proposed mileage estimation method is 99.4% and provides sufficient and correct mileage information for tire wear methods. If this method is used in autonomous vehicle applications, the autonomous control strategy algorithm has more conditions to plan the control strategy. The strategy system processes more meticulous control that increases the safety of autonomous vehicles.

1. Introduction

Vehicles are important tools in everyday life. More and more vehicle applications are developing, such as autonomous vehicles. Safety is important for vehicle applications and this issue is continuously being discussed. There are some elements that affect the safety of vehicles, tires being one of them. The vehicle works with tires that contact the road surface. These contact points provide some useful information from the road. Using the information to improve driving safety is not an easy task, which is why there are more and more studies focused on intelligent tires.
Some researchers provide methods that monitor the tire status. The (TPMS) [1,2,3,4,5] is one of intelligent tire applications that has emerged in recent years. It is a common device for vehicle applications that provides tire pressure and temperature information to drivers. The TPMS alarm indicates that there are some problems with tire pressure or temperature. This warning message helps the driver or user to pay attention to the problematic tire. This kind of intelligent tire application has matured in recent years, and we discuss in this paper means to enhance its function.
The tire has some deformations when used on the road. The deformations provide some messages about the tire status. Some research uses a Hall sensor to detect tire deformation [6]. The sensor responds to different voltage values when the field changes. Researchers use the different magnetic fields to detect tire deformation. This method is complicated to implement because it needs an advanced semiconductor and tire process, but provides a suitable foundation for intelligent tires in the future. In this paper, the tire wear estimation method uses a Hall sensor to estimate the tire wear status and it has some differences from the above method. The integrated design makes the implementation easy, because the Hall sensor does not integrate with the tire rubber.
A strain gauge is used in the method [7]. The method can effectively reduce costs, but the reliability is relatively not strong enough. A strain gauge is easy to damage when the structure is used for long period because the material is broken easily by long-term vibrations. Given this lack of durability, there are few applications in the market. Because the structure is easy to apply in experiments, we used a similar structure for our experiment and propose an improved structure to solve the durability issues.
A three-axis sensor is a sensing element often used in intelligent tires. There are many studies that use three-axis sensors. Some works are based on the sensor to develop applications such as tire pressure, tire load, and vehicle tracking [8,9,10]. The road surface is one of the conditions of the vehicle application. There is research that uses a three-axis sensor to detect the road surface status for the application [11], employing an ANN (Artificial Neural Network) to implement the method. These studies have proposed many effective and reference methods, but they rarely discuss the relationship between mileage and wear. In this paper, we focus on the relationship between mileage and wear.
Some studies analyze tire wear in intelligent tire applications, using optics sensors to estimate wear [12,13]. Image recognition is the main method of this technology. One group of researchers used the camera to catch image information and a computer to execute an image recognition algorithm [14]. Optics sensors are key, but they are costly. Moreover, the method needs a lot of calculations, which means more hardware performance and resources. How and where to install the sensors are issues, too. Another aim of this paper is to solve the cost and integration issues with some easy-to-use sensors.
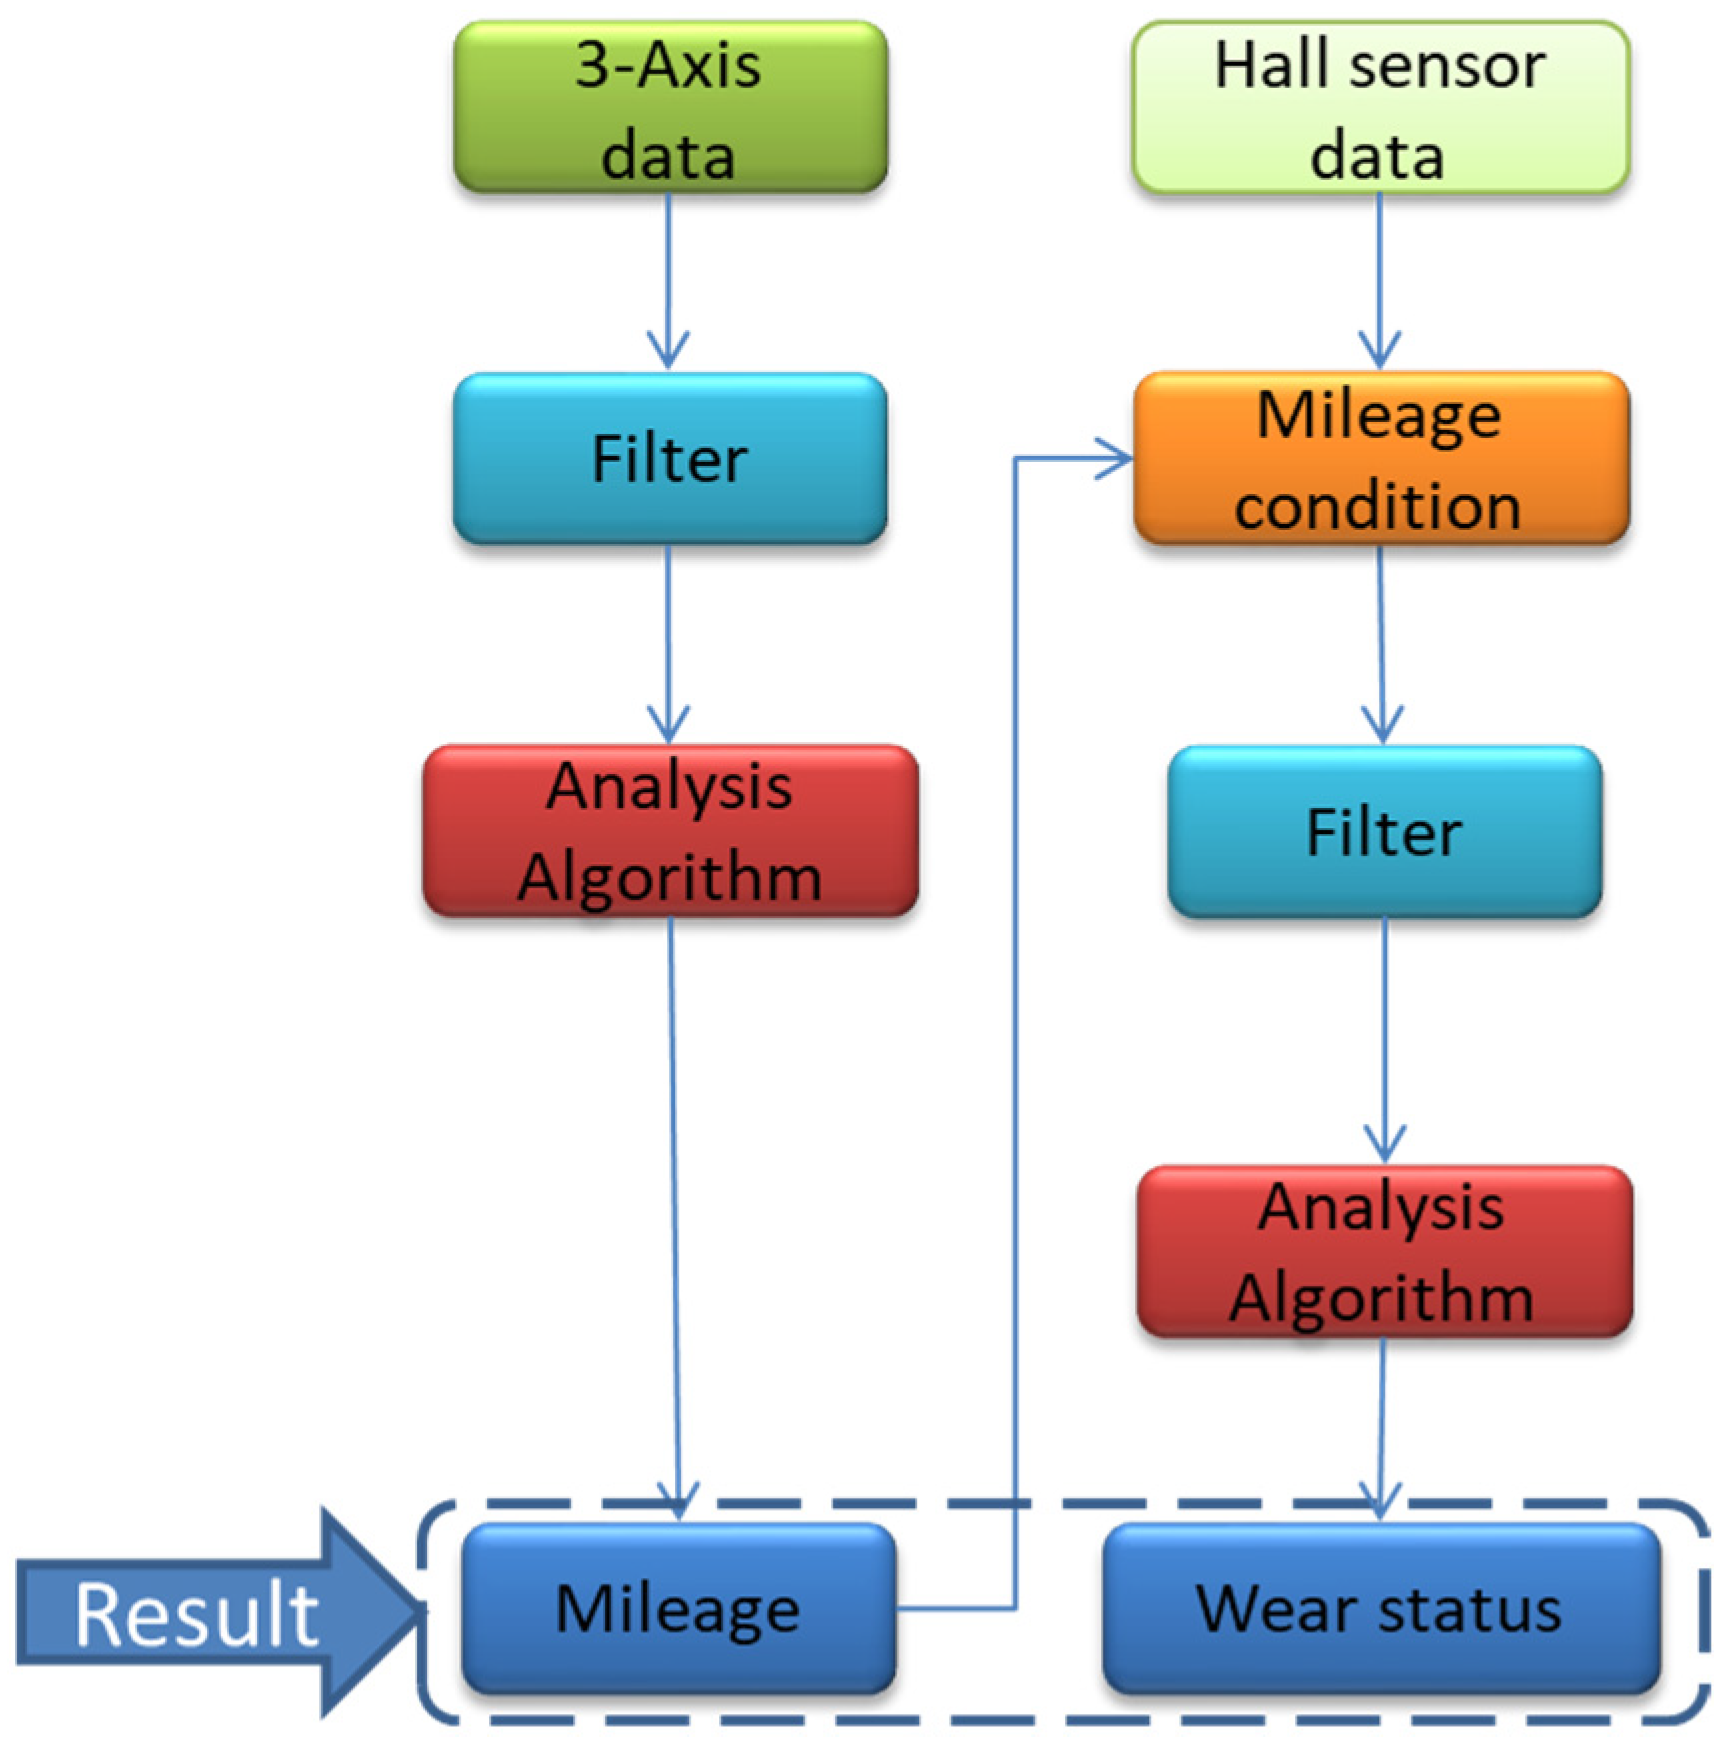
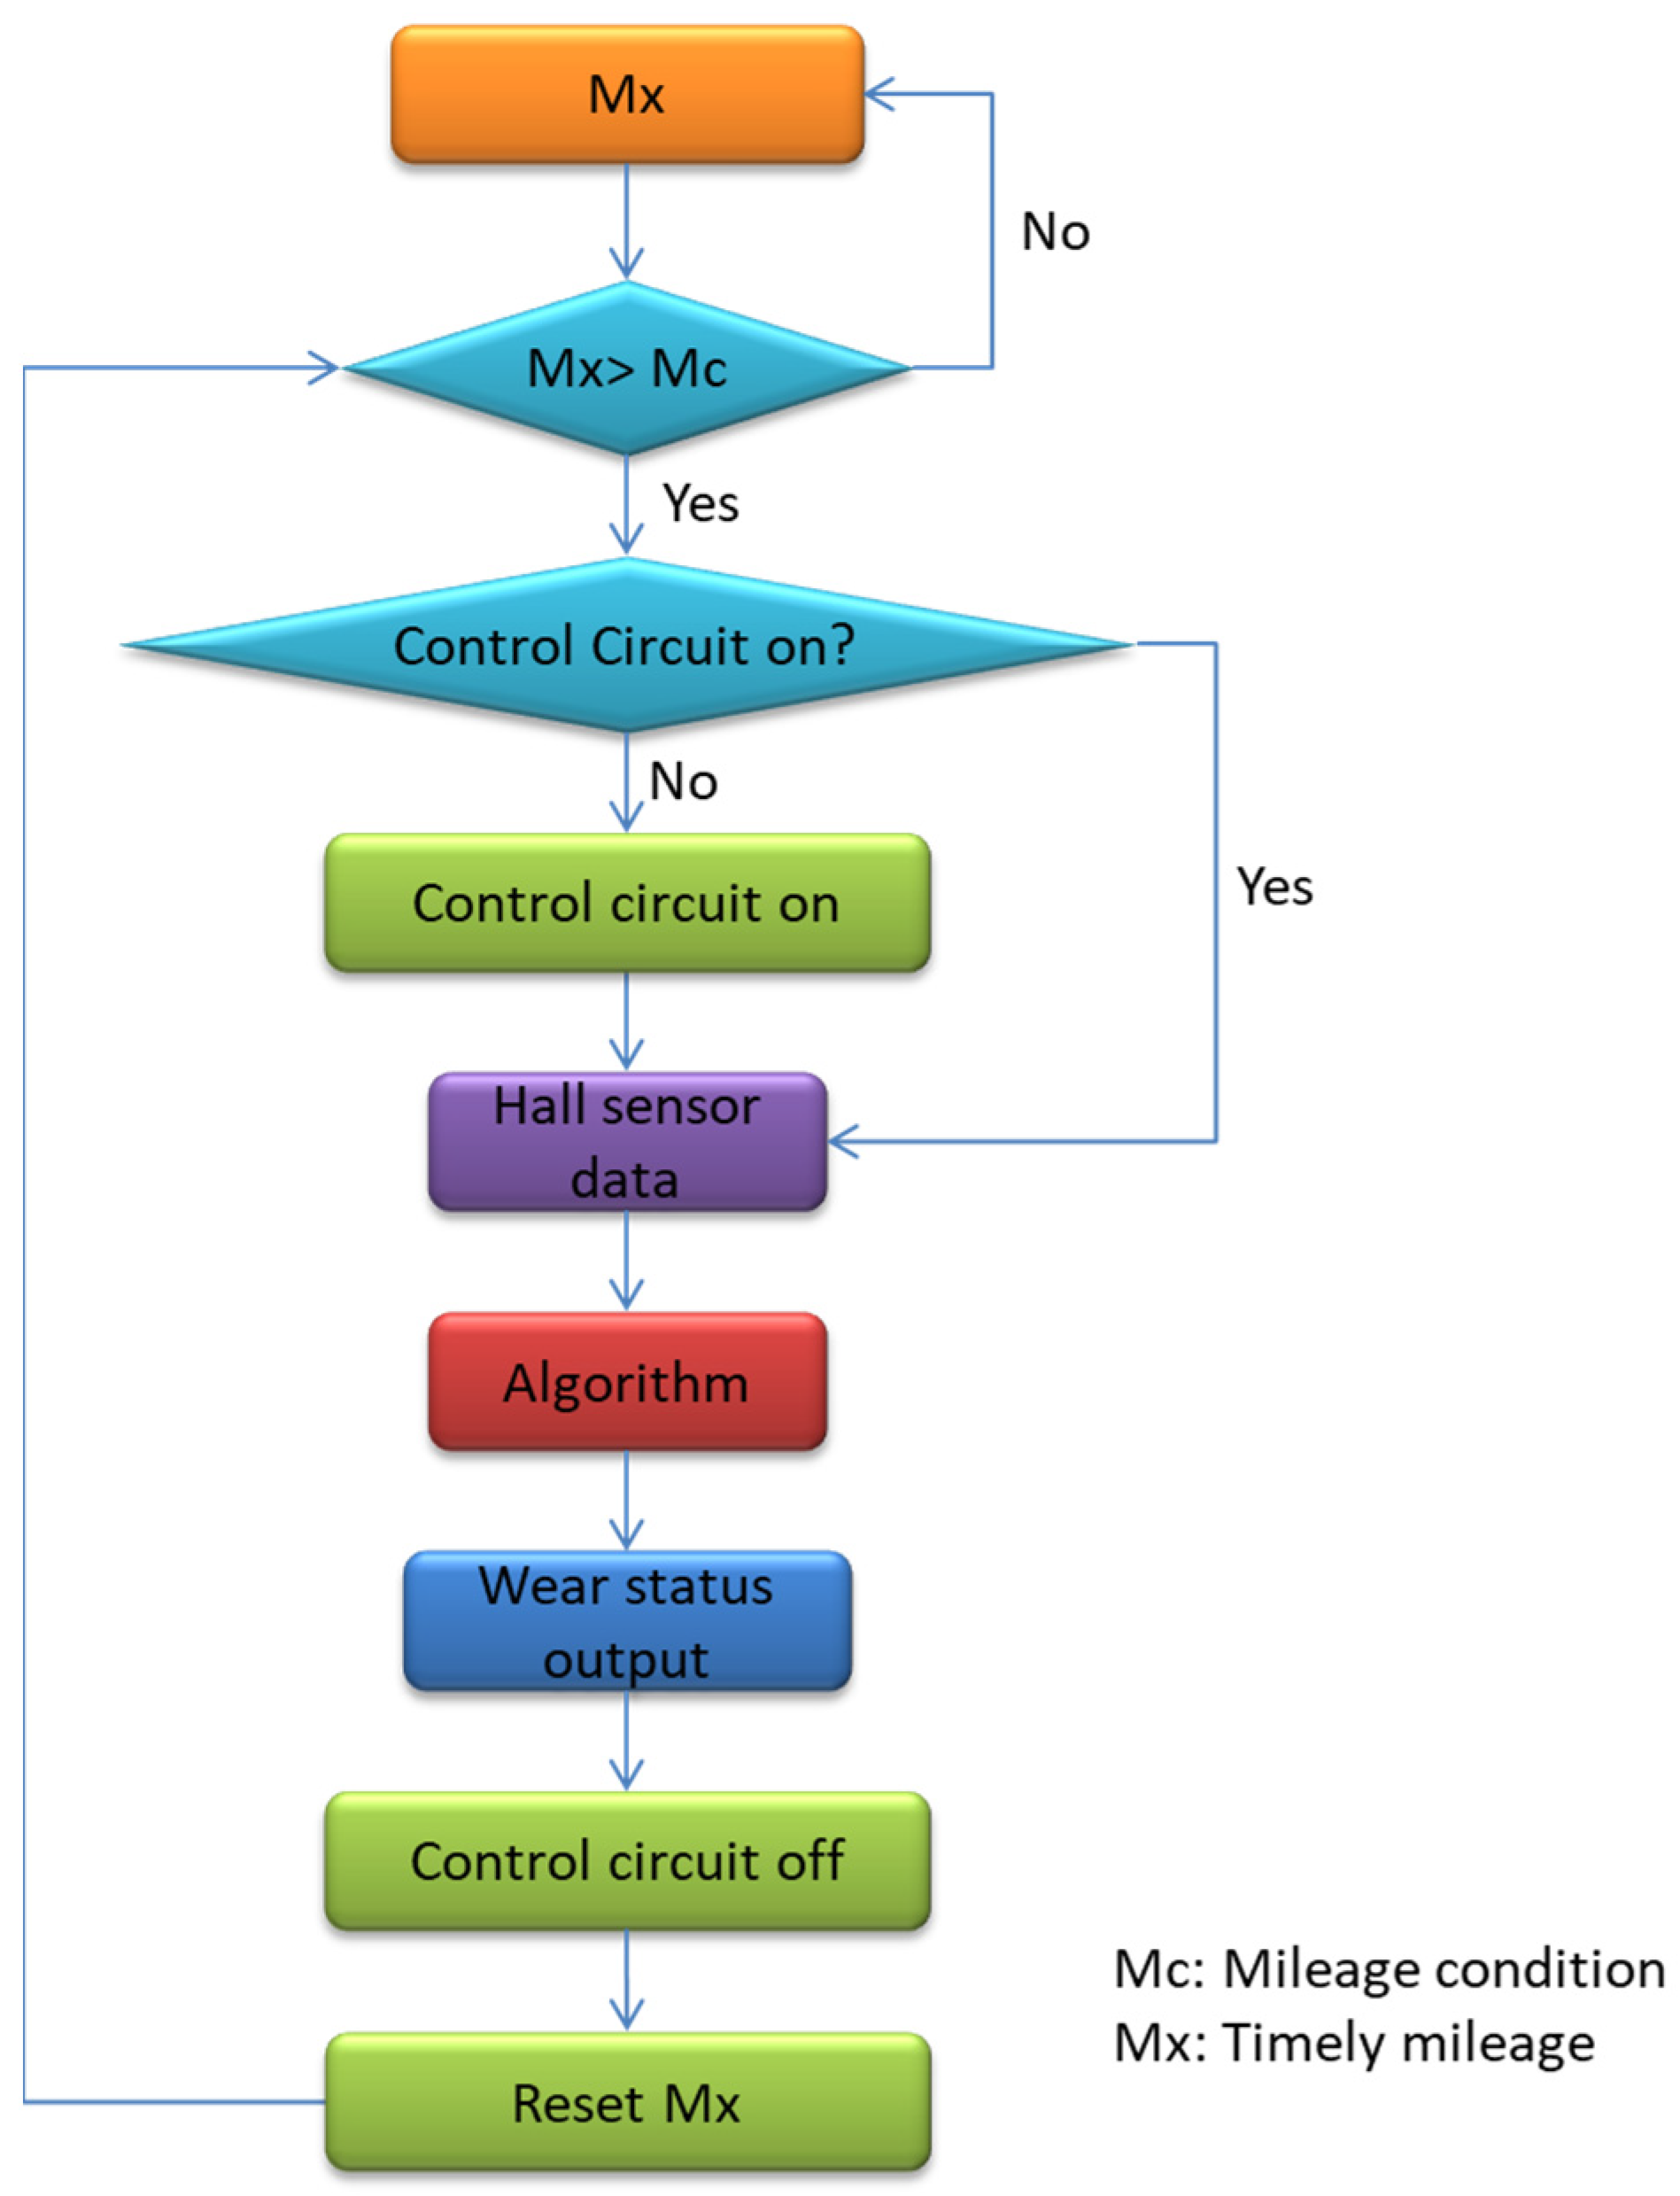
In our research, we propose a method to estimate the tire mileage and wear. Our method integrates a Hall sensor and a three-axis sensor. The integration solution takes some information that the algorithm needs. The tire lifecycle relates to the mileage and wear, and we dissect the relationship between mileage and wear. The method also considers the power consumption that the algorithm does not execute all the time. A process controls the execution time and considers the algorithm operation time to reduce the power consumption. With this procedure, the method resembles real-world conditions. Finally, we verified the system in an experiment using different conditions to confirm the algorithm.
This paper consists of five total sections. Section 2 describes the framework and method. The method includes a procedure and algorithm. Section 3 presents the verification results. The final section reports the conclusions and evolution plan.

2. Framework and Methods

2.1. System Prototype

The concept of the tire pressure monitoring system is to collect tire information and analyze data from the tire. We propose a framework to improve the method. The framework is described in this section and the method is based on a wireless communication structure. There are two parts of the framework, sensors inside and outside the tire. Figure 1 shows the system architecture of the framework. The elements include a three-axis sensor, a Hall sensor, and a wireless communication device that is installed in the tire. The method needs a laptop to connect the wireless communication device. The laptop collects data from the in-tire sensors. The data collection and analysis platform are shown on the right side of Figure 1. The laptop provides all of the data collection, analysis, and algorithm implementation.
The three-axis sensor and Hall sensor integrate with a PCB. A lithium-ion (Li-On) battery is the power source that ensures the provision of tire data during the experiment. The Li-On battery is a temporary power source that is just for the experiments but not for production. Regarding the production and application, the method designs a process to reduce power consumption. We discuss the process in the next section. The wireless transmitter module sends data to the receiver. The tested tire is shown in Figure 2. The figure shows the result of the final system integration, which we describe in detail below.
Figure 2 shows the sensor in the tire. The sensor signal is output by a wire. The wire runs through the wheel rim and connects to the RF transmission interface. The sensor is placed on an FPC which is fixed to the tire by pasting. The FPC with a three-axis sensor is installed on the tire surface inside the wheel. This type of fixing method is only for the experiments. There was a problem in the FPC reliability that required us to redesign the installation method. The new design integrates all sensors in a circuit. An integration device fixes the tire, and the Hall sensor is closest to the tire surface. This design ensures the Hall sensor can measure the maximum magnetic field value.

2.2. Method

Each tire has a wear coefficient that can be referenced, but it is not accurate because different users and usage conditions cause differences in wear. We discuss the method of estimating tire mileage and wear in this section. The data collection device can provide a lot of information to implement this request. The method flow chart is shown in Figure 3. All of the measured data need a filter to filter the signal noises in this flow. The mileage and wear estimation algorithms calculate the results based on the information from the filter. There are some differences in implementing the method in mileage and wear, particularly the operation time. The wear estimation algorithm is not always executed because the tire wear out is not quick. The wear information is collected based on reference mileage information in this method. The mileage information is a trigger signal that tells the system to execute the wear estimation procedure. The Hall sensor needs more power for the collection of data. If the Hall sensor continues working, this will increase power consumption. With our proposed process, the algorithm is not executed often, as the tire wear out is not quick. There are also some advantages to the system’s performance and power consumption. We discuss the detailed control flow in the next section.
Mileage estimation is different from wear estimation, as it needs real-time data. The three-axis sensor provides data that the mileage estimation algorithm needs, but it cannot be used directly. The data need filters to ensure continuity and correctness. The algorithm uses the data to calculate the result. There are some disadvantages to using the filter. The filter needs some process resource support. Based on this reason, the method does not calculate the result at the edge. The result of mileage estimation is produced after calculation by the algorithm, and the wear estimation algorithm result is referenced.

2.2.1. Wear Estimation Method Design

For our experiment, we obtained a tire from a manufacturer that used carbon nanotubes (CNTs) to establish magnetic properties. The production process and material properties to make carbon nanotubes magnetic are not discussed here. The magnetic field relates to tire wear. The tire has a higher magnetic field value when it is new. On the contrary, lower magnetic field values demonstrate tire wear. Figure 4 describes the expected state of the new and used tires. The difference between the new and the used tire is noticeable in the tire block thickness. The “A” thickness is larger than the “B” thickness. This shows that the new tire magnetic values are larger than those of the used tire. The Hall sensor provides the magnetic field information. If the tires have different wear conditions, the sensor provides different magnetic field values. This phenomenon can indicate tire wear. We used these properties to implement the application.
The wear estimation algorithm references some characteristics of the tire through the magnetic field. The manufacturer provides a tire spec that denotes the relationship between wear and magnetic field. Figure 5a shows the curve of the related wear status and the magnetic field value. The method defines some segments to present tire wear status, as shown in Figure 5b. The tire spec denotes the effective block thickness as 6 mm. There are six statuses that are defined for this application and each status presents with a 1 mm thickness.
Although the manufacturer can provide information on the strength of the magnetic force of a tire so that we can judge the tire wear, such experiments are time consuming. Our method entails a strategy that can reduce the time for such experiments. Using the whole tire to perform the experiment takes a lot of time, but our method uses a tire slice to verify the magnetic force trend. The wear results are verified based on the tire slice. This slice can provide a simulation environment, as shown in Figure 6. The tire slice is cut from part of the tire surface. This space is the verification area.
Magnets can be a source of magnetic fields, but our method does not use them. Different types of magnets have different magnetic fields. We tried many types of magnets for the experiment and found that the magnetic value cannot be used because although some magnets can provide a strong magnetic value, they must be installed by the manufacturer. On the other hand, some types of magnets cannot provide large enough magnetic fields for the Hall sensor to detect, because the tire has a wiring layer that can shield some magnetic forces. For our experiment, the tire manufacture prepared a tire slice with a magnetic field that resembles real-world conditions. We used the tire slice to verify the magnetic force change trend, checking the different thicknesses of the tire rubber with different magnetic fields. The tire slice was cut into six pieces, each piece having a different thickness. Figure 7a shows the six tire pieces. The different tire pieces have different magnetic fields. We checked the magnetic field with the Hall sensor. Each tire slice measured by the Hall sensor is shown in Figure 7b. The distance “D” between the Hall sensor and every tire piece is the same. The results can help us to understand the different magnetic fields of tire slices with different thicknesses.
The strategy used a rubber piece with a magnet to simulate the magnetic field. The rubber was put in the same position as the tire slice. Figure 8 shows the method of measuring the magnetic field. The rubber was then put onto the tire slice. The method used rubber slices with different thicknesses to generate different magnetic fields. The Hall sensor can obtain different values according to the different magnetic forces. The thickness of T1 was larger than T2. The strategy delivered two results. First, the method verified the magnetic field trend without the tire slices to ensure that the rubber pieces had a magnetic field and that the trend was related to the thickness. Second, the method verified the magnetic field trend with the tire slice. The magnetic field was affected by the medium, as expected, because the tire slice has a steel belt layer. Some degree of the magnetic field is masked by the steel belt layer, which reduces the magnetic field strength. Therefore, the value of the magnetic field sensed by the Hall sensor will decrease; this is also predictable. We discuss the results in the next section.
We designed a control circuit to control the Hall sensor power source to reduce the power consumption of the system. This control circuit always cuts off the power source. The Hall sensor does not work when the condition is not satisfied with the trigger value. Figure 9 shows the process flow. The mileage information is the trigger condition of the process. Different mileage conditions can be set. The process is executed every 1000 km when the mileage condition (Mc) is set to 1000 km. The Mc is reset after the process outputs the wear result. The Hall sensor circuit will be not executed before the next condition is satisfied. This process can effectively reduce power consumption.

2.2.2. Wear Estimation Algorithm Design

The final result presents the measured value as voltage. This result maps the spec, which uses magnetic flux density to present tire tread depth. Equation (1) is the spec provided by the sensor vendor, where Vout is the result voltage, VQ is typically half of the application voltage, B is the applied magnetic field density, “Sensitivity” depends on the device option and application voltage, Src is typically 0.12% for device options, and Ta is the ambient temperature. This system is working in 3.3V and according to the device, the “Sensitivity” value is 15. Equation (2) uses the results of Equation (1) and the spec to convert the voltage range.
V o u t = V Q + B ( S e n s i t i v i t y ( 1 + S r c ( T a 25 ° C ) ) )
V o u t = 1.65 + 15 B
The resulting value of Equation (2) can convert the magnetic flux density value to voltage. There are six statuses that our method defined. Each status must have an upper and lower boundary. The magnetic flux density range splits according to the provided specifications. Equation (3) presents each voltage gap of a status, where Vg is the voltage gap, Vout(max) is the maximum magnetic flux density, and Vout(min) is the smallest magnetic flux density.
V g = ( V o u t ( m a x ) + V o u t ( m i n ) ) 6
Each boundary is presented by Equations (4) and (5), where Vs(max) is the maximum value of the state, Vs(min) is the minimum value of the state, Vout(max) is map the maximum magnetic flux density, Vout(min) is map the smallest magnetic flux density, Vg is the voltage gap of each state, and S is status between 0 to 5.
V s ( m a x ) = V o u t ( m a x ) V g ( 5 S )
V s ( m i n ) = V o u t ( m i n ) + V g S

2.2.3. Mileage Estimation Method Design

The second part of the method is the mileage estimate. The method uses a three-axis sensor that provides data in three directions: longitudinal, radial, and axial. The information from the three-axis sensor is the tire movement direction. The mileage estimation method uses the information and develops a method to analyze tire behavior. Figure 10 shows the information that the method catches from the tire through the three-axis sensor.
Figure 11 shows the flow for mileage estimation. The three-axis sensor provides the tire motion information to the collection system. The algorithm cannot directly use the information because the information includes noises. A filter is a necessary solution to field some noises. The filter that the method uses is IIR (Infinite Impulse Response). All three-axis information through the filter is provided to the algorithm. Through the filter, the algorithm can find the peak values of the three directions more easily. The peak value from the longitudinal direction provides two kinds of information, which are mileage and speed. The number of tire revolutions multiplied by the tire perimeter is the mileage, because the mileage information relates to the tire perimeter. Speed information is detected through the time gap of longitudinal information. The time gap is from the two peaks of the longitudinal value. We explain the detailed algorithm in the next section.

2.2.4. Mileage Estimation Algorithm Design

Longitudinal and radial function are the method conditions that the method references. There are two parts to the method, one is estimating the tire mileage and the other is verifying the mileage value. Figure 12 shows the three-axis measurement data, where t is the measurement time in milliseconds and Mv is measurement values in the sensor’s resolution. The resolution is between 0 and 65,535. The longitudinal value is shown in Figure 12a. This method uses an analysis algorithm to find the peak value and, at the same time, record the time that the peak value occurs. There is a time gap between the two peaks. This method uses the time gap to calculate the speed and the method can use the value to verify distance. Equation (6) provides speed data, where SPDavg is tire speed, C is peak number, R is tire radius, and t is the pulse time. Equation (7) provides mileage data, where L is tire mileage, R is tire radius, and C is peak number. The value correctness is important for the application. The method uses radial data to ensure the value. The radial value is shown in Figure 12b. Figure 12c,d also compare longitudinal and radial values to find the relation between the two values. Figure 12c has 60,000 sample points of data and Figure 12d has 20,000. The longitudinal and radial values exist at the same time after observing the experimental results. This method uses this characteristic to verify the correctness of the result.
S P D a v g = ( n = 1 c ( 2 π R ( t n + 1 t n ) ) ) / C
L = C = 0 n 2 π R

3. Results

In this section, we verify and analyze the results. Two parts are verified: tire wear and mileage. The wear state result is presented in the six statuses, as proposed previously. The tire mileage is displayed in kilometers, indicating how many kilometers have been traveled. We discuss different loads and speeds that can affect the algorithm.

3.1. Tire Wear Status Result

The tire wear status is presented by voltage value because the method measures the magnetic through the Hall sensor. The Hall sensor converts the magnetic flux density to the voltage value. There are two groups of results shown in Figure 13. Group 1 is the rubber magnetic value. The value set is measured by each piece, and there is no medium. Group 2 is the measurement data with a medium. The result is compared by the different measurements with or without the tire. The tire can affect the magnetic flux because the tire has a wiring layer that can shield some magnetic forces. The results show the influence of the medium. Although the results are somewhat biased, they have a trend. The deviations are due to measurement techniques and the experiment’s tire slices. Because there is no guarantee that the rubber will be placed in the same position every time, this can cause a measurement error. The impact of deviations is ignored in this experiment. Figure 13 describes the magnetic trend discovered through some measurements. The figure has six measurement values. The six measurement values compare the rubber magnetic value, representing the medium’s influence. If the measurement has a tire as the medium, the Hall sensor senses that the magnetic field value is reduced. The result can describe the magnetic flux density change as a trend, and the effectiveness of the method is verified. Figure 13 shows that the magnetic values are not the same, but the values have the same trend. The result fits the concept of the method. This phenomenon can affect the method design. This is the reason why the method uses mileage information to support the wear measurement.

3.2. Tire Mileage Result

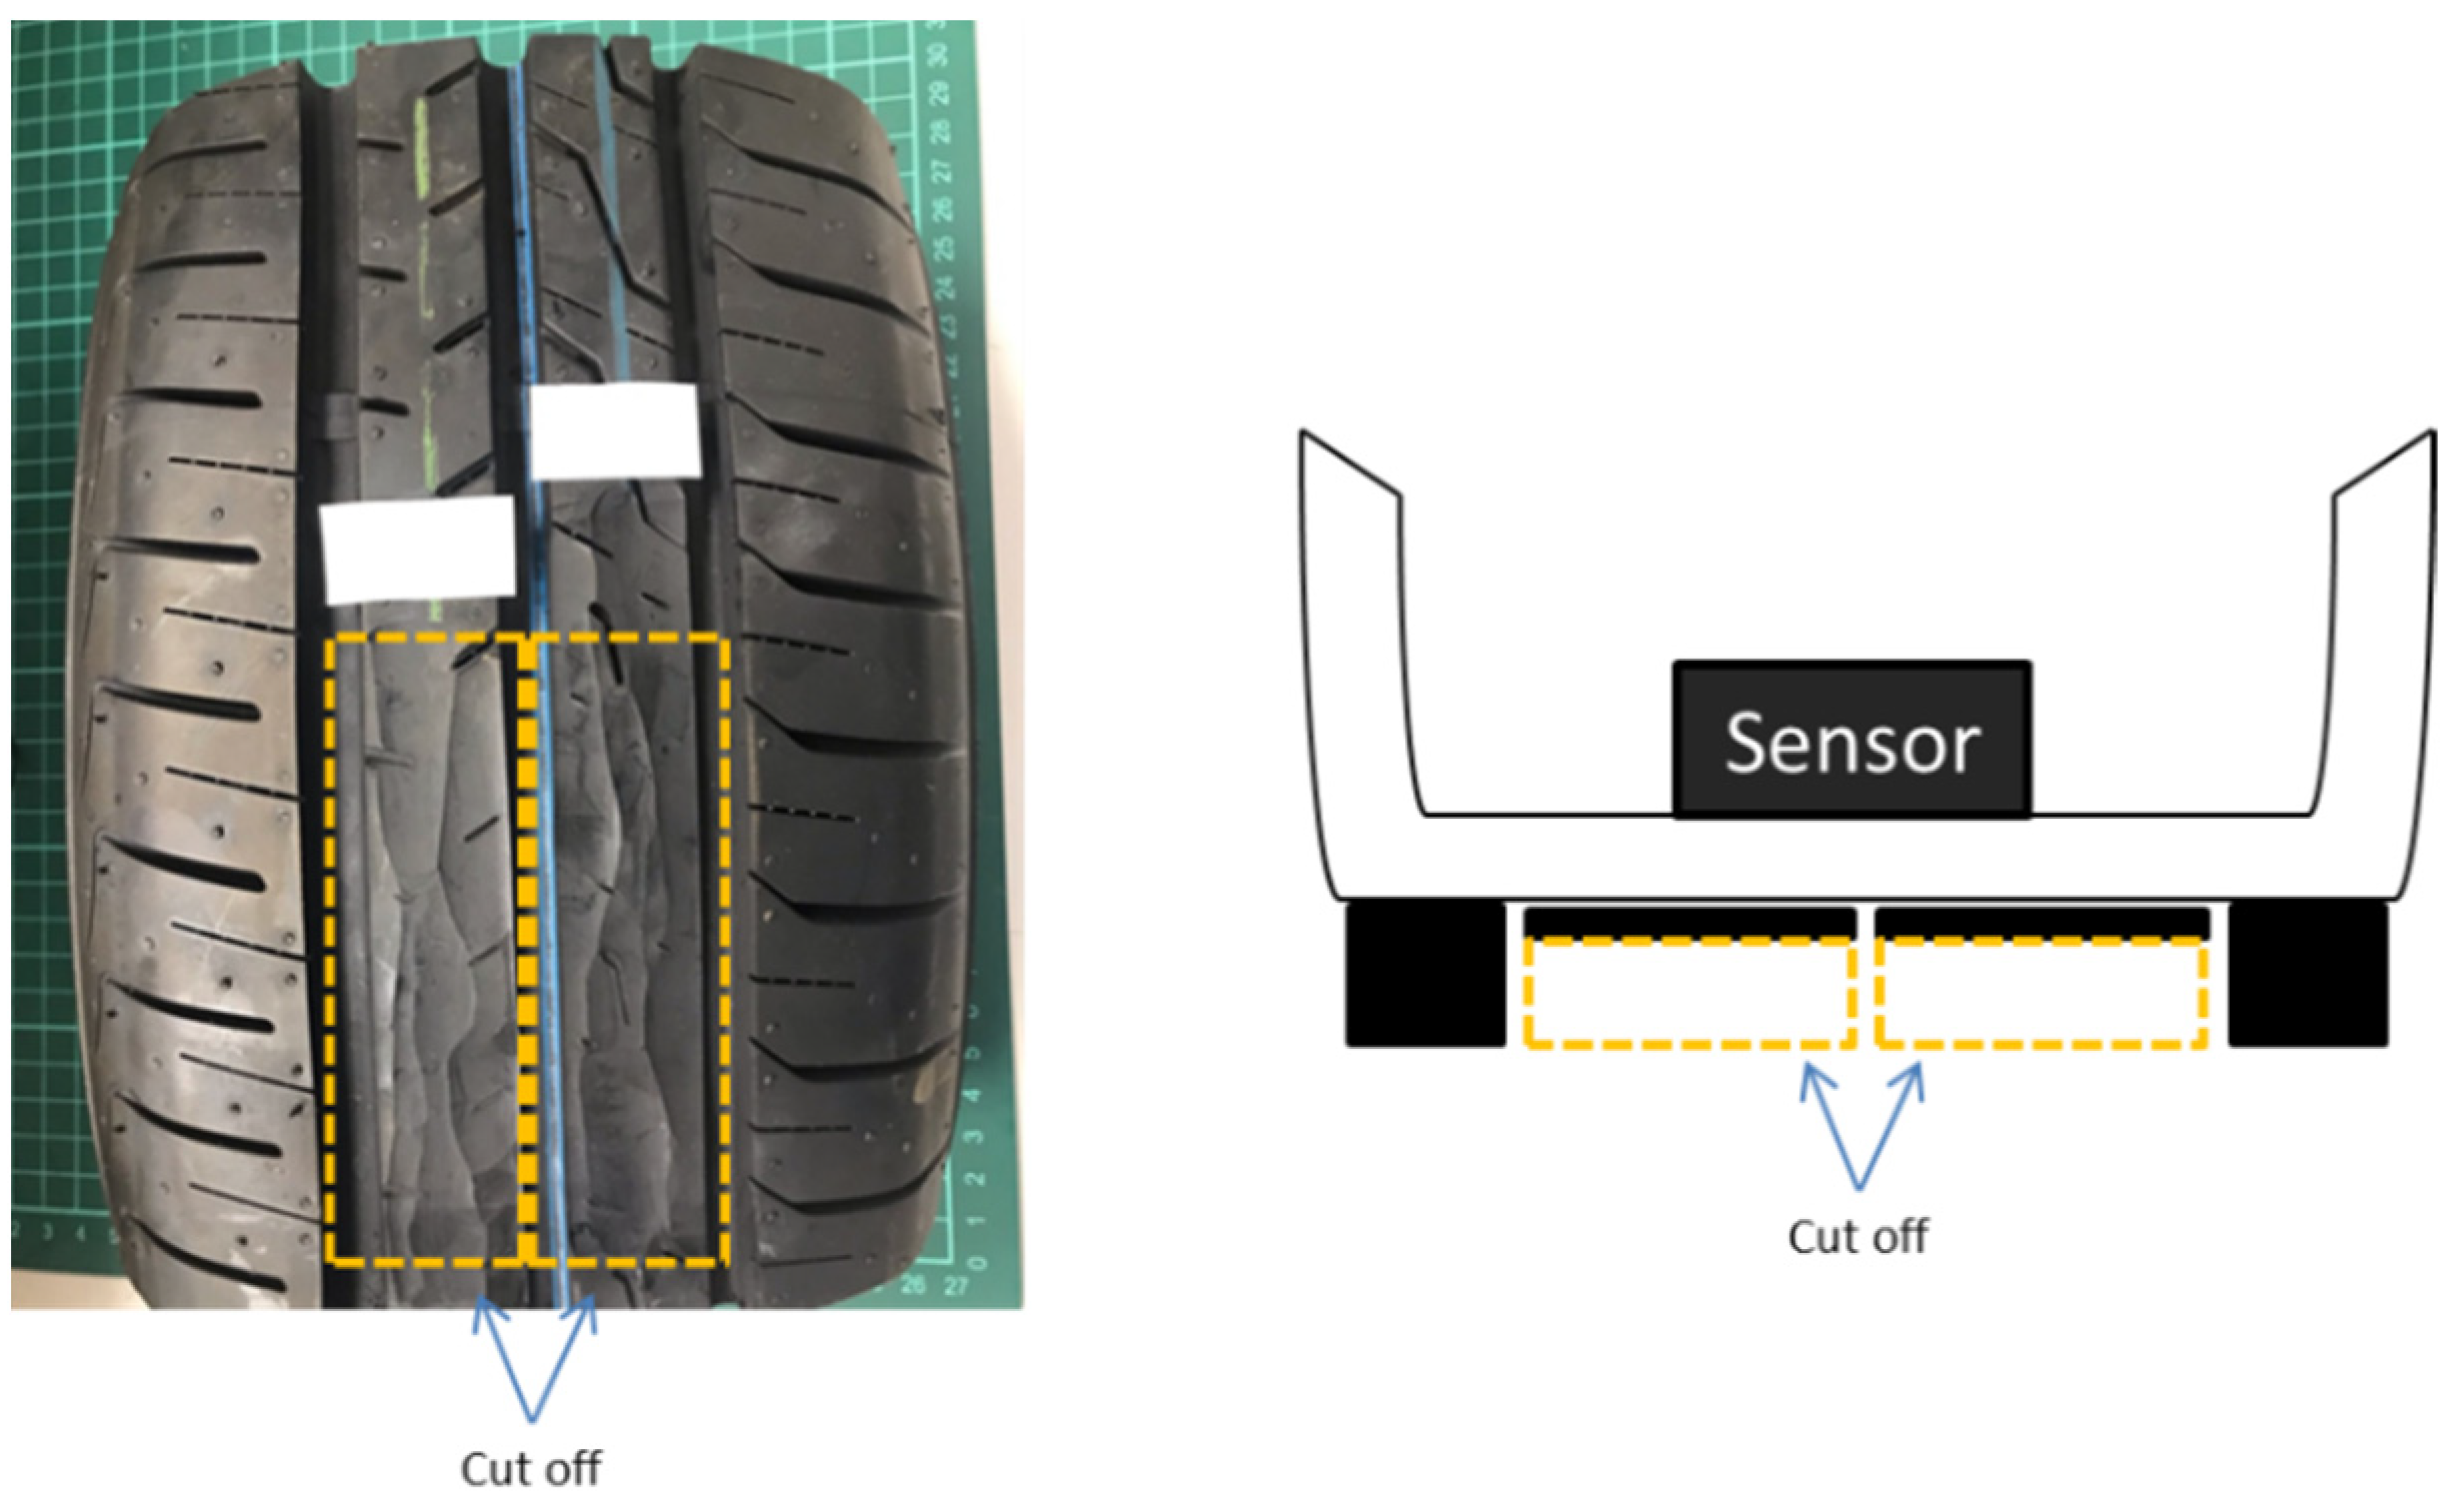
We verified the mileage method on the test platform described earlier with the Hall sensor installed in the tire. The platform provided the data when the tire was rolling. The test conditions included speed and load. The speed had three conditions: 40 km/h, 60 km/h, and 80 km/h. The tire spec was 235/60 R18 and the tire load in this experiment was 585 kg. The conditions are listed in 
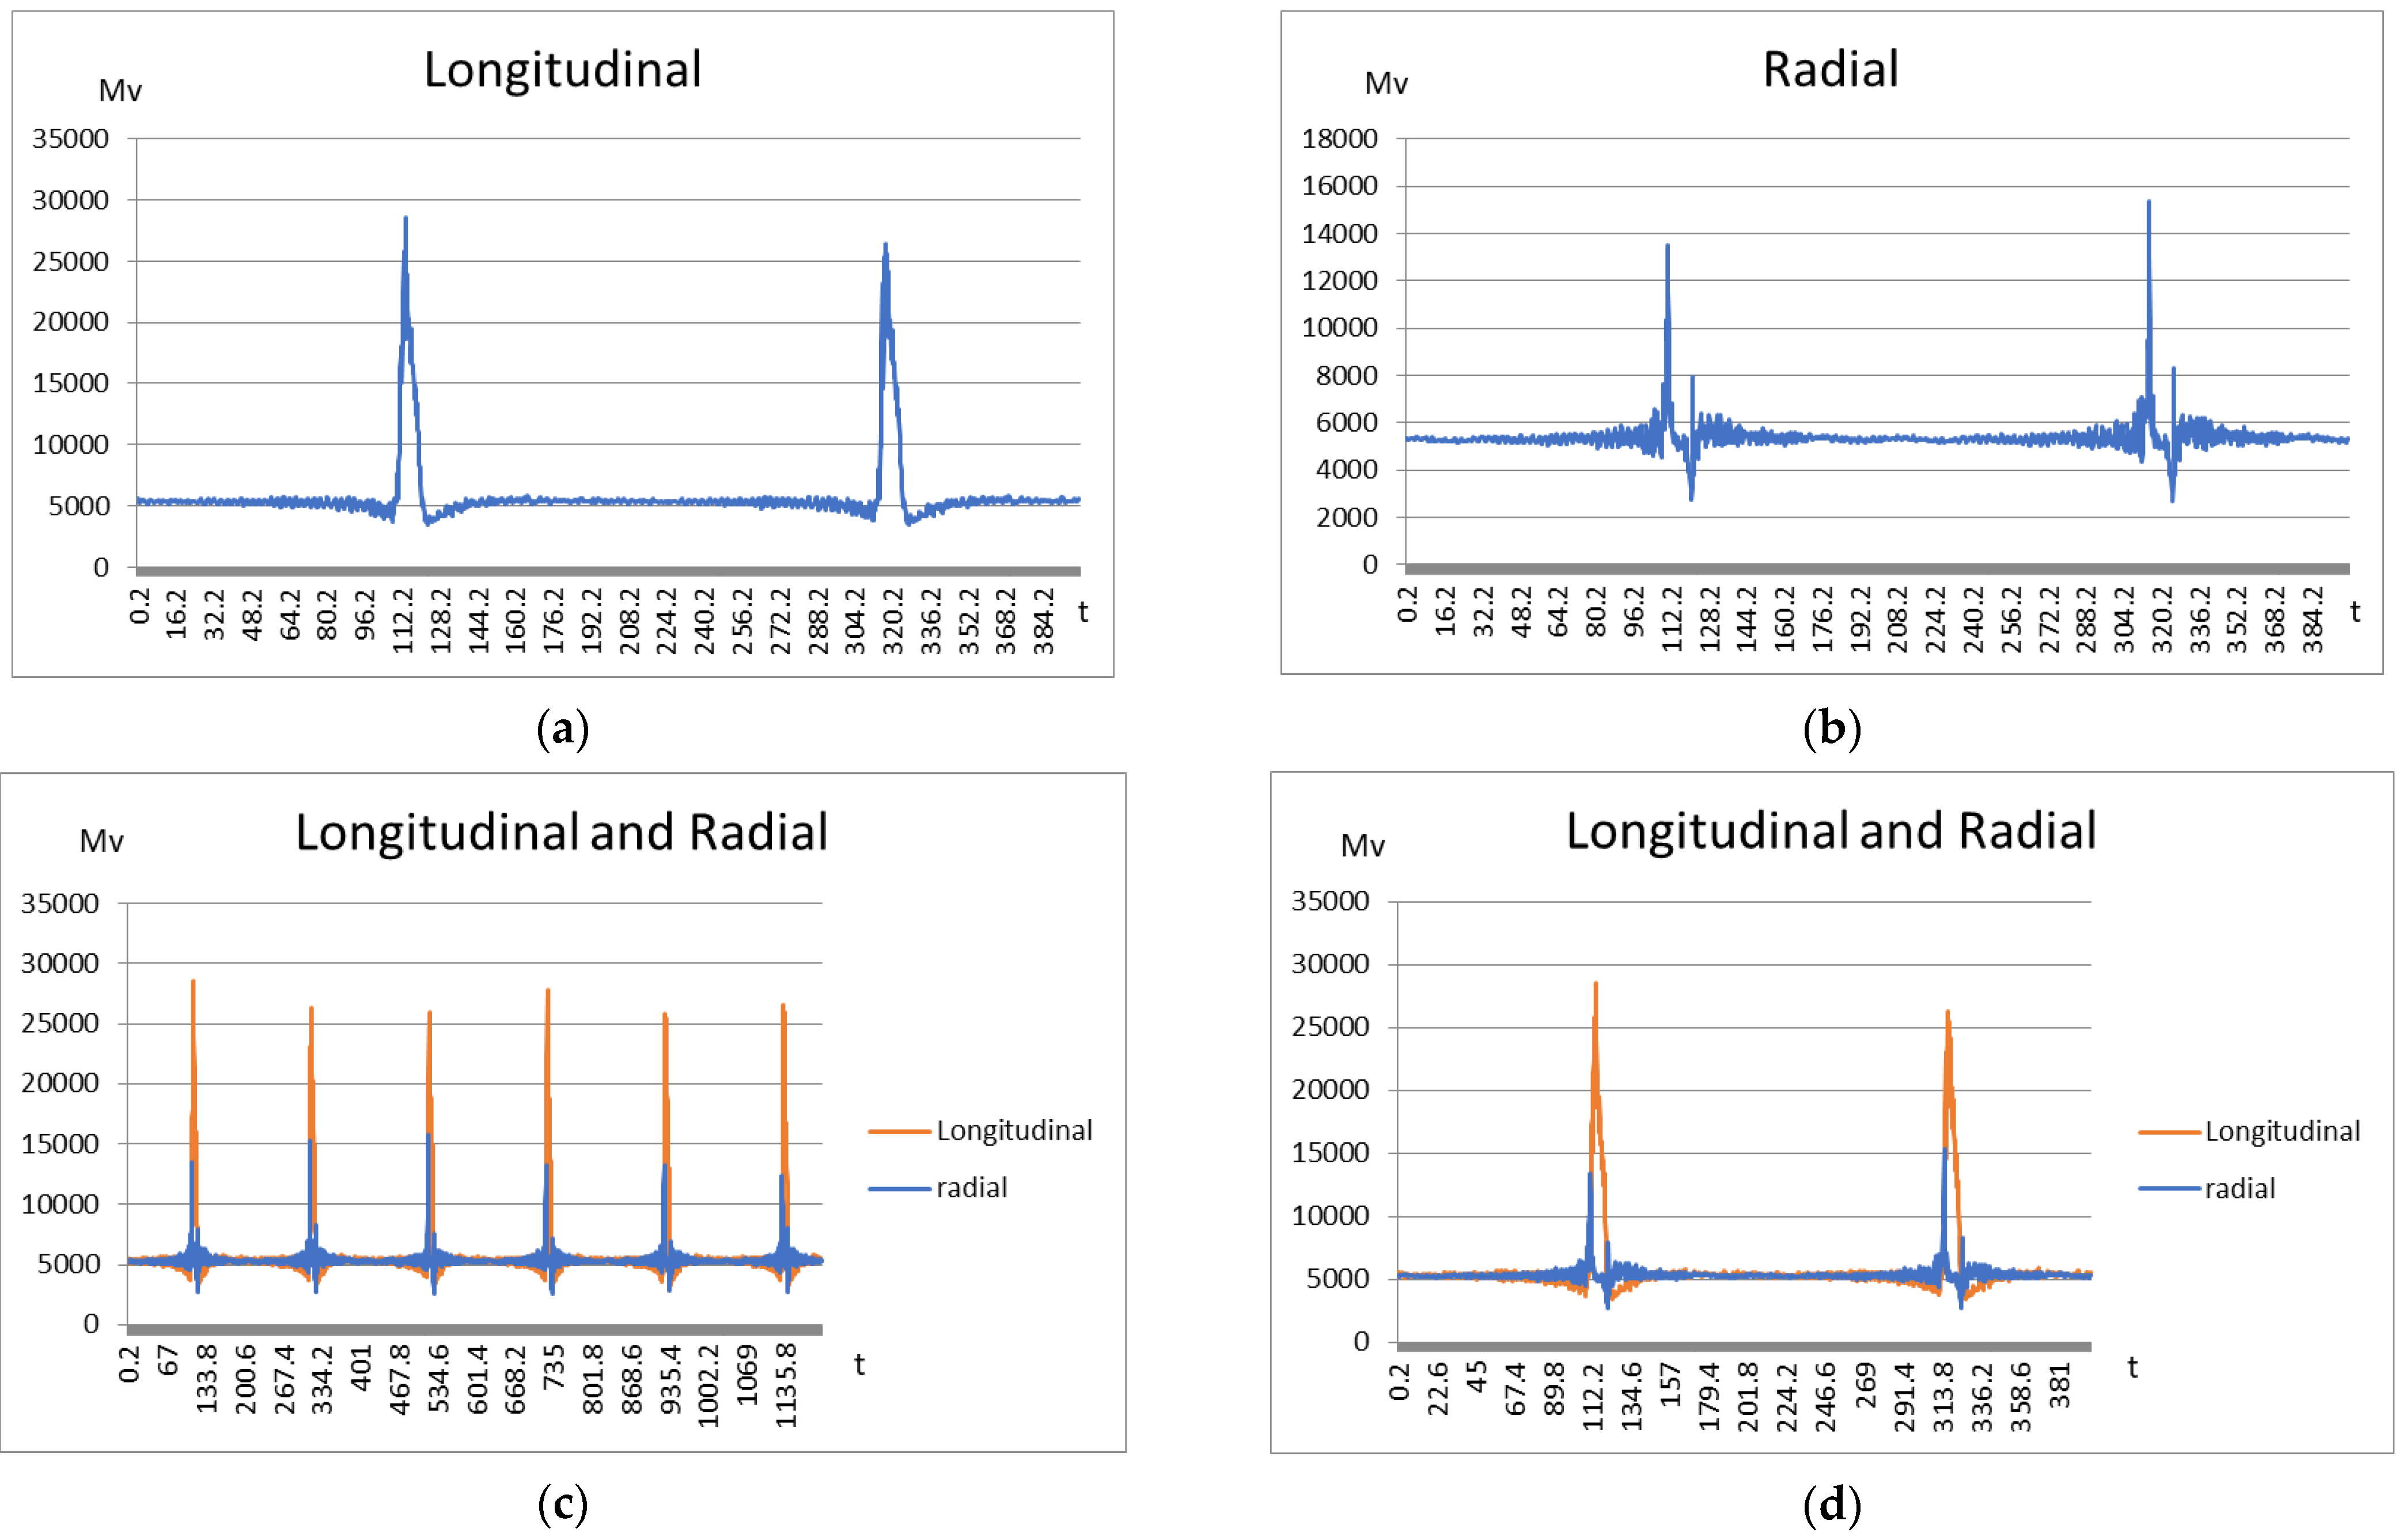
Table 1. The result shows that the tire perimeter becomes longer when the tire has a load. The perimeter is considered with load in our experiment. The mileage estimation method is based on the pulse that forms the three-axis signal. There is a time gap between the two pulses. The speed value is calculated by the time gap. The speed value can help users verify the correctness of the results because the speed is a known experimental condition. The results show that there an error between actual speed and estimated speed. The estimated speed is shown in Figure 14. The error rate observed from the test result is under 0.38%. Actual mileage is compared with estimated mileage in Table 1. The method has an error rate under 0.6%. Additionally, it has an error of 300 km when the tire is used for 50,000 km. The results prove that the algorithm has a low error rate.
Each tire has limited mileage and service life. The mileage and wear have some relations that include load and usage habits. Driving habits and wear-resistant tires complicate conditions for the estimation. Tire lifetime is not discussed in this paper. We executed our experiment in the lab and the evaluation conditions were objective. The method can provide some reference information and indirectly improve vehicle safety, which is one of our motivations. There is room for improvement in follow-up studies from the perspective of mass production, such as power supply size and integration. These issues will be discussed separately in the future. In sum, our method uses rubber with a magnetic field to simulate a tire with a magnetic field. We calculated the magnetic field strength to monitor the tire wear. However, the magnetic field absorbs some metal substances and increases the tire wear estimation. Verification with long-term experiments may be useful to elucidate these relations.

4. Conclusions

Every driver knows that there is a certain relationship between tire mileage and wear. We developed a method to estimate tire mileage and wear status that enables users to understand tire usage easily. This method uses magnetic force to estimate tire wear. Tire manufacturers use carbon nanotubes as materials to make tires magnetic through processing. This method obtains the magnetic field strength value through a Hall sensor. Considering the relationship between mileage and wear, we propose a mileage estimation method based on a three-axis sensor to support tire wear estimation. The mileage estimation uses the longitudinal axis, the radial axis data, and the tire circumference. The distance traveled is estimated from the longitudinal information. To ensure the correctness of the vertical axis data, the radial axis information is used for verification. The dynamometer is the equipment that verifies the mileage estimation algorithm. Our experiments confirmed that the average error rate of the proposed method is about 0.6%. The result of the experiment is that mileage information is reference information.
Considering tire wear speed and system energy consumption, we developed a control mechanism to reduce power consumption. Because tire wear is gradual, the tire wear estimation algorithm does not need to be functioning all the time. The mileage information is a signal to trigger this mechanism, which can effectively reduce the application’s power consumption. This mechanism gives application a longer lifetime if the power source is a battery. The solutions to these problems establish this method as suitable to adopt in future applications.

Author Contributions

Conceptualization, W.-H.C., R.-T.J. and M.-H.H.; methodology, W.-H.C. and R.-T.J.; software, M.-H.H.; validation, W.-H.C., M.-H.H. and M.-F.S.; formal analysis, W.-H.C.; investigation, W.-H.C. and M.-H.H.; resources, M.-F.S.; data curation, M.-H.H.; writing—original draft preparation, W.-H.C.; writing—review and editing, R.-T.J.; visualization, M.-H.H.; supervision, R.-T.J.; project administration, R.-T.J.; funding acquisition, R.-T.J. All authors have read and agreed to the published version of the manuscript.

Funding

This research was funded by the Ministry of Science and Technology (MOST), Taiwan, grant number MOST 109-2222-E-035-003-MY2.

Acknowledgments

This work was supported by the Ministry of Science and Technology (MOST), Taiwan, under Grant No. MOST 109-2222-E-035-003-MY2. We thank Kenda Tire Co., Ltd., Taiwan, for providing measurement data.

Conflicts of Interest

The authors declare no conflict of interest.

References

  1. Wang, J.; Xia, X.; Li, X. onolithic integration of Pressure Plus Accelearation Composote TPMS Sensors with a Single-Sided Micromachining Technology. J. Microelectromech. Syst. 2012, 21, 284–293. [Google Scholar] [CrossRef]
  2. Liu, X.; Xiao, Z.; Cheng, J. Research and Implementation of Low-power TPMS. In Proceedings of the 2012 4th International Conference on Intelligent Human-Machine Systems and Cybernetics, Nanchang, China, 26–27 August 2012. [Google Scholar]
  3. Xiangjun, T. The Design and Research of Tire Pressure Monitoring System. In Proceedings of the 2016 International Conference on Intelligent Transportation, Bid Data & Smart City, Changsha, China, 17–18 December 2016. [Google Scholar]
  4. Andrews, J.B.; Cardenas, J.A.; Mullett, J.; Franklin, A.D. Fully printed and flexible carbon nanotube transistor designed for environmental pressure sensing and aimed at smart tire applications. In Proceedings of the 2017 IEEE SENSORS, Glasgow, UK, 1–3 October 2017. [Google Scholar]
  5. Saini, N.S.; Shao, S.; Kiourti, A.; Burkholder, R.J.; Volakis, J.L. RFID tags for in-situ tire monitoring. In Proceedings of the 2016 URSI International Symposium on Electromagnetic Theory, Espoo, Finland, 14–18 September 2016. [Google Scholar]
  6. Yilmazoglu, O.; Brandt, M.; Sigmund, J.; Genc, E.; Hartnagel, H.L. Integrated InAs/GaSb 3D magnetic field sensors for ’the intelligent tire’. Sens. Actuators A Phys. 2001, 94, 59–63. [Google Scholar] [CrossRef]
  7. Breglio, G.; Irace, A.; Marrazzo, V.R.; Riccio, M.; Romano, L.; Strano, S.; Terzo, M. Feel-tire Unina: Development and Modeling of a Sensing System for Intelligent Tires. In Proceedings of the 2019 IEEE 5th International Forum on Reasearch and Technoglogu for Society and Industry, Florence, Italy, 9–12 September 2019. [Google Scholar]
  8. Jeong, D.; Lee, J.; Choi, S.; Kim, M. Load Estimation of Intelligent Tires Equipped with Acceleration Sensors. In Proceedings of the 2019 IEEE Sensors Applications Symposium, Sophia, France, 11–13 March 2019. [Google Scholar]
  9. Panichpapiboon, S.; Leakkaw, P. Lane Change Detection with Smartphones: A Steering Wheel-Based Approach. IEEE Access 2020, 8, 91076–97088. [Google Scholar] [CrossRef]
  10. Li, S.; Wang, S.; Wang, S.; Zhang, N.; Cui, G. Path Tracking Control Based on the Prediction of Tire State Stiffness Using the Optimized Steering Sequence. IEEE Access 2020, 8, 170117–170127. [Google Scholar] [CrossRef]
  11. Huang, S.-Y.; Chen, Y.-C.; Wang, J.-K. Measurement of Tire Tread Depth with Image Triangulation. In Proceedings of the 2016 International Symposium on Computer, Consumer and Control, Xi’an, China, 4–6 July 2016. [Google Scholar]
  12. Andrews, J.B.; Ballentine, P.; Cardenas, J.A.; Lim, C.J.; Williams, N.X.; Summers, J.B.; Stangler, M.A.; Koester, D.A.; Cummer, S.A.; Franklin, A.D.; et al. Printed Electronic Sensor Array for Mapping Tire Tread Thickness Profiles. IEEE Sens. J. 2019, 19, 8913–8919. [Google Scholar] [CrossRef]
  13. Kim, H.-J.; Han, J.-Y.; Lee, S.; Kwag, J.-R.; Kuk, M.-G.; Han, I.-H.; Kim, M.-H. A Road Condition Classification Algorithm for a Tire Acceleration Sensor using an Artificial Neural Network. Electronics 2020, 9, 404. [Google Scholar] [CrossRef] [Green Version]
  14. Kazmi, W.; Nabney, I.; Vogiatzis, G.; Rose, P.; Codd, A. An Efficient Industrial System for Vehicle Tyre (Tire) Detection and Text Recognition Using Deep Learning. IEEE Trans. Intell. Transp. Syst. 2020, 22, 1264–1275. [Google Scholar] [CrossRef] [Green Version]
Figure 1. System prototype.
Electronics 10 02531 g001
Figure 2. System implementation.
Electronics 10 02531 g002
Figure 3. Process flow.
Electronics 10 02531 g003
Figure 4. The difference between the new tire and the used tire.
Electronics 10 02531 g004
Figure 5. Wear status and magnetic field value: (a) tire magnetic flux density spec; (b) segmented the wear status based on tire magnetic flux density.
Electronics 10 02531 g005
Figure 6. Schematic diagram of the tire block section.
Electronics 10 02531 g006
Figure 7. Tire slice verification: (a) the tire slice cut into six pieces; (b) radial wave.
Electronics 10 02531 g007
Figure 8. The magnetic field measurement.
Electronics 10 02531 g008
Figure 9. The Hall sensor power control process.
Electronics 10 02531 g009
Figure 10. Longitudinal, radial, and axial data.
Electronics 10 02531 g010
Figure 11. Mileage estimation flow.
Electronics 10 02531 g011
Figure 12. Signal wave: (a) longitudinal wave; (b) radial wave; (c) longitudinal and radial results compared with a 60,000 sample point; (d) longitudinal and radial results compared with a 20,000 sample point.
Electronics 10 02531 g012
Figure 13. Tire wear result.
Electronics 10 02531 g013
Figure 14. Estimated speed result: (a) speed of 40 km/h; (b) speed of 60 km/h; (c) speed of 80 km/h.
Electronics 10 02531 g014
Table 1. Mileage comparison table.
ParametersSpeed—40 km/hSpeed—60 km/hSpeed—80 km/h
Perimeter (m)2.3222.3222.322
Perimeter with load (585 kg)2.2222.2222.222
Tire spec235/60 R18235/60 R18235/60 R18
Test time (s)303030
Test mileage (km)0.3330.50.667
Estimated mileage0.3310.4970.668
Error rate0.669%0.445%0.0014%
Publisher’s Note: MDPI stays neutral with regard to jurisdictional claims in published maps and institutional affiliations.

