Article

High Performance Classification Model to Identify Ransomware Payments for Heterogeneous Bitcoin Networks

by
Qasem Abu Al-Haija
1,* and
Abdulaziz A. Alsulami
2
1
Department of Data Science & Artificial Intelligence, Faculty of Information Technology, University of Petra (UoP), Amman 1196, Jordan
2
Department of Information Systems, Faculty of Computing and Information Technology, King Abdulaziz University, Jeddah 21589, Saudi Arabia
*
Author to whom correspondence should be addressed.
Electronics 2021, 10(17), 2113; https://doi.org/10.3390/electronics10172113
Submission received: 24 July 2021 / Revised: 28 August 2021 / Accepted: 29 August 2021 / Published: 31 August 2021
(This article belongs to the Special Issue New Advances and Challenges in Communication Networks)

Abstract

:
The Bitcoin cryptocurrency is a worldwide prevalent virtualized digital currency conceptualized in 2008 as a distributed transactions system. Bitcoin transactions make use of peer-to-peer network nodes without a third-party intermediary, and the transactions can be verified by the node. Although Bitcoin networks have exhibited high efficiency in the financial transaction systems, their payment transactions are vulnerable to several ransomware attacks. For that reason, investigators have been working on developing ransomware payment identification techniques for bitcoin transactions’ networks to prevent such harmful cyberattacks. In this paper, we propose a high performance Bitcoin transaction predictive system that investigates the Bitcoin payment transactions to learn data patterns that can recognize and classify ransomware payments for heterogeneous bitcoin networks. Specifically, our system makes use of two supervised machine learning methods to learn the distinguishing patterns in Bitcoin payment transactions, namely, shallow neural networks (SNN) and optimizable decision trees (ODT). To validate the effectiveness of our solution approach, we evaluate our machine learning based predictive models on a recent Bitcoin transactions dataset in terms of classification accuracy as a key performance indicator and other key evaluation metrics such as the confusion matrix, positive predictive value, true positive rate, and the corresponding prediction errors. As a result, our superlative experimental result was registered to the model-based decision trees scoring 99.9% and 99.4% classification detection (two-class classifier) and accuracy (multiclass classifier), respectively. Hence, the obtained model accuracy results are superior as they surpassed many state-of-the-art models developed to identify ransomware payments in bitcoin transactions.

1. Introduction

The evolution of digitalization has resulted in massive users of the cryptocurrency market space [1]. Many cryptocurrencies exist in the market, and Bitcoin has become the most popular and the most valuable digital currency [2]. Bitcoin is a decentralized virtual system that uses a peer-to-peer network and was firstly introduced in 2008 by Satoshi Nakamoto [3]. In Bitcoin, the digital money is stored in virtual wallets and not owned or administered by a central authority [4]. In general, cryptocurrency users can effortlessly request payment transactions without user verification, and the payment addresses are generated anonymously [5]. Therefore, Bitcoin payment transactions have been intensively used around the globe [6]. In addition, Bitcoin transactions can be made between users through network nodes without a third-party intermediary, and the transactions can be verified by the nodes [7].
Bitcoin was built based on Blockchain technology, and this has brought several benefits to the network communication of Bitcoin, such as improving security, decentralization, and establishing trusted peer-to-peer networks [8]. However, the vast growth of Bitcoin users requires more research and investigation on cybercrime threats. Furthermore, Bitcoin is vulnerable to cyberattacks, and the IP addresses of Bitcoin users can be easily leaked [9]. The anonymity of Bitcoin users increases users’ privacy; however, at the same time, it increases the possibility of committing cyber-attacks [10]. Therefore, some Bitcoin users rely on third-party tools to generate anonymous IP addresses such as VPNs and Tor [5]. However, this solution is not enough to enhance the security of Bitcoin users.
In general, any information security sector relies on the CIA triad, consisting of confidentiality, integrity, and availability as a guide to maintain, govern, and regulate security features, as shown in Figure 1 [11]. Thus, for example, confidentiality can be threatened by a ransomware attack, integrity can be threatened by a false data injection attack, and a DDoS attack is a threat to availability. However, this paper only addresses ransomware attacks, which are a threat to the confidentiality of Bitcoin users.
Ransomware is malware software that can lock users’ data or screens; therefore, the users are blocked from accessing their own data. Ransomware decrypts the user data; consequently, the user is no longer able to decrypt those data. In order to decrypt the data, the user needs to pay ransom [1]. Ransomware is relatively a novel intrusion attack targeting the cryptocurrency data of Bitcoin users [12]. It was reported that more than 500 existing ransomware families can target Bitcoin data; therefore, more research is needed to identify and classify ransomware in order to prevent it [3]. Primarily, there are three genders of ransomware based on their functionality, as represented in Figure 2. The first type is crypto-ransomware, and in this type, the attacker encrypts the victim files and asks the victim to pay a ransom. Crypto-ransomware is considered the most threatening ransomware, and therefore it should be detected early [12]. The second type is locker-ransomware, where the attacker locks the victim screen and asks for a ransom. Finally, the third type is scareware, and in this type, the attacker only scares the victim and asks for a ransom to be paid [12].
Encryption is a powerful technique widely used in network security to prevent user data from unauthorized access. Basically, the message is encoded before sending and decoded once it is received. Encryption has enhanced the security of Bitcoin, but unfortunately, this technique can be misused by attackers. Therefore, attackers can block victim’s files and extort ransom using ransomware [11].
Therefore, it is essential to detect and identify the payment ransomware attack early before its encryption function occurs to help minimize its risk. However, late detection of ransomware increases the level of challenge of tackling the attack [13]. This paper proposes a novel model to detect ransomware payments early for heterogeneous Bitcoin networks. Basically, the Optimizable Decision Trees (Bootstrap Aggregation DT ensemble) method and Shallow Neural Network based on multilayer Perceptron (MLP) are used to decide whether the ransomware exists at the detection stage, and after that, they are used to classify ransomware attacks into three ransomware attacks family, including Ransomware–Montreal Family, Ransomware–Padua Family, and Ransomware–Princeton Family. To validate the proposed model, we compared our proposed model with other models, and the comparison result confirmed that our model competed with the existing models.
The rest of the paper is organized as follows: in Section 2, a literature review is represented. In Section 3, system modeling and configurations are discussed. Section 4 presents the results and discussion. Finally, in Section 5, we provide a conclusion of the research work.

2. Literature Review

This section discusses the latest technologies used by researchers to mitigate the impacts of ransomware attacks in cryptocurrency sectors. For instance, in [14], the authors proposed a pre-encryption detection algorithm (PEDA) to detect crypto-ransomware early. Detecting ransomware at an early stage means that the attack is detected before the beginning of its encryption function. When the attack is detected by the PEDA, the victim will be notified; therefore, sensitive data and files can be transferred to a new location while the ransomware is cleared. The PEDA contains two phases. In Phase I, the learning algorithm (LA) analyzes the Windows application programming interface (API) to identify the ransomware attack. When the attack is identified, then, in Phase II, a signature is generated and stored in the signature repository to be used later to detect ransomware in Phase I. To verify the performance of the proposed LA, the authors compared the false positive rate (FPR) of the LA with the other LAs, which are: EldeRan, Ensemble (NB and RF), Random Forest (RF), and Naive Bayes (NB). According to the authors, the proposed LA scored the lowest FPR result.
Deep learning approaches have been proposed by researchers to detect malware in the Bitcoin system [8]. In this reference [15], the authors used Long-Short Term Memory (LSTM) to detect ransomware. The LSTM was used to classify API sources to identify ransomware families based on their behavior. LSTM is a deep learning algorithm that provides an accurate classification result. Furthermore, it overcomes the vanishing gradient problem of classical Recurrent Neural Networks (RNN) [15]. Abbas Yazdinejad et al. [8] also used LSTM to detect cryptocurrency malware on Windows Operating System. The dataset used in this research consists of 200 legal cryptocurrency samples and 500 cryptocurrency malware samples. To evaluate the work, the authors compare the performance of the proposed method with K-Nearest Neighbor, Decision Tree, Random Forest, SVM, Naïve Bayes, and Ada-Boost using the 10-fold cross-validation (CV) metric. According to the authors, the LSTM detection accuracy reached 98%, exceeding the other detection algorithms.
In this paper [16], the authors proposed NetConver, a machine learning approach to analyze Windows ransomware in network traffic. NetConverse was used with Decision Tree (J48), and according to the authors, it achieved a 97.1% accuracy rate based on the True Positive Detection Rate (TPR) metric. The research experiment consists of three phases. In phase I, the dataset was collected by capturing the malicious network traffic. In phase 1, the authors focused only on Windows ransomware. The dataset has 9 ransomware families divided into two ransomware classes: crypto-ransomware and locker- ransomware. In phase II, the TShark software was used to extract features of the collected network traffic, and there were five different features. Finally, in phase III, the authors compared the proposed algorithm with five different classifier algorithms: Bayes Network, Random Forest, Multilayer Perceptron, k-nearest neighbors (KNN), and Least Mean Squares Filter (LMS) using TPR and FPR. According to the comparison result, the proposed algorithm defeated the five classifier algorithms.
In [17], the authors proposed a novel detection technique to detect ransomware attacks at an early stage based on dynamic pre-encryption boundary instead of fixed time pre-encryption boundary. In a fixed time pre-encryption boundary, the pre-encryption phase starts at a fixed time. However, in the dynamic pre-encryption boundary, the pre-encryption phase is determined by DPBD-FE, which refers to Dynamic Pre-Encryption Boundary Delineation and Feature Extraction. The fixed time pre-encryption boundary involves that the encryption time for all samples starts simultaneously; however, some malware could change its behavior which could decrease the detection accuracy. On the other hand, the dynamic pre-encryption boundary takes the encryption time for all samples at different times based on the cryptography-related APIs that occurs first. Therefore, the dynamic pre-encryption boundary is considered more accurate than the fixed time pre-encryption boundary.
Convolutional Neural Network (CNN) is a powerful deep learning tool that can be used to classify malware samples. However, the malware samples need to be first converted to grayscale images before the training process. Authors in [18] proposed a CNN model to classify malware samples. Two datasets were used in this research, Microsoft and Malimg. The Malimg dataset consists of 9339 malware samples that belong to 25 malware families. The Microsoft dataset comprises 21,741 malware samples that belong to 9 malware families. The CNN classification performed higher on the Microsoft dataset than the Malimg dataset. Authors in [19] also used CNN to classify malware samples. However, the malware samples were converted to color images this time. The authors used two datasets, Malimg, which was also used in [18], and IoT–android mobile. The accuracy of the classification in the Malimg dataset reached 98.82%, slightly better than [18], which was 98.52%. However, the accuracy of CNN in the IoT–android mobile dataset was 97.35%.
In order to increase the accuracy of the CNN, authors in [20] used Markov images with the CNN instead of gray images. Therefore, the malware samples were converted to Markov images before training the CNN. This classification technique was applied to two datasets, Drebin and Microsoft. The Microsoft dataset consists of 10,868 malware samples that belong to 9 malware families, and the Drebin datasets consist of 4020 malware samples that belong to 10 malware families. According to the authors, the average accuracy of the proposed method achieved 97.364% in the Drebin dataset. Therefore, we can say that processing the dataset in different ways while using the same classifier method result in various classification accuracy. This is evident since the authors in [18,19] and [20] used the same method, which was CNN; however, different techniques of processing datasets were applied. In [18], the malware samples were converted to grayscale images. In [19], they were converted to color images, and in [20], converted to Markov images. Most of the state-of-art solutions are usually developed to assess security triad of Blockchain technology in public sector applications [21].

3. System Development and Specifications

This section provides an explanation of the employed dataset for the bitcoin payment transactions over a heterogeneous network, a detailed description of the development stages of the proposed machine learning-based classification system, and finally, it mentions the simulation and experimental setup configurations for the system development and validation processes.

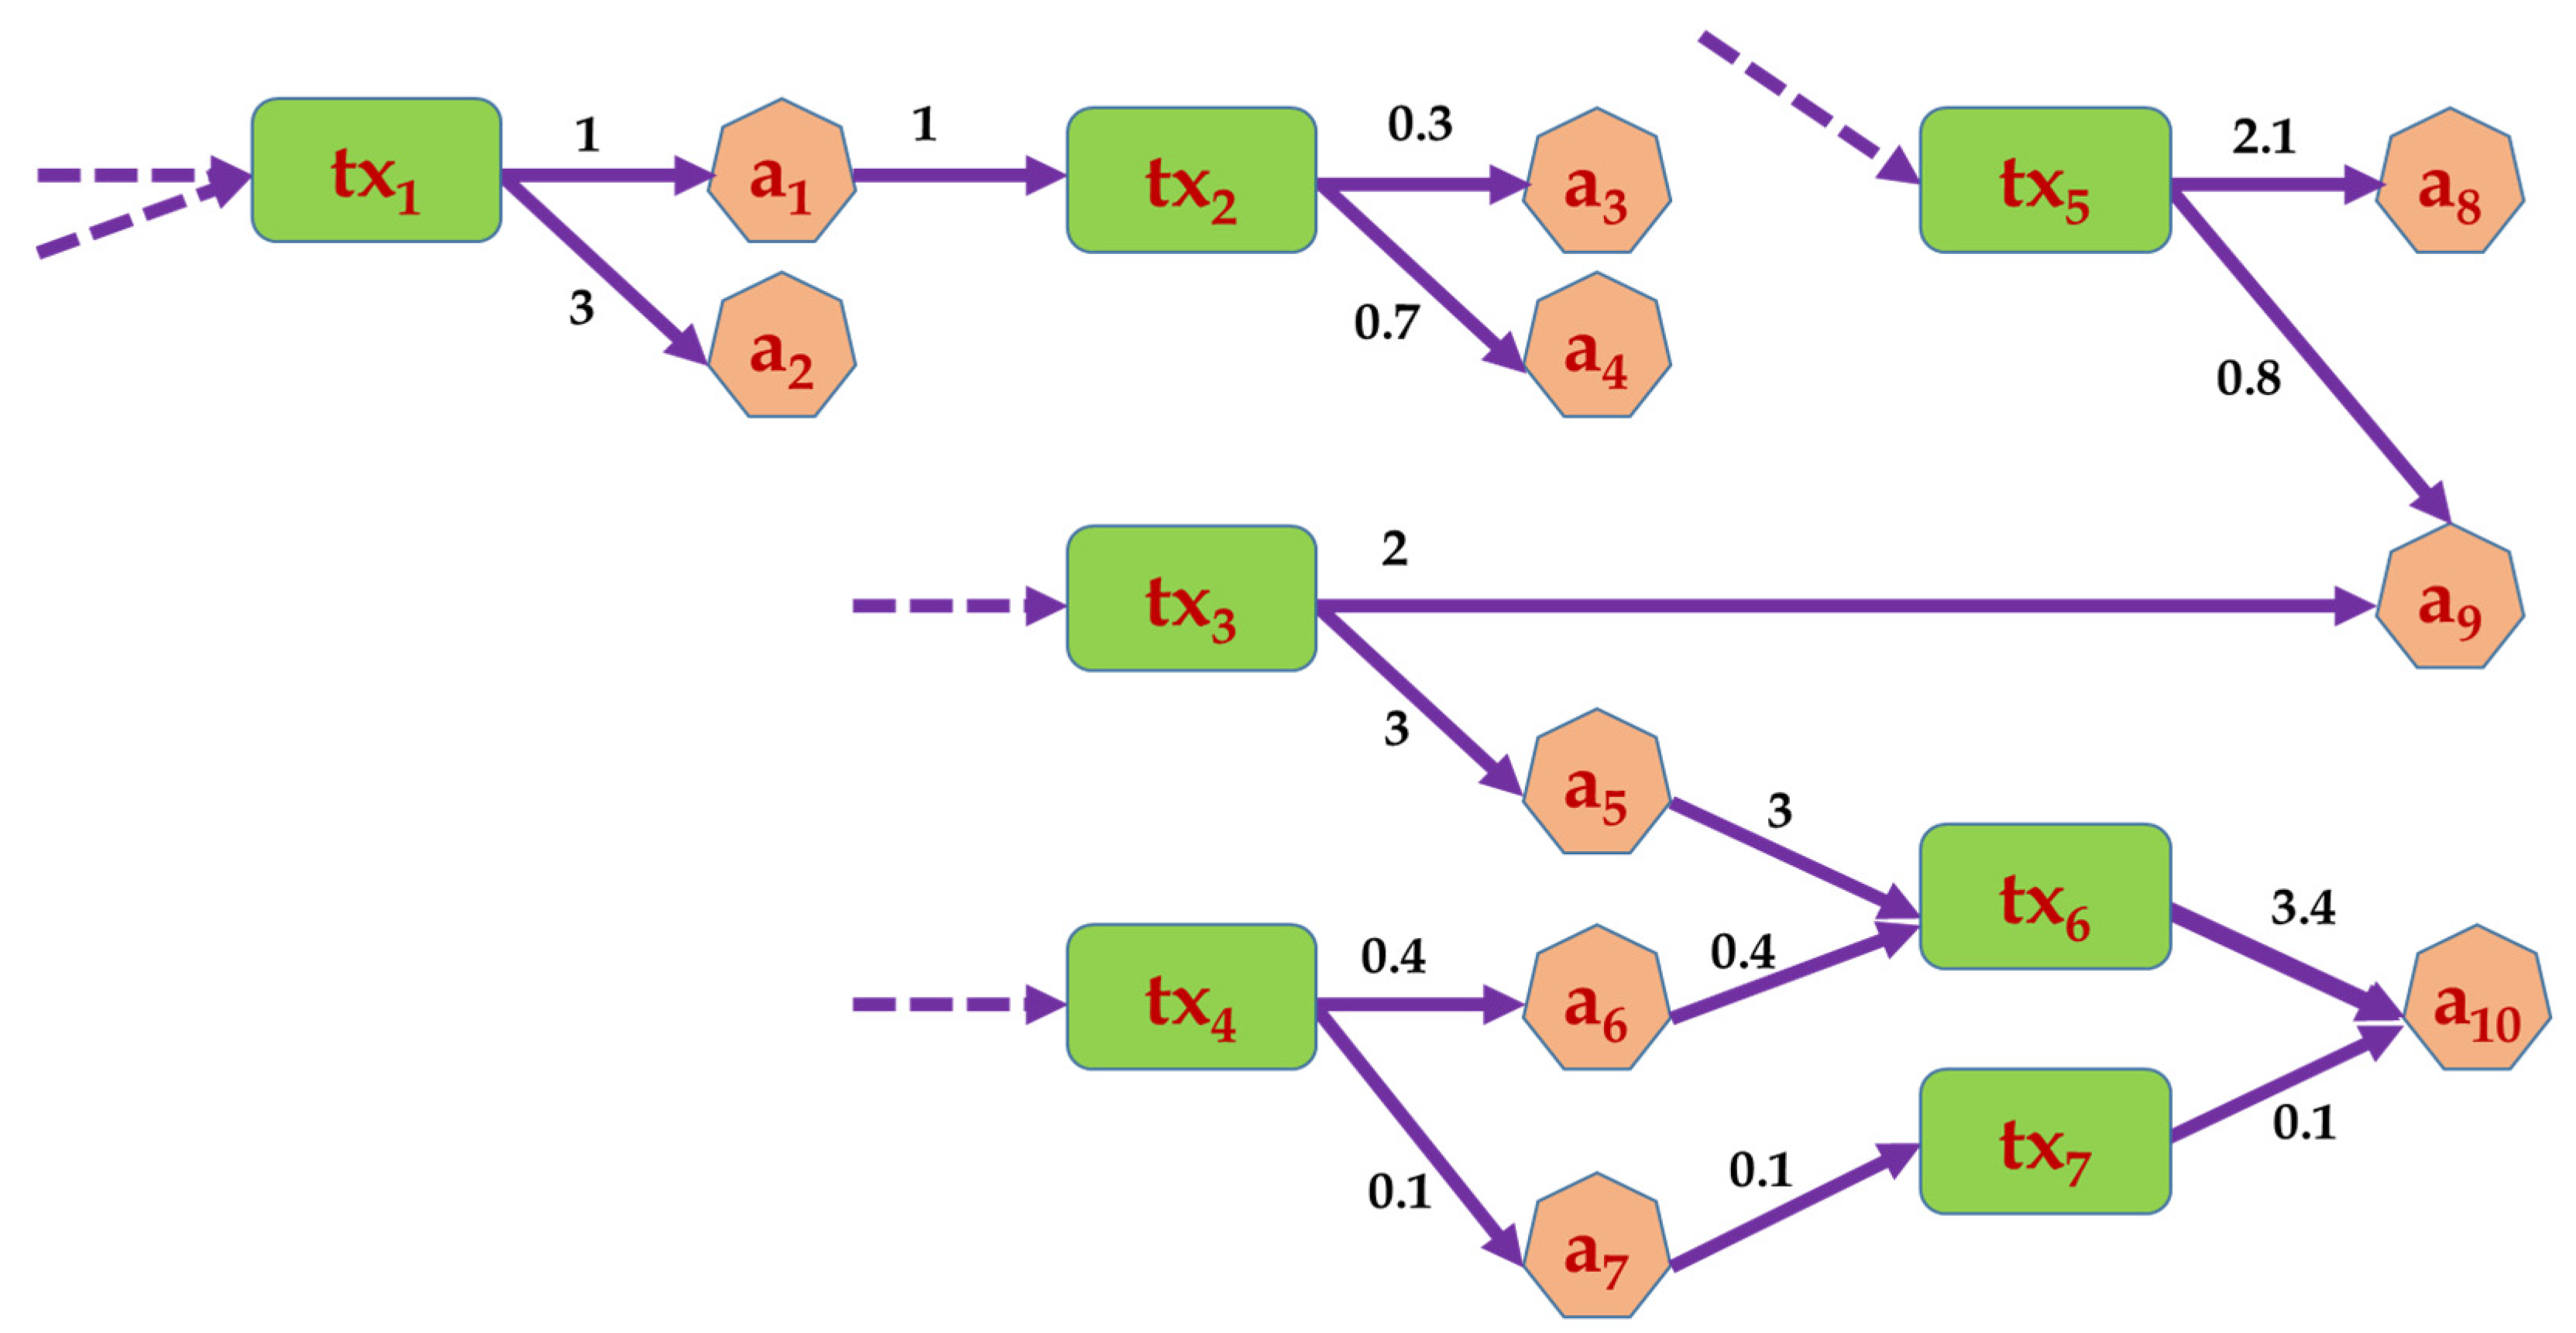
3.1. Dataset of Bitcoin Transactions

Bitcoin is a distributed digital currency system that records transactions in a distributed archive called a Blockchain [22]. The Bitcoin transactions dataset [23] is used to evaluate the performance of our system. This dataset contains address features on the heterogeneous Bitcoin network to identify ransomware payments. The authors have traced, downloaded, and analyzed the whole graph of Bitcoin transactions for ten consecutive years (January 2009 to December 2018) [23]. They have extracted the daily transactions on the network and formed the Bitcoin graph using a time interval of 24 hours. Since ransomware values are usually above the B0.3, the authors have filtered any network edge that transfers less than this threshold. Ransomware addresses are taken from three widely adopted studies: Montreal, Princeton, and Padua. For full information about the creation and preparation of this dataset, we refer the reader to the BitcoinHeist article [23]. However, a sample Bitcoin transactions’ graph which has been used by the authors is provided in Figure 3 below. In this figure, the authors consider a toy network of 10 addresses and 7 transactions where dashed edges indicate transaction outputs from earlier windows; t1, t3, t4, and t5 are starter transactions. Coin amounts are shown on the edges, and the transaction outputs are equal to transaction inputs, i.e., transaction fees are 0.
As a result of their tracing model, they end up with a dataset of 2,916,697 records (around 3 million records). Each record is attributed 10 features, including Bitcoin address (categorical data), year (numerical data), day of the year (numerical data), the length (numerical data), weight (numerical data), count (numerical data), looped (numerical data), neighbors (numerical data), income (numerical data), Satoshi amount (numerical data), and the label feature (numerical data), Category String. For the class label, the dataset considers either the white transaction (normal) accumulating 2,875,284 of the total number of records, or the ransomware transaction (anomaly) accumulating 41,413 records distributed into three different ransomware families of 28 attacks. The statistical specifications of the dataset are provided in Table 1, considering all class labels provided in the dataset. Based on the table, the statistical distribution of records between families seems to be almost balanced, with 13,163 Montreal Family, 12,402 Padua Family, and 15,848 Princeton Family.

3.2. System Modeling

The classification process is an intelligent task that predicts the class label of a given data record by utilizing machine learning algorithms [24]. Machine learning algorithms used to build predictive modeling to approximate the mapping for the target output based on a number of features are called supervised machine learning models [25]. Bitcoin transactions identification is a typical example of classification tasks that requires the engagement of supervised machine learning algorithms to build a predictive model to uncover anomalies (i.e., ransomware payments) and classify the bitcoin payments over heterogeneous bitcoin networks. Like any financial system, bitcoin data is temporal in nature, as transactions are time-stamped. Thus, several labeled historical market data can be collected and afforded to train the bitcoin predictive model and test the accuracy of the machine learning models in the bitcoin transactions system.
In this paper, we consider bitcoin transaction recognition as a transaction classification problem to identify and classify the ransomware payments for heterogeneous bitcoin networks. Specifically, we are concerned in experimentally examining and designing a learning-based self-reliant classification scheme that learns and investigates the prescribed features of bitcoin payment transactions to recognize trustworthy and ransomware payments for better-quality cryptocurrency practices and transactions. More precisely, our system development is composed of five stages, as illustrated in Figure 4.

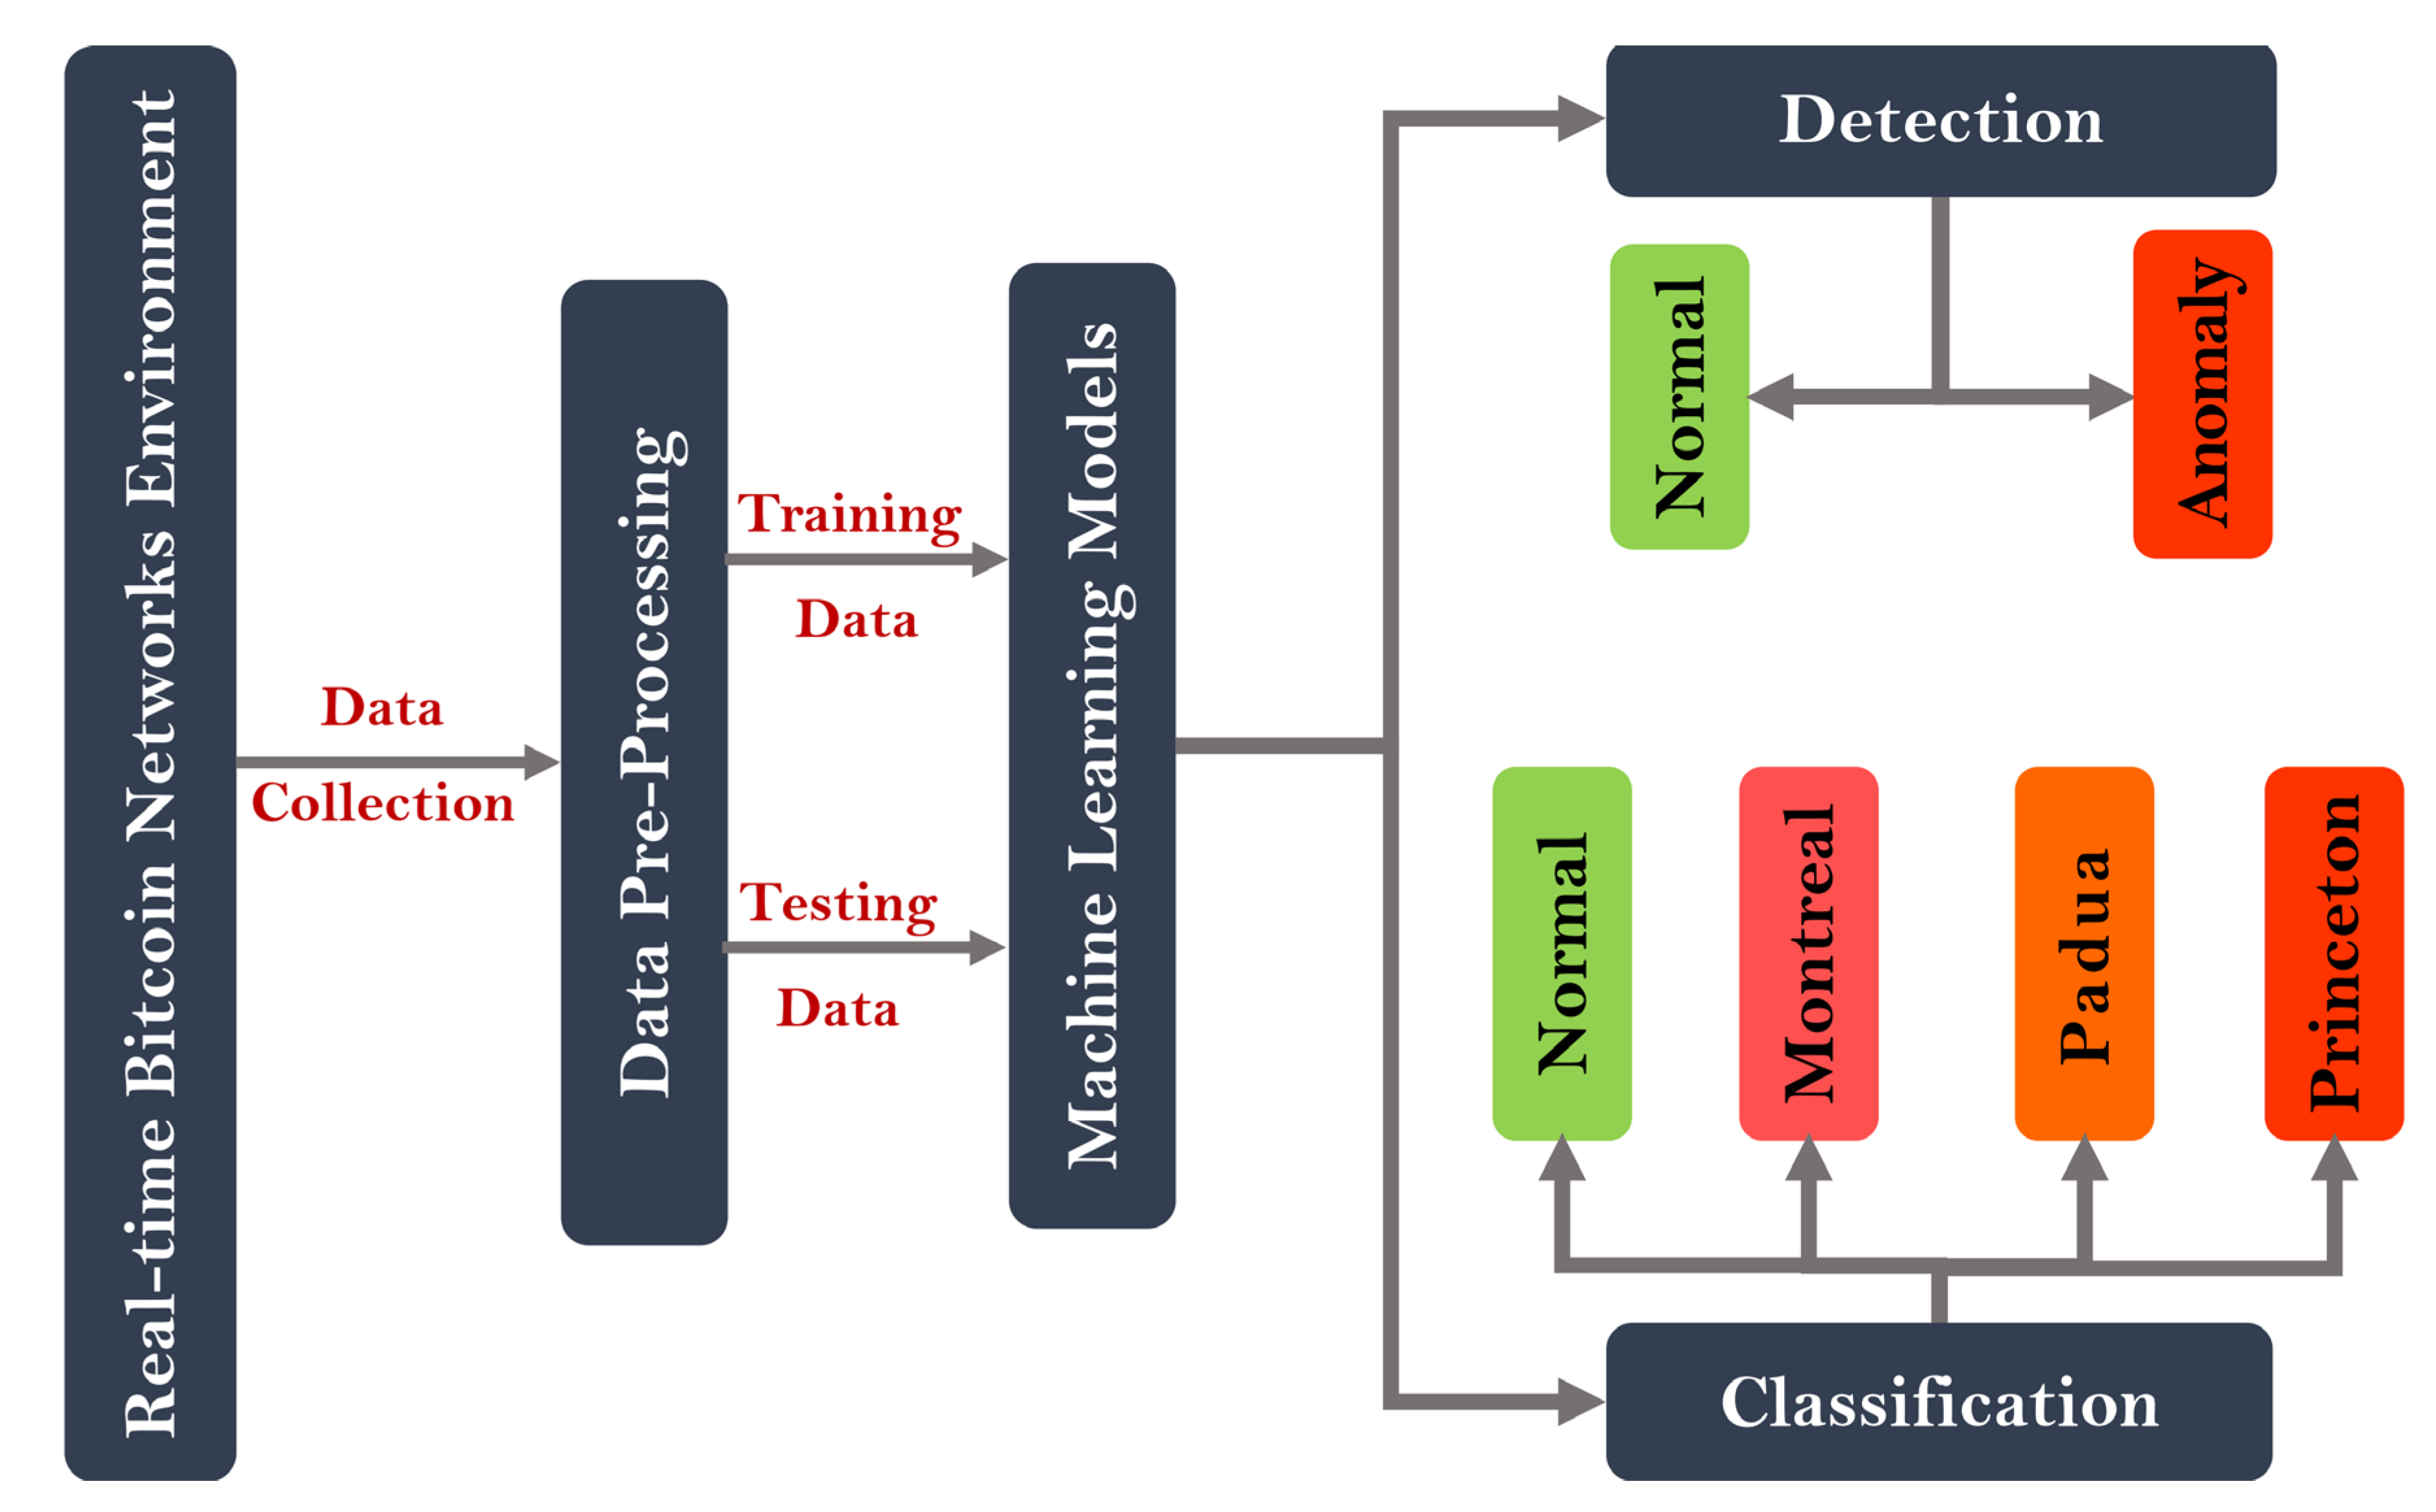
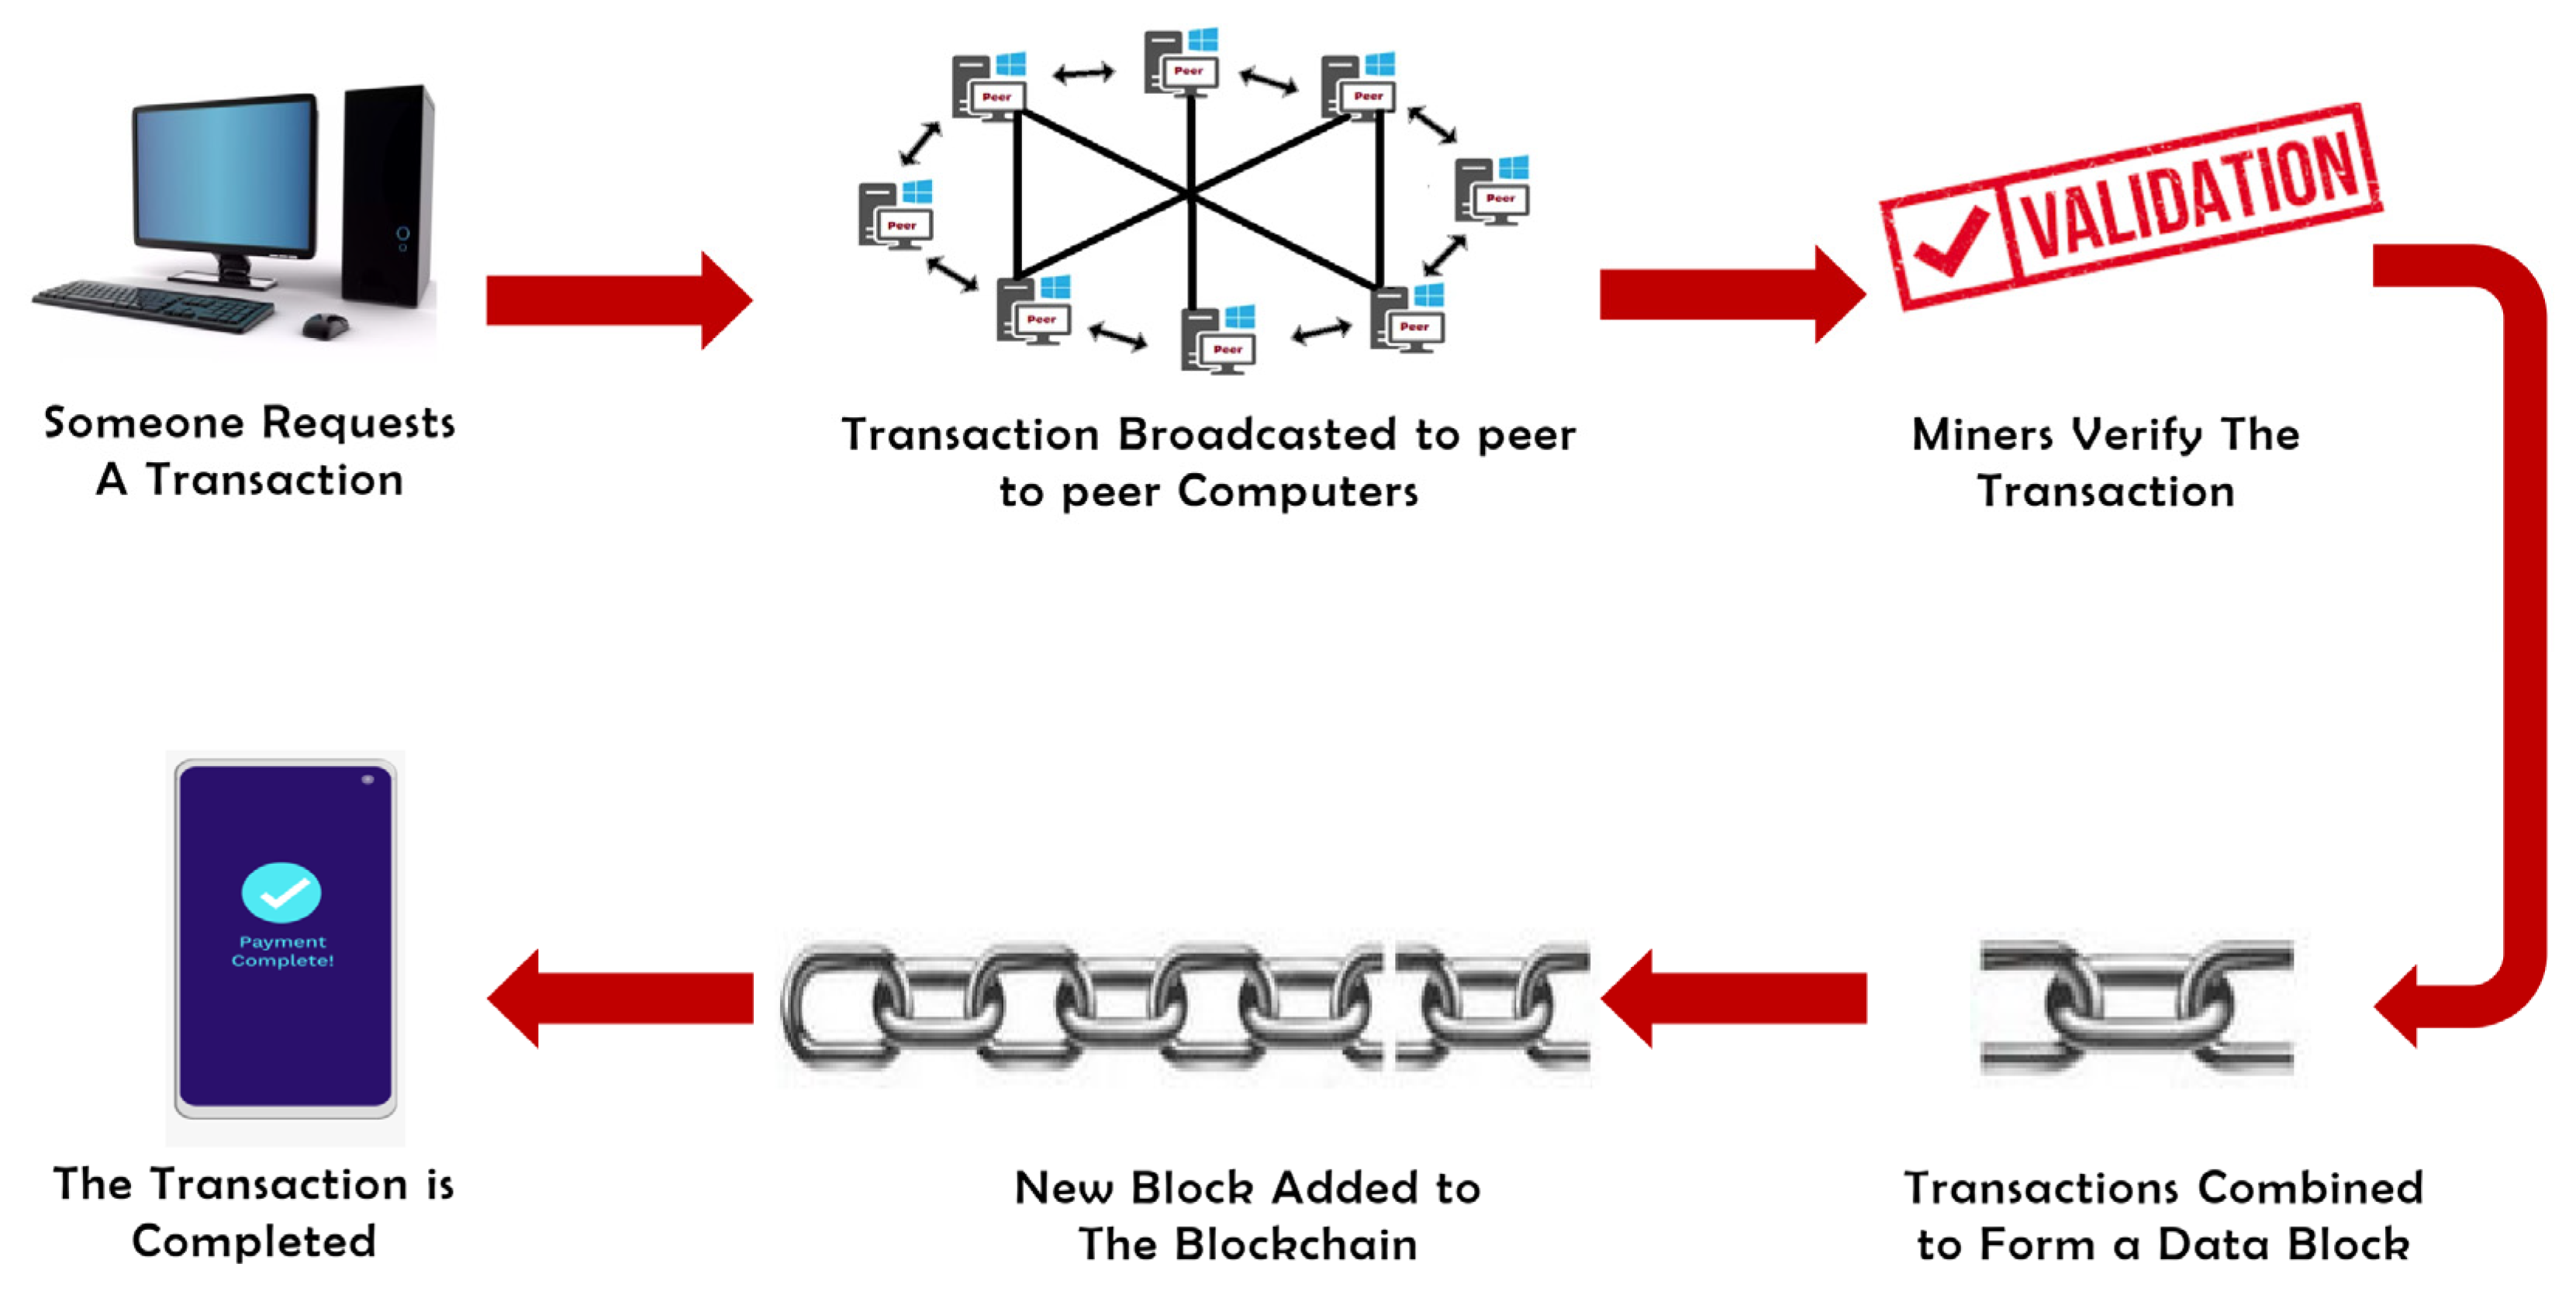
3.2.1. Data Collection Stage

Data collection is a systematic process of gathering accurate observations in the forms of records from a diversity of adequate sources to develop data analytics models that can be used to address research questions, validate experimental outcomes, and develop prediction models as well as draw insights to help decision-makers. Managing and analyzing data have always offered the greatest benefits and the greatest challenges for organizations of all sizes and across all industries.
In this paper, the data records for the bitcoin transactions dataset have been originally assimilated and collected from the internet environment of several heterogeneous bitcoin payments networks before getting arranged into systematically structured datasets. Specifically, the bitcoin transaction dataset has been downloaded and parsed from the entire bitcoin transaction networks on a daily basis for 10 consecutive years (from 2009 January to 2018 December). As a result, ransomware addresses are taken from three widely adopted studies, namely: the Montreal family, Princeton family, and Padua family, in addition to the normal transactions. To gain more insight into the single bitcoin transaction, Figure 5 shows the bitcoin payment transaction life-cycle from the transaction request to the transaction response.

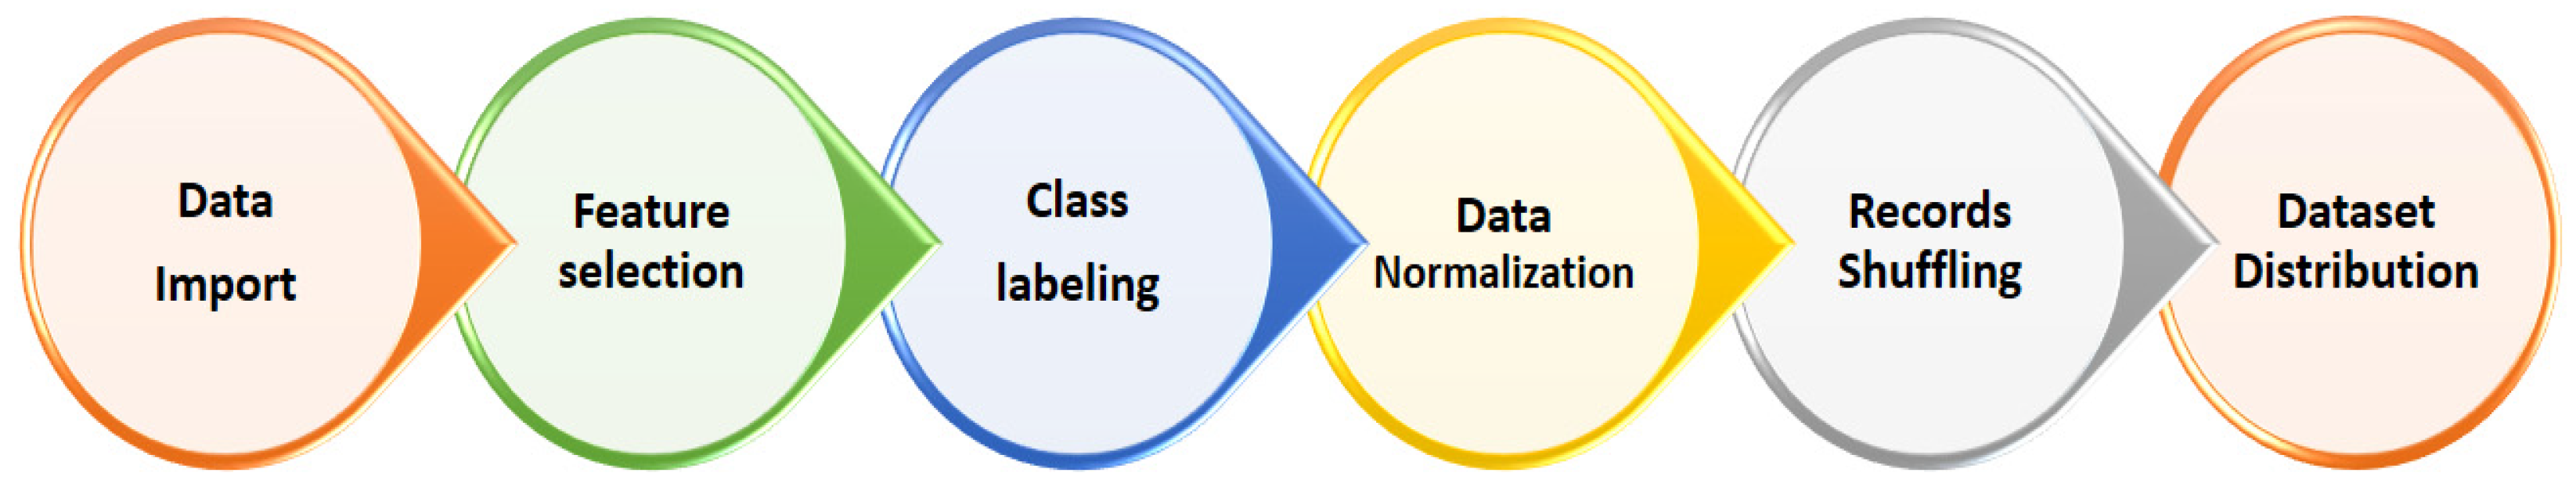
3.2.2. Data Preprocessing Stage

This stage concerns applying a consecutive set of transformation processes over the data records to bring them into a form that can be easily interpreted by the machine learning techniques [26]. In other words, the features of the data can now be easily interpreted by the algorithm. Specifically, Figure 6 illustrates the preprocessing stages performed at this stage.
  • Data Import: this operation is the first operation of the predictive model. It is responsible for reading the original dataset of the CSV (Comma-Separated Values) file format into MAT (MATLAB data units) as a matrix of the double data-type.
  • Feature selection: this operation concerns selecting the most adequate attributes (i.e., variables or columns) and eliminating any inadequate attributes from the dataset of the classification task at hand.
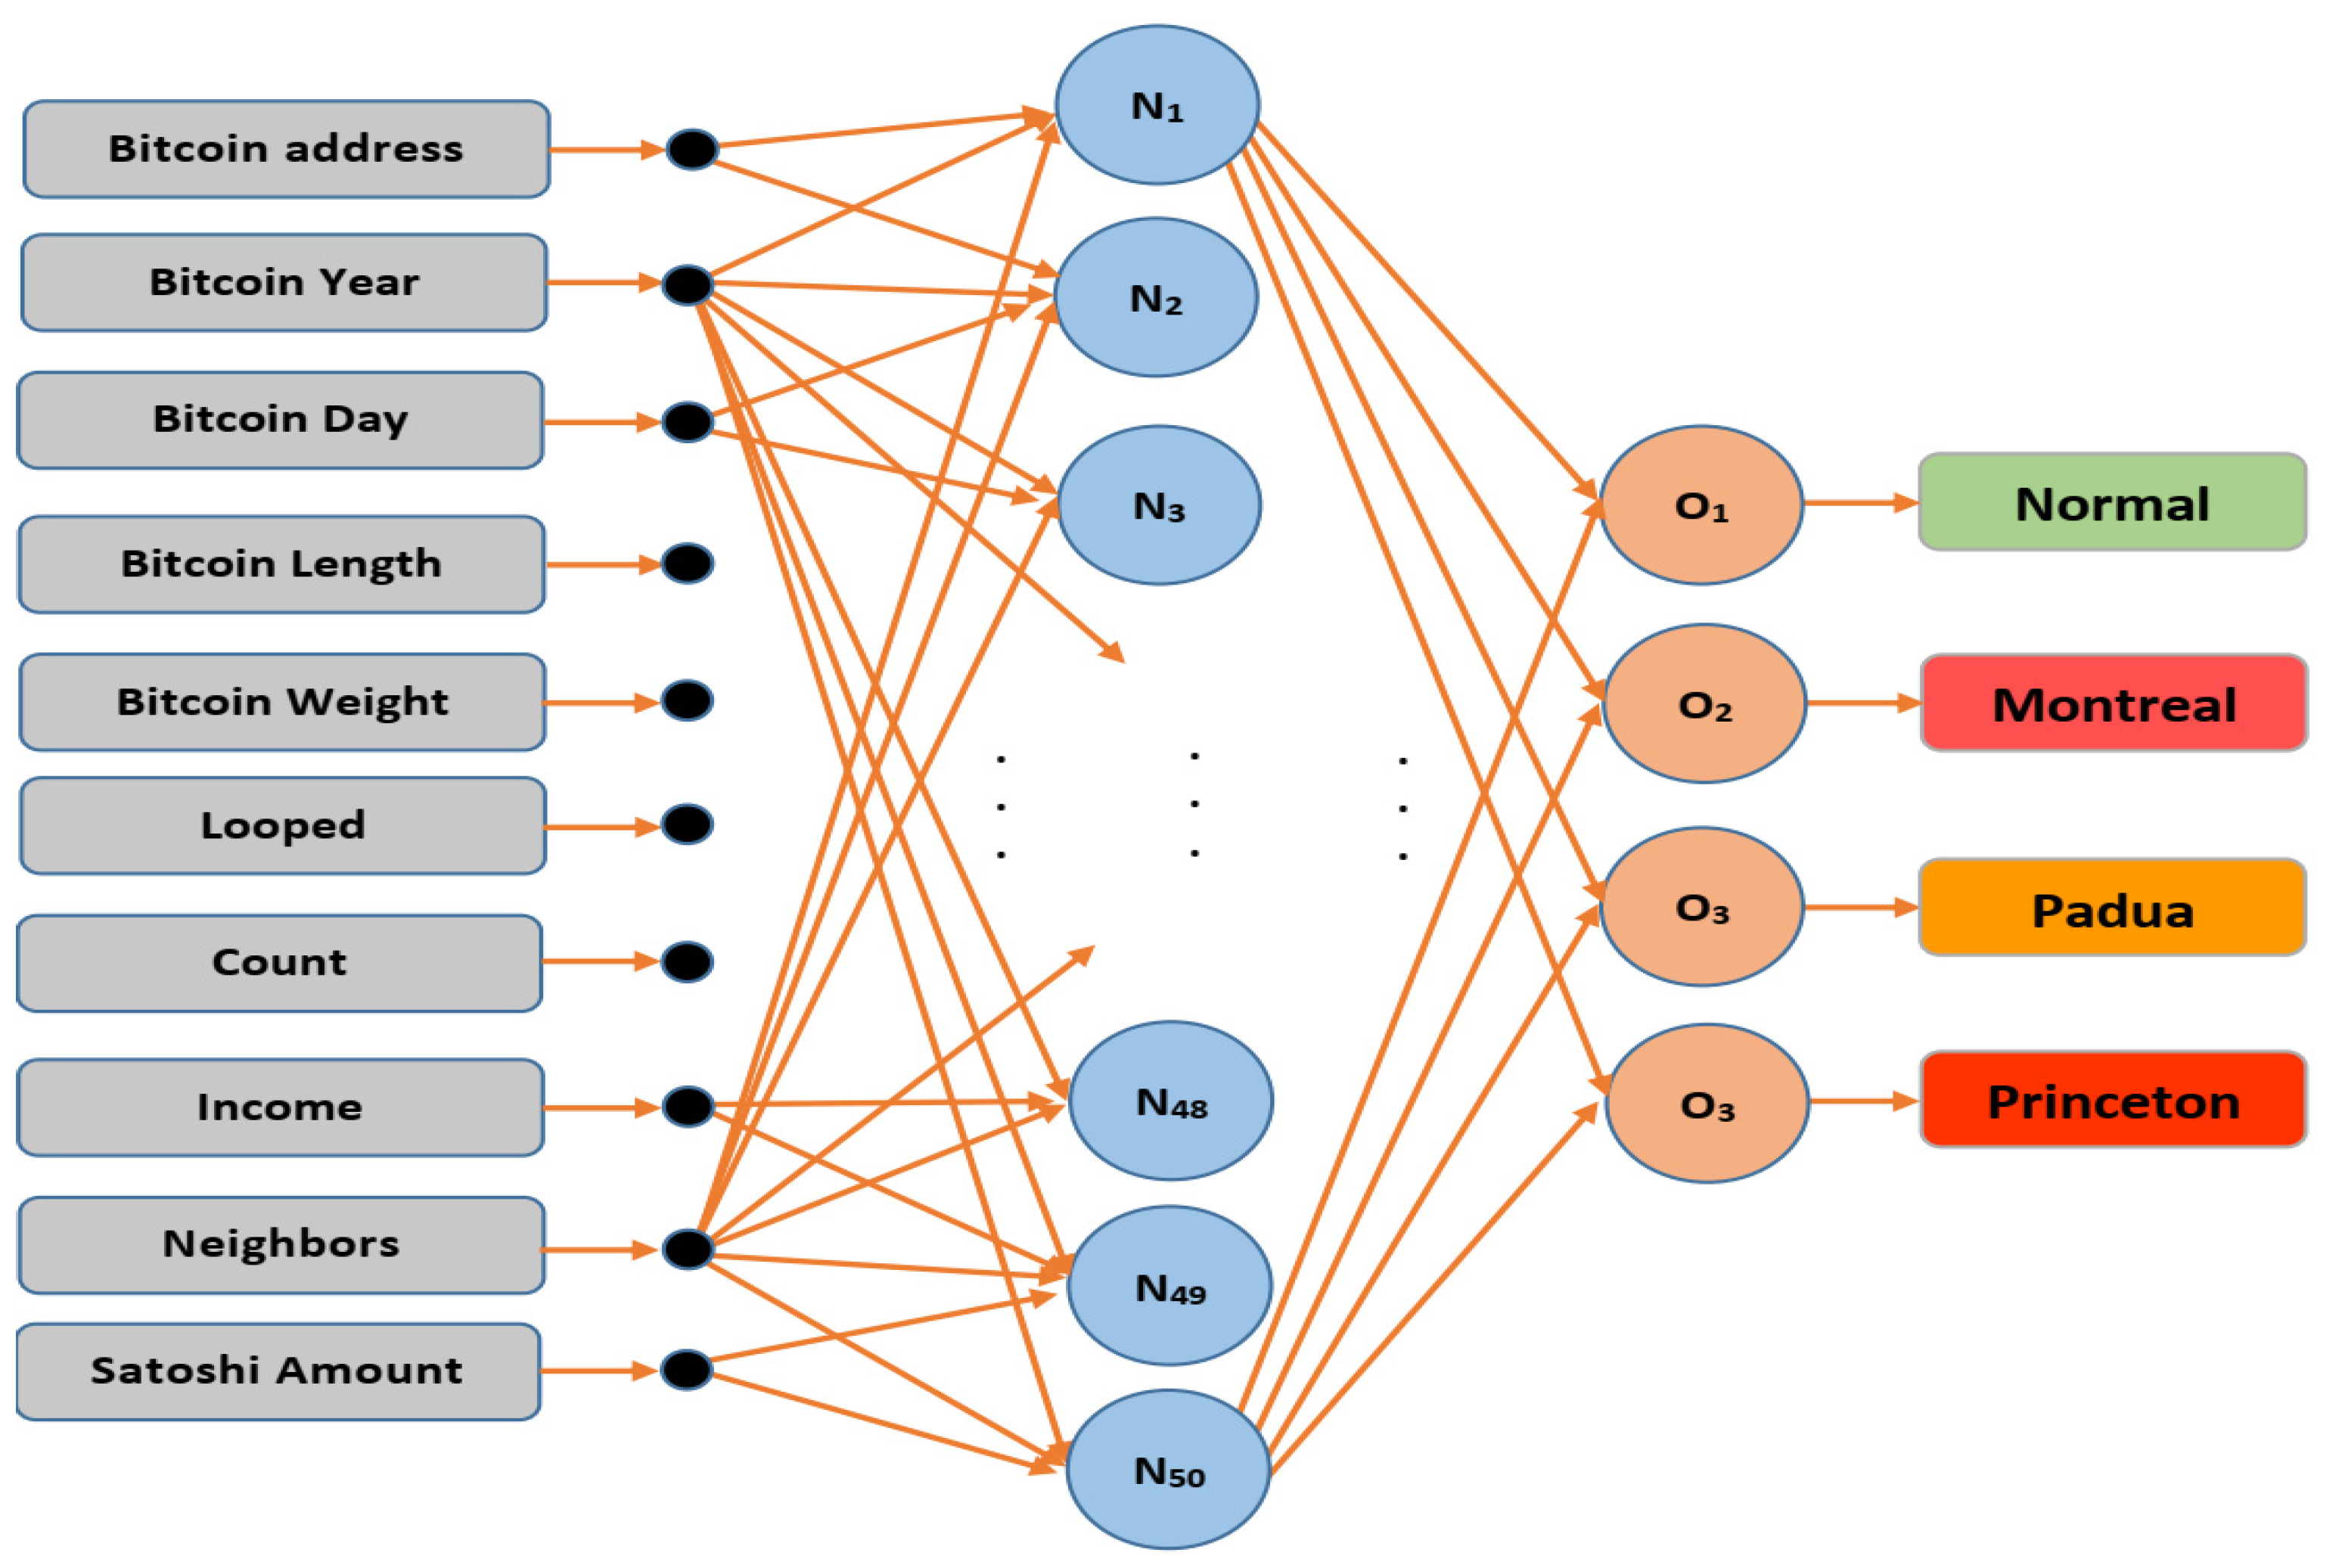
  • Class Labeling: this operation concerns transforming the categorical (text) data records of the class feature into numerical data records that can be fed and manipulated by machine learning techniques. In the ODT model, the integer encoding technique was used to encode the labels for the two-class model as (1) for the normal transaction and (2) for an anomaly transaction, as well as for the multiclass model as (1) for the normal transaction, (2) for Montreal ransomware, (3) for Princeton ransomware, and (4) for Padua ransomware. In the SNN model, one-hot encoding was used to encode the labels for the two-class model as (01) for a normal transaction and (10) for an anomaly transaction, as well as for the multiclass model as (0001) for normal transaction, (0010) for Montreal ransomware, (0100) for Princeton ransomware, and (1000) for Padua ransomware.
  • Data Normalization: this operation concerns normalizing all integer quantities of the dataset matrix into a range between 0 and 1 using min–max normalization [26]. Min–max normalization changes the values of numerical data in the dataset to be on a common scale without losing any information.
  • Records Shuffling: this operation concerns mixing up the dataset records while preserving the logical relationships between dataset features. The shuffling algorithm is performed randomly, and it helps in enhancing the classifier classification by avoiding any biasing toward specific data labels into the dataset [24].
  • Dataset Distribution: this operation concerns randomly dividing dataset targets into three datasets as follows: Training dataset (70% of the original dataset) used for model learning (training), Validation dataset (5% of the original dataset) used to validate the model during the learning process, and Testing dataset (25% of the original dataset) used to test the model prediction and calculate prediction accuracy (for detection and classification).

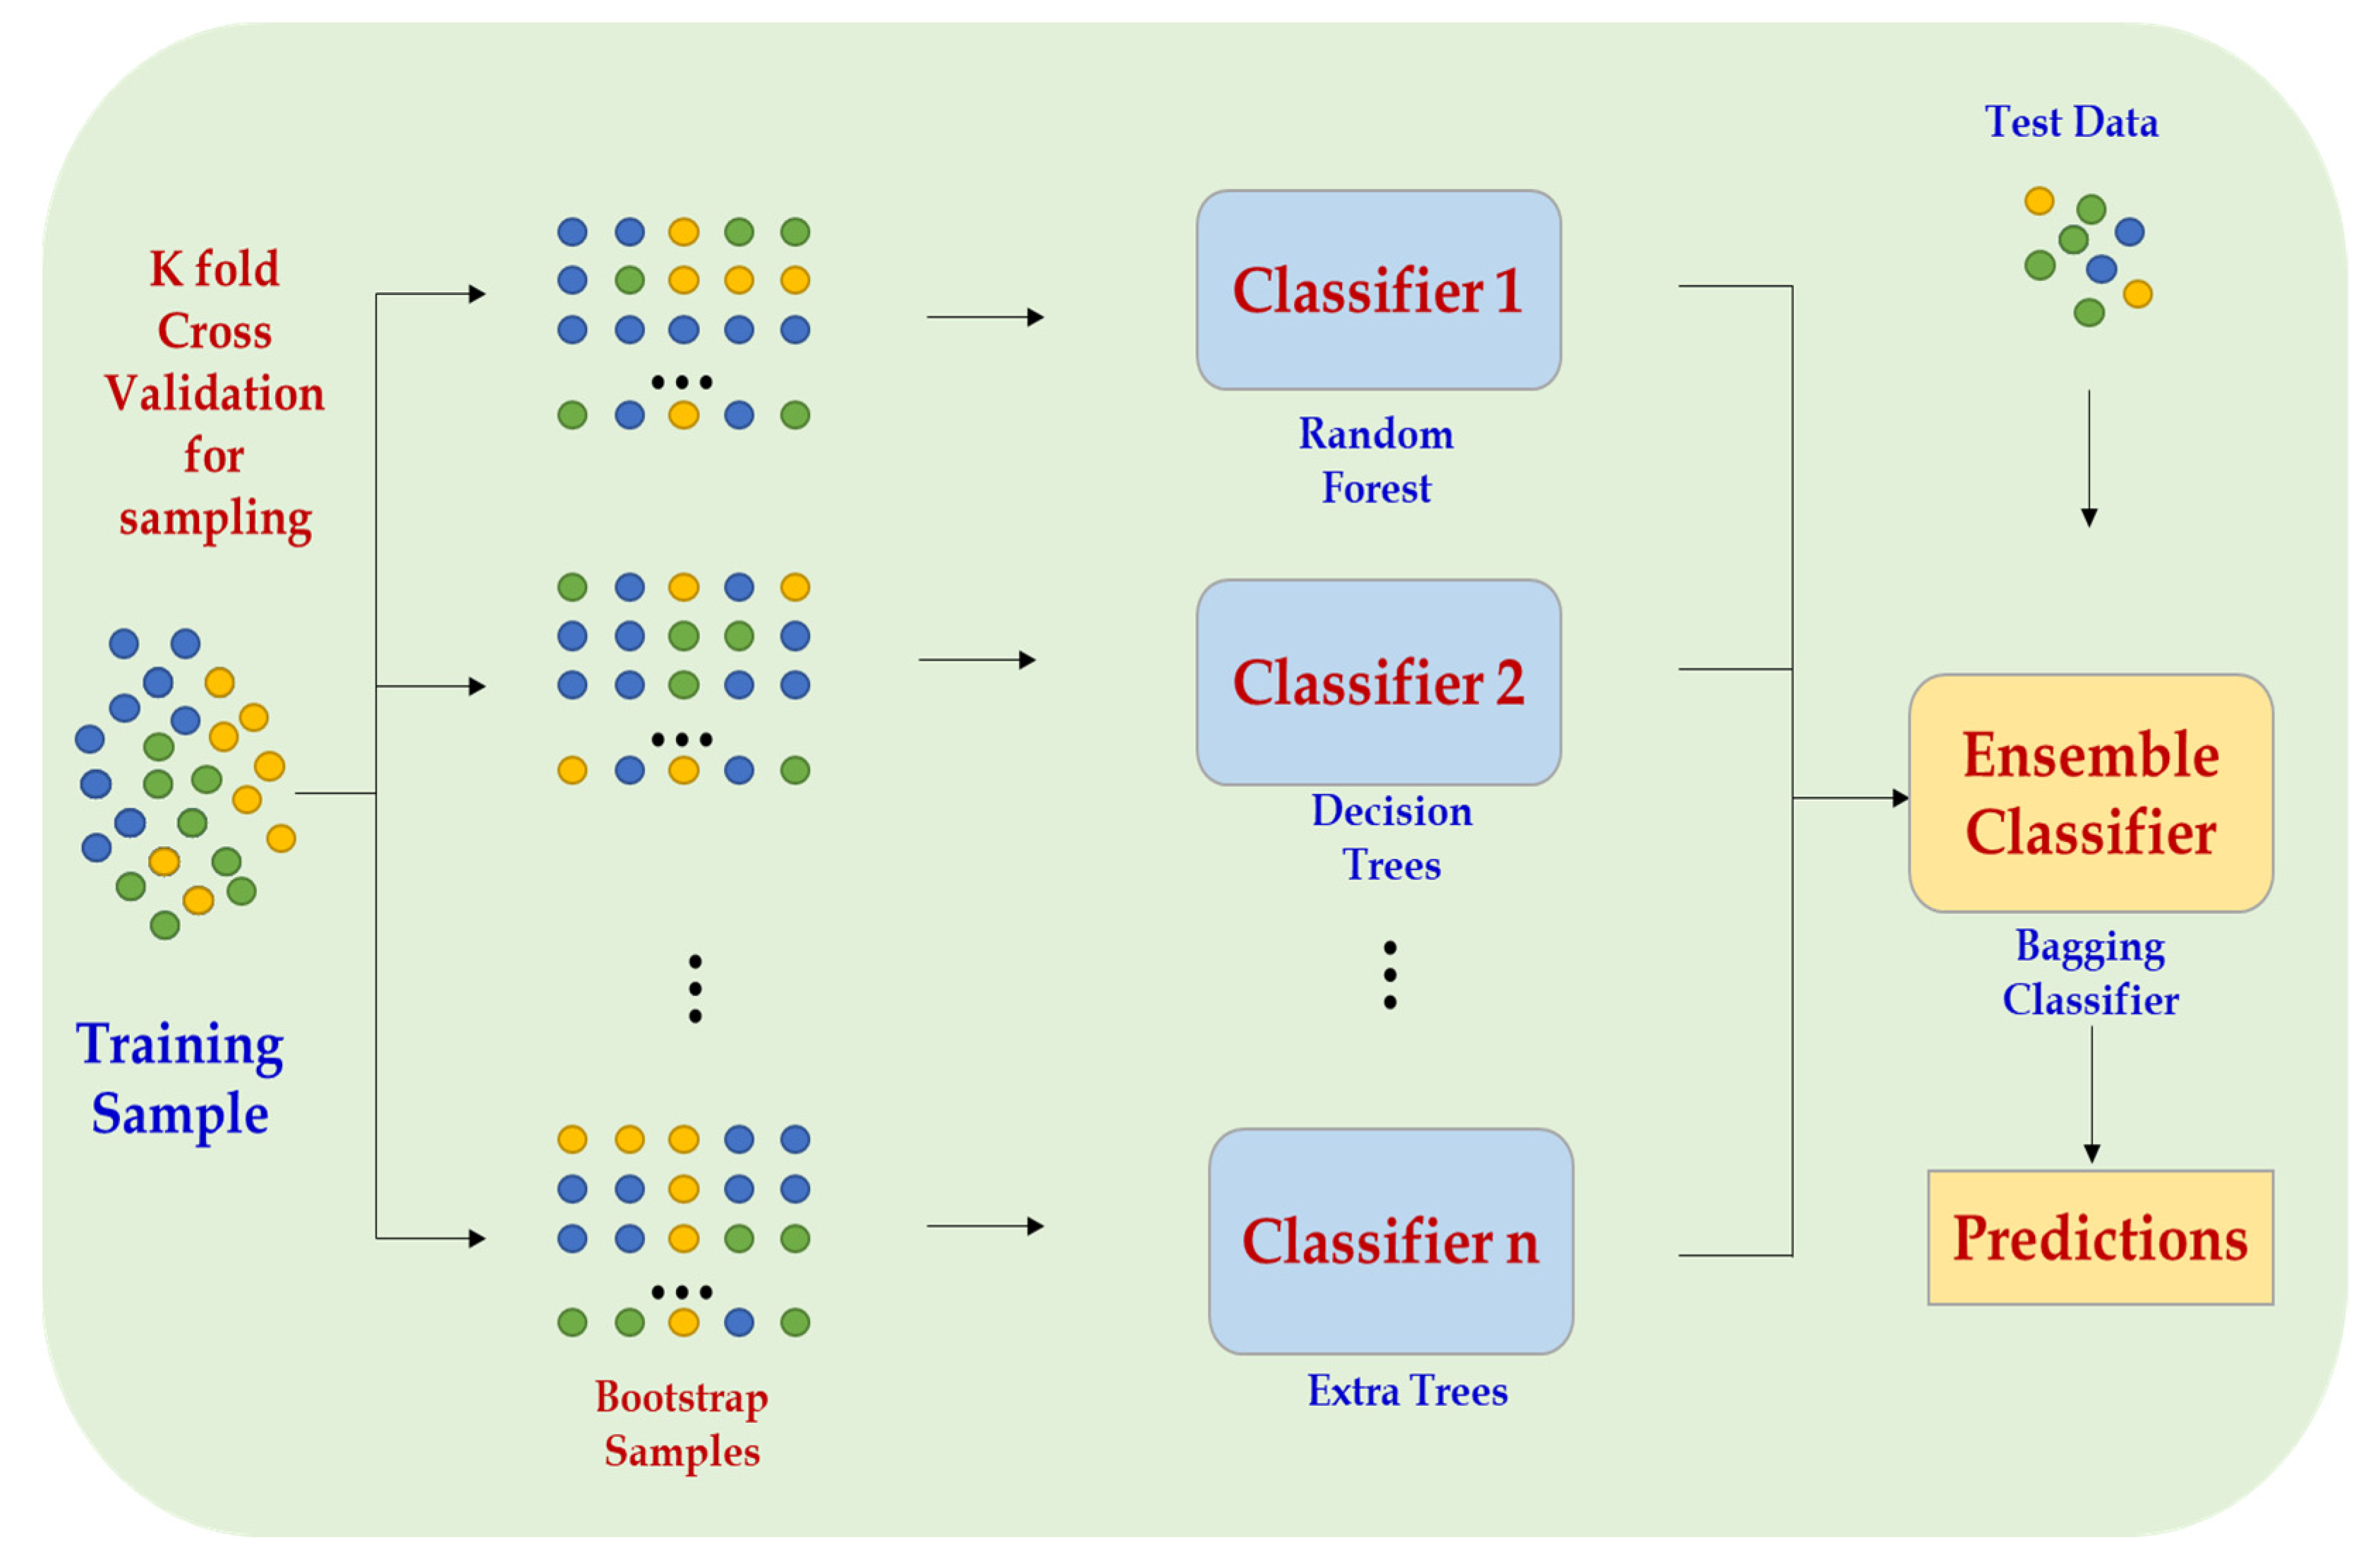
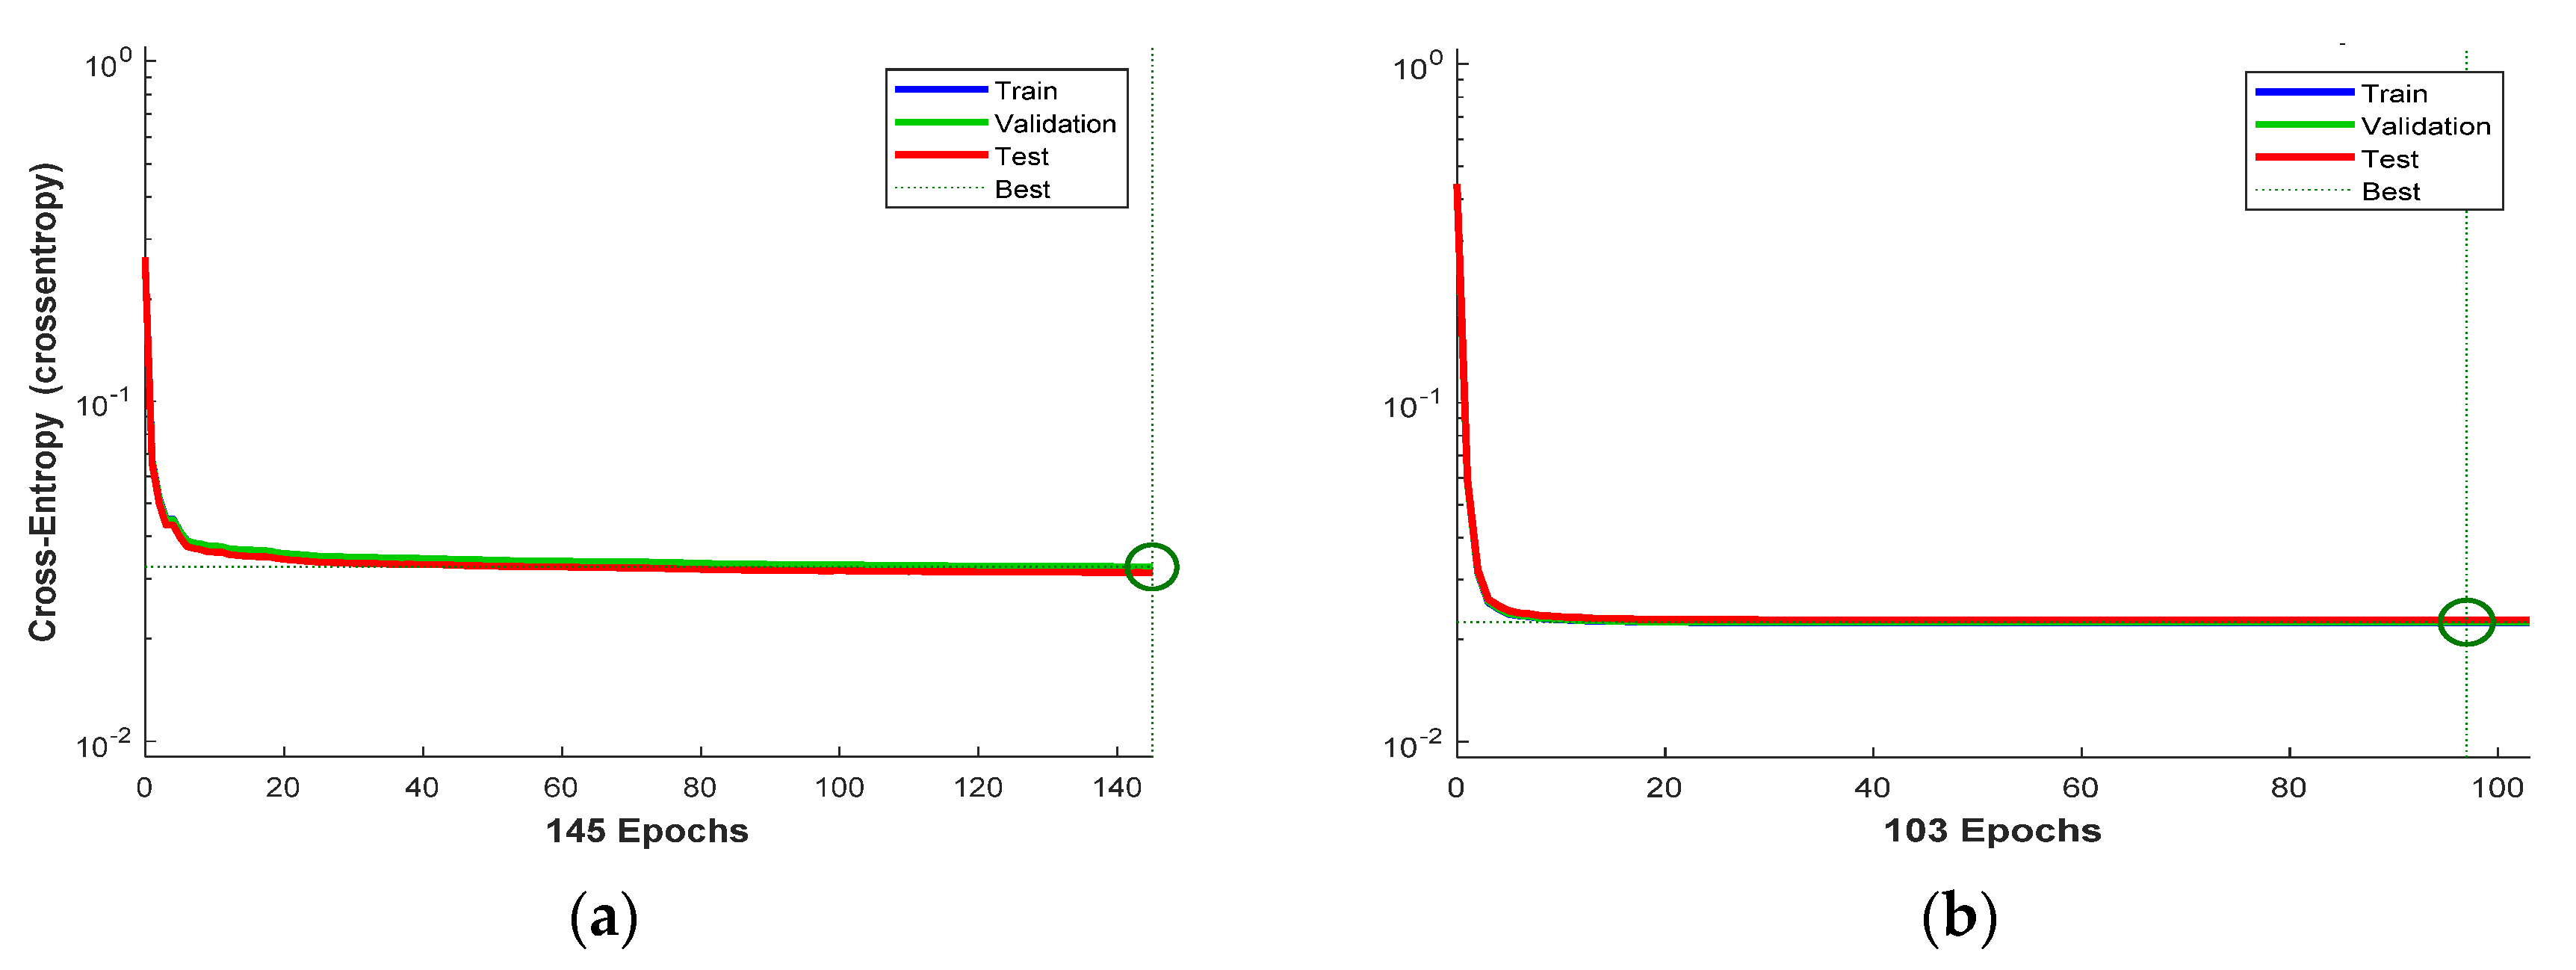
3.2.3. Machine Learning Stage

The machine learning stage is the principal stage of this predictive model, where the whole learning process for the data pattern takes place. Two supervised machine learning mechanisms were utilized in this work to construct the classification models, namely, shallow neural networks (SNNs) and optimizable decision trees (ODT).
Shallow Neural Network (SNN) is a feedforward multilayer Perceptron (MLP) neural network that is widely used in pattern recognition and classification tasks in different artificial intelligence and machine learning applications [27]. In SNN, data records acquainted with the neural network pass through an individual hidden (processor) layer to process the pattern recognition task and provide the output proration for each class label at the output layer. Figure 7 illustrates the SNN model architecture developed in this classification task. In this figure, we show only the model for the multiclass classification. For the detection model, the only difference is to replace the output layer with two neurons instead of four neurons to provide the probabilistic values for the two classes (normal vs. anomaly). According to the figure, our SNN has 8 features that are provided by the dataset to be fed at the input layer of the SNN and then processed at 50 neurons of the hidden/processor layer in advance to compute the numerical probabilities for the 4 classes at the output layer represented by the four neurons corresponding to the four labels.
Decision trees are a well-known supervised machine learning technique that are widely used to perform classification tasks with high-performance classification accuracy. The bagging classifier algorithm (also known as Bootstrap Aggregation Decision trees) [28] is used mainly to decrease the discrepancy of a decision tree by generating a number of subgroups of data records from training datasets that are selected randomly with replacement. Then, every subgroup of data records is employed to train their decision trees. Consequently, the process will result in an ensemble of different models. Finally, the mean value of all the predictions from all decision trees is computed to produce one overall robust decision. Since the ODT model has a vast amount of tree splits, it is not feasible to be shown in a normal figure. Alternatively, we are illustrating the process flow in Figure 8 to show how the bagging decision tree classifier works in the classification tasks [29].

3.2.4. Detection and Classification Stages

This stage concerns the final output layer of our predictive model, where two modes of operations are used at the output layer of our predictive model, including:
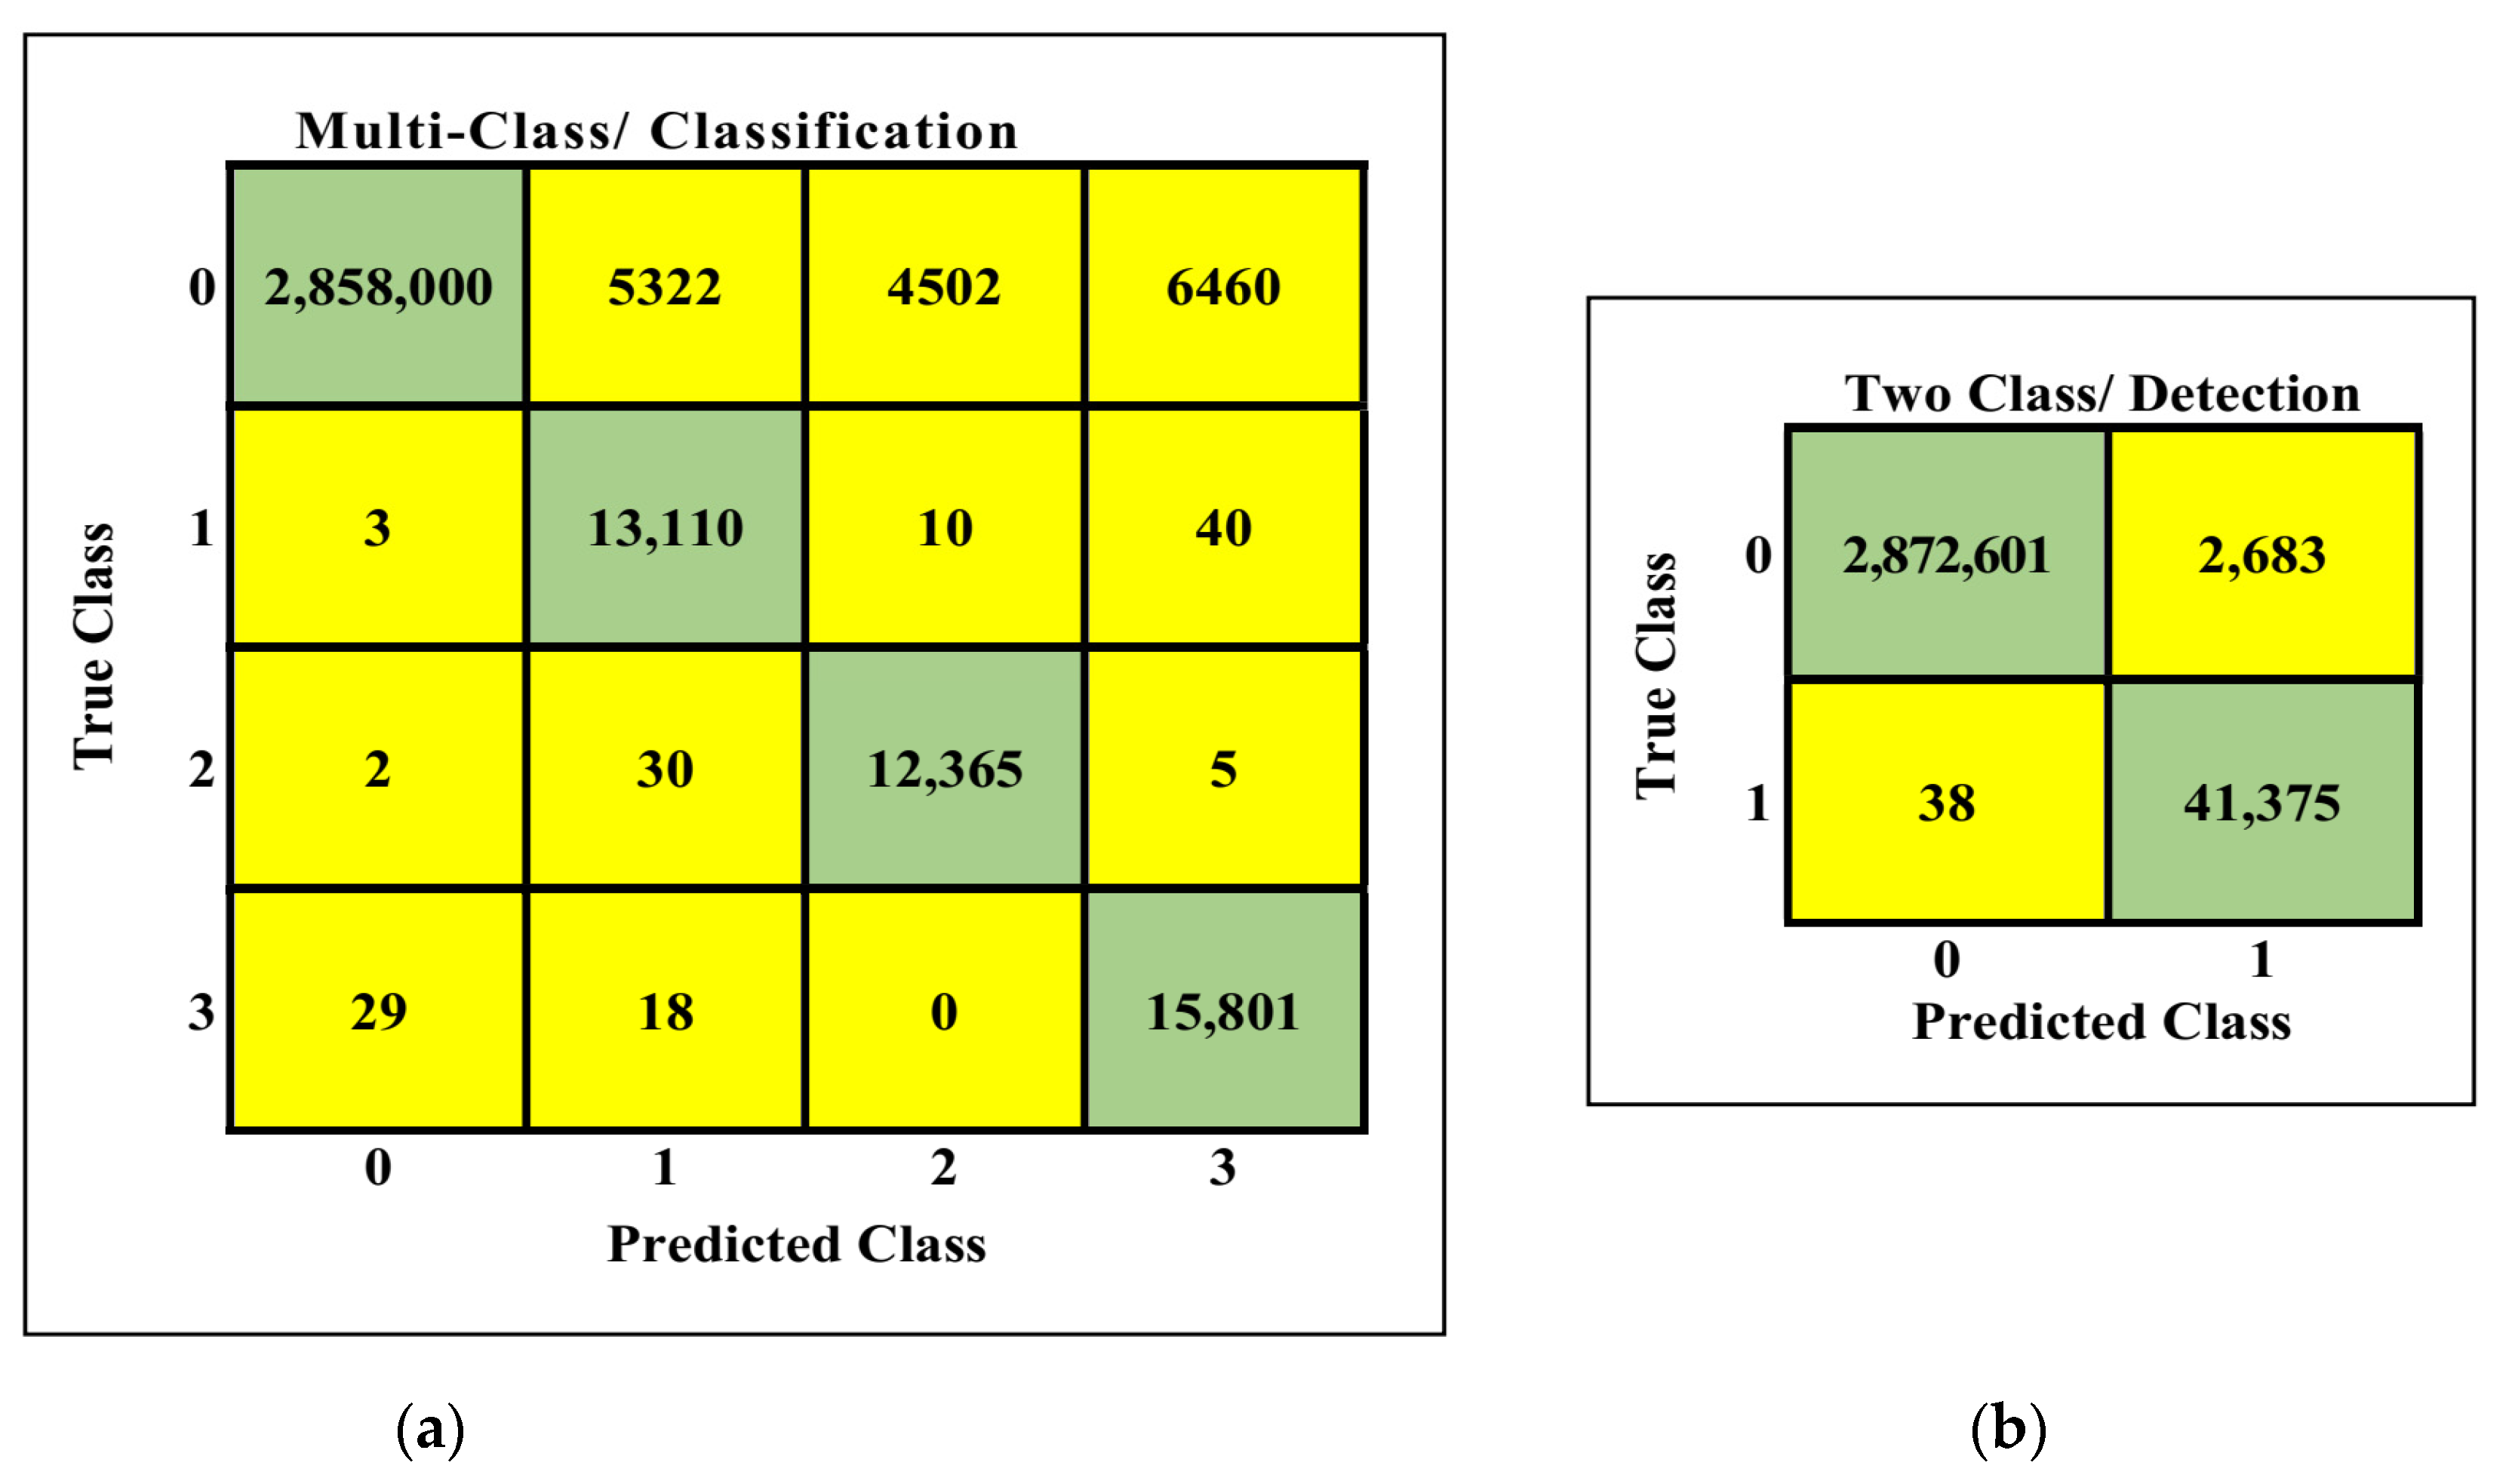
  • Detection Mode: Produce the output using a two-class classifier as a normal transaction or anomaly transaction, using either an ensemble classifier for the ODT model or a Sigmoid classifier for the SNN model.
  • Classification Mode: Produce the output using a four-class classifier as a normal transaction, Montreal ransomware, Padua ransomware, or Princeton ransomware, using either an ensemble classifier for the ODT model or Softmax classifier for the SNN model.

3.3. Development and Validation Environment

To implement and evaluate the proposed Bitcoin attacks detection and classification models, the training and testing phases were performed on the Bitcoin Transactions 2020 dataset comprising the main ransomware attacks against heterogeneous bitcoin networks. In addition to the two aforementioned machine learning models (i.e., SNN and ODT), two classifier schemes were implemented; two classes (ransomware detection) or four classes (ransomware classification). The models mentioned above have been developed using MATLAB 2020b computing platform utilizing our high-performance commodity machine operating with multiprocessing CPU system with multicore NVIDIA GPUs system. Finally, to sum up, Table 2 provides a brief description of the experimental environment configurations and considerations.

4. Results and Discussion

In this paper, we propose machine learning-based predictive models to automate the detection and classification for bitcoin payment transactions in heterogeneous bitcoin networks. The models have been trained and tested using a comprehensive, up-to-date, and large dataset comprising 29 different types of bitcoin payment transactions grouped into two categories (normal vs. anomaly) used for the detection model or four categories (normal, Montreal, Padua, Princeton) for the classification model. In order to analyze the effectiveness of the proposed predictive models, we have evaluated their performance using several evaluation metrics to provide more insights about the performance of proposed predictive models.
To begin, Figure 9 illustrates the performance analysis trajectories for Figure 9a, the SNN based detection system and Figure 9b, the SNN based classification system. The cross-entropy loss/cost function has been investigated in both classifiers to track the status for misclassification error for the validation/testing phases. Cross-entropy loss/cost function functions are used to optimize the classification models during training, aiming to minimize the loss function. Normally, the lower the loss, the better the model. Consequently, the best validation performance for the detection system has been recorded at epoch 145 with a 0.0325 value of cross-entropy loss, while the best validation performance for the classification system has been recorded at epoch 97 with a 0.0225 value of cross-entropy loss. Therefore, both models performed as near-perfect models, since their cross-entropy loss values are approaching 0 (≤0.1).
In addition, Figure 10 illustrates the performance analysis trajectories: Figure 10a, the ODT-based detection system and Figure 10b, the ODT-based classification system. The mean square loss/cost function has been investigated in ODT classifiers to track the status for minimum classification error during the 30 iterations of the learning process by tracking: (a) The estimated minimum classification error, (b) The observed minimum classification error, (c) The best point hyperparameters, and (d) The minimum error hyperparameters. Consequently, the best validation performance for the detection system has been recorded at iteration 19 with a 0.0012 value of minimum classification error, while the best validation performance for the classification system has been recorded at iteration 29 with a 0.0055 value of minimum classification error. Therefore, both models performed as almost perfect models since their minimum classification error values are almost 0 (≤0.01).
Moreover, Figure 11 illustrates the performance analysis using confusion matrix records for (a) the ODT-based detection system and (b) the ODT-based classification system (since ODT performed better, we show only the confusion matrix for ODT models). The confusion matrix is a summarized table of the number of correct and incorrect predictions yielded by the classification model for binary/multi-classification tasks [35]. Specifically, the confusion matrix provides records for four performance indicator metrics for every predicted class label: namely, the true positive record, which counts the number of samples the model correctly predicts for the positive class; the true negative record, which counts the number of samples the model correctly predicts for the negative class; a false positive record, which counts the number of samples the model incorrectly predicts for the positive class when the actual class is negative; and the false negative record, which counts the number of samples the model incorrectly predicts for the negative class when the actual class is positive [35]. Since the good classification model will normally generate confusion matrix results with large values across the diagonal and small values off the diagonal, this shows that our predictive models are high performant models for both detection and classification, especially for the models build using optimizable decision trees. Besides, Figure 12 shows the organization we followed in our confusion matrices along with the formulas used to calculate the corresponding metrics (Precision, Recall, Accuracy). Please note that TP and FP correspond to the ransomware records (the minority class) while TN and FN correspond to the normal records (the majority class).
Furthermore, based on the results obtained for the confusion matrix, Table 3 summarizes the model evaluation metrics [35] for (a) the ODT based detection system and (b) ODT based classification system, in terms of:
  • Error (ERR): The proportion of misclassified samples with respect to the total number of samples.
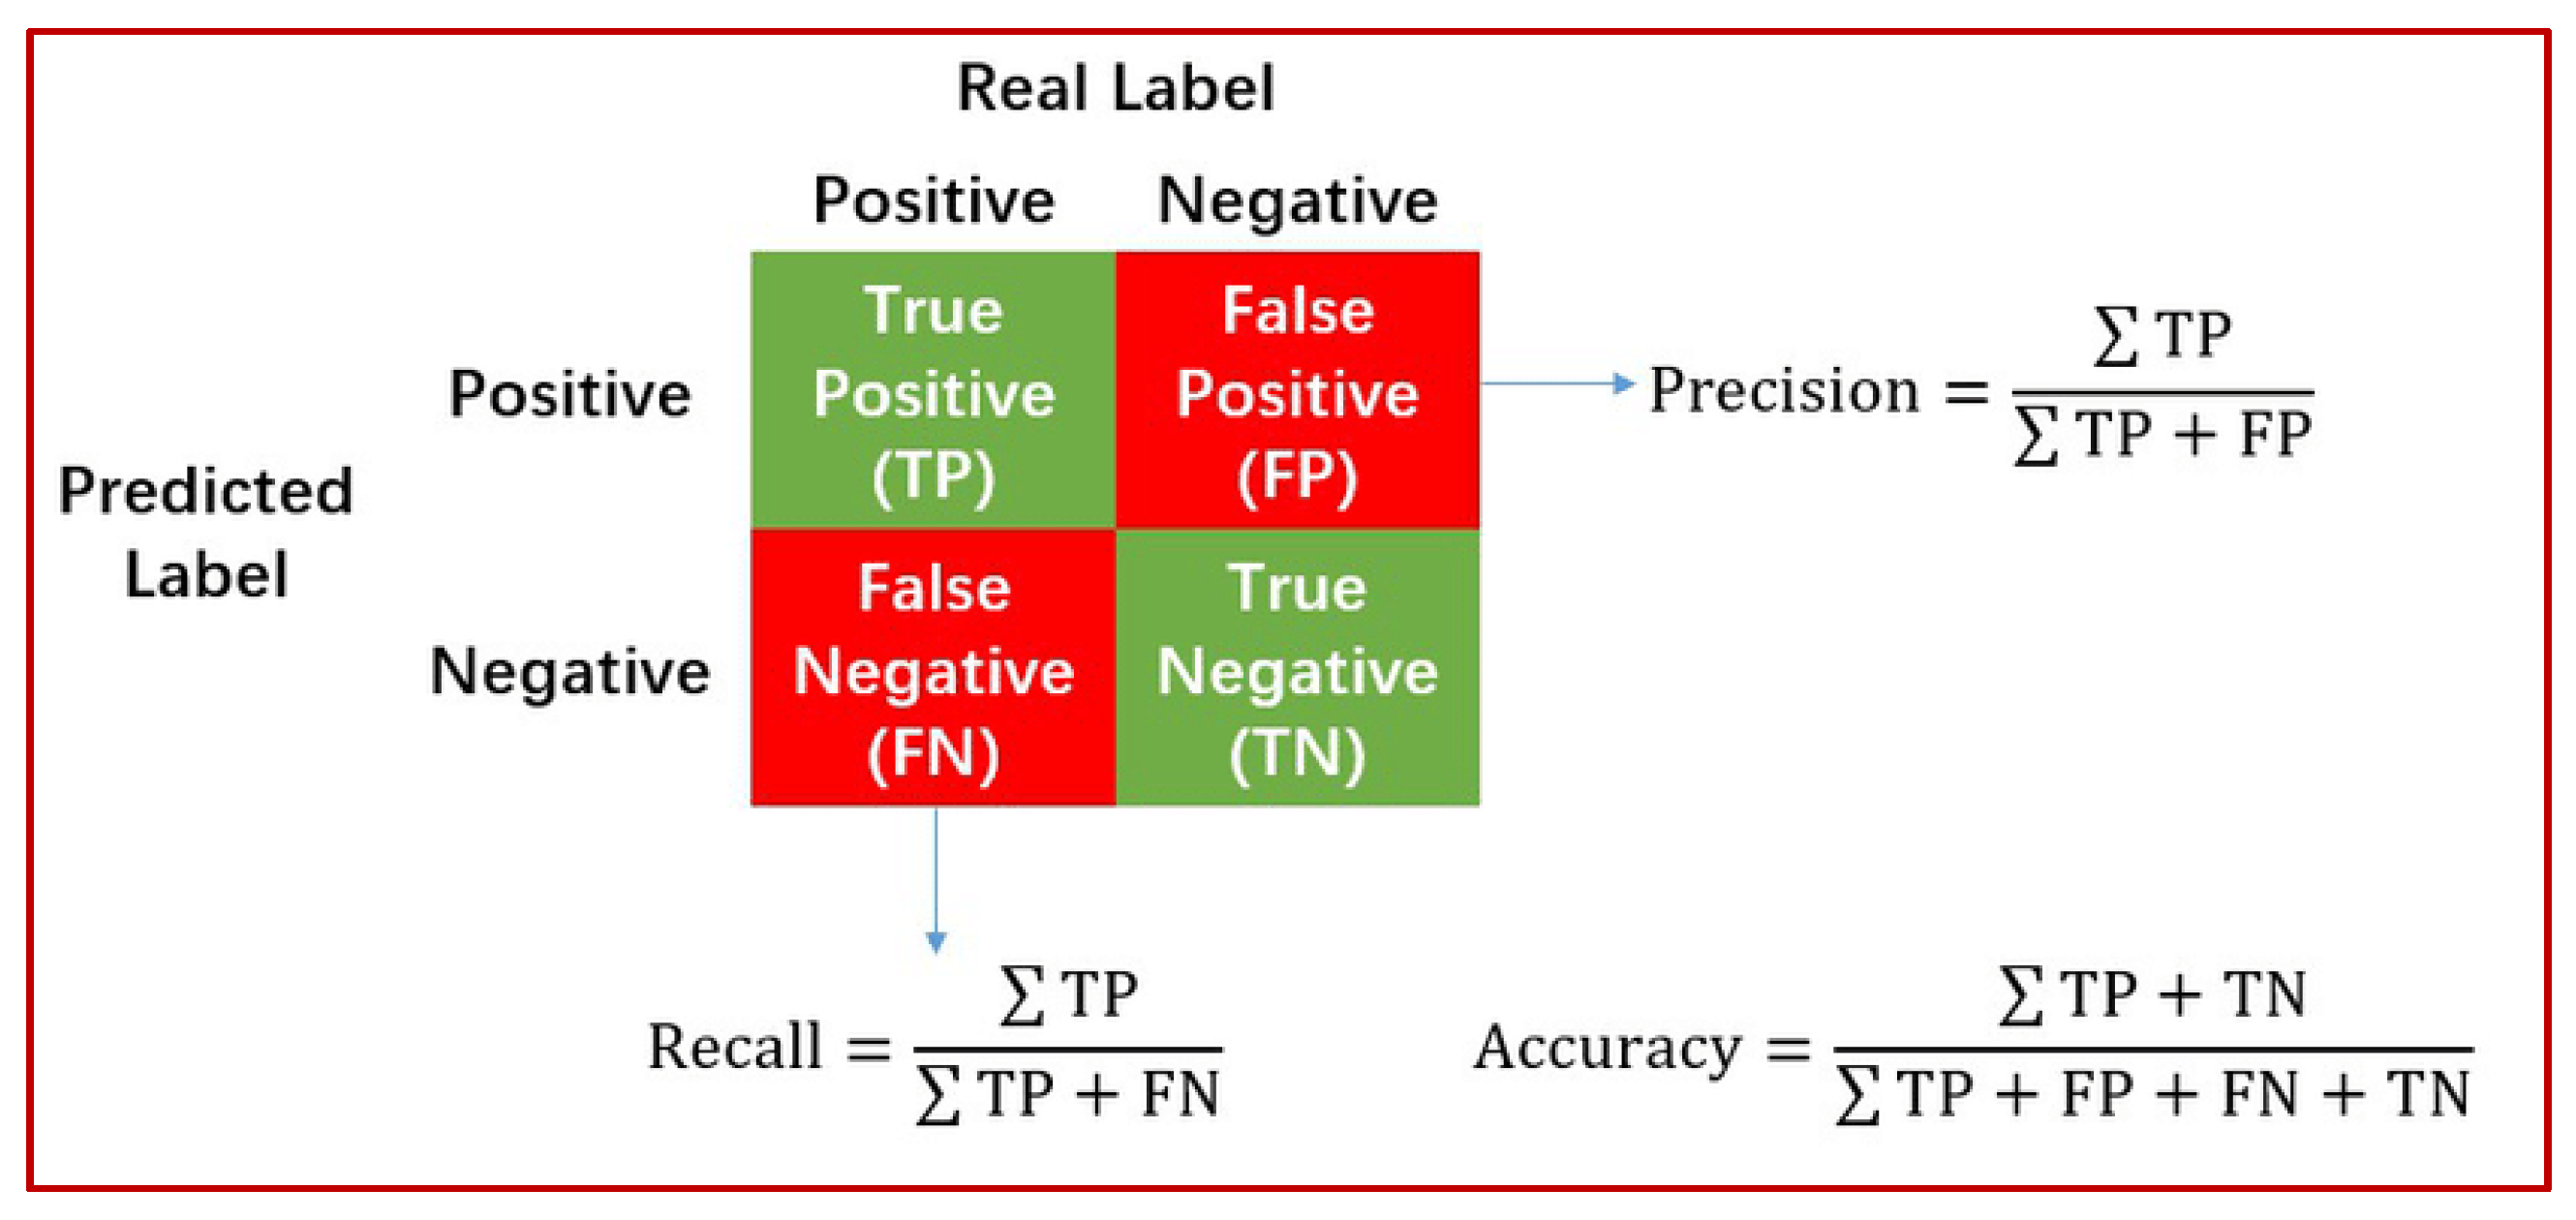
  • Accuracy (ACU): The proportion of correctly classified samples with respect to the total number of samples.
  • Precision (PRC): The proportion of true-positive samples with respect to the total number of positive samples. For multi-class, we are considering the the weighted mean of single-class measures where the weight is the fraction of samples.
  • Recall (RCL): The proportion of true-positive samples with respect to the sum of true-positive samples and false-negative samples. For multi-class, we are considering the the weighted mean of single-class measures where the weight is the fraction of samples.
  • F1-Score metric (F1S): The proportion of the harmonic mean between precision and recall.
  • Area Under the Curve (AUC): Proportion of area under the plot between the true positive rate and false positive rate using different thresholds.
  • Prediction Speed (SPD): Measured in (obs/sec), which refers to the number of observations processed per second. Its inverse would be the time taken for one prediction in seconds (TPD).
The obtained results exhibit the extraordinary performance indicators of our predictive models with greater figures obtained for the predictive models based ODT of both detection (two-class) and classification (multiclass) systems scoring accuracy values of 99.9% and 99.4%, respectively, compared to the accuracy of the detection and classification systems based SNN, which scored 98.6% and 98.4%, respectively.
Finally, to realize advanced observations of the advantage of the proposed ODT based predictive model for bitcoin payment transactions, we contrast the classification accuracy of our detection/classification models employing ODT with several other existing up-to-date machine learning-based bitcoin payment transactions detection/classification models engaging different machine learning methods to detect and/or classify the ransomware transactions in the bitcoin payments applications. The comparison is provided in Table 4 below. Since classification accuracy is the vital performance evaluator to indicate the robustness of machine learning-based models, we have centered our comparison with the model’s classification accuracy values that are reported in the literature. According to the comparison table, the proposed model is competent and superior to provide detection and classification for the ransomware payment transactions in heterogeneous bitcoin networks.

5. Conclusions and Future Directions

A self-reliant and intelligent ransomware detection and predictive classification system for bitcoin transactions in heterogeneous bitcoin networks has been developed, investigated, and evaluated in this paper. The proposed system employs two supervised machine learning methods to recognize data patterns in bitcoin payment transactions, namely, shallow neural networks (SNN) and optimizable decision trees (ODT). The proposed predictive models have been evaluated using a recent, up-to-date and comprehensive bitcoin transactions dataset (BitcoonHeist2020) via several performance evaluation metrics such as classification accuracy, precision, and recall. Consequently, the validation testing of model experimentation recorded 98.6% and 99.9% for the bitcoin transaction detection accuracy (two-class classifier) as well as 98.4% and 99.4% bitcoin transaction classification accuracy (multiclass classifier), using SNN and ODT, respectively. Our best-achieved accuracy results have transcended the accuracy results for several existing bitcoin transactions predictive models. In the future, we will consider carrying out other important analysis of the model quality measures, such as the area under Precision/Recall curve (Average Precision), and precision/recall curve as a function of the threshold in our future ML development, especially when we deal with an imbalanced dataset. Moreover, we will consider analyzing the impact of hyper-parameters tuning on the predictive model results.

Author Contributions

Conceptualization, Q.A.A.-H.; methodology, Q.A.A.-H.; software, Q.A.A.-H. and A.A.A.; validation, Q.A.A.-H. and A.A.A.; formal analysis, Q.A.A.-H. and A.A.A. investigation, Q.A.A.-H. and A.A.A.; writing—original draft preparation, Q.A.A.-H. and A.A.A.; writing—review and editing Q.A.A.-H. and A.A.A. All authors have read and agreed to the published version of the manuscript.

Funding

This research received no external funding.

Data Availability Statement

The BitcoinHeist 2020 dataset employed in this research can be retrieved from from UCI Machine Learning Repository at: https://archive.ics.uci.edu/ml/datasets/BitcoinHeistRansomwareAddressDataset.

Conflicts of Interest

The authors declare no conflict of interest.

References

  1. Mohurle, S.; Patil, M. A brief study of Wannacry Threat: Ransomware Attack 2017. Int. J. Adv. Res. Comput. Sci. 2017, 8, 1938–1940. [Google Scholar]
  2. Oosthoek, K.; Doerr, C. From Hodl to Heist: Analysis of Cyber Security Threats to Bitcoin Exchanges. In Proceedings of the 2020 IEEE International Conference on Blockchain and Cryptocurrency (ICBC), Toronto, ON, Canada, 2–6 May 2020. [Google Scholar]
  3. Paquet-Clouston, M.; Haslhofer, B.; Dupont, B. Ransomware payments in the Bitcoin ecosystem. J. Cybersecur. 2019, 5, tyz003. [Google Scholar] [CrossRef]
  4. Erfani, S.; Ahmadi, M. Bitcoin Security Reference Model: An Implementation Platform. In Proceedings of the 2019 International Symposium on Signals, Circuits and Systems (ISSCS), Iasi, Romania, 11–12 July 2019. [Google Scholar]
  5. Biryukov, A.; Pustogarov, I. Bitcoin over Tor isn’t A Good Idea. In Proceedings of the 2015 IEEE Symposium on Security and Privacy, San Jose, CA, USA, 17–21 May 2015. [Google Scholar]
  6. Akcora, C.; Li, Y.; Gel, Y.; Kantarcioglu, M. BitcoinHeist: Topological Data Analysis for Ransomware Prediction on the Bitcoin Blockchain. In Proceedings of the Twenty-Ninth International Joint Conference on Artificial Intelligence (IJCAI-20) Special Track on AI in FinTech, Yokohama, Japan, 11–17 July 2020. [Google Scholar]
  7. Rahouti, M.; Xiong, K.; Ghani, N. Bitcoin Concepts, Threats, and Machine-Learning Security Solutions. IEEE Access 2018, 6, 2169–3536. [Google Scholar] [CrossRef]
  8. Yazdinejad, A.; HaddadPajouh, H.; Dehghantanha, A.; Parizi, R.M.; Srivastava, G.; Chen, M.-Y. Cryptocurrency malware hunting: A deep Recurrent Neural Network approach. Appl. Soft Comput. J. 2020, 96, 106630. [Google Scholar] [CrossRef]
  9. Zola, F.; Bruse, J.L.; Eguimendia, M.; Galar, M.; Urrutia, R.O. Bitcoin and Cybersecurity: Temporal Dissection of Blockchain Data to Unveil Changes in Entity Behavioral Patterns. Appl. Sci. 2019, 9, 5003. [Google Scholar] [CrossRef] [Green Version]
  10. Moser, M.; Bohme, R. The price of anonymity: Empirical evidence from a market for Bitcoin anonymization. Cybersecurity 2017, 3, 127–135. [Google Scholar] [CrossRef] [Green Version]
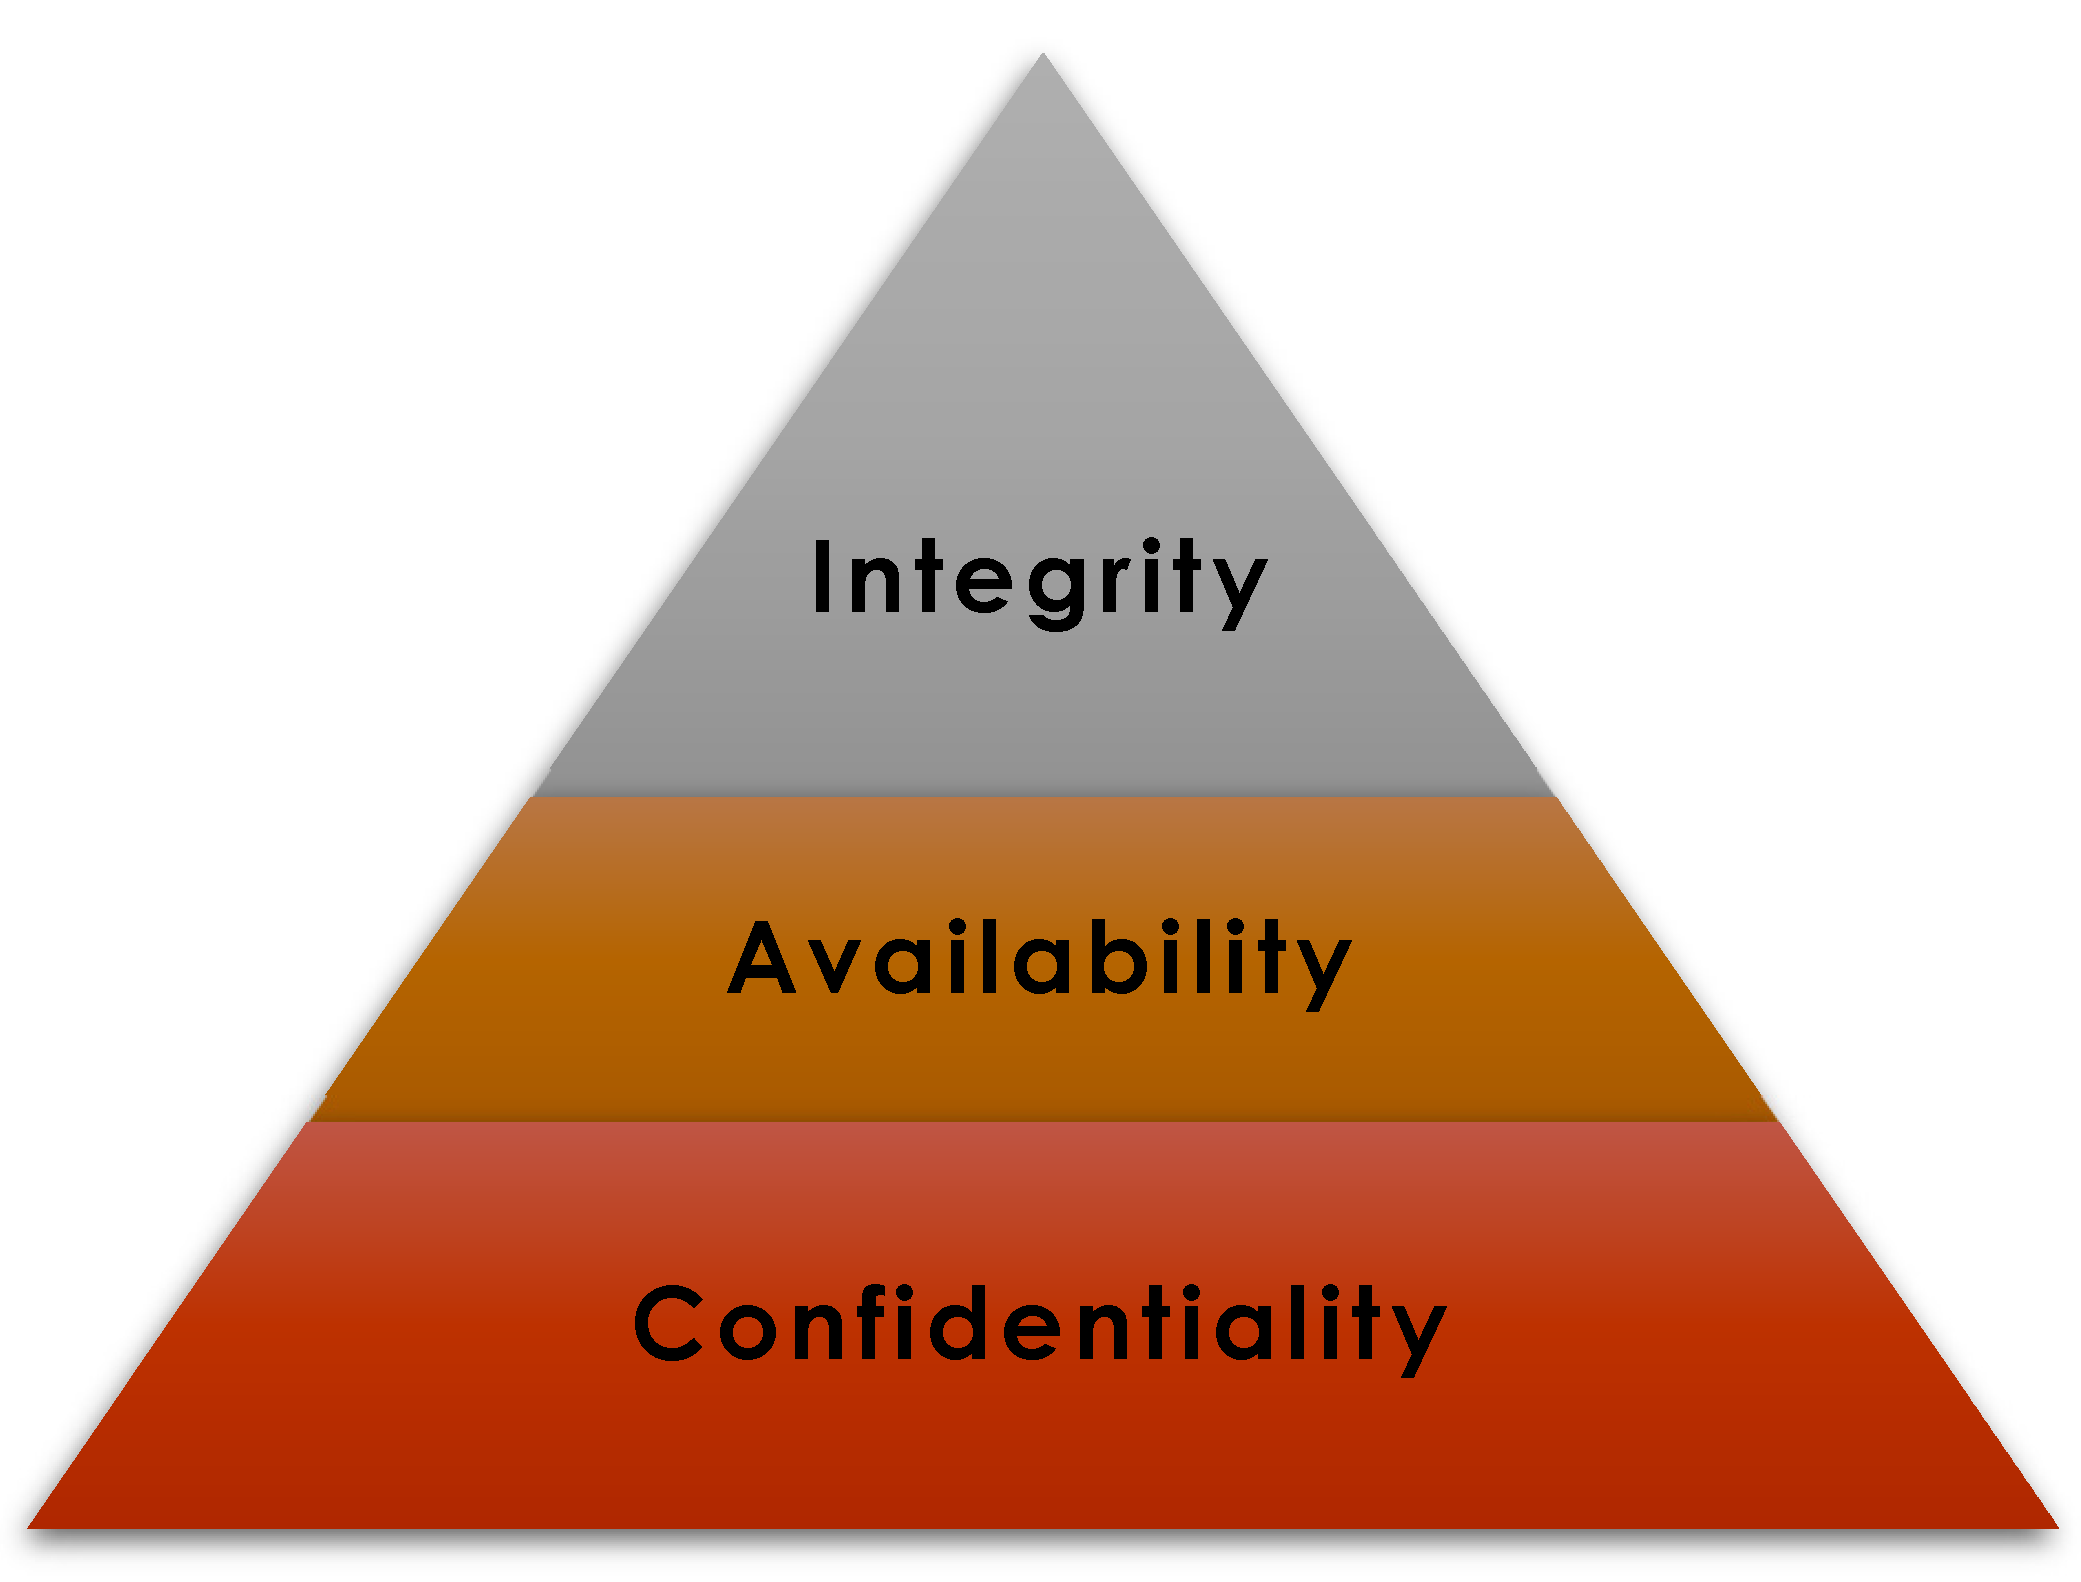
  11. Monev, V. Defining and Applying Information Security Goals for Blockchain Technology. In Proceedings of the 2020 International Conference on Information Technologies (InfoTech), Varna, Bulgaria, 17–18 September 2020; pp. 1–4. [Google Scholar] [CrossRef]
  12. Kok, S.H.; Abdullah, A.; Jhanjhi, N.; Supramaniam, M. Prevention of Crypto-Ransomware Using a Pre-Encryption Detection Algorithm. Computers 2019, 8, 79. [Google Scholar] [CrossRef] [Green Version]
  13. Al-rimy, B.A.S.; Maarof, M.A.; Shaid, S.Z.M. Crypto-ransomware early detection model using novel incremental bagging with enhanced semi-random subspace selection. Future Gener. Comput. Syst. 2019, 101, 476–491. [Google Scholar] [CrossRef]
  14. Kok, S.; Abdullah, A.; Jhanjhi, N. Early detection of crypto-ransomware using pre-encryption detection algorithm. J. King Saud Univ.-Comput. Inf. Sci. 2020, in press. [Google Scholar] [CrossRef]
  15. Maniath, S.; Ashok, A.; Poornachandran, P.; Sujadevi, V.G.; AU, P.S.; Jan, S. Deep Learning LSTM Based Ransomware Detection. In Proceedings of the 2017 Recent Developments in Control, Automation & Power Engineering (RDCAPE), Noida, India, 26 October 2017. [Google Scholar]
  16. Alhawi, O.M.K.; Baldwin, J.; Dehghantanha, A. Leveraging Machine Learning Techniques for Windows Ransomware Network Traffic Detection. Cyber Threat. Intell. Adv. Inf. Secur. 2018, 70, 93–106. [Google Scholar]
  17. Al-Rimy, B.A.S.; Maarof, M.A.; Alazab, M.; Alsolami, F.; Shaid, S.Z.M.; Ghaleb, F.A.; Al-Hadhrami, T.; Ali, A.M. A Pseudo Feedback-Based Annotated TF-IDF Technique for Dynamic Crypto-Ransomware Pre-Encryption Boundary Delineation and Features Extraction. IEEE Access 2020, 8, 140586–140598. [Google Scholar] [CrossRef]
  18. Kalash, M.; Rochan, M.; Mohammed, N.; Bruce, N.D.B.; Wang, Y.; Iqbal, F. Malware Classification with Deep Convolutional Neural Networks. In Proceedings of the 2018 9th IFIP International Conference on New Technologies, Mobility and Security (NTMS), Paris, France, 26–28 February 2018. [Google Scholar]
  19. Vasan, D.; Alazab, M.; Wassan, S.; Naeem, H.; Safaei, B.; Zheng, Q. IMCFN: Image-based malware classification using fine-tuned convolutional neural network architecture. Comput. Netw. 2020, 171, 107138. [Google Scholar] [CrossRef]
  20. Yuan, B.; Wang, J.; Liu, D.; Guo, W.; Wu, P.; Bao, X. Byte-level malware classification based on Markov images and deep learning. Comput. Secur. 2020, 92, 101740. [Google Scholar] [CrossRef]
  21. Warkentin, M.; Orgeron, C. Using the security triad to assess Blockchain technology in public sector applications. Int. J. Inf. Manag. 2020, 52, 102090. [Google Scholar] [CrossRef]
  22. Arunmozhi, M.; Rejikumar, G.; Marwaha, D. A literature review on Bitcoin: Transformation of crypto currency into a global phenomenon. IEEE Eng. Manag. Rev. 2019, 47, 28–35. [Google Scholar]
  23. Akcora, C.G.; Li, Y.; Gel, Y.R.; Kantarcioglu, M. BitcoinHeist: Topological data analysis for ransomware detection on the bitcoin blockchain. arXiv 2019, arXiv:1906.07852. [Google Scholar]
  24. Abu Al-Haija, Q.; Zein-Sabatto, S. An Efficient Deep-Learning-Based Detection and Classification System for Cyber-Attacks in IoT Communication Networks. Electronics 2020, 9, 2152. [Google Scholar] [CrossRef]
  25. Uddin, S.; Khan, A.; Hossain, M.E.; Moni, M.A. Comparing different supervised machine learning algorithms for disease prediction. BMC Med. Inform. Decis. Mak. 2019, 19, 281. [Google Scholar] [CrossRef]
  26. Abu Al-Haija, Q.; McCurry, C.D.; Zein-Sabatto, S. Intelligent Self-reliant Cyber-Attacks Detection and Classification System for IoT Communication Using Deep Convolutional Neural Network. In Selected Papers from the 12th International Networking Conference. INC 2020. Lecture Notes in Networks and Systems, Rhodes, Greece, 19–21 September 2020; Springer: Cham, Switzerland, 2021; Volume 180. [Google Scholar]
  27. Abu Al-Haija, Q.; Ishtaiwi, A. Multi-Class Classification of Firewall Log Files Using Shallow Neural Network for Network Security Applications. In Proceedings of the International Conference on Soft Computing for Security Applications (ICSCS 2021), Omalur, India, 10–11 June 2021; Springer—Advances in Intelligent Systems and Computing: Berlin, Germany, 2021. [Google Scholar]
  28. Le, T.-T.-H.; Kang, H.; Kim, H. Household Appliance Classification Using Lower Odd-Numbered Harmonics and the Bagging Decision Tree. IEEE Access 2020, 8, 55937–55952. [Google Scholar] [CrossRef]
  29. Patel, A. Bagging—Ensemble Meta Algorithm for Reducing Variance. Medium Towards Data Sci. 2019. Available online: https://medium.com/ml-research-lab/bagging-ensemble-meta-algorithm-for-reducing-variance-c98fffa5489f (accessed on 13 February 2020).
  30. Upadhyay, P.K.; Pandita, A.; Joshi, N. Scaled Conjugate Gradient Backpropagation based SLA Violation Prediction in Cloud Computing. In Proceedings of the 2019 International Conference on Computational Intelligence and Knowledge Economy (ICCIKE), Dubai, United Arab Emirates, 11–12 December 2019; pp. 203–208. [Google Scholar] [CrossRef]
  31. Wu, J.; Poloczek, M.; Wilson, A.G.; Frazier, P.I. Bayesian Optimization with Gradients. arXiv 2018, arXiv:1703.04389. [Google Scholar]
  32. Koech, K.E. Cross-Entropy Loss Function. Medium Towards Data Sci. 2020. Available online: https://towardsdatascience.com/cross-entropy-loss-function-f38c4ec8643e?gi=6f67c309e920 (accessed on 13 February 2020).
  33. Zhang, N.; Shen, S.-L.; Zhou, A.; Xu, Y.-S. Investigation on Performance of Neural Networks Using Quadratic Relative Error Cost Function. IEEE Access 2019, 7, 106642–106652. [Google Scholar] [CrossRef]
  34. Gupta, P. Cross-Validation in Machine Learning. Medium Towards Data Sci. 2017. Available online: https://towardsdatascience.com/cross-validation-in-machine-learning-72924a69872f (accessed on 13 February 2020).
  35. Al-Haija, Q.A.; Smadi, M.; Al-Bataineh, O.M. Identifying Phasic Dopamine Releases Using DarkNet-19 Convolutional Neural Network. In Proceedings of the 2021 IEEE International IOT, Electronics and Mechatronics Conference (IEMTRONICS), Toronto, ON, Canada, 21–24 April 2021; pp. 1–5. [Google Scholar] [CrossRef]
  36. Kolesnikova, K.; Mezentseva, O.; Mukatayev, T. Analysis of Bitcoin Transactions to Detect Illegal Transactions Using Convolutional Neural Networks. In Proceedings of the 2021 IEEE International Conference on Smart Information Systems and Technologies (SIST), Nur-Sultan, Kazakhstan, 28–30 April 2021; pp. 1–6. [Google Scholar] [CrossRef]
  37. Lee, C.; Maharjan, S.; Ko, K.; Woo, J.; Hong, J.W.K. Machine Learning Based Bitcoin Address Classification. In Blockchain and Trustworthy Systems. BlockSys 2020. Communications in Computer and Information Science; Zheng, Z., Dai, H.N., Fu, X., Chen, B., Eds.; Springer: Singapore, 2020; Volume 1267. [Google Scholar] [CrossRef]
  38. Burks, L.S.; Cox, A.E.; Lakkaraju, K.; Boyd, M.J.; Chan, E. Bitcoin Address Classification (No. SAND2017-8407C); Sandia National Lab.(SNL-NM): Albuquerque, NM, USA, 2017.
Figure 1. The CIA Triad.
Electronics 10 02113 g001
Figure 2. Types of Ransomware.
Electronics 10 02113 g002
Figure 3. Sample Bitcoin Graph Features: network of 10 addresses and 7 transactions.
Electronics 10 02113 g003
Figure 4. Architecture of machine learning-based Bitcoin Transaction Predictive Model.
Electronics 10 02113 g004
Figure 5. Architecture of machine learning-based Bitcoin Transaction Predictive Model.
Electronics 10 02113 g005
Figure 6. Preprocessing operations performed by our Bitcoin Transaction Predictive Model.
Electronics 10 02113 g006
Figure 7. SNN Model Architecture for Bitcoin Transaction Predictive Model.
Electronics 10 02113 g007
Figure 8. The Process Flow of Bagging decision trees (Bootstrap Aggregation). Courtesy.
Electronics 10 02113 g008
Figure 9. Performance analysis trajectories using cross-entropy cost for (a) SNN based detection system and (b) SNN based classification system.
Electronics 10 02113 g009
Figure 10. Performance analysis trajectories using the mean square cost: (a) ODT based detection system and (b) ODT-based classification system.
Electronics 10 02113 g010
Figure 11. Confusion Matrix Analysis for predictive models using ODT: (a) Classification System and (b) Detection System.
Electronics 10 02113 g011
Figure 12. General form of Confusion Matrix with corresponding metrics (Precision, Recall, Accuracy).
Electronics 10 02113 g012
Table 1. Bitcoin Transactions Dataset statistics.
Ransomware FamilyRansomware TypeNumber of Records
Montreal FamilymontrealAPT11
montrealComradeCircle1
montrealCryptConsole7
montrealCryptoLocker9315
montrealCryptoTorLocker201555
montrealCryptXXX2419
montrealDMALocker251
montrealDMALockerv3354
montrealEDA26
montrealFlyper9
montrealGlobe32
montrealGlobeImposter55
montrealGlobev334
montrealJigSaw4
montrealNoobCrypt483
montrealRazy13
montrealSam1
montrealSamSam62
montrealVenusLocker7
montrealWannaCry28
montrealXLocker1
montrealXLockerv5.07
montrealXTPLocker8
Total_Montreal Family13,163
Padua FamilypaduaCryptoWall12390
paduaJigsaw2
paduaKeRanger10
Total_ Padua Family12,402
Princeton FamilyprincetonCerber9223
princetonLocky6625
Total_ Princeton Family15,848
Total # of Ransomeware Paymenmt Records41,413
Table 2. Brief description of system development configurations and parameters.
TermsExplanation
Computing PlatformCPU Intel Core I9-9900 CPU, 8 cores, @4900 MHz
GPU: NVIDIA Quad P2000@1480 MHz @ 5 GB memory
Memory: 32 GB DDR4 @ 2666 MHz
ML TechniquesSNN with 50 Hidden Neurons, 1 Neuron Output Layer.
ODT with 2,916,696 Splits via Gini-Diversity Index & 30 Learners.
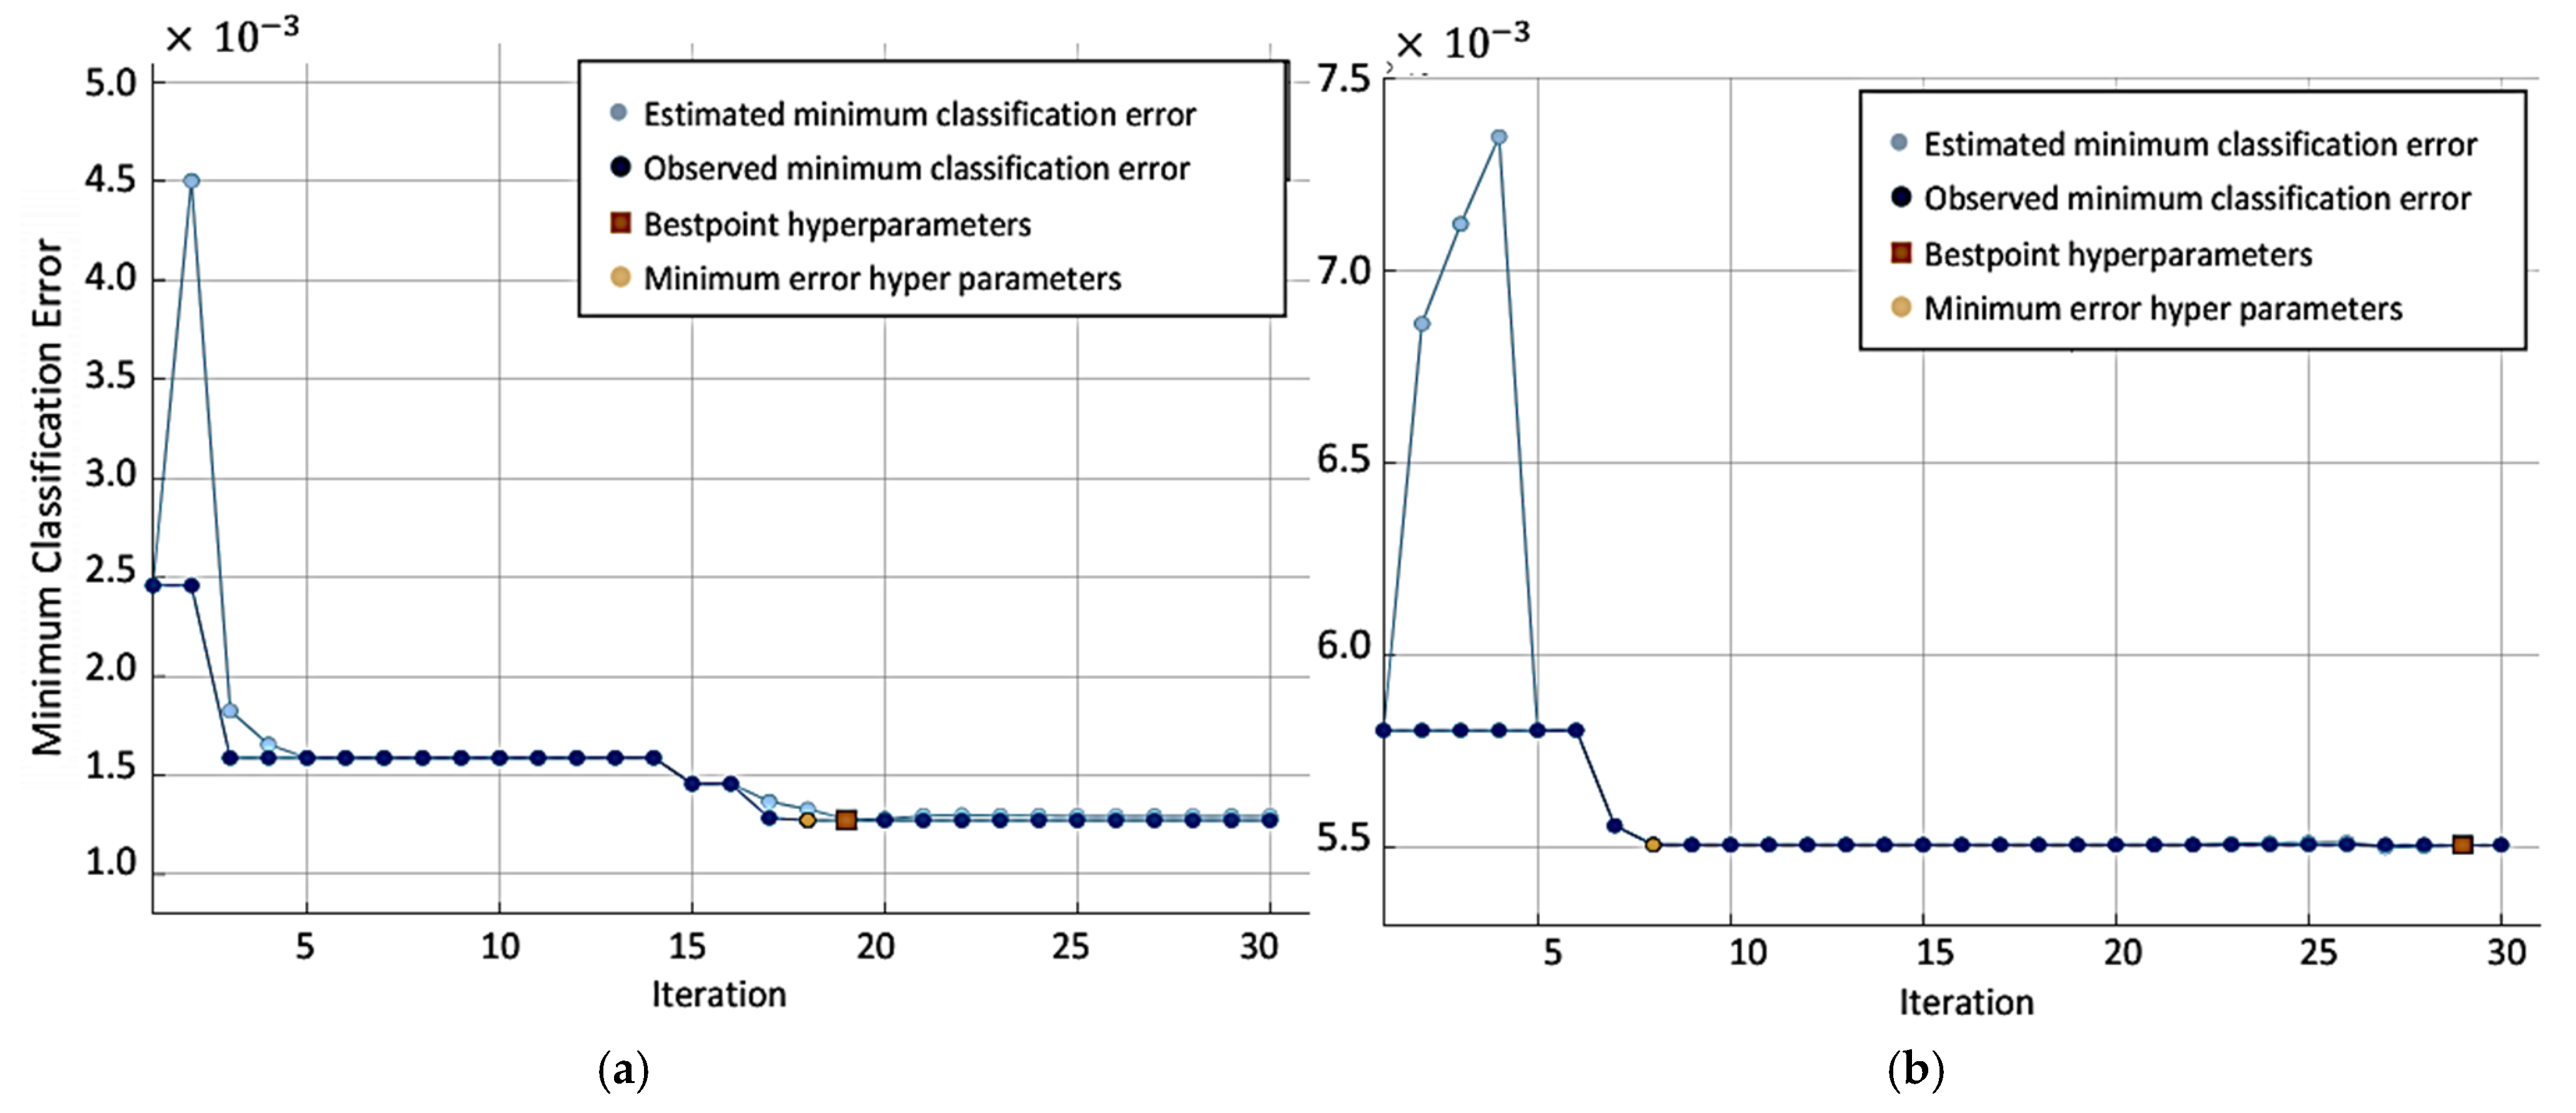
Model OptimizersConjugate Gradient Backpropagation for SNN [30].
Bayesian Gradient Optimization for ODT [31].
Loss investigationCross-Entropy Loss Function for SNN [32].
Mean Squared Error Function for ODT [33].
Validation Strategy5-Validation Checks and 5-Fold Cross Validation [34].
Data records Shuffling process is executed at each Epoch.
Epochs/Iterations/Learning RateLearning Rate = 0.01
145 # Epochs for Detection Model via SNN
103 # Epochs for Classification Model via SNN
30 # Iterations for Detection Model via ODT
30 # Iterations for Classification Model via ODT
Table 3. Summary of performance indicator metrics obtained for all predictive models.
ClassifierERR
(%)
ACU
(%)
PRC
(%)
RCL
(%)
F1S
(%)
AUC
(%)
SPD
(obs/sec)
TPD
(μsec)
Two-Class00.1099.9093.9199.9096.82100.00140,0007.1
Muli-Class00.6099.4099.4099.3099.35100.0096,00010.4
Table 4. Comparing our best accuracy results with other existing ML-based predictive models.
ResearchClassifier TypeML ModelAccuracy
Yazdinejad et al. [8]/2020Two-Class/DetectionLong short-term memory (LSTM)98.0%
Alhawi et al. [16]/2018Two-Class/DetectionDecision Tree J48 Classifier97.1%
Kolesnikova et al. [36]/2021Two-Class/DetectionConvolutional Neural Net (CNN)97.1%
Lee et al. [37]/2020Multi-Class/ClassificationRandom Forest84%
Burks et al. [38]/2017Multi-Class/ClassificationRandom Forest95.7%
Our Model/2021Two-Class/DetectionODT
Bagging
99.9%
Our Model/2021Multi-Class/ClassificationODT
Bagging
99.4%
Publisher’s Note: MDPI stays neutral with regard to jurisdictional claims in published maps and institutional affiliations.

