1. Introduction
The energy market and electric grid play a major role in everyday life. Most areas in modern society require electric energy to operate properly. The electric grid has become indispensable for life in modern society. Due to these reasons, it is important to maintain and improve the stability and reliability of the energy grid.
Currently, energy grids tend to follow a very strict and somewhat inefficient structure. A high number of entities that desire to consume energy are connected to a single centralized energy supplier entity. Traditional energy markets, such as wholesale or retail markets, were not designed to support the rising in distributed energy generation coming from Renewable Energy Sources (RES) in households, small commerce and small industry. Such facts raise questions about different ways of structuring energy markets to deal with these challenges.
One of the possible proposals to answer to this problem is the creation and implementation of local energy markets (LEMs). LEMs are structured in such a way as to enable small-scale negotiations and energy exchanges between participants who traditionally would only be final consumers. These markets are designed to operate within a regional area, such as a neighborhood or a city. Participants in this market are the local households, small commerce and small industry, that may be regular consumers or consumers with some type of local energy generation, being referred to as prosumers. Furthermore, local small-scale power plants can also participate in the LEM. The LEM is better designed to deal with distributed energy generation from RES because the surplus in generation from local energy producers and prosumers can be purchased and utilized by local consumers. This flexibility of response makes LEM an attractive proposition for the future of energy markets.
In order to guarantee the success and desired operation of the LEM, it is necessary to ensure security and trust in negotiations. While security is focused on the traditional measures of cyber-security, such as security in network communications, trust is focused on ensuring that the LEM participants and their proposals in the negotiations are viable and trustworthy.
The objective in this work is to create a LEM simulation, and incorporate a trust model. The trust model should be able to score participants’ trust level during negotiations, allowing the untrustworthy participants (low trust score) to be prohibited from participating in the LEM. Furthermore, the goal is to also create a cyber-attack detection model utilizing supervised classification techniques.
A MAS is a system that combines several agents, which are software entities that have the capacity to interact among themselves. For this reason it is ideal to simulate the LEM, as each market participant can be simulated individually, and by the means of their interactions, it is possible to simulate a far more complex environment, as is the case of the LEM.
After this introductory Section, the document is organized as follows:
Section 2 contextualizes the work, describing the concepts of the LEM, and of trust models for MAS.
Section 3 presents possible approaches to obtain the cyber-security guaranties needed for the safe operation of the LEM.
Section 4 describes the LEMMAS system.
Section 5 describes the developed cyber-attack detection system.
Section 6 presents the analyses done to Cyber-Attack detection models. Lastly,
Section 7 presents the conclusions of this work.
2. Local Energy Market
The local energy market (LEM) is a novel energy market model. There is no unique definition on what a LEM is; however, many authors have addressed this issue, and among their work a general idea of the LEM begins to emerge. Authors exploring this topic tend to define three key aspects: (i) market structure; (ii) advantages; and (iii) challenges.
The structure of the LEM is generally defined as a group of local participants (such as a neighborhood) [
1,
2,
3], which are capable of trading energy among themselves. Participants in the local market are separated into three kinds [
3,
4,
5]:
Consumers: who wish to buy energy;
Producers: who wish to sell energy;
Prosumers: (consumers with some source of energy generation) who wish to buy and sell energy.
Both the market participants and the underling electrical grid, which serves as a basis for the LEM, are defined as having monitoring sensors for consumption, generation, energy storage and other data sources; and network communication technologies to share this information [
3,
4]. Such an energy grid is referred to as a Smart-Grid [
1].
The LEM brings several potential advantages when compared to traditional energy markets. Some authors [
1,
5] claim that the LEM would make a more efficient use of electrical grids. Simultaneously, it is believed that the shift to local energy markets (LEMs) could reduce the greenhouse effect [
1] and create a more sustainable environment [
4,
5]. Participants in the LEM (especially traditional consumers) take a much more involved role in the market when compared to traditional markets. These participants gain the ability to directly negotiate and can achieve cost reductions or even profits with their participation [
1,
4,
5]. Lastly, the versatility of the LEM makes it possibly for the coexistence with traditional markets [
4,
5], that being the case, the local market can adapt to the needs of each specific community.
Currently, the LEM is facing some challenges that prevent its adoption at a large scale. Abidin et al. [
1] identify security concerns as one of these challenges. The local market, and consequently the underling Smart-Grid, deal with a lot of sensitive information that needs to be properly secured from unauthorized access; and from malicious entities who may tamper with data in order to have some financial gain. The former also emphasizes the need for trust in negotiations in the local energy market (LEM). Interest from the community and an economic upfront investment by investors are also seen as one of the current challenges to the LEM adoption [
2,
5]. From a technical point of view, the implementation of Smart-Grids capable of providing the support needed for the LEM is still a challenge that needs further research [
5]. Lastly, the support from governments and creation of adequate legislation is a must for the success of the LEM [
5].
2.1. Trust in Multi-Agent Systems
Trust and reputation systems (TRS) are designed with the objective of predicting the reliability in the behavior of an entity by analyzing data from past interactions [
6]. By performing such analyzes, TRS are able to associate a reputation to each user. Good reputation indicates that the user is trustworthy in its negotiations, and vice versa.
In [
6], several trust models are identified, some of which are specific for the marketplace area of applicability. Two of these trust models seem interesting for this project since they are targeted at a marketplace, but apply different strategies. These models are the e-commerce model and ReGreT [
7].
Reference [
8] views the e-commerce trust model from the perspective of eBay. eBay operates as an online auction web site. Users of this platform can propose their sale offers and/or place bids on other users’ offers. In online auction web sites such as eBay, the participants in the transactions are humans, and these platforms implement mechanisms for participants to review their experience in the transaction. This feedback provided by the users is then used to feed the TRS with the data necessary to access the reputation of the users [
6].
ReGreT is a trust and reputation model proposed by [
7]. This model is different from the eBay model because it does not consider trust as a global value. ReGreT has a focus towards modularity [
9]. Modules might be used or not depending on the needs of each context. ReGreT considers three kinds of information for trust: the agent’s own experiences, information from other agents and the social structure among agents. These types of information coincide with the three dimensions used in ReGreT to calculate trust, which are the following:
Individual dimension: Considers the outcomes observed directly by the agent when in negotiation with another agent.
Social dimension: Considers information provided by other entities. Something that can be useful when direct information is not available.
Ontological dimension: Considers the contextual information that can be gained by the reputation.
In another work [
10], the authors identify three distinct approaches that can be followed when developing a trust mechanism for a MAS. Each approach considers a different dimension of trust. These approaches are:
Security Approach: Is focused on the traditional security mechanisms [
11]: confidentiality, availability, authentication, integrity, non-repudiation. This dimension aims to prevent cyber-security threats;
Institutional Approach: Considers the idea of a centralized entity that acts as an overseer in the MAS. This centralized entity, takes the place of an institution that must evaluate all agents and ensure that each one of them is trustworthy. This is the case for the e-commerce trust model;
Social Approach: Is similar to the way humans interact in the real world. With this trust model, each agent decides who it considers trustworthy. Agents can make this decision based on their interactions with other agents, and/or by considering others’ opinions. This is the case for the ReGreT trust and reputation model.
2.2. Security Risks
In a LEM, part of the physical layer corresponds to the network and sensor infrastructure that is necessary for collecting data and allowing communication, and this is what makes the grid be called a smart-grid. However, this infrastructure can be a vector of cyber-attacks [
12]. The sensor infrastructure in the smart-grid is often composed of IoT devices. IoT devices can have a potential risk of being tied to a company or cloud network and having access to the data collected by the sensor. A security breach in the cloud network would also expose the data related to the sensor and intern the LEM where this sensor is [
13].
Traditional cyber-attacks to the LEM‘s smart-grid are also a security risk [
13]. These can be attacks that aim at gathering private information, such as Man In The Middle attacks, or can even be attacks that try to tamper with the communications in the network. There might even be financial incentives to try such an attack by an ill intending participant in the LEM since he might be able to change the final market price in order to have a financial gain. Unknown sensor hardware malfunctions can also be problematic since they can leave the system working with incorrect data. In this work, the aim is to provide tools to help detect both malicious data tampering and hardware malfunctions.
In this paper, we present a first approach towards including mechanisms to detect attacks that can be made on devices of market participants, with the aim of making LEMMAS a system that provides trusted and secured negotiation.
3. Cyber-Attack Detection
In order to obtain a secure environment for local energy market negotiations, traditional cyber-security cannot be forgotten. It is as important to trust in the participants as it is to have a secure network and computer systems. One option to create this environment is to combine intrusion detection systems with artificial intelligence algorithms as an anomaly/attack detection tool by analyzing network data.
In [
14], the authors developed a system to perform intrusion detection of smart meters. They combined support vector machine (SVM) and temporal failure propagation graph (TFPG) techniques with a pattern recognition algorithm. The study showed that the system provided good results.
The authors in [
15] tried to detect false data injection in a smart grid using deep learning techniques. Their approach combined a Convolutional Neural Network (CNN) with a Long Short Term Memory (LSTM) network. The system was able to achieve an accuracy result above 90% for certain kinds of attacks. They conclude that their approach can be combined with a different technique to obtain a highly accurate attack detection system for all kinds of attacks.
In [
16], the authors also tackled the problem of false data injection in power systems. Their approach used an autoencoder network with 4 hidden layers. A case study was performed, and their system was able to detect the kinds of attacks the study was focusing on, and the system also outperformed the techniques currently used in that scenario.
In [
17], the authors researched the problem of face spoofing attacks. Instead of using the traditional methods for such a problem, the authors opted to use ensemble based technique by combining multiple one-class classifiers. A case study was conducted to evaluate the performance of their approach using three face anti-spoofing datasets. Their proposed solution showed a good performance for the problem.
In [
18], the authors developed a cyber-attack detection system for network based attacks. In this work, the methods of random forest, multi-layer perceptron and long-short term memory were implemented and experimented using the CIDDS-001 dataset [
19,
20]. The results of this study showed that the long-short term memory technique was the best, achieving an accuracy score above 99%.
The authors in [
21] studied the application of unsupervised learning techniques in order to perform cyber-attack anomaly detection. The authors experimented with six different techniques: Isolation Forest, K-Means, 1-Nearest Neighbor, Autoencoder, Scaled Convex Hull, Support Vector Machines; combined with the best pre-processing steps for each. A case study was performed with the NSL-KDD [
22] and the ISCX [
23] datasets in order to evaluate the algorithms. Based on the results, the authors concluded that all detection algorithms showed a good performance for the cyber-attack anomaly detection problem.
4. LEMMAS System
The developed MAS follows the agent structure as proposed in [
24]. In that work, a computational model of a LEM is separated into three kinds of agents:
Market Interactions Manager: Is at the center of every LEM and is responsible for managing all negotiations within the market. The task of ensuring trust in the negotiations is also a responsibility of the market interaction manager (MIM).
Participant agent: Acts on behalf of consumers, producers or prosumers. This agent assumes the role of a negotiator that seeks to best satisfy the needs of the respective market participants (home owners, local commerce and small industry owners). The Participant Agent will have Sensor Agents that report to them the information needed for the negotiations. The Participant Agent is then able to make proposals to buy or sell energy in the market;
Sensor agent: Has the single responsibility of acquiring one type of data and reporting said data to their respective Participant Agent. A Sensor agent can be, for example, connected to a meter measuring energy consumption in a household, while another sensor agent can be connected to a web service in order to obtain the weather forecast.
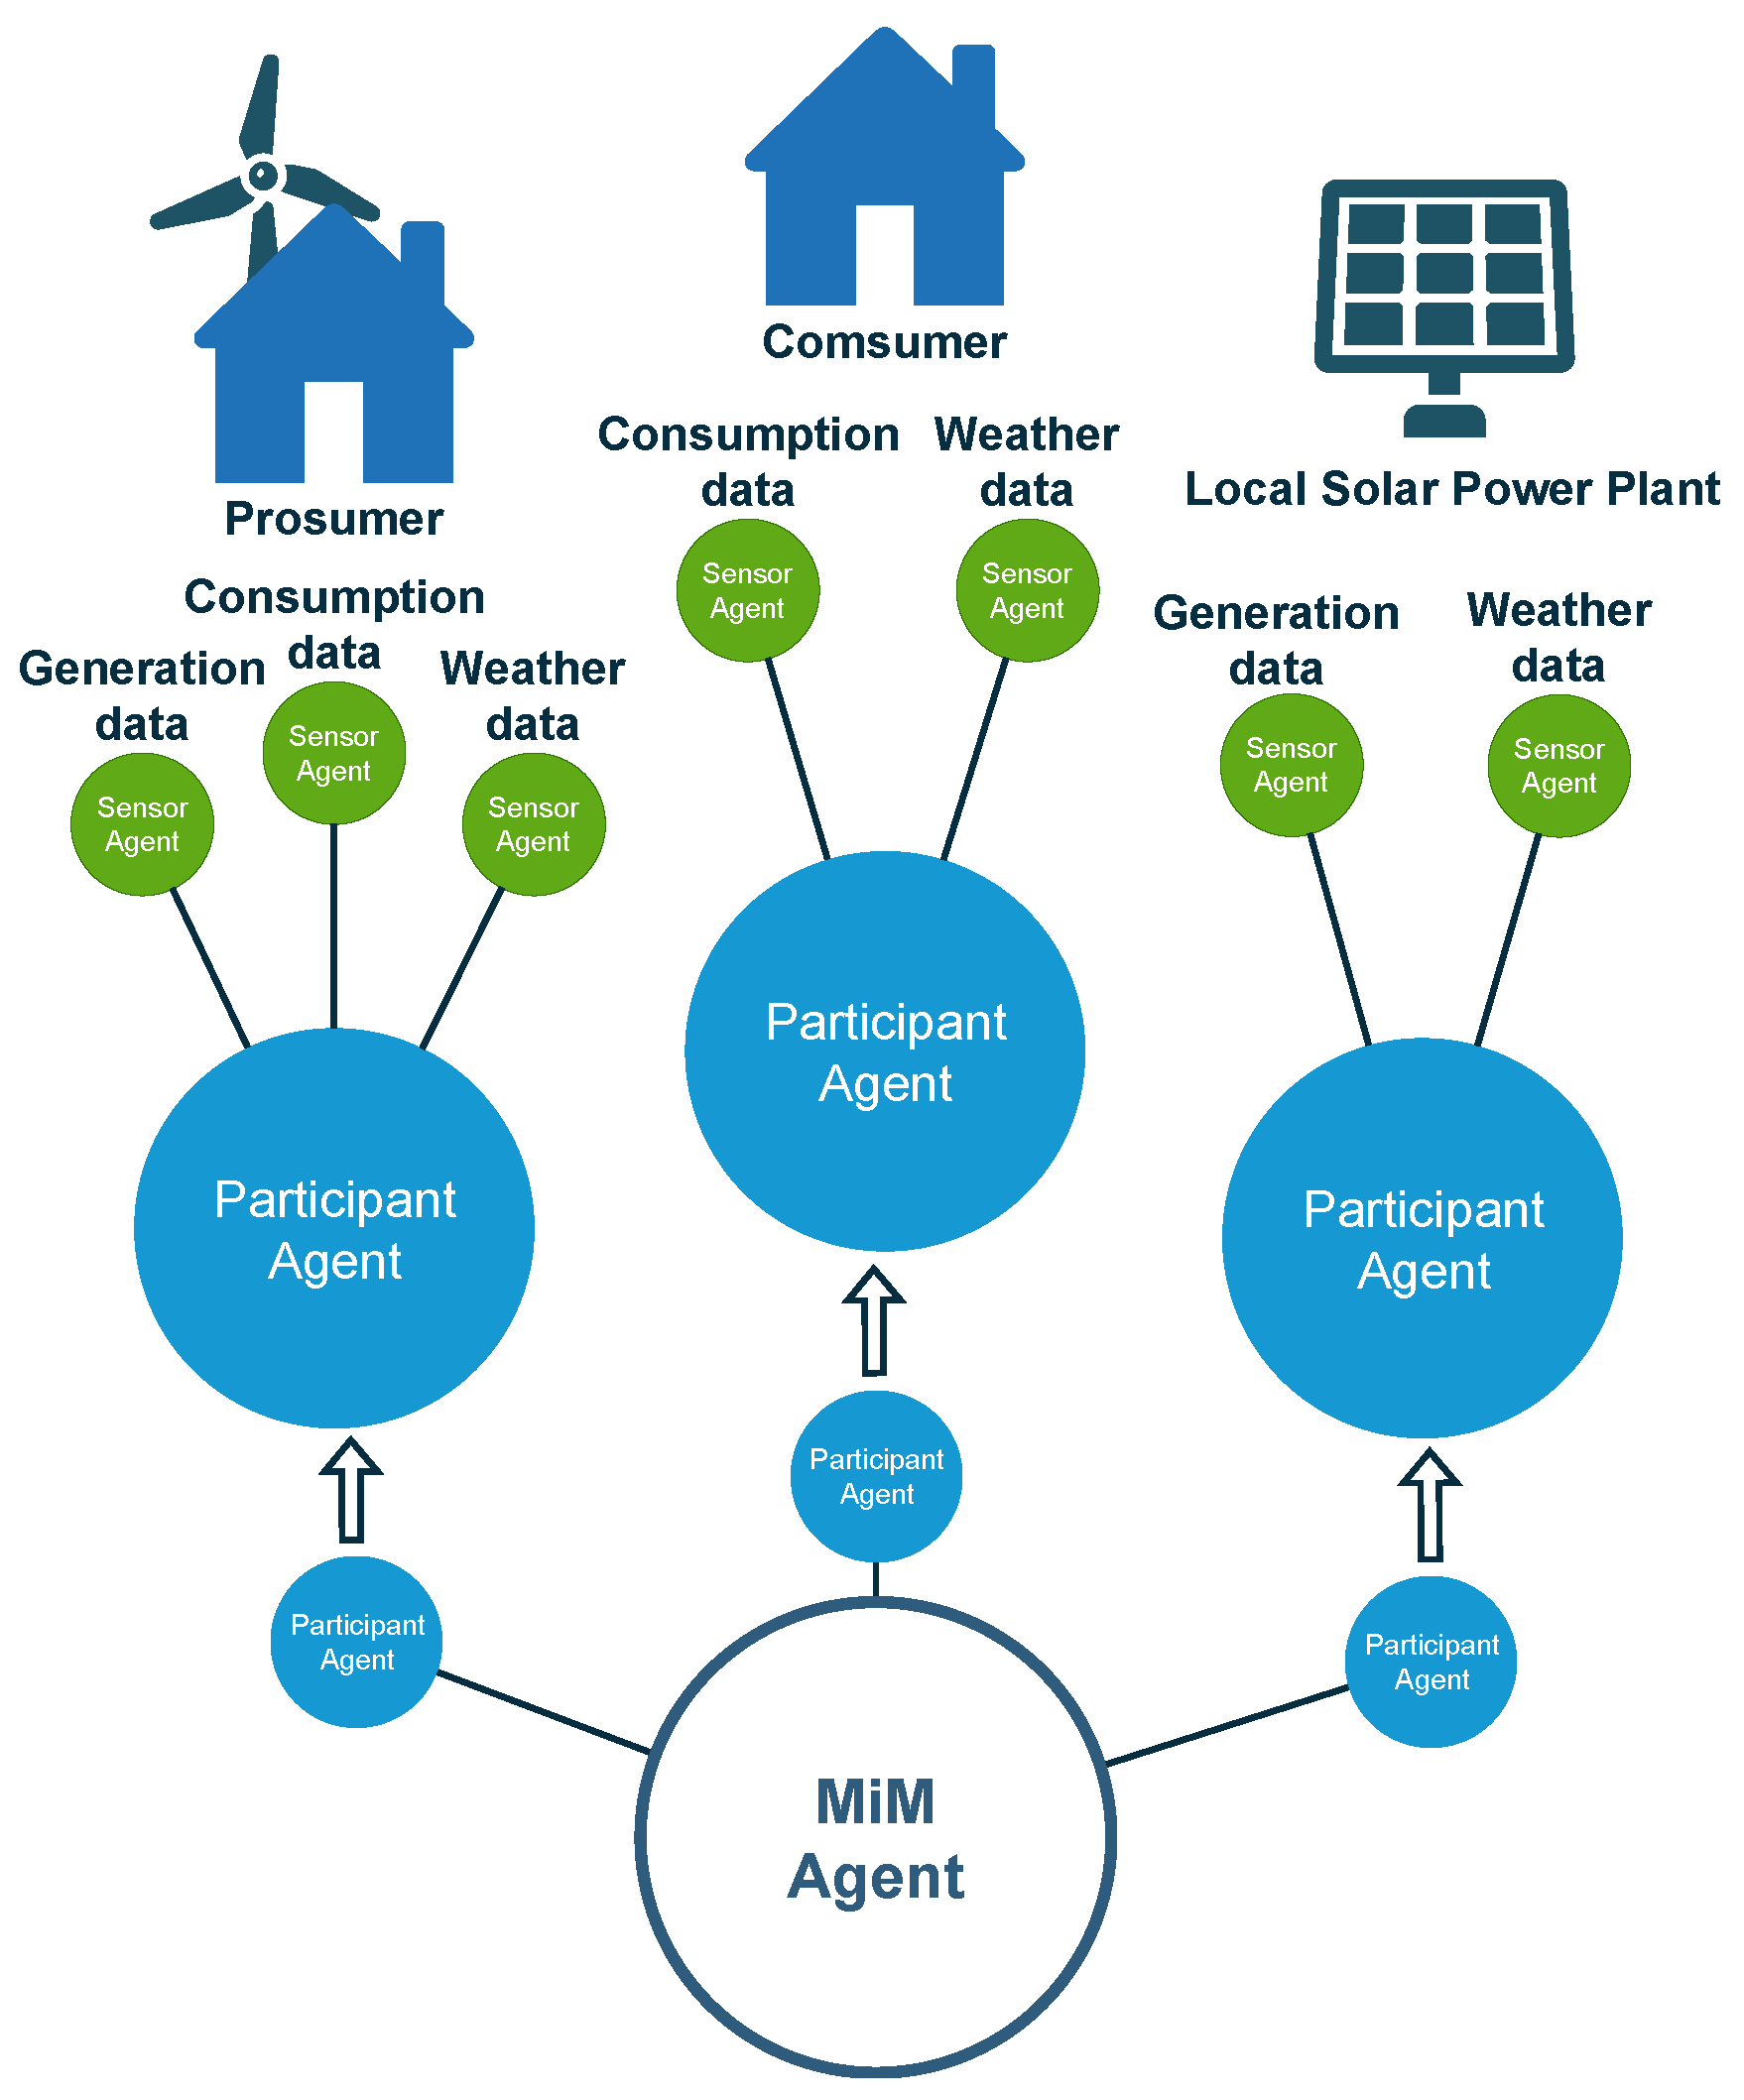
With these three kinds of agents, it is possible to create a reasonably complete representation of a LEM, which includes: consumers, producers and prosumers. The Sensor Agents allow the cyber-physical system, such as the ones of smart houses and other connected environments. A complete representation of the proposed LEM model is presented in
Figure 1.
The LEM is composed of several participants, represented by their respective Participant Agent, and all of these agents are connected to the MIM. In
Figure 1, three participants are further detailed as examples of how real participants might be structured in a realistic scenario. These participants are the following:
Consumer: Represents a household without self-generation that participates in the market.
Prosumer: Represents an household that participates in the market and has its own energy generation, with a small wind generator.
Local Solar Power Plant: Exemplifies a small photovoltaic power plant that is part of the LEM.
4.1. Trust Model
To support the market, an institutional based trust model is proposed to be used by the MIM, capable of evaluating the behavior of participants and detecting faulty or malicious activities. This trust model was chosen over the social model because with a social model, participants might need access to sensitive (consumption, generation, etc.) data from other participants in order to make their own trust evaluation.
The idea for the trust mechanism is that with information such as weather, historical consumption and generation data, and other contextual data, it is possible to use forecasting methods to try to predict what the participant’s consumption, generation or proposals should be in the coming market negotiation period.
Using such forecasted values, it is possible to obtain an idea if the participant is trustworthy over time. Since forecasting methods always have a certain degree of uncertainty, a single proposed value that does not match the forecasted value does not provide a reliable metric. So, by using an evaluation over time, it is thought that incorrectly forecasted values become negligible.
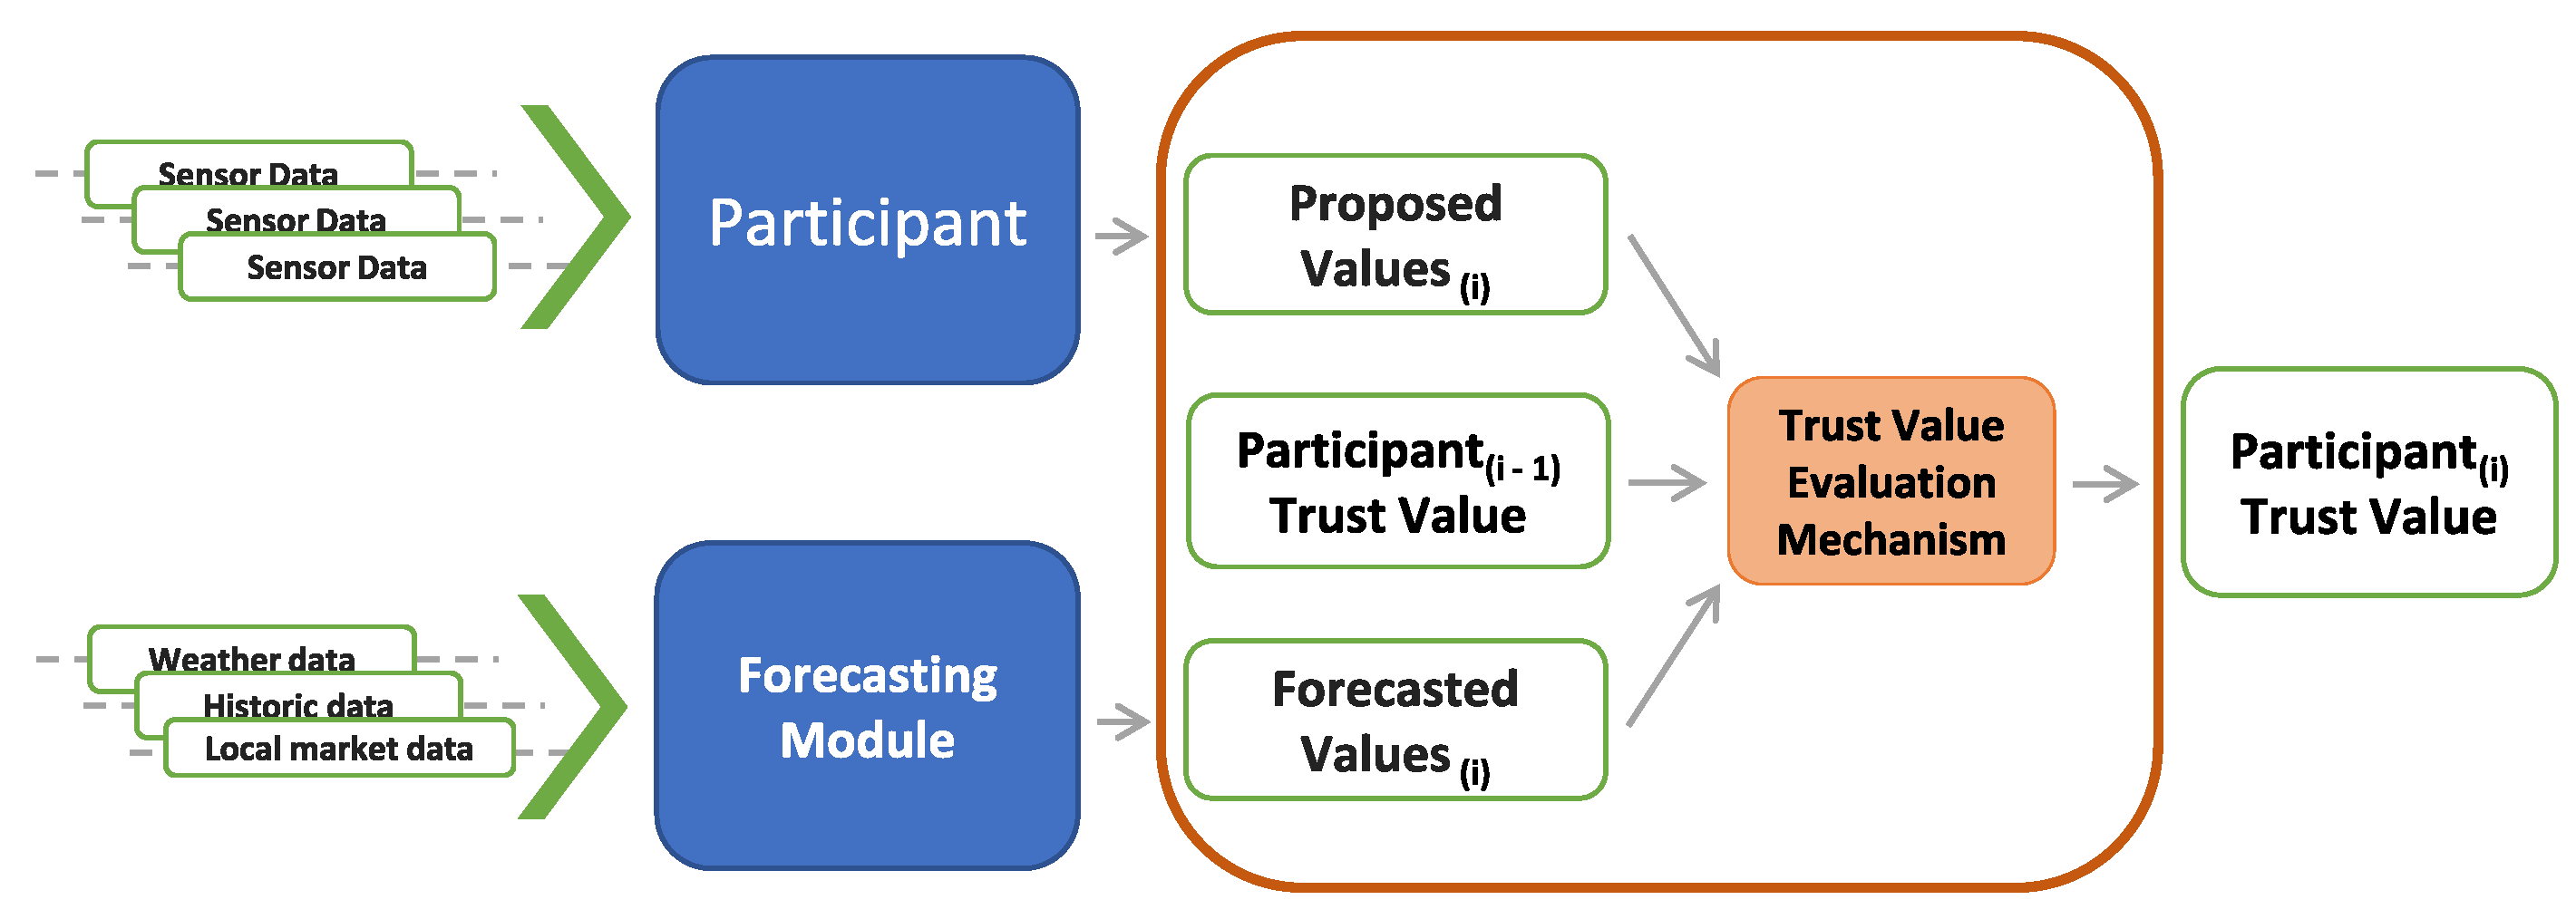
Figure 2 presents a diagram of the proposed trust evaluation process. As shown, the trust evaluation process takes three values as input: the participant’s proposed values for the current market negotiation period, the participant’s trust value from the previous negotiation period, and the forecasted value based on the participants historical and contextual data.
The definition of the proposed trust model is the following:
The trust value ranges from where 1 is the highest trust and 0 lowest trust value. The trust value for a participant p in negotiation period i is represented as .
The evaluation formula takes several variables into consideration that can be configured to obtain the best possible results, these variables are:
: represents the variable acceptance range, which is a percentage value;
: represents the fixed acceptance range, which is a static value;
: represents the trust increase value, a value by which the participant’s trust is increased;
: represents the trust decrease value, a value by which the participant’s trust is decreased;
: represents the submitted value by participant p, from the data source of sensor n in market negotiation period i;
: represents the forecasted value for participant p, for sensor n in negotiation period i;
: represents the default trust value, the trust value which all participants start with.
Equation (
1) shows how the trust evaluation is calculated by being combined with either the Equation (
2) for the asymmetric acceptance range or the Equation (
3) for the symmetric acceptance range.
The difference between the asymmetric and the symmetric acceptance range is that the asymmetric has a higher acceptance range when the forecasting mechanism overestimates the value, since a percentage from a higher value results in a higher range.
There needs to be some consideration of how each participant’s trust value is interpreted. Two things need to be taken into account: a participant that always submits real and true values should be fully trustworthy and so should be evaluated with a trust value; on the other hand, a participant that always submits false values should not be trusted and should have a trust evaluation of .
There is, however, some subjectivity in considering these trust evaluations. For example, a participant that always submits real and true values and is evaluated with a trust value, or a participant that always submits false values and is evaluated with a trust value, also seem like acceptable evaluations. Given this subjective nature of the trust evaluation, three trust ranges are proposed:
Trustworthy: range where the trust value is , and any participant in this range is fully trusted;
Unsure: range where the trust value is , and any participant in this range is considered to be a possible malicious or faulty participant and should, for example, be further evaluated by the market authority;
Untrustworthy: range where the trust value is , and any participant in this range is considered a malicious or faulty participant and should be prevented from participating in the market.
The values of minimum threshold for high trust and minimum threshold for medium trust are variable values that can be configured accordingly to the needs of the LEM.
4.2. Cyber-Security Model
Having a trust model capable of correctly analyzing the trust evaluation of participants supports the LEM negotiations; however, this kind of analysis leaves an important aspect neglected, the origin of a malicious proposal.
To fully understand the safety of negotiations, it is also necessary to consider the traditional security aspects. The idea behind the security model is to analyze the data coming from the sensor agents to discover potential security intrusions.
Discovering a security intrusion would also influence the ability of a participant to negotiate in the market. Regarding the cyber-security aspect we consider a simple binary classification for participants:
Secure,
Insecure. This leaves us with the final possible participants classifications in
Table 1.
Considering the classifications from
Table 1 the participants with classifications of:
Insecure Trustworthy,
Insecure Unsure and
Insecure Untrustworthy should be prevented from negotiating because they can be under a cyber-attack. Participants with a classification of
Secure Untrustworthy will also be prevented from negotiating as their trust score does not allow it. Participants classified as
Secure Unsure are in a grey area where they can be allowed to participant, but further investigation is required in order to ensure if the negotiations are at risk. Furthermore, lastly, the participants classified as
Secure Trustworthy will be allowed to negotiate.
5. LEMMAS Case Study
The idea for this case study is to simulate a LEM with several participants that vary in the amount and intensity of false proposals and observing how the proposed trust model evaluates these participants. Since the trust model is based on forecasting, forecasting methods are simulated as a normal standard distribution based on what the real proposal value should be, this way forecasting methods with distinct levels of accuracy and precision can be estimated, and it is possible to see how the performance of the forecasting method influences the trust model performance.
The LEM was simulated for a 24 h period and with 15 min market negotiation period duration, which results in a total of 96 market negotiation periods. Each simulation was performed 10 times, and its results were averaged. The 24 h simulated were of a Monday, simulated from hour 00:00 to hour 24:00. The LEM aggregates 4 participants using real consumption data from private homes publicly available in [
25]. Each participant has their own bias in the proposals it submits:
TP—True Proposer: Is the only who does not have a bias and always sends the real value;
LUaUP—Low Under and Over Proposer: Sends a real value 80% of the times and a value between 30% under to 30% over the real value the rest of the time;
MUaOP—Medium Under and Over Proposer: Sends a real value 50% of the times and a value between 60% under to 60% over the real value the rest of the time;
HUaOP—High Under and Over Proposer: Sends a real value 30% of the times and a value between 90% under to 90% over the real value the rest of the time.
With these participants configurations, the expected result is a correlation between the trust value of the participant and the amount of false submissions. The True Proposer acts as a base line showing if trustworthy participants are being correctly identified.
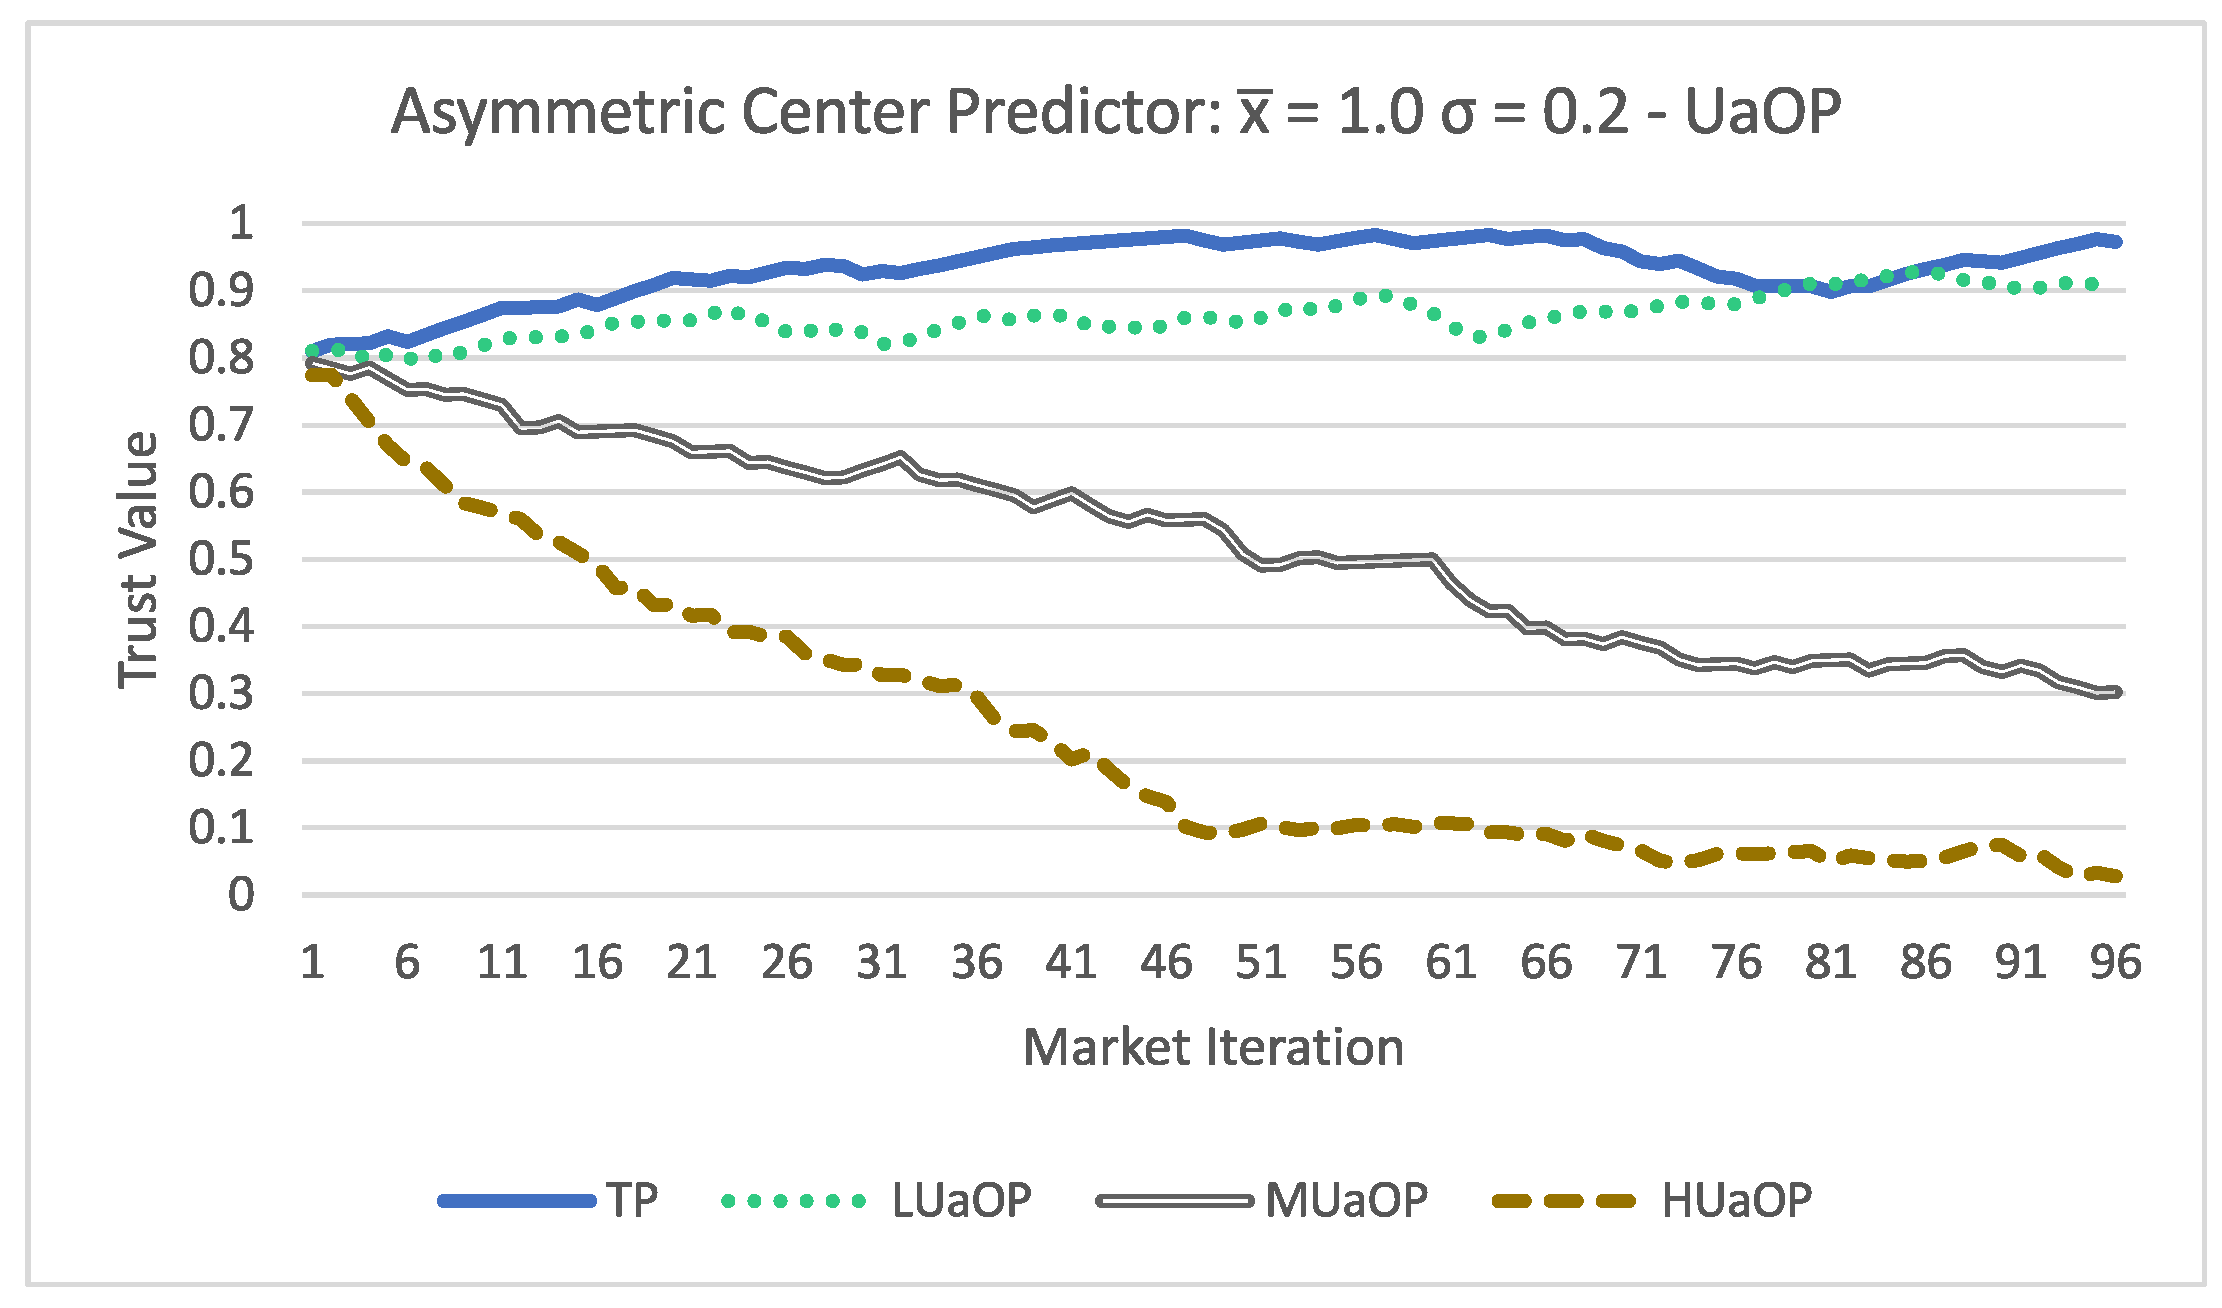
As for the estimated forecasting methods, four were simulated, in decreasing levels of accuracy and precision. The estimated forecasting methods have the following mean and standard deviation :
Perfect Predictor: ;
Low Center Predictor: ;
High Center Predictor: .
The simulations are preformed with both the symmetric and asymmetric acceptance methods. Lastly, the trust formula variables are configured as such: , , and ; and the trust ranges are: Trustworthy, Unsure and Untrustworthy.
These values were chosen after some experimentation, as they proved to be adequate values for the specific scenario in study.
Case Study Results and Discussion
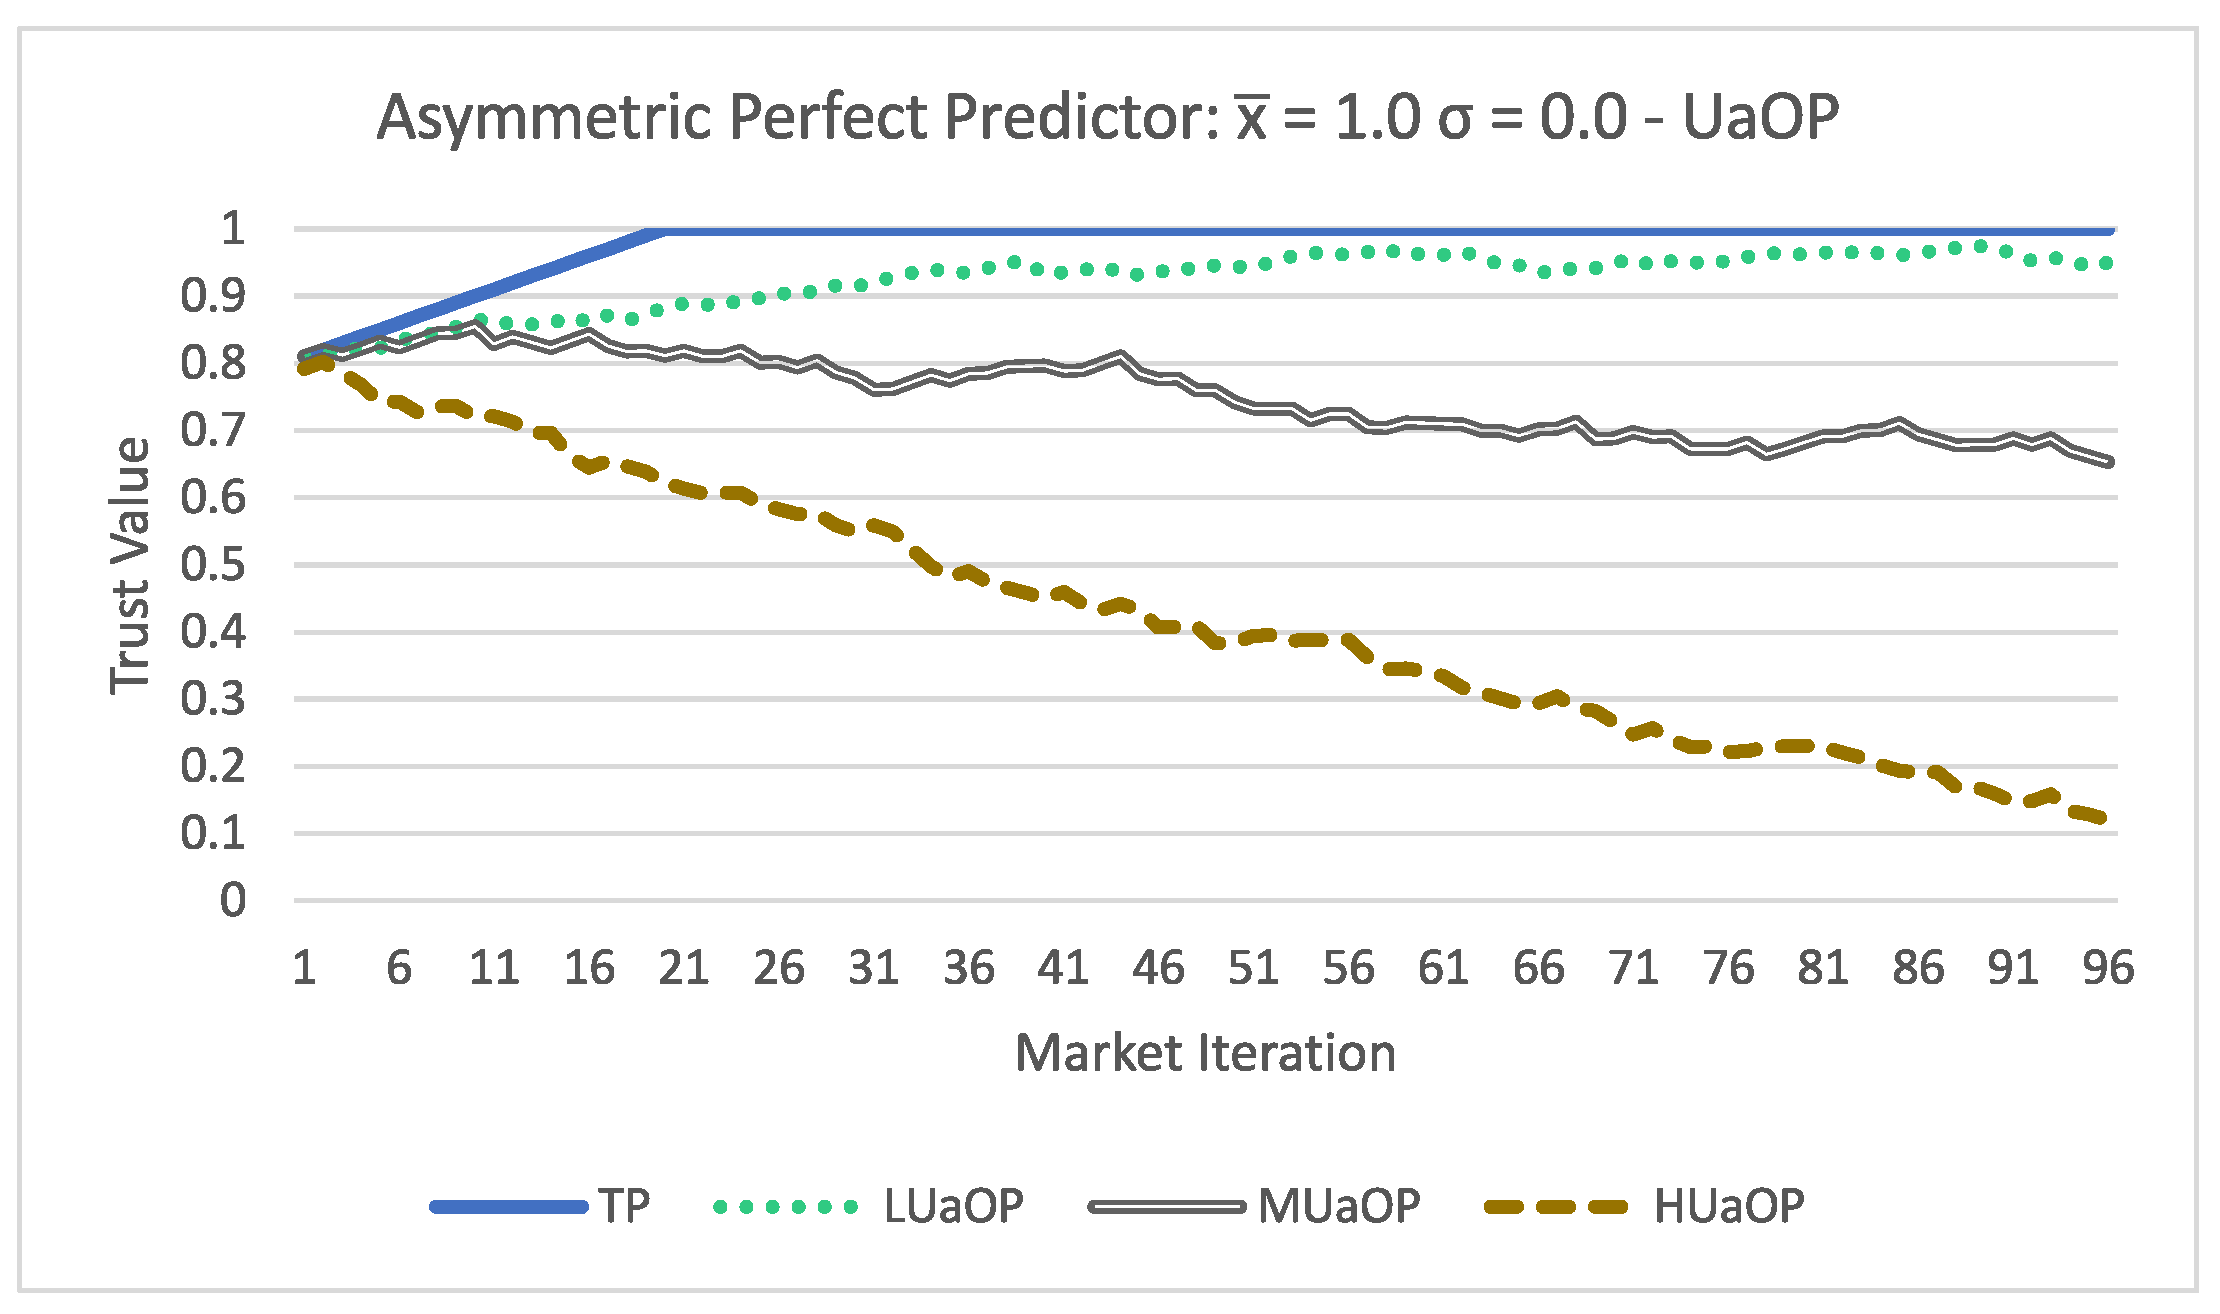
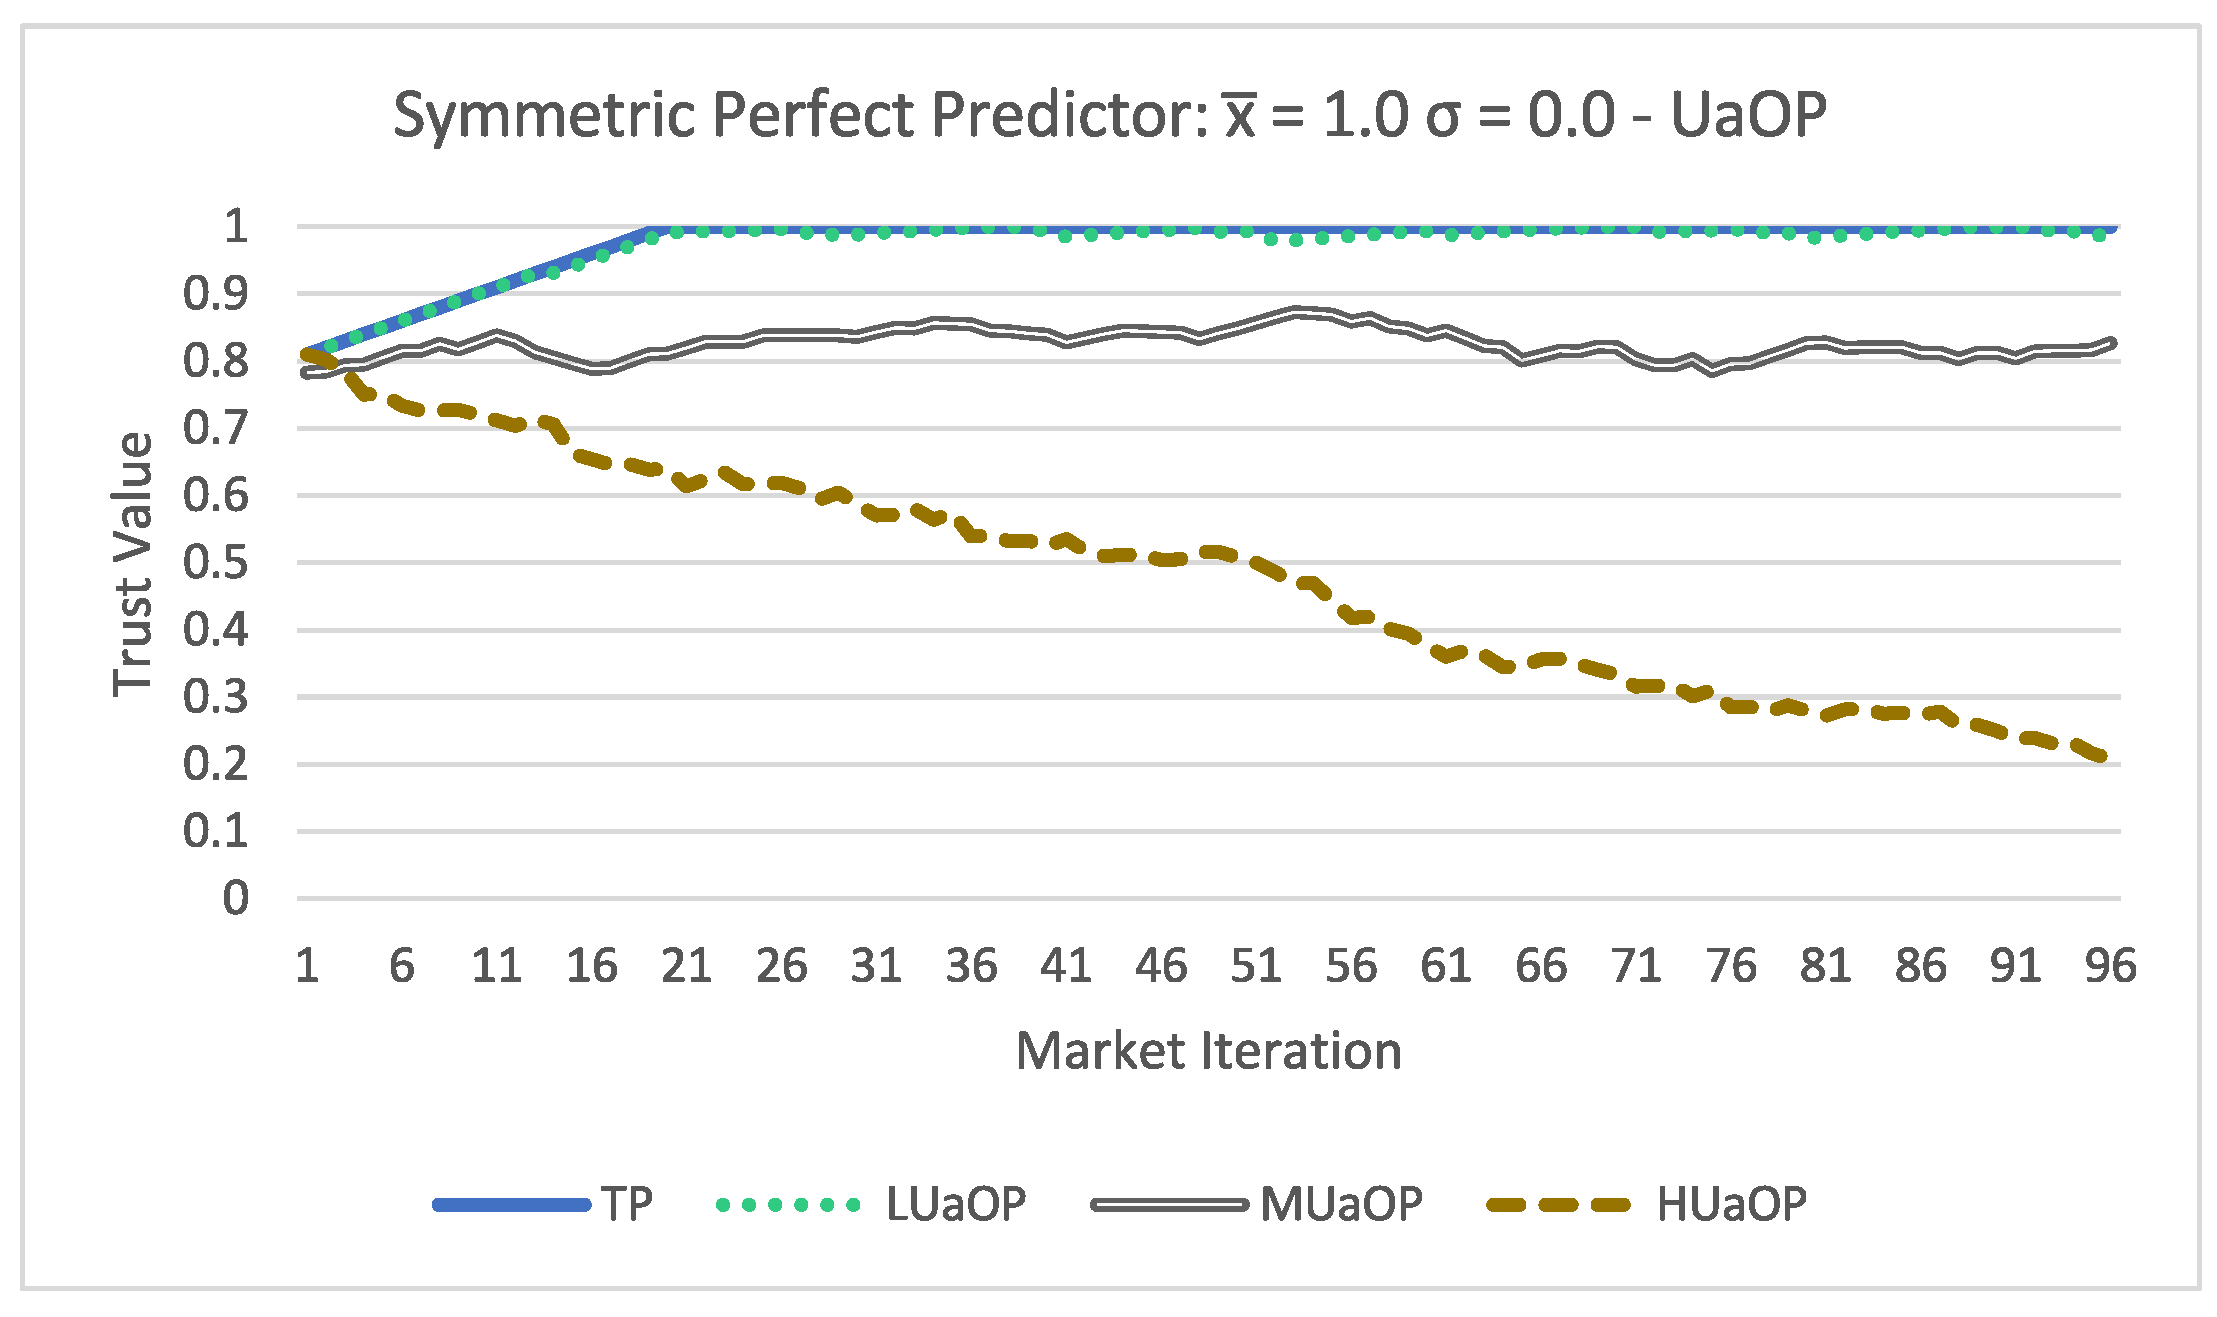
To present these results in a clear way, each simulation was divided into 2 graphs showing the trust value for each participant over time, separated by the forecasting method and acceptance method.
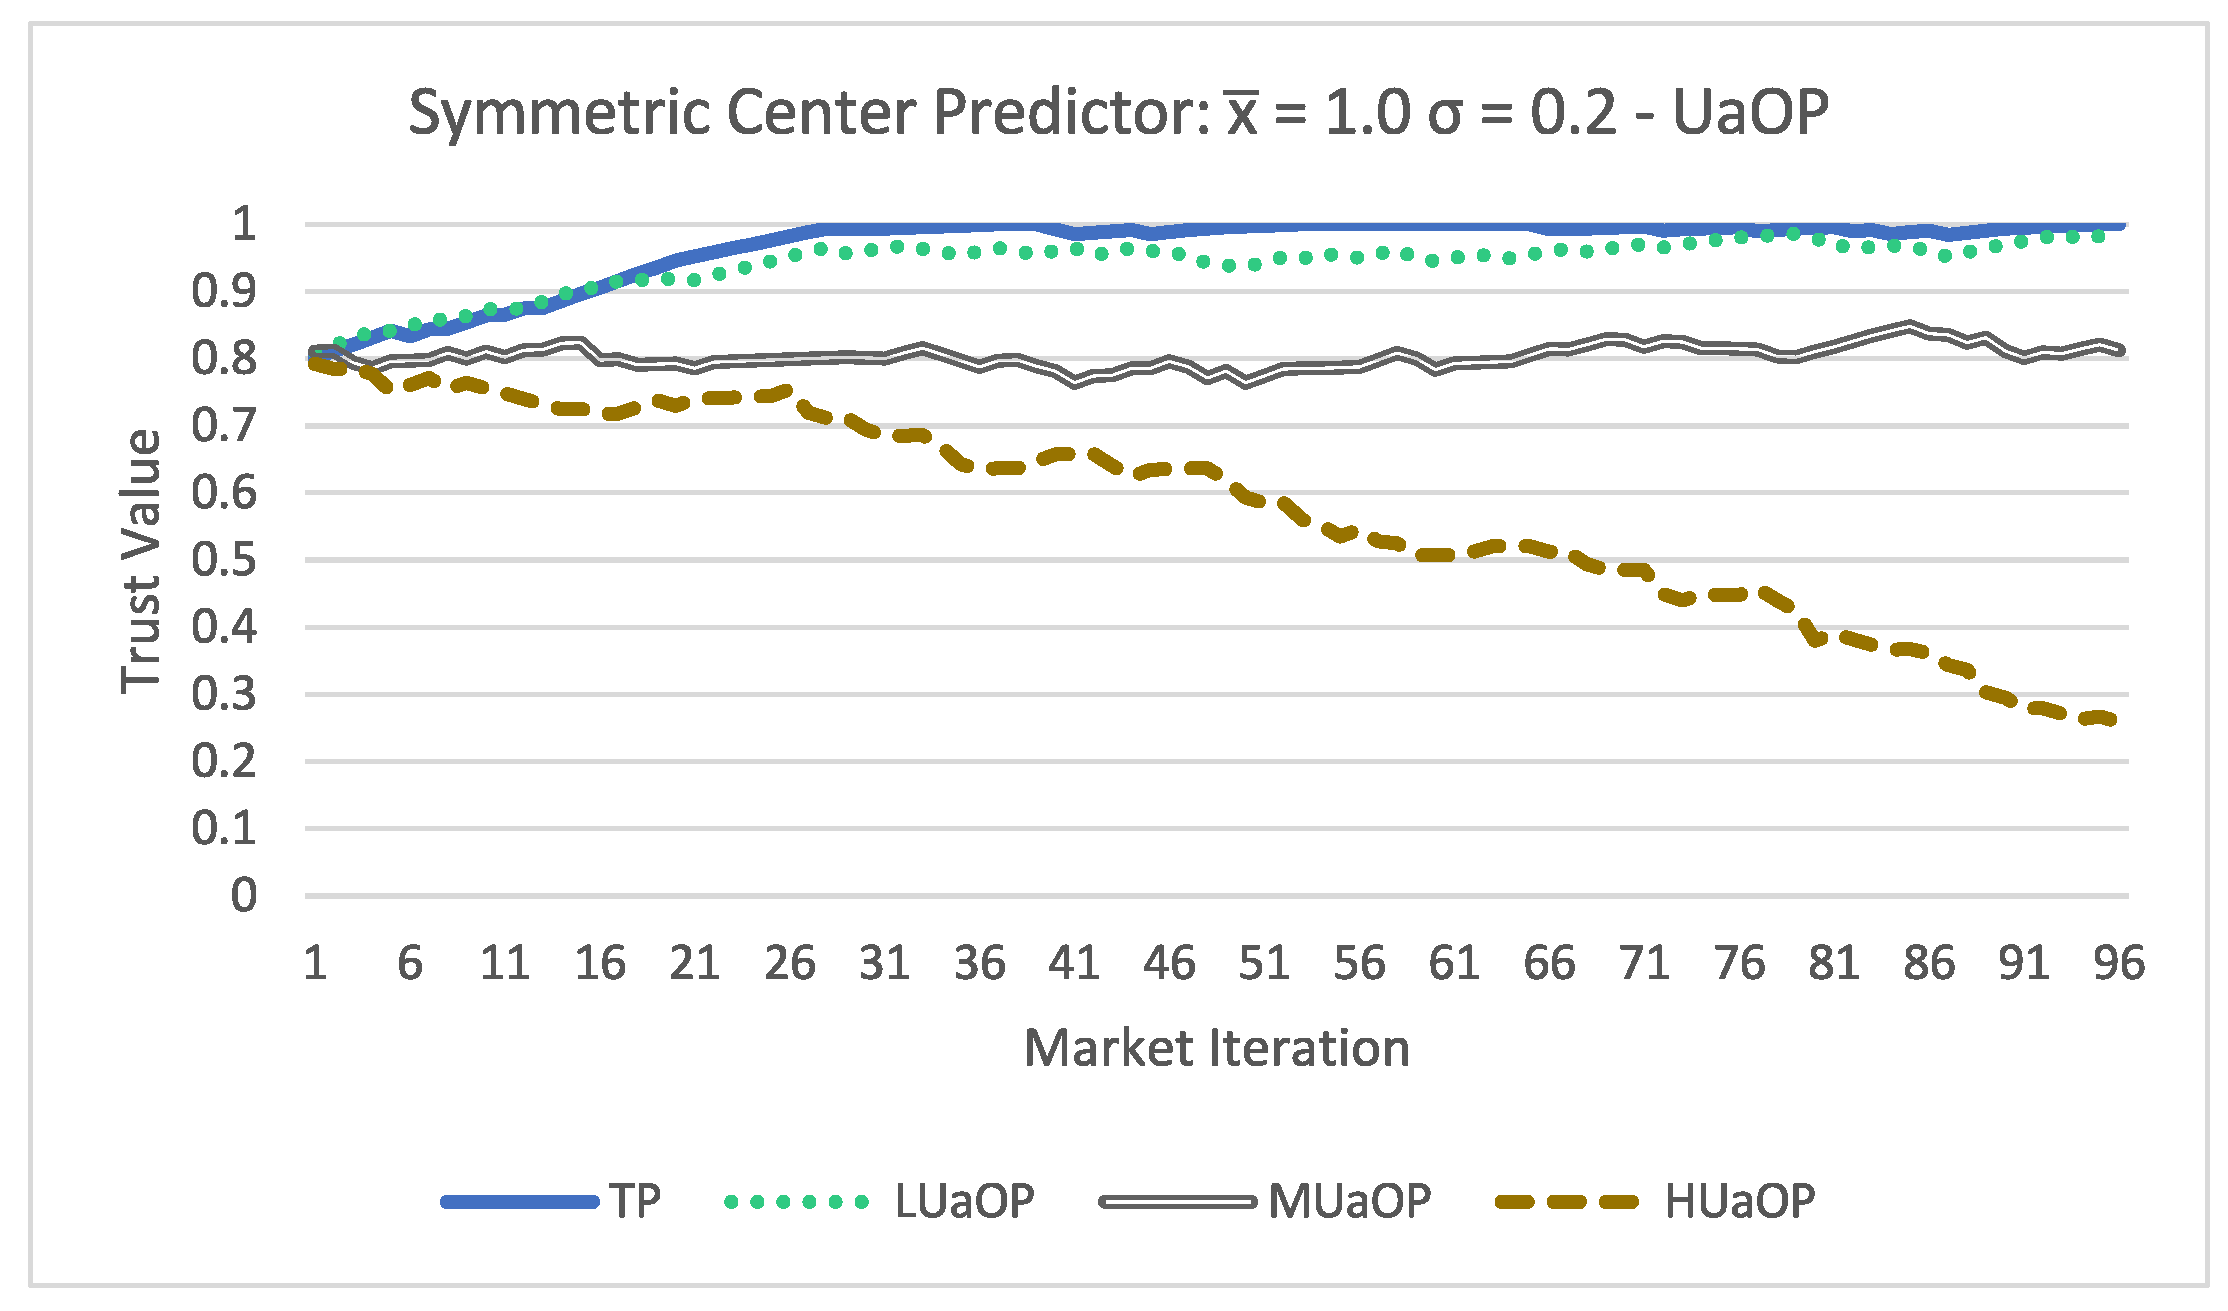
Looking at
Figure 3, there is a clear distinction in the trust evaluation of each participant. Analyzing
Figure 4, the results have some changes from the asymmetric model. All participants obtained a higher trust value compared to the results of the asymmetric acceptance.
Figure 5 and
Figure 6 show different result. In the previous estimator the trust value for the TP participant was always
, but now with the uncertainty in the estimated forecasting method the trust value oscillates; however, it remains close to
. In
Figure 6, the results are very similar to the ones obtained with the Perfect Predictor. The biggest difference is in
Figure 5 where the TP and LUaOP participants obtained trust values very similar to the ones obtained with the Perfect Predictor, and the MUaOP and HUaOP participants obtained evaluations significantly lower. This demonstrates that the acceptance formula used can make a big difference in the results.
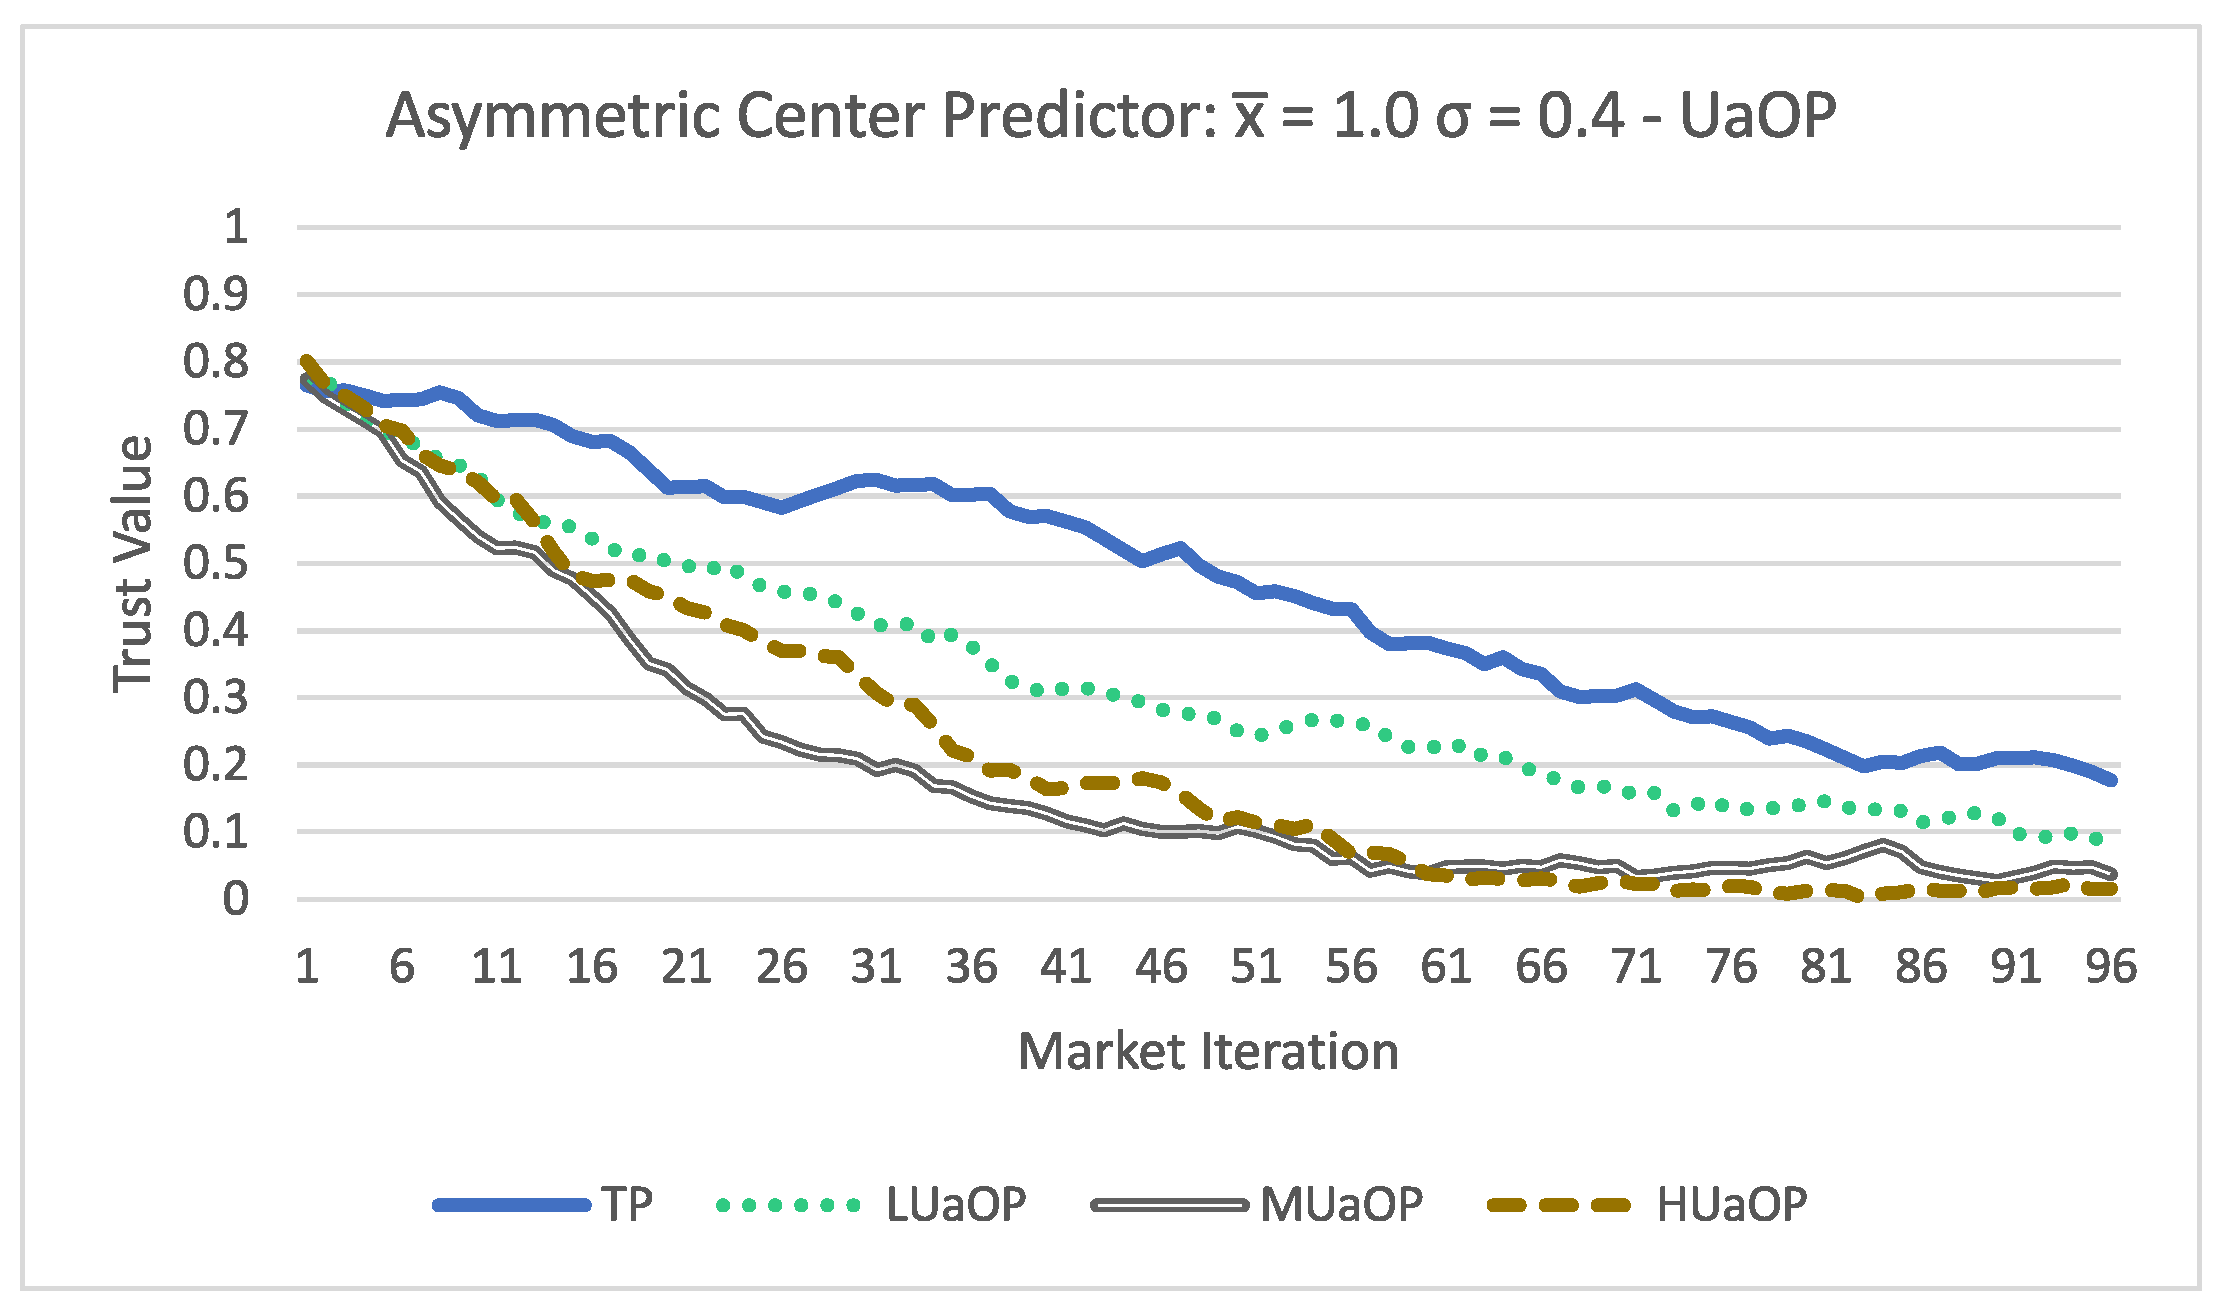
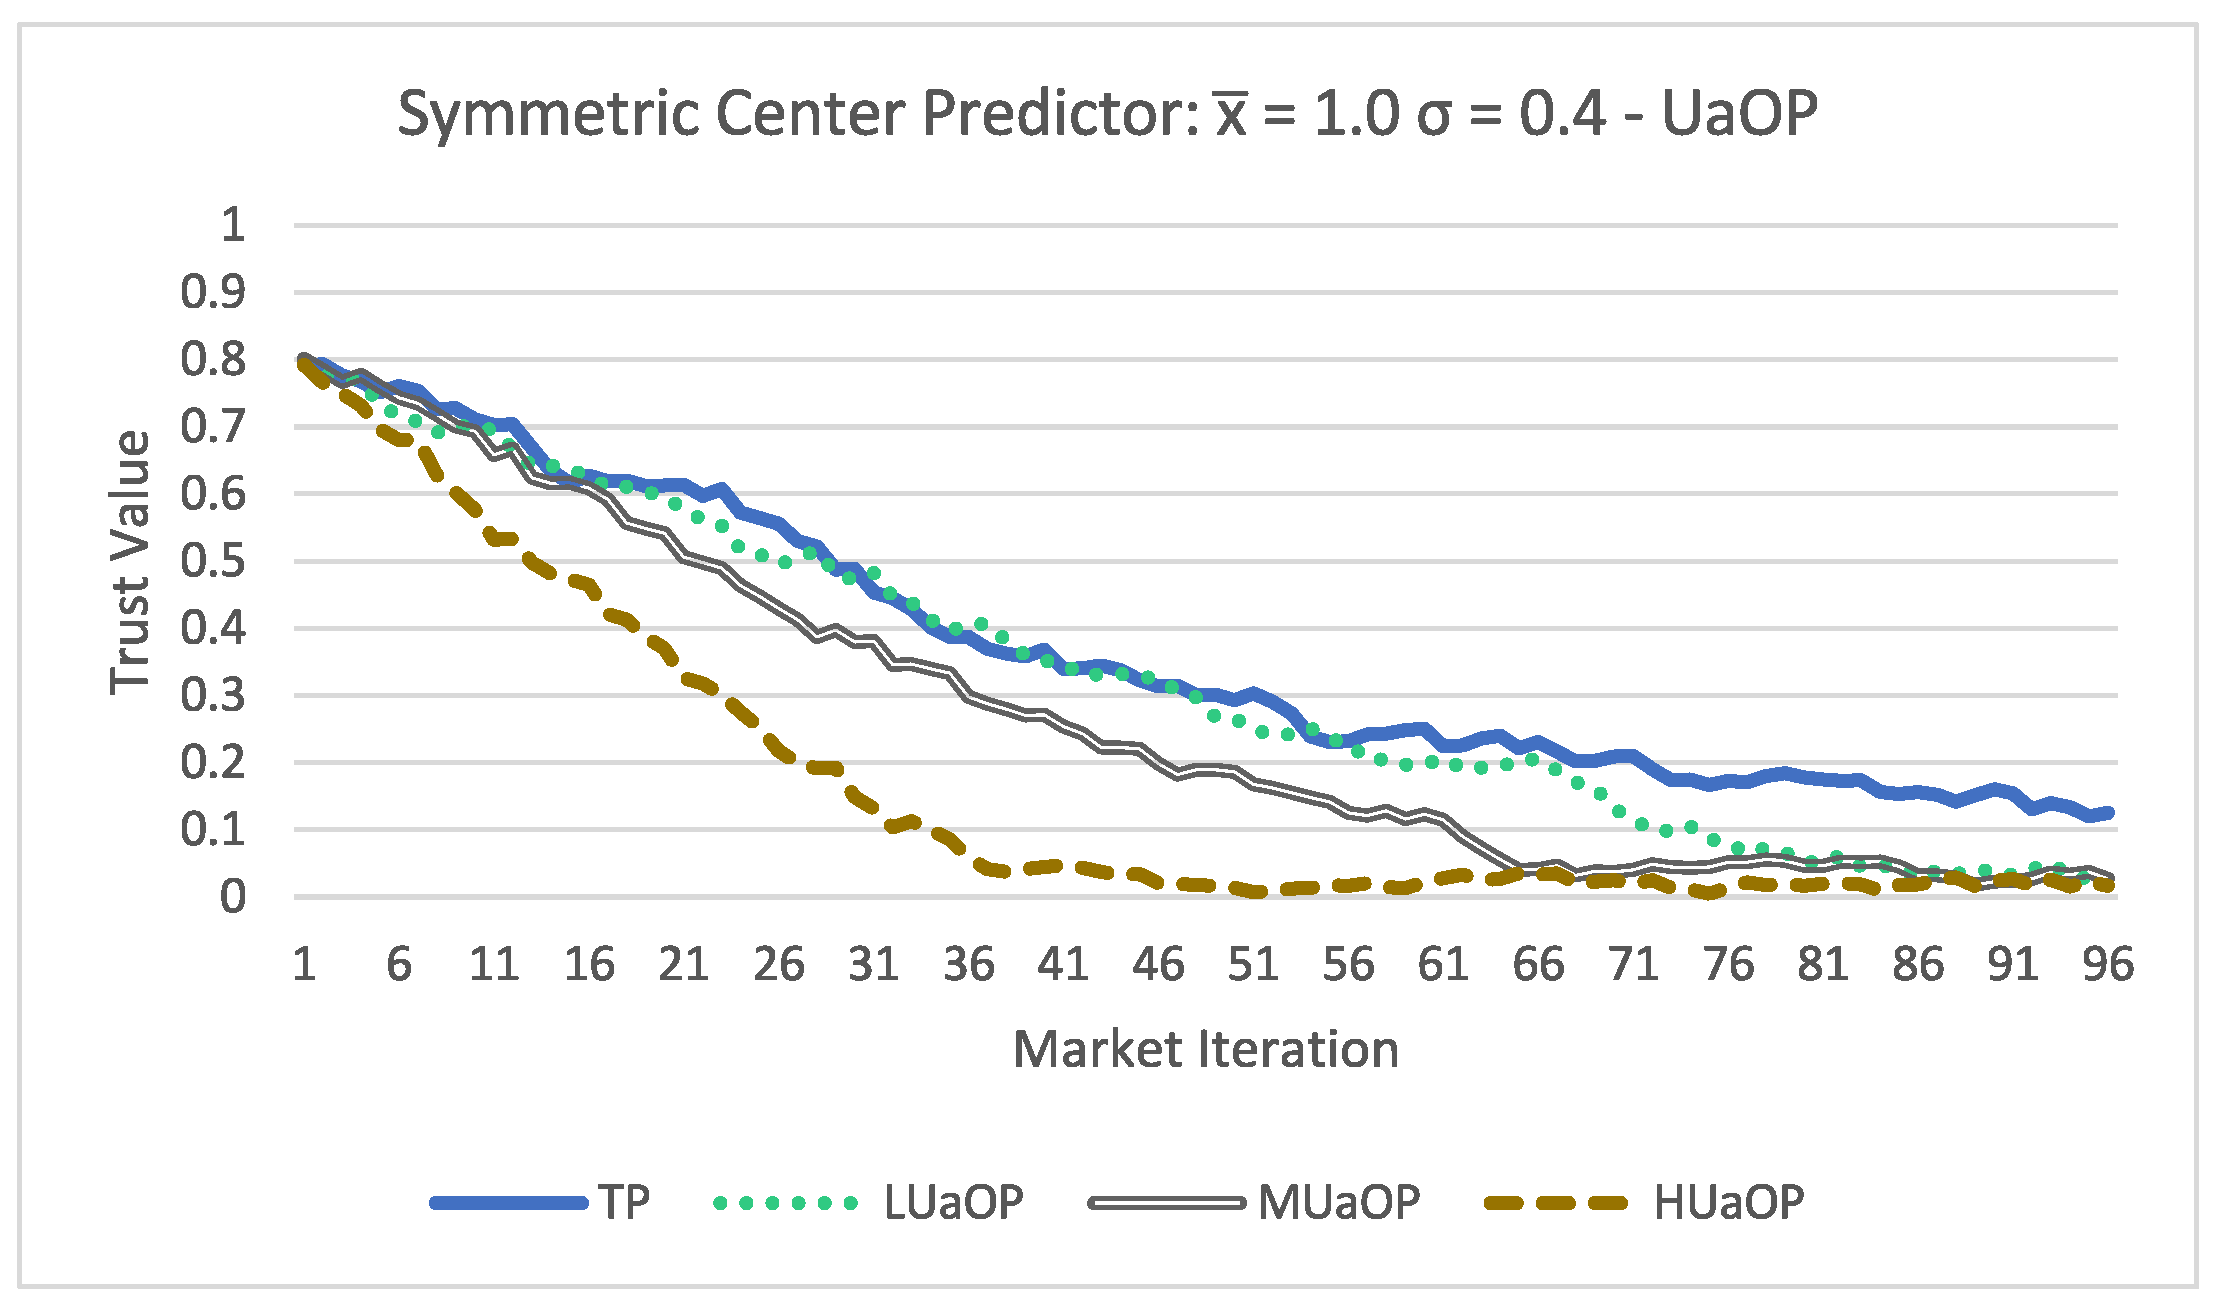
Lastly both
Figure 7 and
Figure 8 show low trust evaluations for all participants. There are some differences in the way the trust value changed over time between the asymmetric and symmetric acceptance formulas; however, at the end, the values are very similar (all below
). Even the TP participants obtained a low trust evaluation, and this result shows that with a low performing forecasting method the trust evaluation is also low performing.
Finally these results lead us to conclude that:
Using the proposed trust methodology, it is possible to dynamically update the trust value of a participant;
The MIM agent is able to use the proposed trust methodology to access the trust value of a participant;
The performance of forecasting methods has a direct impact on the trust evaluation;
The acceptance formula can have an impact on the trust evaluation;
The higher the amount of false values a participant submits, the lower their trust value will be.
6. Developed Security Model and Analysis
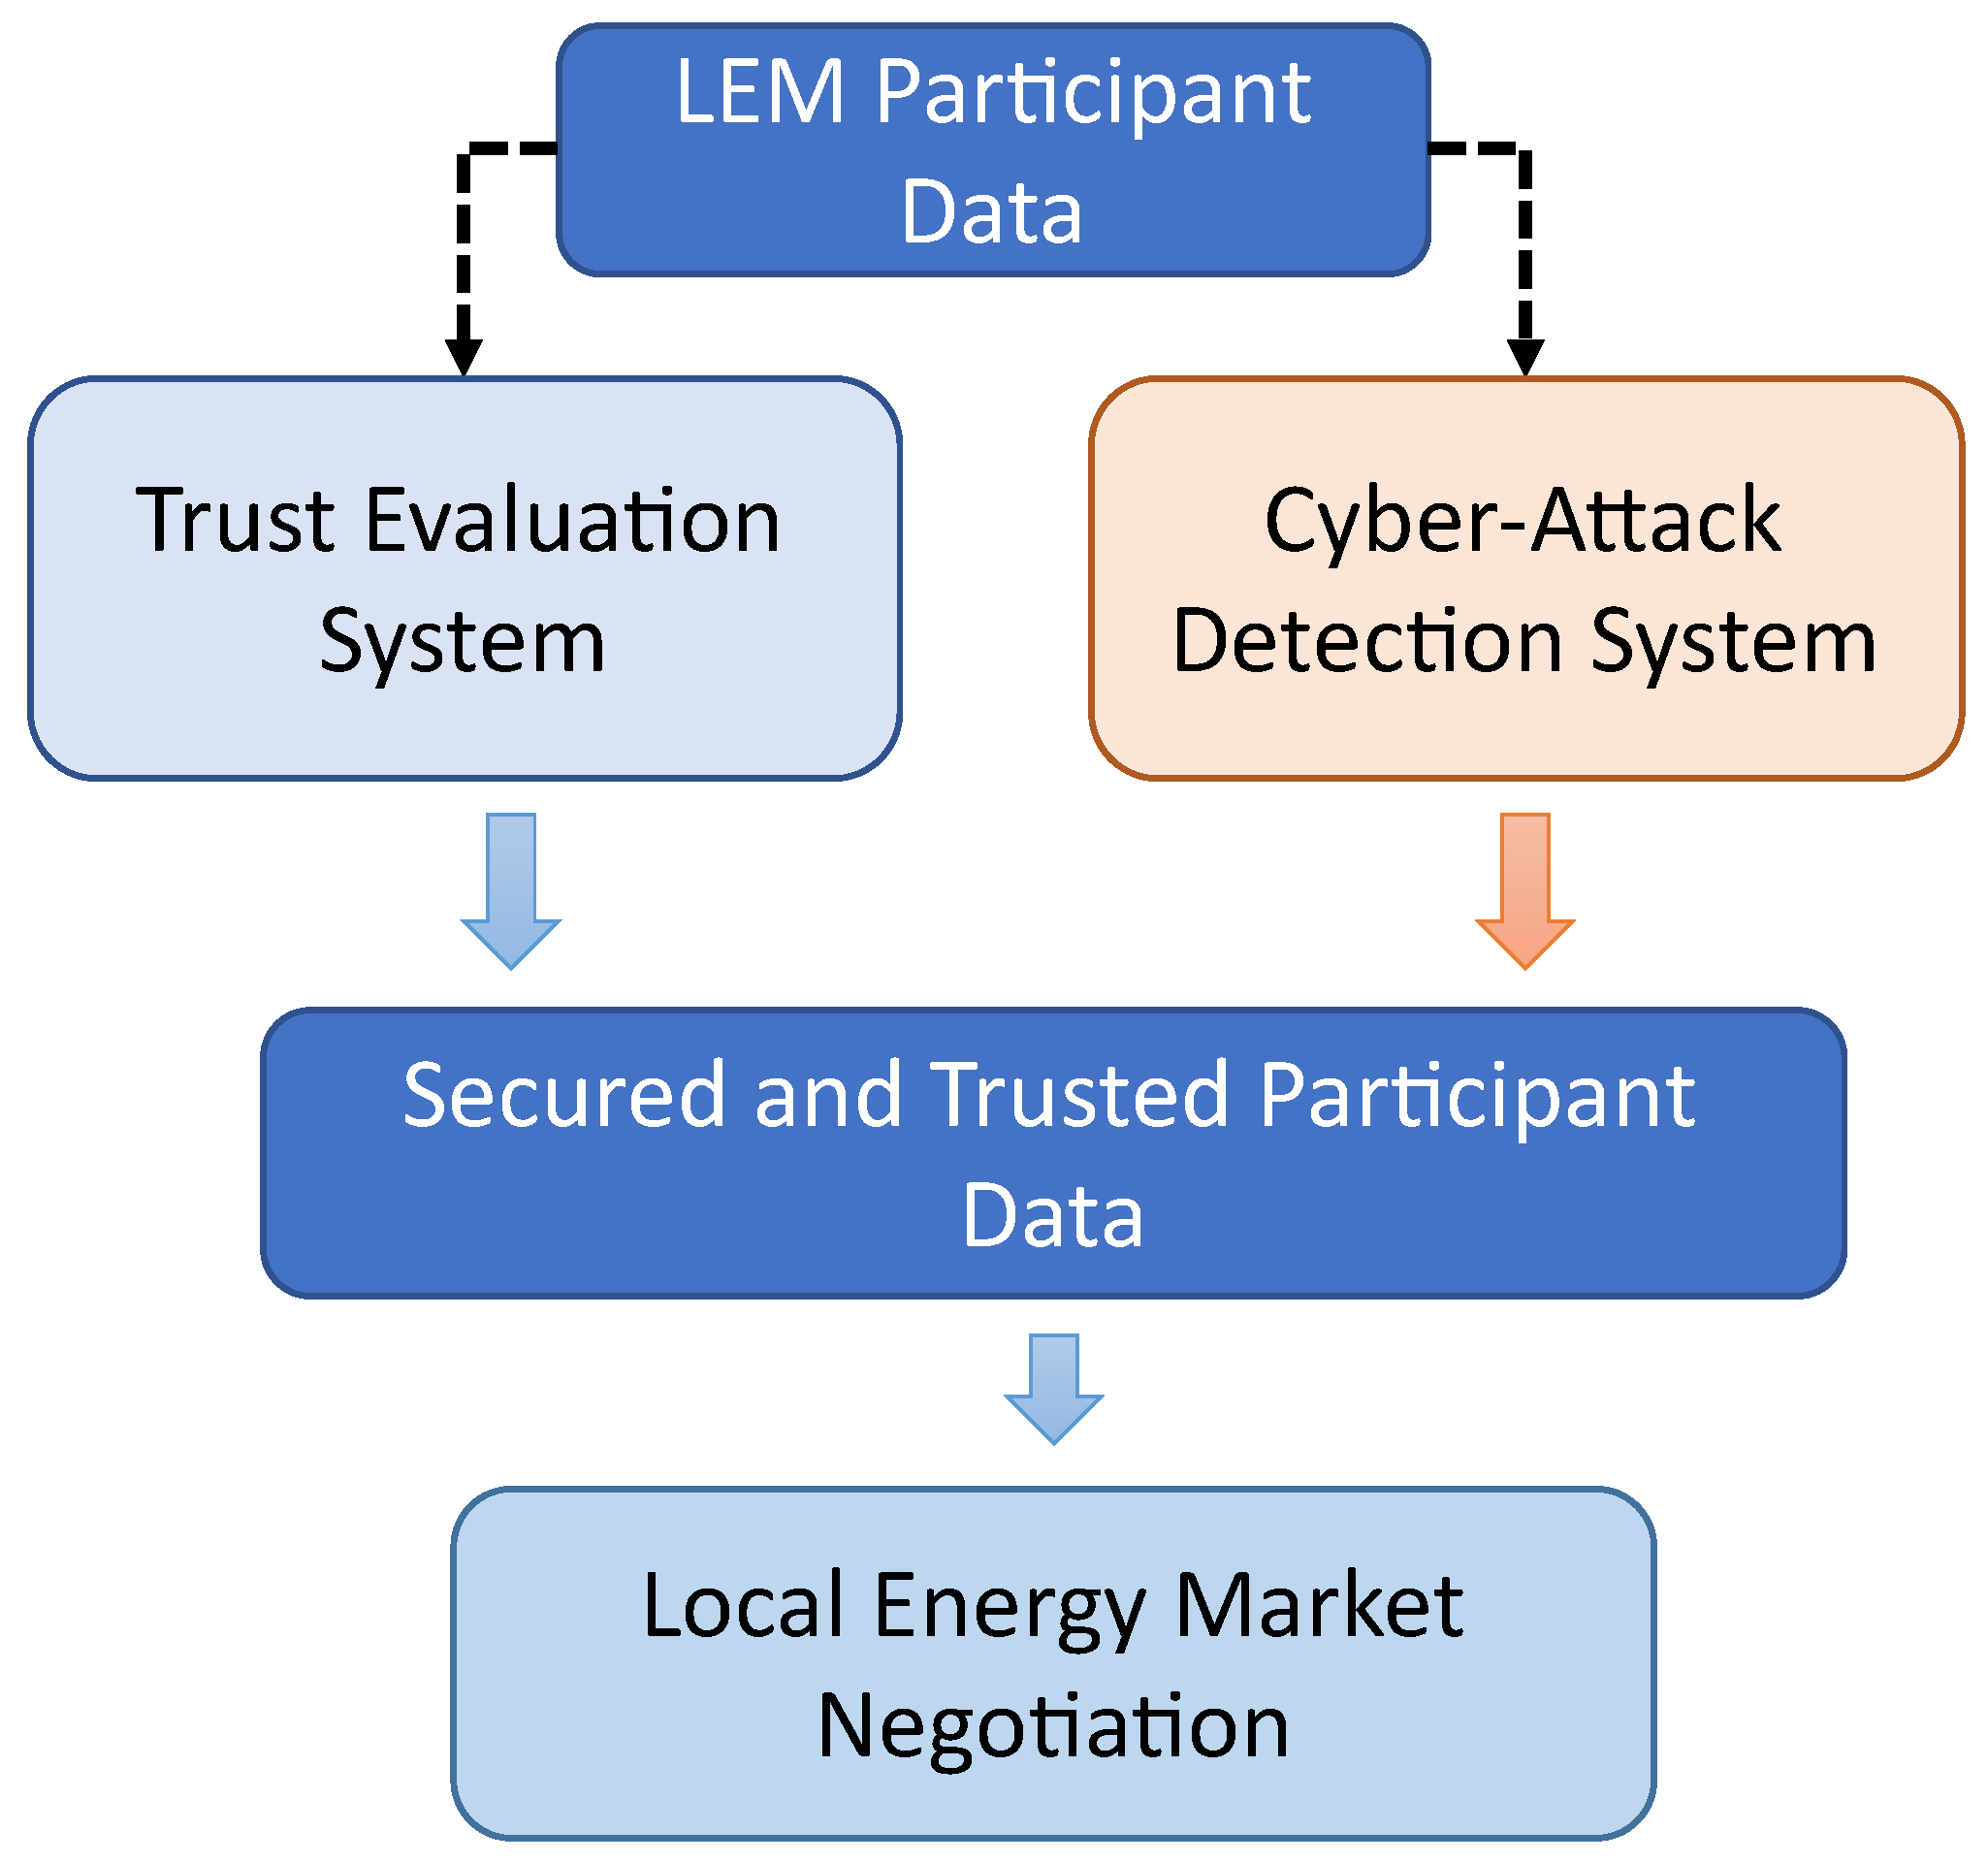
As our proposed LEM architecture is based on IoT sensors and their representation as sensor agents, it is fundamental that the information and network communications coming from the sensor agents is secured. With this goal in mind, a cyber-security module is needed to classify participants as described in
Table 1. A cyber-attack detection system was developed to complement LEMMAS, as is shown in
Figure 9, and the objective is to achieve a negotiation environment with only secured and trusted data.
In order to create the necessary security model the python library, Scikit-Learn was used. The goal is to train an artificial intelligent supervised classification model that can analyze the sensor data and classify it as malicious or not.
Six classification models were selected and implemented in order to evaluate which ones were the best for this application. The models are the following.
Nearest Neighbors;
Decision Tree;
Random Forest;
Neural Network;
AdaBoost;
Naive Bayes.
6.1. Dataset
Aposemat IoT-23 [
26] is a publicly available dataset containing Internet of Things (IoT) network traffic data. This dataset is labeled, including both benign and malicious data entries, and subdivided into 23 sub datasets, 20 containing malicious cyber-attack samples and 3 containing only benign data samples. The data was collected between 2018 and 2019 in three kinds of IoT network devices, namely a Philips HUE smart LED lamp, an Amazon Echo home intelligent personal assistant and a Somfy smart doorlock. These kinds reflect some of the devices that would be part of a smart-home in a smart-grid and as so are aliened with the data generated and collected by LEM participants.
Table 2 presents the different datasets showing which ones include malicious samples, the IoT devices involved, the duration of the attack, the number of packets recorded, the information flows and the size in (GB).
The dataset structure contains the following fields:
ts—Time of the connection;
uid—Unique identifier for he connection;
id.orig_h, id.orig_p, id.resp_h, id.resp_p—Ports and addresses used in the communication;
proto—Communication protocol used;
service—Service protocol used;
duration—Duration of the communication;
orig_bytes, resp_bytes—Bytes sent in the communication;
conn_state—State of the connection;
local_orig, local_resp—Origin of the communication;
missed_bytes—Bytes missed in the communication;
history—History of the state of the connection;
orig_pkts—Number of packets sent in the original message;
orig_ip_bytes—Number of IP level bytes sent in the original message;
resp_pkts—Number of packets sent in the response message;
resp_ip_bytes—Number of IP level bytes sent in the response message;
tunnel_parents—UID of tunnel parents connections;
label—Label of the sample (malicious or benign);
detailed-label—Detailed label of the sample (specific attack used in case of a malicious sample).
6.2. Dataset Pre-Processing
In order to utilize this dataset to train an evaluate models, first a pre-processing step was needed.
The dataset was divided into X and Y, with Y being the target column “label” and X being the remaining data. The columns of “UID” and “ts” were dropped as they do not provide any valuable information. The column “detailed-label” was also dropped since the current objective is only to classify as “Malicious” or “Benign”, meaning s binary classification. All columns containing IPs were converted to the corresponding integer number. The columns of “proto”, “service”, “conn_state” and “history” were also converted to a numeric value. Regarding missing values, all are imputed and replaced by the median corresponding value. Lastly, the data was randomly split in 80% train data and 20% test data.
6.3. Train, Test and Results
Due to the specifications of our test machine, 64 GB of RAM, 20 cores CPU and a GPU with 8 GB, and the large size of parts of the datasets only some datasets were used, namely: Capture-1-1, Capture-8-1, Capture-3-1, Capture-42-1 and Capture-34-1. Within these datasets, only Capture-1-1 was balanced in the percentage of malicious an benign samples, so we decided to create 3 sub datasets: Capture-1-1 SMALL, Capture-1-1 MEDIUM and Capture-1-1 LARGE, created by randomly selecting samples of each category in a balanced way. The original Capture-1-1 dataset was also used with the name Capture-1-1 FULL. We decided to use this approach to analyze how the performance of the algorithms changes with more data.
Table 3 presents in detail the information about the datasets used, including the time it took for each one to be processed. To train and test the model, we used a 80/20 data split, 80% for training and 20% for testing. The analyses were performed with a 5 fold cross validation.
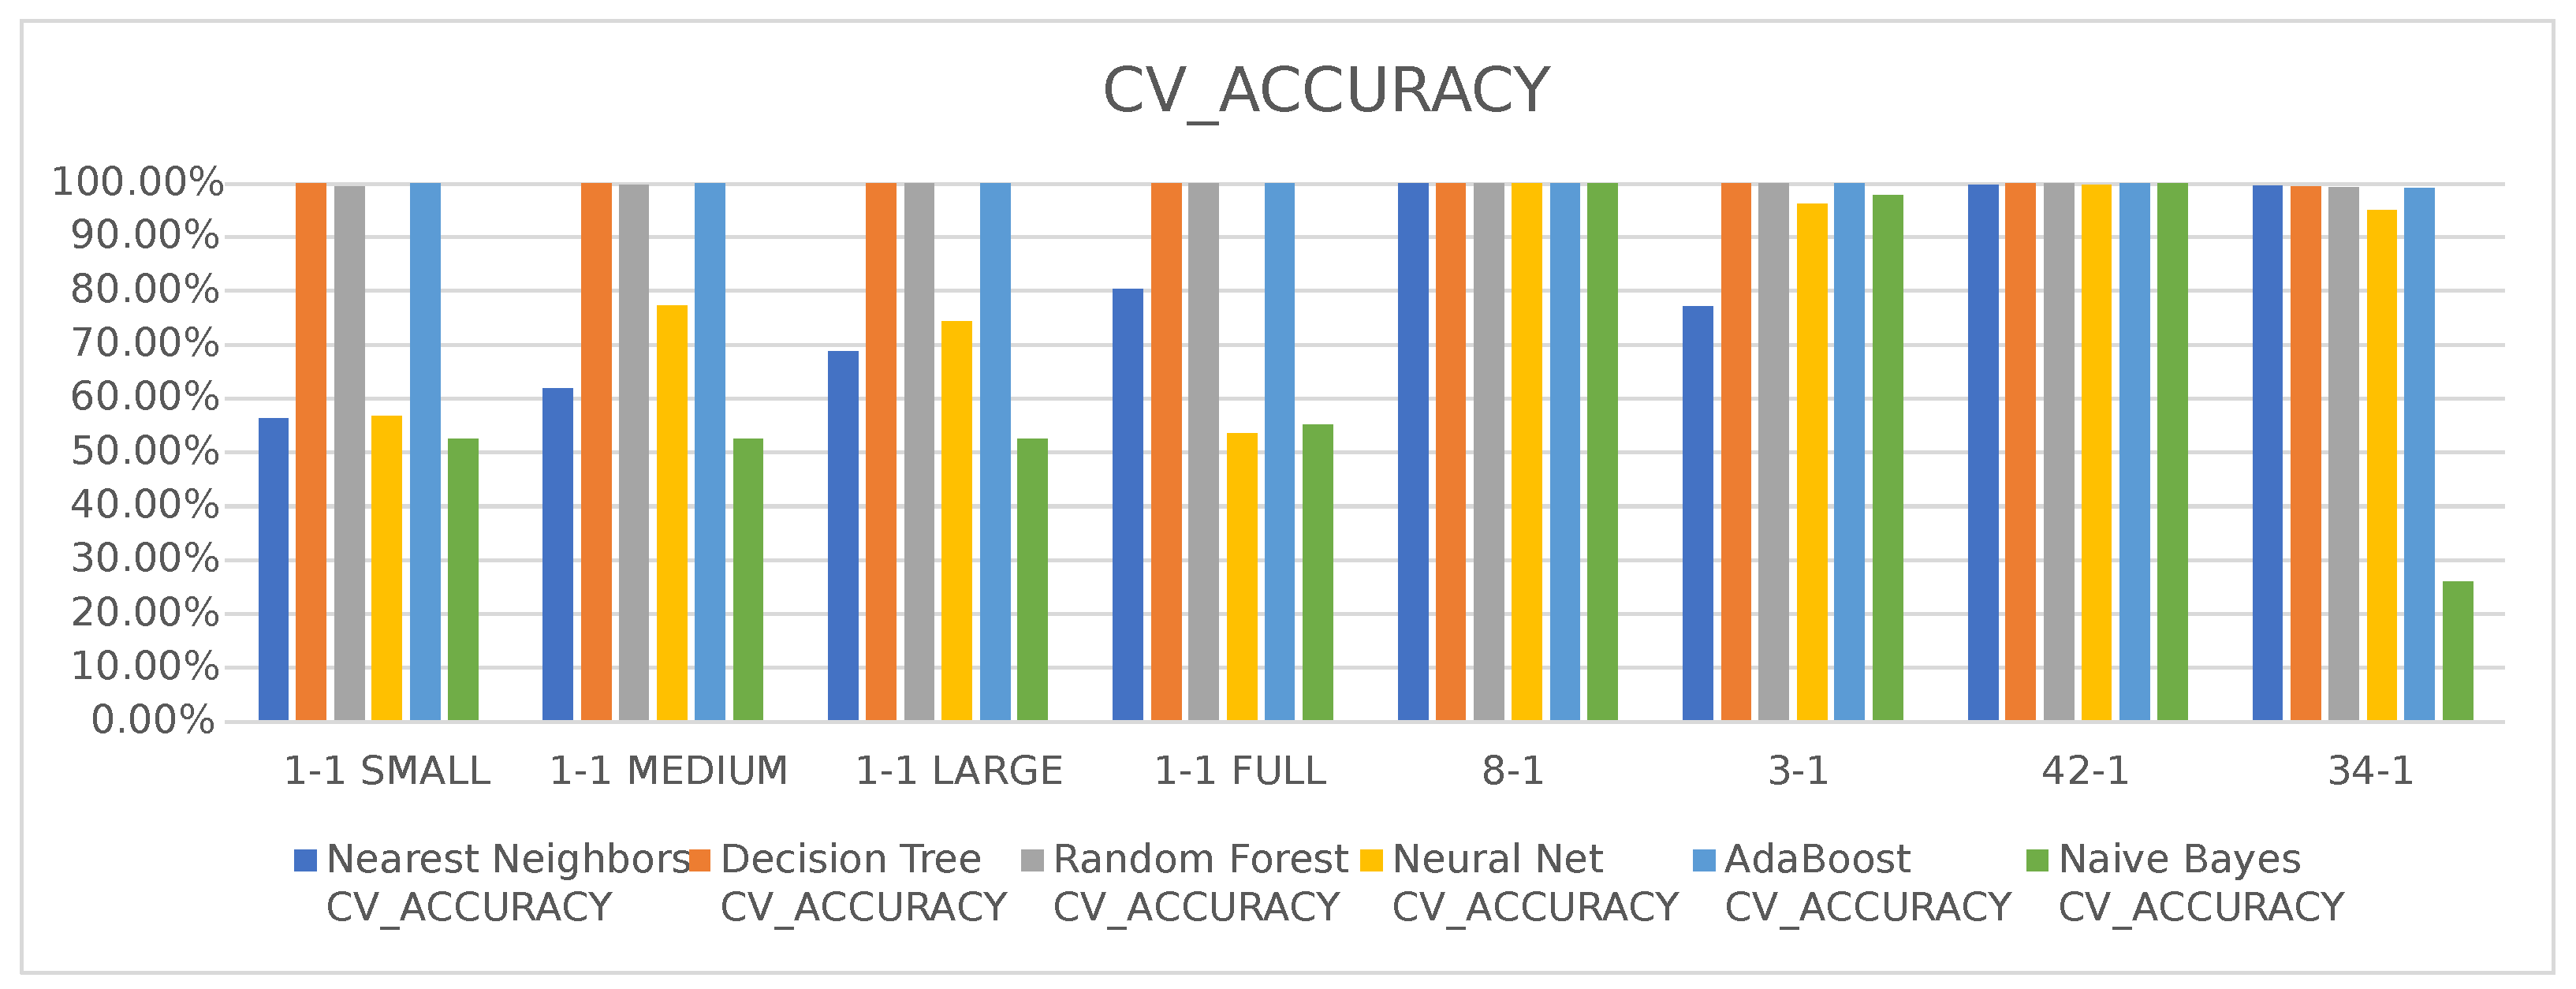
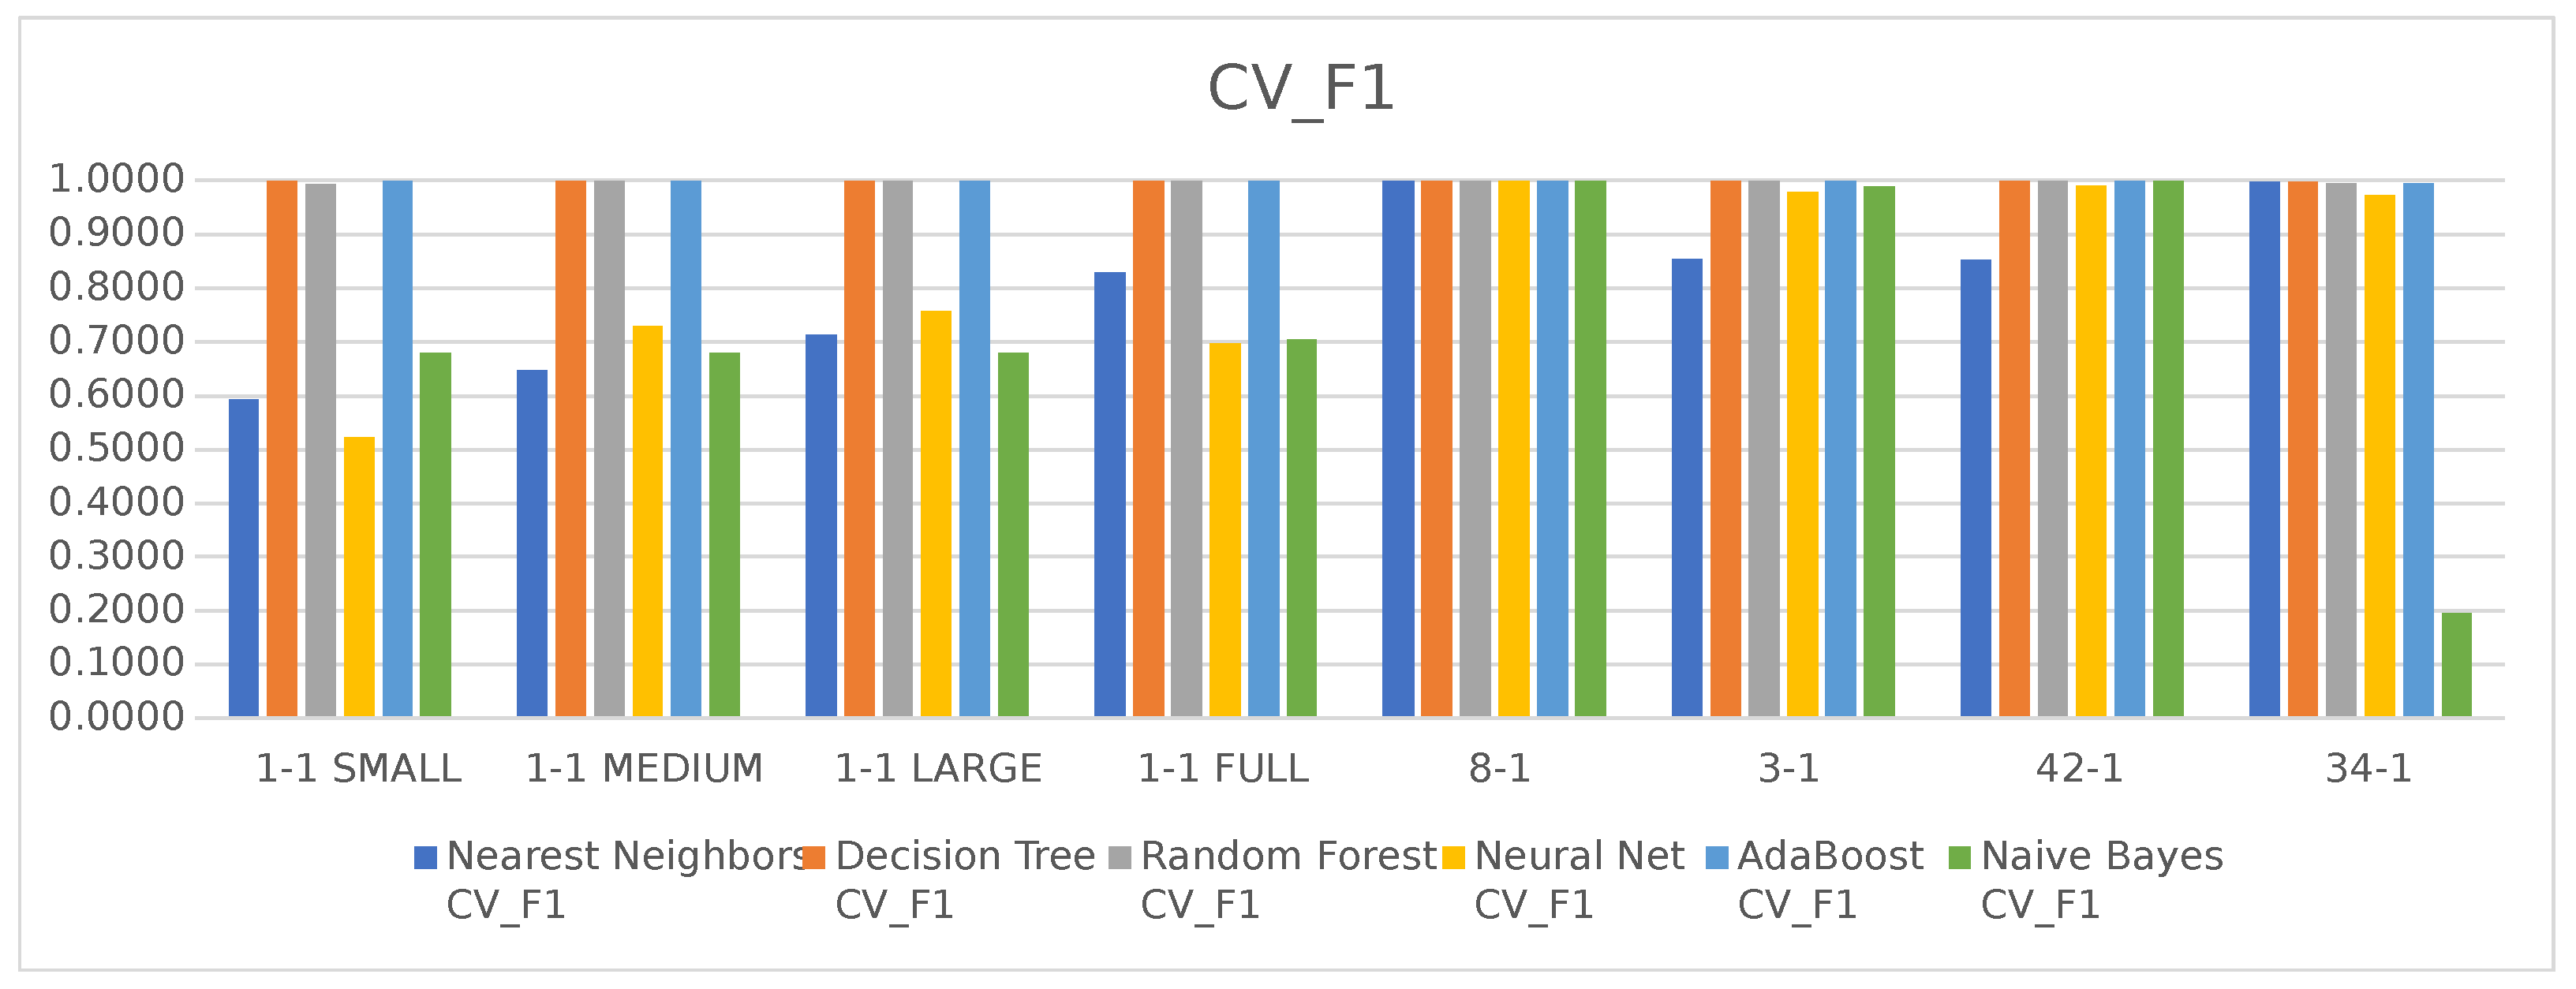
Looking at the results from training and testing presented in
Figure 10 and
Figure 11, we can see how each technique performed with each dataset.
Regarding the unbalanced datasets, Capture-8-1, Capture-3-1, Capture-42-1 and Capture-34-1, almost all techniques achieved great results with the exception of Naive Bayes when using the dataset Capture-34-1, where the results were low performing. However, these datasets are unbalanced, and the technique might just be over fitting one of the results.
When looking at the results for the balanced datasets, Capture-1-1 SMALL, Capture-1-1 MEDIUM, Capture-1-1 LARGE and Capture-1-1 FULL we see different results, only Decision Tree, Random Forest and AdaBoost were capable of maintaining the strong results of both Accuracy and F1 score. The different amounts of data did not change the results, it only increased the processing time, with the 1-1_FULL dataset taking more than five and a half hours to process.
Lastly, it is necessary to analyze the percentage of false positives in these algorithms, this is because a model that generates a high percentage of false positives is unpractical and will generate more confusion rather than help find and stop cyber-attacks. This metric is presented in
Table 4, where each algorithm’s false positive rate is shown for each sub-dataset tested. Looking at the results, we can see that once again Decision Tree, Random Forest and AdaBoost are the best options since they obtained a false positive scores below 1% on all sub-datasets, while the other algorithms reached more than 20% on some occasions.
7. Conclusions
The local energy market (LEM) is an emergent market model that is aimed towards solving the challenges currently faced in the energy landscape. One of the requirements for the success of LEM is trust in its negotiations. The main goals in this work are the development of a multi-agent system (MAS) for simulation and modeling LEM; and the proposal of a trust model capable of ensuring trust the LEM negotiations.
A MAS was developed with three types of agents, namely: (i) the Sensor Agent, (ii) the Participant Agent and (iii) the Market Interaction Manager (MIM) Agent, each with their own responsibilities, thus facilitating, the process of modeling the market.
To give a response to the needs of trust in the LEM, a formulation was proposed to calculate a trust value for each participant based on the analysis of the participant’s historical data, contextual data, such as weather data, and by using forecasting methods to predict the participants expected behavior. The trust value given to participants evolves over time and takes into consideration its market submissions to the LEM, the forecasting of those submissions and considers the disparity between those values.
A case study was carried out in which several simulations were made with four participants using realistic consumption data and with different biases towards submitting false values. Each simulation used a different estimated forecasting mechanism with distinct levels of accuracy and precision.
The LEM was simulated for a 24 h period and 15 min market negotiation period duration, which resulted in a total of 96 market negotiation periods. This case study’s aim was to evaluate the ability of the proposed trust formulation to respond to market needs by evaluating each participant with an appropriate trust value. The realization of the case study made it possible to conclude that: (i) The forecasting methodology used has a big impact on the performance of the trust formulation, but the acceptance formula also needs to be considered; (ii) a bad forecasting method, will provide a bad trust evaluation; and (iii) the higher the amount of false values a participant submits the lower their trust value will be, which is the desired outcome.
A study was carried out to evaluate the six supervised classifications techniques implemented. The training and testing of these classifications techniques were done using the IoT-23, a dataset containing IoT device data under malicious cyber-attacks. The classifications techniques were evaluated using the Accuracy and F1 score metrics. The results showed that the techniques of Decision Tree, Random Forest and AdaBoost provided excellent results. With these results in mind we believe that further studying is necessary with larger datasets and using multi-class classification in order to improve this cyber-attacks detection model. None the less, these results show that such an approach seems viable for the local energy market.
Lastly, one aspect we want to further improve is to develop the LEMMAS system in order to make use of the security and trust models at the same time, and developing a case study to evaluate how these models perform when working together.


