1. Introduction
In the fast-paced world of technology, life is transforming into a connected universe of Internet-of-Things (IoT), assisting human needs and creating a better world. United with AI, IoT technologies that once could only be dreamed of have become reality [
1,
2]. Intelligent IoT (IIoT) systems are guiding the way in many fields like healthcare [
3,
4], smart cities [
5], smart living [
6], and transportation [
7]. Research indicates that IIoT technologies can be used in automobiles to prevent car accidents and save human lives [
8]. With smartphones’ mature sensing capabilities [
9], researchers have been intensively studying their use to provide solutions to driving-related problems [
10]. Although driving behavior detection has been studied, less attention has been paid to providing adequate feedback about driving behavior. In this work, we propose an innovative solution that offers an understanding of people’s driving style differences. Such style differences may be used to offer personality-based personalized feedback to improve driving safety.
Most smart driving behavior monitoring systems on the current market do not use personalization to offer such personalized feedback that is more useful for drivers. On the other hand, some IoT systems try to monitor each user individually, but that may require very complex human behavior analysis to offer helpful feedback. Using the personality group models, we create a simple yet effective system smartness that simplifies the human behavior modeling to give group-based feedback. Assigning a standard policy for each group creates an efficient system design that reduces processing time compared with systems with complex policies for many different drivers. It has been found that several driving behaviors are affected by emotions linking aggression to accidents [
11]; this indicates that riskier drivers are usually those who are angry, anxious, or simply careless. This paper presents AutoCoach, a personalized personality-based driving behavior management system to coach drivers to improve their driving behavior over time. We have implemented cloud-based systems that collect actual driving information to learn about user driving behavior styles, including accelerations, brakes, and turns, and use them to detect similarities and differences between drivers in a personality model. Our project has designed a driver-personality model to be used by machine learning algorithms to cluster drivers into different risk groups according to drivers’ personalities. We then use a driver’s personality attribute in a feedback policy model that decides how personal feedback should be given when aggression is detected. Our policy design also tries to give gradual positive-behavior support based on the drivers’ differences and personality assignments.
This paper extends our previous work [
12,
13] on designing a mobile-based personalized driver behavior management agent that promotes safer driving. The current agent software operates using the real-world collected and machine-learned personality models and a prototype feedback engine. This prototype has given us a useful platform to experiment with many machine-learning models, policy designs, and user experience studies. The experience of building, testing, and running IIoT in a real-world setting is essential for many future smart IoT trainer applications that aim to be user-specific and rewarding.
To our knowledge, our project is among the first to adopt machine learning capabilities to classify drivers into different risk groups to provide intelligent feedback supporting behavior adaptation. Our software architecture collects and analyzes real-time data between users’ smartphones and a cloud-based server to update the user personality model and personal scores in real-time, allowing instant drivers’ model updates. AutoCoach’s feedback engine design includes a personalized, proactive feedback-triggering feature. In this feedback model, AutoCoach understands the drivers’ differences and identifies their needs for support and encouragement.
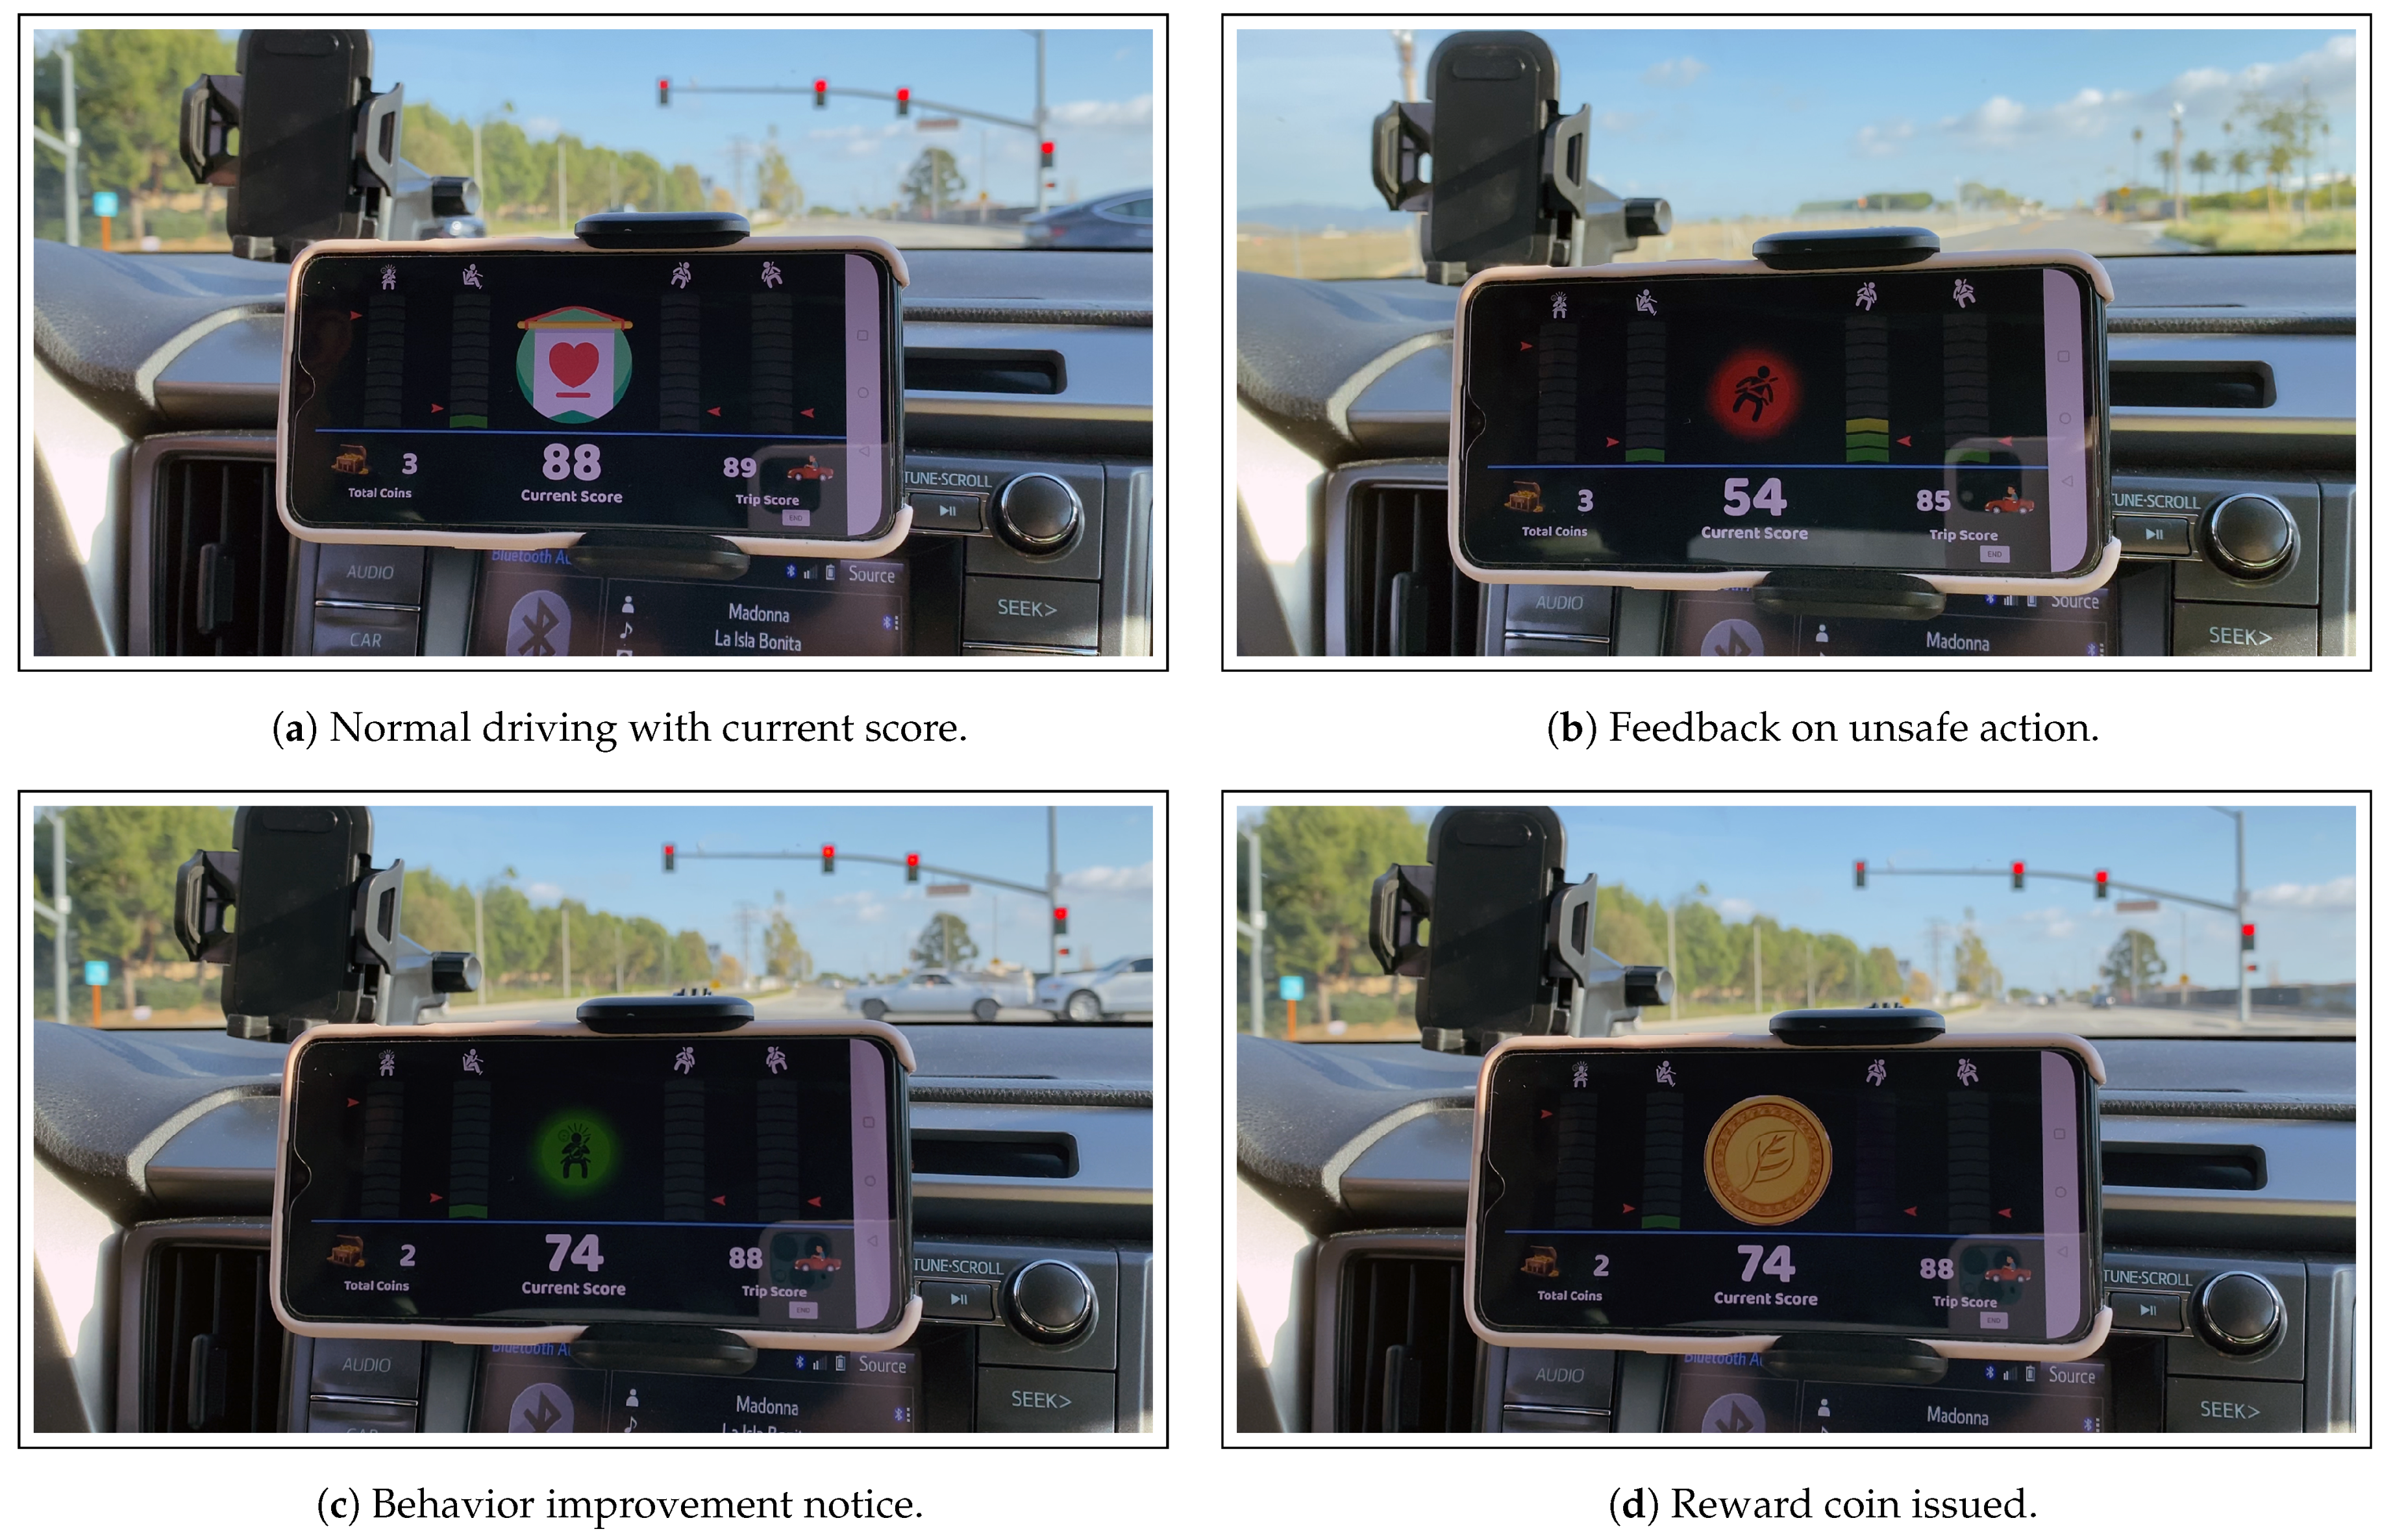
To test the success of AutoCoach, we conducted a pilot study allowing drivers to engage with AutoCoach through an informative GUI (
Figure 1). We have used a within-subject design for this study, where all participants tested a personalized personality-based version and a non-personalized version of AutoCoach. We conducted a semi-structured interview right after each participant completed the experiment. We analyzed qualitative and quantitative data to study several aspects from the participants’ points of view, including timeliness, sensitivity to risky behavior, correctness, level of intelligence, and others. Based on the personality group design, the user study results have shown that 69.8% of test users report that the group-based version exhibits higher correctness in terms of event detection, and 54.2% found that the group-based version is more timely in offering feedback. In terms of feedback sensitivity, 53.1% found that the group-based version is more sensitive to their driving events, 71.9% of participants found it is more accurate in identifying risk, and 81% found it more accurate in identifying safe driving. Participants also noticed that the group-based version is more interactive with their driving performance if they are in the higher risk groups, supporting our goal of more intense feedback for riskier drivers.
This study proves that personalization is a great tool to reach drives and influence them to improve some undesired habits. We have analyzed the results using a repeated one-way ANOVA showing the statistical significance of the results. Given the null hypothesis, participants would not have shown a change in driving habits over time using the group-based version. Our on-road study results have shown that over eight weeks, participants have shown a gradual improvement decreasing group ranks from 3.05 ± 0.973 at the first point of time to 2.13 ± 1.121 into the second point of time, to 2.14 ± 0.854 at the third point of time, where 4 is the riskiest group and 1 is the safest group rank. These study results indicate a successful behavior improvement using the group-based personalized version of AutoCoach.
Our contributions in this work are summarized as follows:
This project is one of the first works to improve IoT intelligence by classifying human users into different personality groups using machine learning models. Such intelligent personality grouping capability can be adopted in many smart IoT applications to offer more personalized service and more precise personal coaching.
We have built a working prototype that implements an intelligent real-time user feedback engine based on a user’s past driving behavior and personality group association. The platform is just a proof-of-concept, but can be extended and used to explore other machine learning models and user policies, utilizing more user data in both time and space dimensions.
We have conducted an on-the-road user study involving 50 users in different cities to show the system’s performance. Our user study has shown very positive responses from users. We have also conducted a repeated one-way ANOVA study to prove the driver’s gradual behavior improvement over time.
The rest of this article is organized as follows.
Section 2 shows some related work to our project.
Section 3 presents the details of our work on driving behavior detection, analysis, feedback, and personalization. AutoCoach’s performance through usability testing is reported in
Section 4. Discussion of some users’ comments is presented in
Section 5. Conclusions and future works are given in
Section 6.
2. Related Work
Many researchers have been actively studying possible solutions for better estimating driving risks. Some tackled the event detection problems, and others went with driving behavior analysis, while some proposed feedback models. In [
14], authors studied the detection of the events, where they compared the performance of the event detection of aggressive and safe events when using different ML algorithms on different mobile phones. They concluded that some combinations of algorithms and phone models perform better. Ref. [
15] presented a novel driving behavior recognition system that can detect brakes, accelerations, turns, and lane-change with high accuracy. Health Driving [
16] is a mobile-based application that detects driving events and conditions when accelerometer axis values pass predefined thresholds. It assigns classes of safe/unsafe to detected events. Another paper proposes a strategy based on bag-of-words to model accelerometer information associated with aggressive driving maneuvers [
17].
[
18] is another mobile application that uses its built-in sensors to detect and classify driving behaviors, such as swerving, side-sliding, weaving, and sudden braking. Other research projects focus on the studies of the classification of driving behavior patterns described by the sequence of events [
19]. Additional studies seek to classify drivers into different groups based on their driving styles using sensor readings. For example, reference [
20] has designed a system that classifies hazardous driving levels, while [
10] classifies driving behavior drivers to be either safe and unsafe. DrivingSense [
21] identifies dangerous behaviors, including speeding and failing to control the car properly. SenseFleet [
22] is another mobile-based application that identifies risky maneuvers, accelerating, and braking and provides a score reflecting the driver’s overall score. All of the above provide a good foundation for our personality-based user model.
The identified behavior can be used to provide feedback and recommendations to drivers. Some studies proposed ideas for scoring and providing feedback to drivers. The authors of [
23] provide an application to monitor, analyze, and offer recommendations to drivers based on detected unsafe behaviors. Join Driving [
24] is another smartphone-based driving behavior evaluation system. Join has two components: driving event detection and the evaluation part. It passes the detected events information to a scoring mechanism to quantitatively evaluate the events and comfort levels in real-time. Our system architecture has a similar structure, but supports more sophisticated user models.
Behavior adaptation (BA) occurs in many different ways as people become more mindful of the risks associated with their driving [
25]. While BA is possible, user experience (UX) design is the leading way to BA. How people feel while using a product and how well it serves their purpose defines UX [
26]. Factors like trust are one of the main components of reliable UX design. Trust leads to customer satisfaction, loyalty, and patience [
27] conceiving a successful product. Our project aims to build a smart driver behavior management agent to enable BA in drivers.
3. Project Structure and Methods
This study presents AutoCoach, an Android-based mobile application that presents personalization into machine intelligence for coaching drivers. It uses phone-embedded motion sensors, including accelerometers, gyroscopes, and magnetometers, to sense motion, and identifies the events while driving. This information is then further analyzed and integrated with personality-based policies to offer more helpful feedback to drivers.
3.1. System Architecture
Figure 2 shows the functional diagram of AutoCoach. A smartphone streams the sensor data to the Driving Event Detection Unit (EDU). The EDU identifies the event type and its risk level, including brakes, accelerations, turns, and lane-changes. Each event is profiled into one of three risk levels: safe, medium-risk, and high-risk. The events are detected in real-time and analyzed based on personal habits to see if the driver is falling behind his normal behavior. The Events Scoring Engine generates personalized scores for individual events. The functional diagram also shows the personality decision unit, which uses the machine learning algorithms to process historical data collected from all drivers to identify a specific driver’s personality model. This model will then be used at runtime, when the actual driving events and patterns have been identified for the driver, to make decisions on feedback and rewards. This study presents AutoCoach, an Android-based mobile application that presents personalization into machine intelligence for coaching drivers. It uses phone-embedded motion sensors, including accelerometers, gyroscopes, and magnetometers, to sense motion and identifies the events while driving. This information is then further analyzed and integrated with personalized policies to offer more helpful feedback to drivers.
3.2. Events Detection Unit
As described previously, the EDU is responsible for classifying the events into twelve categories (e.g., safe brake or medium-risk acceleration). In our previous work [
13], we created a simple machine-learning-based detection model for some cars. To expand our work for this study and allow many drivers to use our application, we create a generalized model that could work on different SUVs and Sedans.
To train the model, we explored a series of ML algorithms. We found that SVM and KNN, which are applied to many areas, such as pattern recognition and regression, are the most suitable ML algorithms to classify signals. Since SVM and KNN are supervised algorithms, the input data requires labeling. We collected raw sensor data from ten cars of different models and sizes and under different road conditions. Our team has manually labeled 1350 driving events into the twelve classifications. The data was collected and labeled at several stages throughout the phases of our work.
Then, we further investigated the addition and removal of several features displayed in
Table 1. We tested non-weighted features 1–13 and 18–23, which resulted in 83.6% for SVM and 72.62% for KNN. We identified that many of the false classifications were falling in the minority classes. Therefore, we examined using weighted SVM [
28] to solve the problem of unbalanced data. The accuracy of SVM successfully improved to 85.2%. We further investigated new features that could help get even better results. We found that the addition of Feature 14 significantly increased the classification accuracy to 93.4% (SVM) and 81.4% (KNN). This feature uses the sensor data to detect when an event occurs when the signal exceeds a certain threshold. When the accelerometer x-axis signal is responsible for triggering the detection, the event is likely to be a turn or a lane-change; otherwise, it is an acceleration or a brake.
Table 2 shows a summary of our event detection experimental results. We concluded that SVM performed best in identifying twelve driving events with the features 1–17, and we got similar results when using the 19 features 1–14 and 16–23 with an accuracy of 93.4%. We used the model with 17 features because it is of lower dimensionality.
3.3. Pattern Analysis Unit
The pattern analysis unit is responsible for assessing the behavior risk. Each pattern is represented by letters, where a letter represents a combination of event type and risk level (
Table 3). Our model uses 12 letters and a pattern length ranging from 1 to approximately 10 letters, creating a massive number of possibilities. An example of a trip pattern would look like: [a, bah, hhbp, aoaaib, a, bh, aihb, bxaah⋯], where a pattern is a window of 40 s, and the many patterns represent a trip.
Using this data, we would like to create a cluster model based on the similarities in risk between the patterns to group them together. The model should create a well skewed scored data set with high variance to represent as many possible combinations of events scores. We assume that the more high-risk events present in a pattern, the higher the risk is.
In order to find relationships between patterns, we considered several semi-supervised and unsupervised algorithms. Because unsupervised learning draws the inference from a dataset without labels, it could work for our dataset of unknown similarities between patterns. On the other hand, semi-supervised learning allows the introduction of a hint of knowledge about the dataset, which can be even more meaningful. We believe that, for example, the pattern “a” cannot be together with “b”, and either cannot be with “c” as each belongs to a different risk group. However, when it comes to combinations of patterns, decisions become more challenging, and this is when machine-learning can figure out such complicated decisions.
We explored K-means and mean-shift from the list of the unsupervised clustering algorithms. We first converted the collected patterns to a fixed-length vector as the input data should be of equal length. The vectors include 12 features concerning the number of safe, medium-risk, and high-risk event types. We trained models using K-means and mean-shift. In K-means, we strictly assign numbers of clusters, while mean-shift decides the number of clusters the output will have. When we looked through the results obtained, we found it could not show meaningful relevance for within-clusters data points. We found patterns such as “a” closest to “x”, for example, which does not imply our purpose. As when converting the pattern into a vector, the sense of sequence and risk levels were gone.
Using a semi-supervised algorithm for such data format is more meaningful as we can, as humans, provide insightful information about the degrees of risk patterns represent. We used the same features presented in K-Means to upgrade it to the COP K-means algorithm. COP K-means allows semi-supervision by adding must-link and cannot-link pairs of data, which helps direct the algorithm to represent the clusters based on initial decisions. Results from COP K-means were not successful either.
Therefore, we thought of moving back to our initial probabilistic LDA model and extended it to configure a Guided-LDA model to create a semi-supervised version of the LDA. To summarize LDA: it is a probabilistic model that views driving behavior patterns as words assigned to topics. The topics are viewed as groups of patterns with similar risk levels. Each pattern is given a combination of probabilistic values belonging to four defined risk groups.
On the contrary, in Guided-LDA, we set seeds for each cluster and allow the model to revolve around them. A seed is a pattern we believe should belong to a specific topic. The probabilities derived from the LDA model are used to generate scores for the detected patterns to determine the risk level the driver is showing at that moment. We scored the clustered patterns using the scoring engine presented in [
13] where higher risk probabilities are multiplied by lower weights, while lower-risk probabilities are multiplied by higher weights. A statistical comparison was conducted on randomly selected sample data and is shown in
Table 4. Results show that LDA and Guided-LDA are closer means to the data medians than COP K-means. LDA showed the highest standard deviation and variance (Std = 22.79 and variance = 519.62) and most asymmetric data based on skewness measures (skewness = −0.0056). Furthermore, the minimum and maximum values are widely separated in LDA (minimum = 28.39 and maximum = 97.04). We concluded that LDA results are most significant for the patterns analysis model and for scoring the behavior patterns.
The following sections discuss our latest work in this project.
3.4. Personality Analysis
As humans, groups of people share similar habits and behaviors. In the same way, some drivers have similar driving habits. Unsupervised ML algorithms can help us identify the similarities of risks shown by drivers to classify them into multiple ranked risk groups. Such ranking allows us to set practical feedback methods based on how risky a driver is. We have recruited 50 android users (29 males and 21 females, mean = 33.8, Std = 5.3) in several cities to collect data at two stages. In the first stage, we recruited ten users to collect events data to train the SVM model. They were assigned a task to run a simple version of AutoCoach to collect 200 events each. The GUI displays a counter, and every time an event is detected, the counter is incremented. It took about 1.5–2 h to collect 200 events when driving on local roads. In the second stage, we needed more real users to build the personality model using the K-means clustering algorithm. We recruited 40 more drivers from different cities to drive under different road conditions and different rules. We have introduced the drivers to the project, and this time drivers got to experience the actual GUI. We explained the setup directions (e.g., how to run the application and what to expect) and requirements (e.g., phone holder, android version). We tasked the participants to run the application whenever they could drive to collect at least 2 h of driving data. While we closely monitored the collected data to make sure it was correct and valid. The collected dataset includes over 350 trips, 12K events, and 7K patterns collected by 50 users over two months. We used the K-Means clustering algorithm to train the personality model. For accuracy reasons, we selected 36 drivers who had more than 2 hours of driving data to train the model.
3.4.1. Personality Features
Many features could be included to be part of a personal risk-assessment model. In this study, we consider features associated with habits and emotions to be part of the personality model. In this context, habits are defined by all those features associated with driving events and behaviors. Emotions, on the other hand, are those feelings contributing to the aggression or recklessness of drivers. In [
30], authors propose that driving style personalities can be divided into four main types: reckless and careless, anxious, angry and hostile, patient and careful. We believe that drivers have a combination of those personalities. We follow habits and personality characteristics to define features for classifying drivers into different personality groups. We assume that the groups we would like to study are distinguished by how much risk they present. The collected data included information regarding the following:
Events types;
Events risk levels;
Events time duration;
Events Scores;
Behavior patterns;
Behavior patterns scores;
Angry, reckless, and anxious behaviors.
Table 5 describes the features we have selected to train our model using the previously mentioned data. Eight of those features (1–8) were used in our earlier study of AutoCoach. We collected and analyzed more data for this current study, which helped us better estimate drivers’ personalities and created more features (9–21).
Features 6, 7, and 8 summarize the emotion-related features. In density of angry behavior (feature 6), we detect a cluster of sequential risky events in a fixed time window. The amount of time a driver exhibits a particular behavior repeatedly determines the
of angry behavior. We recognize that reckless drivers have a lower density of risky events, where less risky events are found in a pattern (feature 7), while for density of anxious behavior (feature 8), we comprehend that anxious drivers are those drivers who present hesitation and have low scores due to the high number of occurring normal events within a window. Other features presented in
Table 5 represent the habits of drivers.
Because we are considering the risks, we collected information about driving habits, which are defined by how aggressive brakes, accelerations, turns, and lane changes are. Drivers respond to some situations with emotions, and those emotional aspects of driving pose a risk. We use anger, recklessness, and anxiousness as measures in defining the personality groups. Other characteristics for the groups are how their overall driving is seen from the scoring engine’s perspective. This feature represents the level of safety of the drivers.
3.4.2. Personality Model
In the personality model, we would like to create multiple clusters to define our customer groups. An unsupervised learning algorithm would work best because of the data’s nature and the uncertainty about the probable classifications. Because drivers hold a combination of many characteristics represented by anger, anxiousness, recklessness, and other driving habits, a cluster cannot be given a particular name. The K-means algorithm allows us to discover rules that describe large portions of driver’s behaviors and habits. Consequently, it can create personality groups based on the features we assume that represent specific behaviors.
AutoCoach has a daemon on its servers, and it is responsible for automatically retraining the K-means model every time 200 events are uploaded to the cloud-based database. When retraining is triggered, AutoCoach considers adding only those users with sufficient data in the trained model. Users with no data for specific events will be excluded, for accuracy purposes, from the model and will remain in their initial group assignment.
With a large number of features, we face the problem of high dimensionality. The higher the dimensionality, K-means becomes less effective at distinguishing between examples [
31]. To eliminate the problem, we apply the rule stating that the correlation of magnitude between 0.7 and 0.9 is considered high [
32]. Therefore, we decide that highly correlated features with coefficients greater than 0.7 will be excluded. This exclusion will also eliminate the possibility that those features with similarities give more weight than other features.
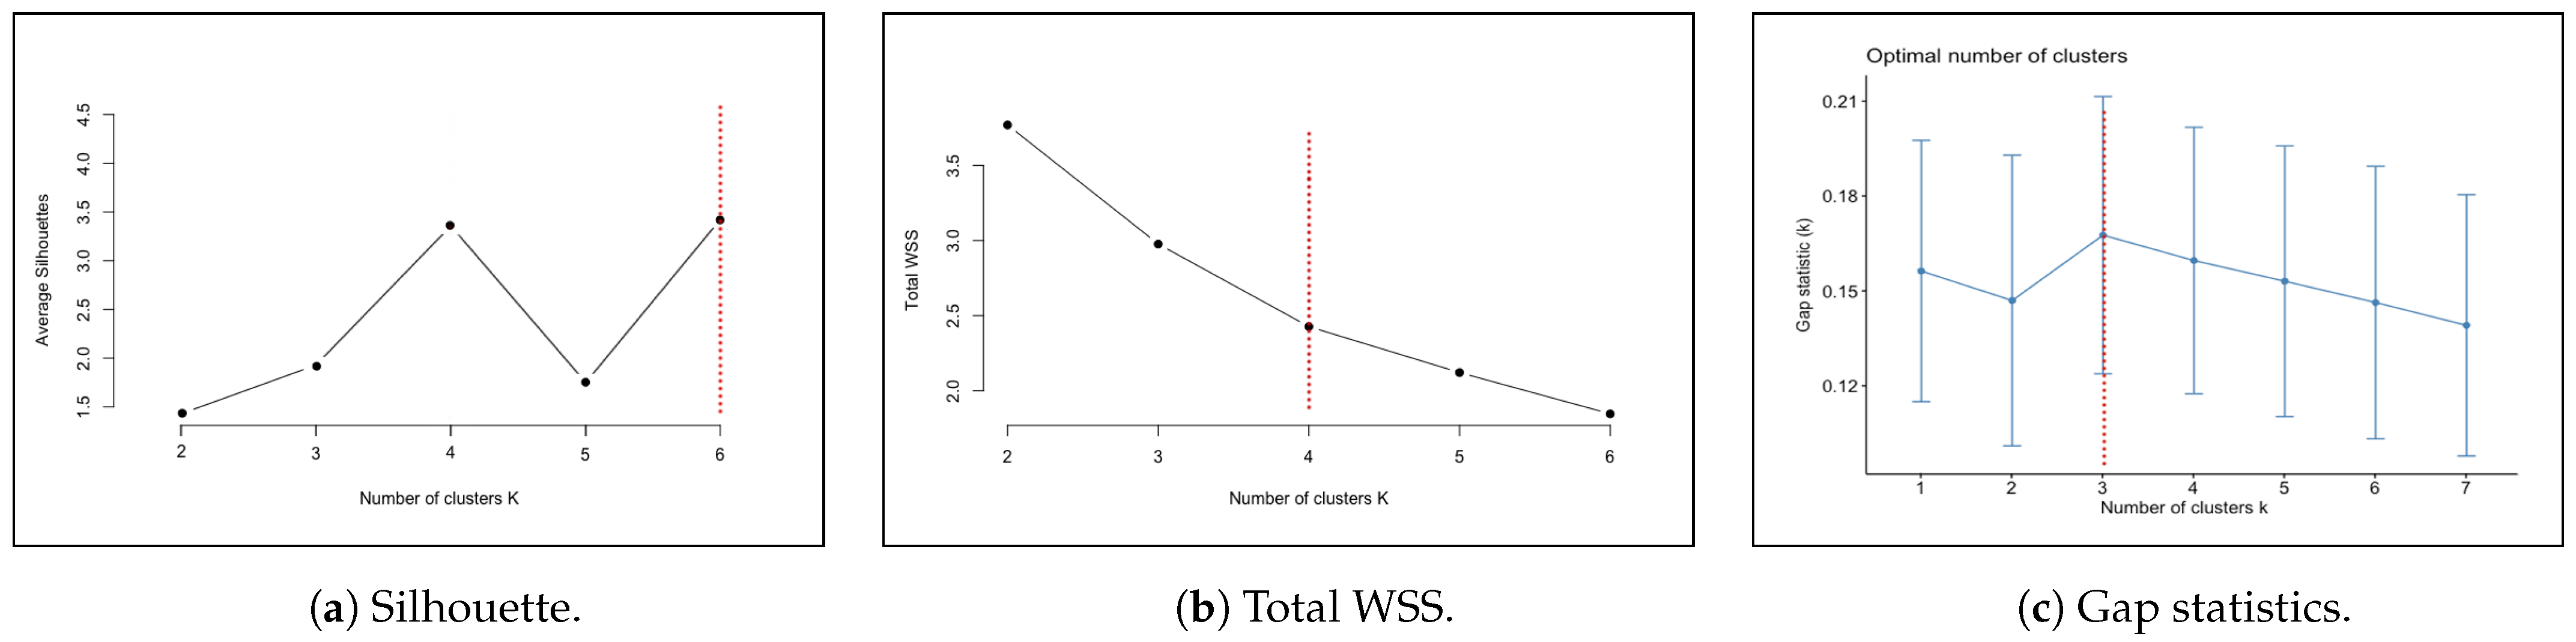
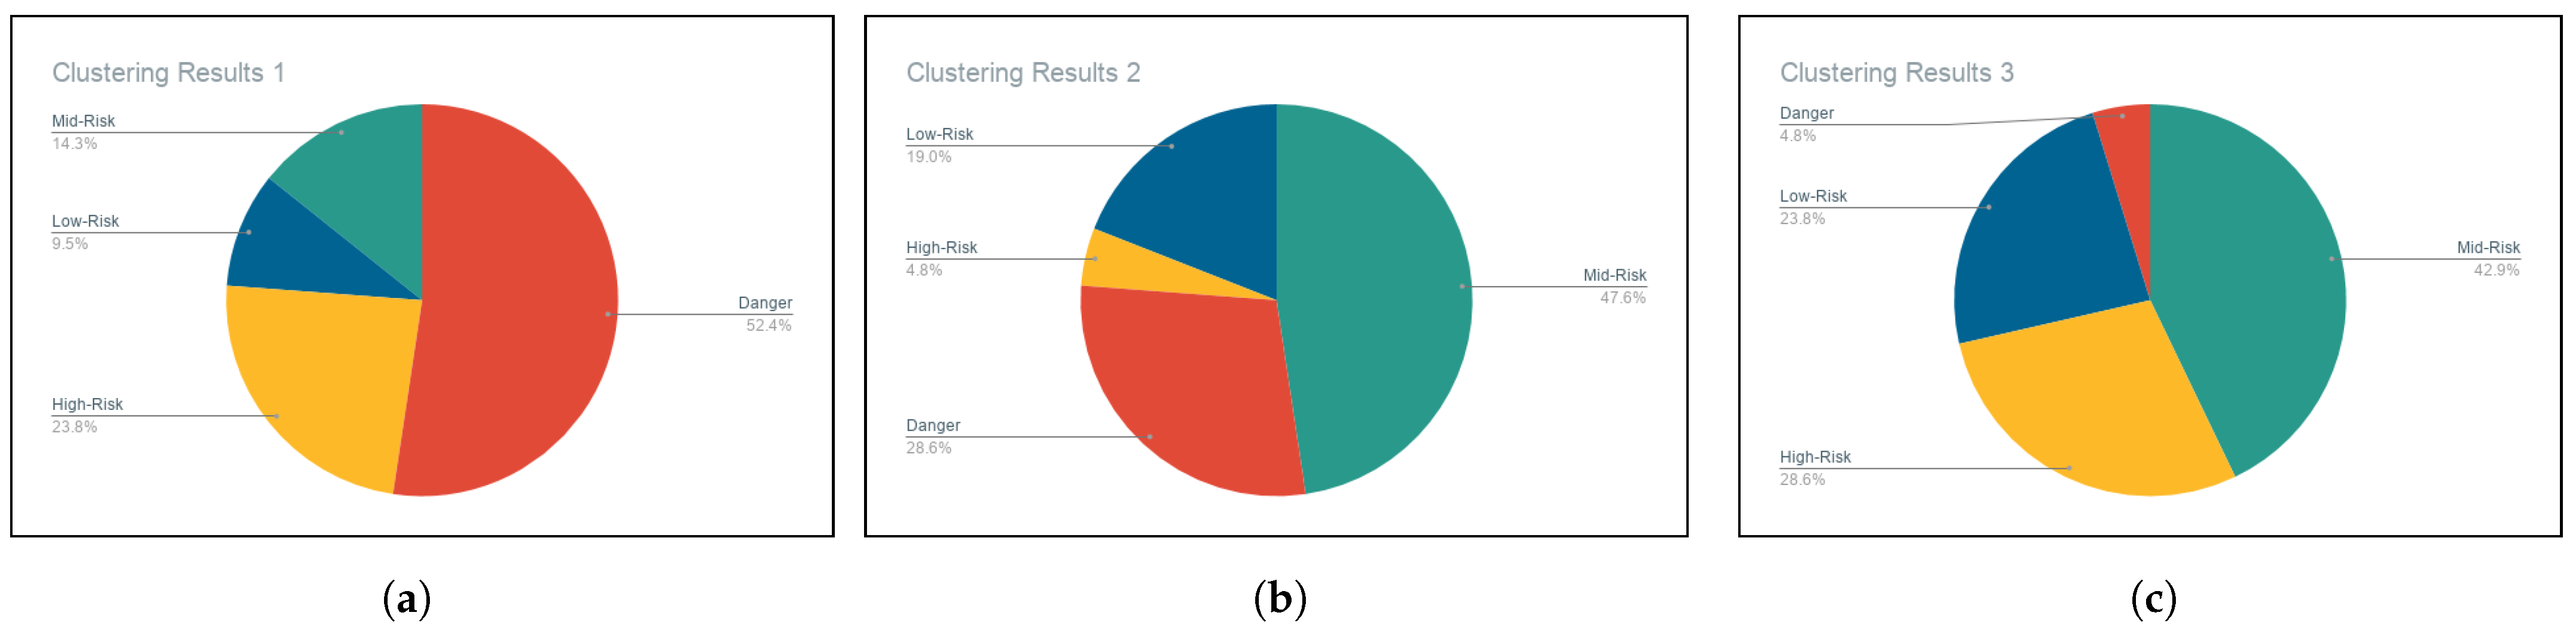
In our current study, we use statistical measures to examine and find the optimal number of clusters for our current data set. As shown in
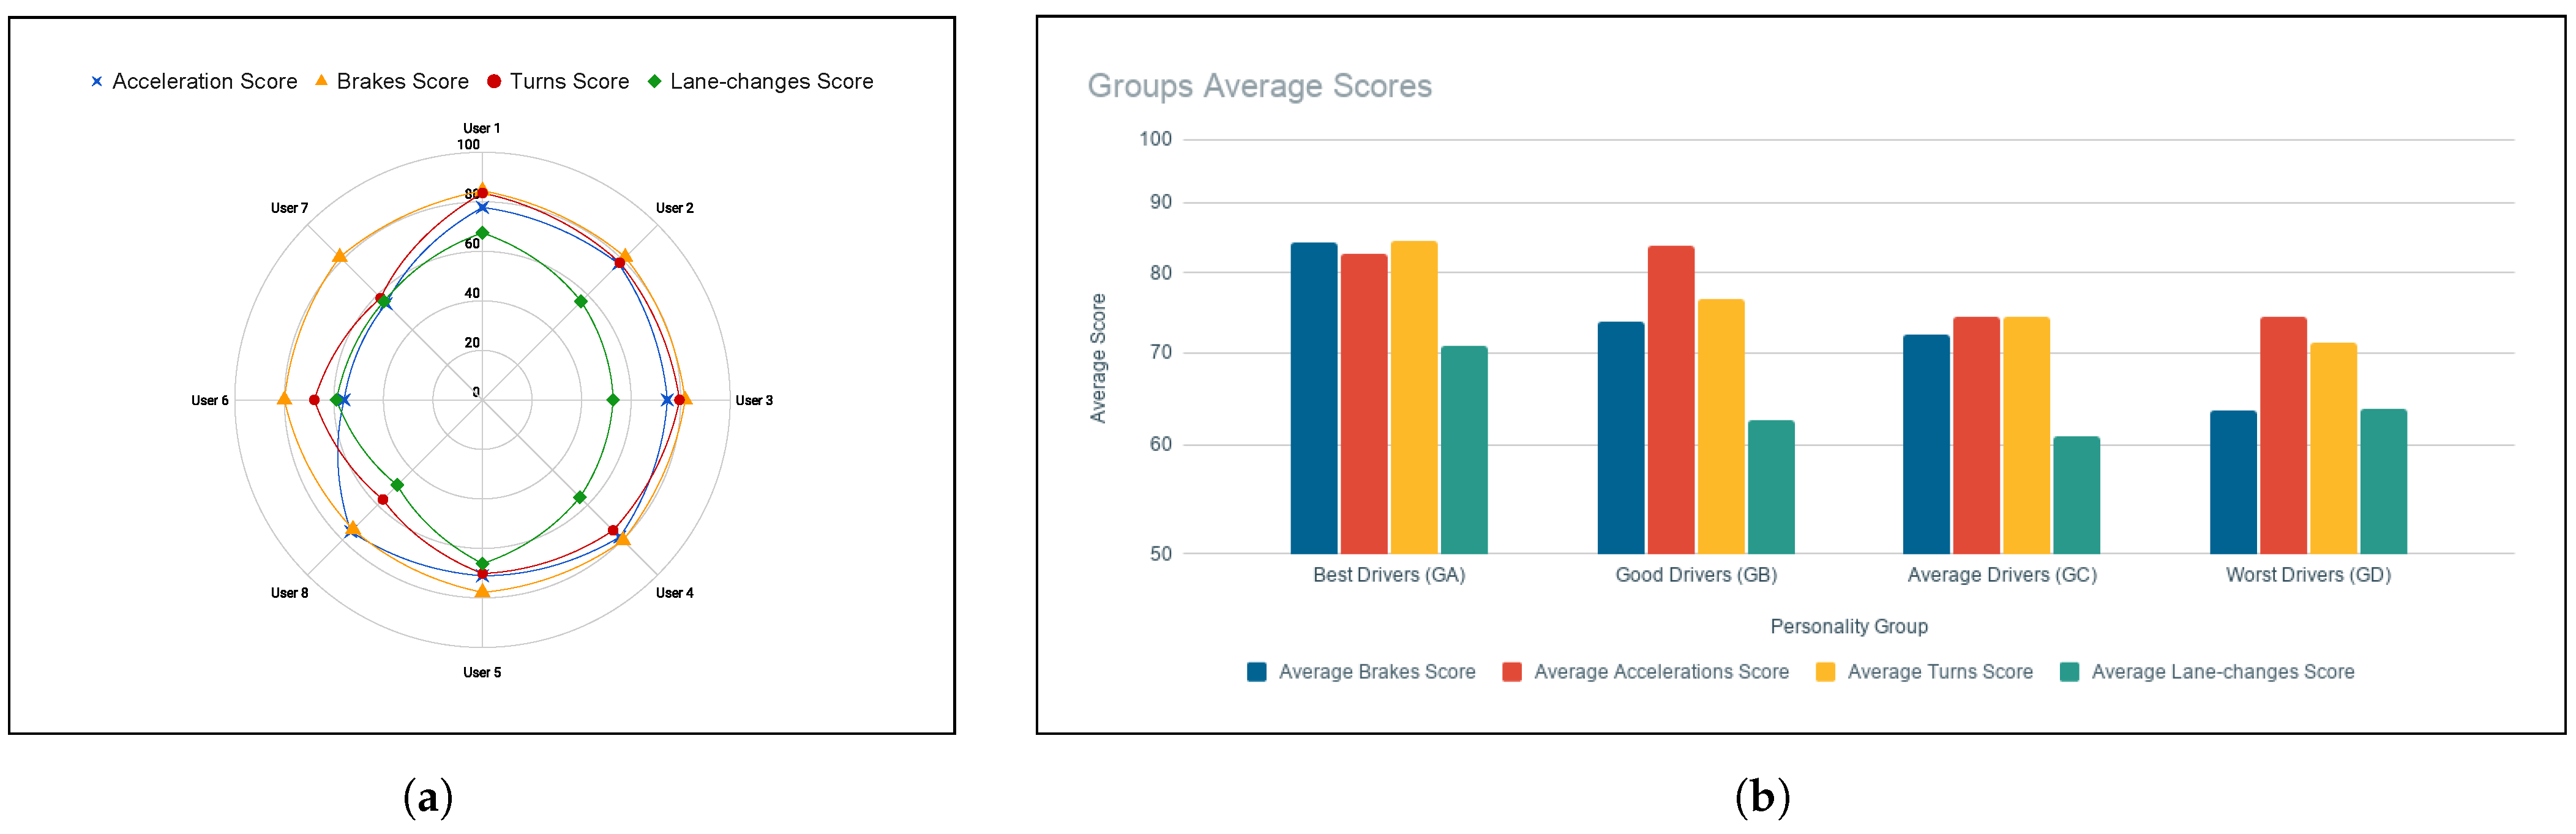
Figure 3, we have tested the average silhouette, the Total Within-Cluster Sum of Square (WSS), and the gap statistics. Each method suggested a different optimal number of clusters (6, 4, and 3). We use the average of the three methods to find that four clusters are about a good number of clusters for the current model. We label the four clusters in order of safety as follows:
Best Drivers: Group A ();
Good Drivers: Group B ();
Average Drivers: Group C ();
Worst Drivers: Group D ().
When a new model is trained, the daemon automatically labels the clusters from the safest to the riskiest using the silhouette factor. Silhouette refers to a method of interpretation and validation of data consistency within clusters. We calculate a silhouette score for each feature as if the dataset has only one single feature. We do this for all features selected for training. Then, AutoCoach compares the silhouette scores. The feature with the most significant silhouette score will be chosen to rank and name the clusters. It means that the same cluster samples are similar to each other, and thus, this is a well-separated feature that could create solid boundaries between the clusters. When a driver is assigned to a group, the system will automatically know which associated policies and rules apply to this driver. Every time the model is retrained, the driver will move or stay within the same cluster. Moving from a safe group to a riskier group will result in stricter rules, while the opposite results in more relaxed rules.
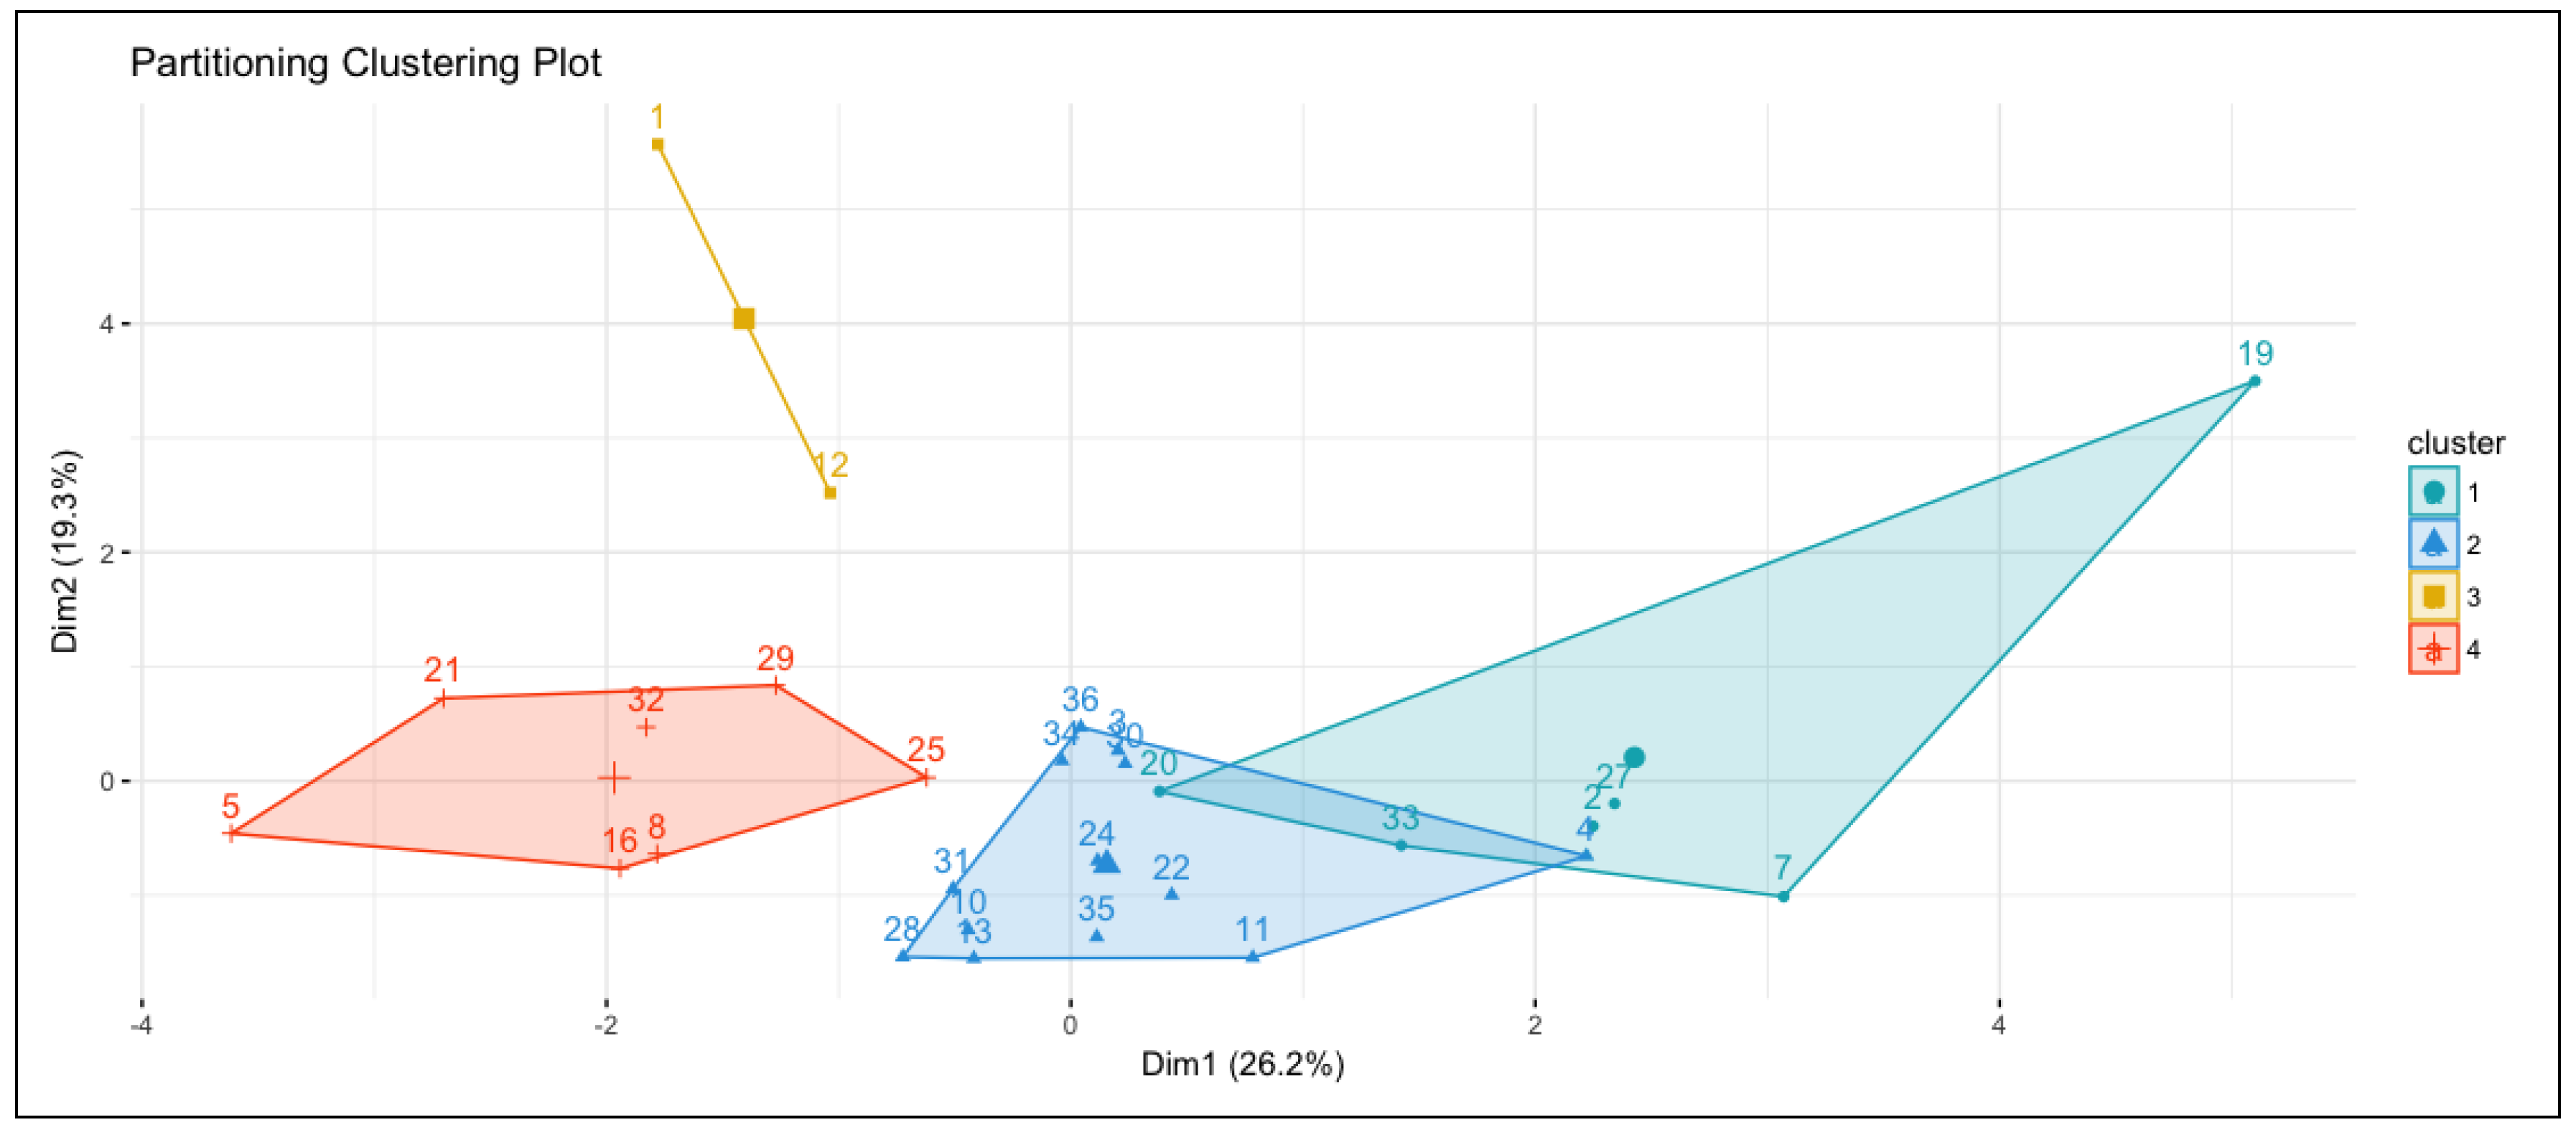
Figure 4 shows 36 drivers with sufficient data clustered into four personality groups. The numbers on the figure match the following group labels: Best (1), Good (2), Average (4), and Worst (3) drivers. The groups were labeled in this model based on the highest risk turns feature, which in this trained set had the most significant silhouette score. Based on the high-risk turns’ cluster values, they will be ranked in order from safest to riskiest. Those clusters with higher high-turns will be put in the more dangerous group, and as it goes down, they will be labeled as safer. This model was used in our usability study to offer personalized feedback to drivers, which will be explained in further detail in
Section 4.
3.5. Feedback Engine
Due to the differences among all individual’s unique driving habits, one feedback model does not fit all.AutoCoach offers a personalized personality-based model to address this problem. Personality-based models group people with similarities and then decide when and how feedback should be given to drivers in different groups. In the current design of AutoCoach, two levels of personalization are used. The first level looks at personal habits, and the second level considers each personality group’s common issues. Those two aspects together are used to determine drivers’ feedback needs.
Specifically, the first level of personalization looks at a driver’s history to identify how the driver usually brakes, accelerates, turns, or changes lanes. The historical data of events are analyzed and given scores ranging from 0 to 100. Historical event scores are averaged to develop a final score representing the drivers’ typical behavior for each event. Accordingly, each driver has four personal scores (P-scores):
Brakes P-score;
Acceleration P-score;
Turns P-score;
Lane-changes P-score.
At the second level, we rely on the Personality Model described in
Section 3.4 to associate a driver to some group of people exhibiting similar risks and use a common strategy to help them. Using this model, group assignments, policies, and memory factors [
13] applied to different personality groups, group policies decide the overall feedback strategy, while the individual P-scores decide the personal adjustment. The group assignments could show us what issues are seen within the specific groups and can be used to adjust the policies and what to focus on. The P-scores scores are used through the feedback policies to adjust feedback triggering thresholds for each event type.
3.6. Feedback Strategies and Policies
In AutoCoach, we design some simple strategies prompting drivers to improve their driving habits gradually. As discussed in [
25], drivers can show behavior adaptation after being exposed to feedback, recommendations, and support. Many possible mathematical and practical models can be used to create successful policies to influence behavior adaptation.
As aforesaid, we have clustered drivers into four personality groups: Best (), Good (), Average (), and Worst drivers (). Each driver belongs to a group, but is expected to improve and move closer to the next higher group gradually. The overall group-based policies are defined as below:
Best drivers are given more relaxed checking, as long as they will self-correct their driving behavior.
Average drivers are encouraged to improve by setting a higher standard above their current and group average.
Bad drivers are monitored closely and given warnings to discourage them from falling even further.
We then use within-group differences to define policies supporting the following strategy. The idea is to trigger feedback at a slightly higher level than their standard behavior scores. When the driver shows progress over time, he will be given a slightly higher goal again. The strategy pushes drivers for gradual improvement by helping them either stay within their group range or move up to a better group.
The feedback strategies are shown in
Figure 5 defined by six policies. The best drivers in the group
use two policies (Policies 1 and 2) since those drivers are in the best possible group and do not need further improvement. The other drivers in the rest of the groups use four policies (Policies 3, 4, 5, and 6).
3.6.1. Best Driver Policies
Because drivers in this group have moderately high scores, the boundary score could be more flexible as long as the driver scores do not get too low to reach group . We define two policies for defining the feedback triggering threshold (), i.e., expected driving score, for this group.
Policy 1: If the driver’s P-score (P) is below the group average , then , which is the boundary between and . This allows the driver to be close to ’s low boundary.
Policy 2: For those drivers in with scores higher than group ’s average, or P. In other words, as long as the driver is above the group average, there is no feedback required.
3.6.2. Drivers Improvement Strategy
For drivers in other groups, we want drivers to keep making improvements. We use each group’s average and the driver’s P-score to determine if a driver can be improved to a better group or prevented from dropping to a worse group.
Policy 3: In this policy, we push drivers to get closer to their group average by setting the threshold to the current group average to try to improve their P-score closer to .
Policy 4: If the system finds that a driver is falling behind from their current group, the threshold will be set slightly higher than their current P-score.
Policy 5: If a driver is performing better than the group average, we set a slightly higher threshold than the group average.
Policy 6: If a driver is performing closer to a better group, we will set the threshold to be equal to the group boundary.
The above policies push drivers for gradual improvement by helping them either stay within their group range or move up. When drivers are ready, they get a slight adjustment in the feedback threshold to create a more sensitive feedback engine.
3.6.3. Rewards Engine
AutoCoach could be used as an application in the Auto Insurance business, where collected coins can be applied towards rewards, coupons, and discounts in real life. On the human side, we follow gamification concepts in non-game contexts to reward drivers as a positive reinforcement measure. Rewards are represented by golden coins popping on the screen with sound effects as a definition of achievement. Much like many current smart fitness tracker products (e.g., Fitbit), such positive feedback does help individuals make even more efforts to improve their behaviors.
We have designed the Rewards Engine to reward drivers in two conditions:
In our model, the “Rewards for Good Behavior” is the primary scoring mechanism for safe drivers. Safe drivers can earn many coins as long as they are driving safely (e.g., every 40 s). On the other hand, risky drivers can also earn coins only when it is clear that they have improved. Risky drivers may not receive as many coins, yet they can receive “Rewards for Improvement” coins as means of encouragement.
For the first mechanism: Rewards for Good Behavior, the behavior score is calculated every 40 s by the Pattern Scoring Engine as described in
Figure 6. The current pattern score is adjusting using the memory factor (six-window moving average) to consider the history from the previous five windows [
13]. Whenever this score is greater or equal to the personal threshold, the driver is given a reward coin. Safe drivers can easily earn good behavior coins.
For the second condition: rewards for behavior improvement, the reward engine is triggered when an event is detected, scored by the Events Scoring Engine, and adjusted by the memory factor. The event score is compared with the event’s p-score to decide whether the feedback is needed or not. If feedback is required, then AutoCoach issues the feedback, stores the feedback status, and waits until the score is improved. The improvement is time-based. As long as the driver does not make another risky event of the same type, they will notice the event bar will decline every 10 s until it reaches below the personal threshold arrow. This is when rewards should be deserved.
Algorithm 1 shows the pseudocode for how the feedback and rewards engines are working together in AutoCoach.
| Algorithm 1: Feedback/rewards engine algorithm. |
![Electronics 10 01361 i001]() |
3.7. Graphical User Interface
AutoCoach is designed with a friendly GUI with minimal text but more color variations to reduce distraction and allow easy tracking of driving performance. AutoCoach GUI has several components on the screen as shown in
Figure 7a:
Event meters: Scores the individual events (accelerations, brakes turns, and lane-changes ) within the last 10 s moving average window.
Personal event thresholds: Shown as red arrows next to the bar. Those are personalized thresholds calculated based on the drivers’ habits and personality group scores.
Recommendation icon: This is where recommendations, improvements, and rewards icons are clearly presented in the center of the GUI.
Total earned coins: The total earned coins for this specific trip.
Behavior score: The score for the driver’s behavior in the last 40 s window.
Trip score: The average score of all behavior scores from the beginning of this specific trip.
Each event bar component is used to display the score of the detected events in real-time. The events scores are in the format shown in
Figure 7b. In our context, these scores are calculated based on the risk level of the detected event. The higher the risk, the lower the score. Then, the score is compared to the driver’s event P-score, and when the score < P-score, feedback is triggered. We use a weighted moving-average window to calculate a new score every 10 s. The decision was to use a 10 s window because we found from the collected data that the average event duration is 6 seconds, and to make sure at least one event is recorded every window, we set the window size to 10. Whenever no event occurs in a window, then the window score = 100.
Given that the maximum score , the maximum events detection window size s and the system can detect three-risk-levels (safe, medium-risk, high-risk) for each event type. We have segmented scoring rules into three divisions. For safer events, score ⩾ 74, for medium-risk events, 74 > score ⩾ 49, and for high-risk events, score . We selected these parameters according to the users’ scores of single-event patterns obtained by the patterns scoring engine. We learned that medium-risk single-event patterns are scored on average 74, while high-risk single-event patterns are scored 49.
If the Event Detection Unit detects a safe event with time duration
t, then, The Events Scoring Engine scores it as follows:
If the detected event was classified as a medium-risk event, then:
Otherwise, if it is a high-risk event, then:
These equations allow scores to vary between 0 and 100, giving safer events higher scores while riskier events lower scores. Each bar on the GUI is personalized based on the policies and memory factors assigned to the drivers based on their personality group.
There are many possible ways to design the scoring model to trigger feedback. The focus can be to target improving personal habits, group habits, current trip performance, or driving history-related performance. We could build a weakness-based scoring engine, where it checks the worst among brakes, accelerations, turns, or change lanes, and then use this information to focus on that one specific event for personal improvement. We also could build a history-based model that monitors the p-score trends (e.g., from the past ten trips). Then, classify a driver to whether he is improving or worsening and set policies accordingly; i.e., if a driver is already improving, we would not set thresholds to push them so much anymore. We also consider scoring under different road and weather conditions; i.e., if it is rainy, we care more when the driver drives more aggressively.
When AutoCoach is installed, users are asked to create a username and password if they were first-time users; otherwise, they can log in with their previously created credentials. Once the driver starts a trip, AutoCoach will continuously collect and analyze sensor data to generate intelligent, personalized decisions about real-time driving behavior.
4. Pilot Study and Results
In this section, we present a pilot study to evaluate the feasibility and acceptability of AutoCoach. Evaluations used the within-subject mixed design method. In this study, we want to understand the drivers’ level of acceptance of personalized personality-based driving behavior management systems compared to non-personalized systems. Considering drivers’ differences and needs, AutoCoach identifies those differences and offers personalized feedback that matches their needs. For the user study, we have two purposes. First, we would like to understand how feedback frequency plays a role in sending more effective feedback to drivers. Second, we would like to identify the strengths and weaknesses of AutoCoach for further improvements.
4.1. Participants Selection
For selecting participants, we use convenience sampling due to time constraints. We have randomly selected three users from each personality group to participate in this study from the original set of participants. Those users have already used the system previously to collect SVM and Personality Analysis data, but have not seen the GUI before. This collected data establishes our initial personality model shown in
Section 3.4.2. All drivers participating in this study have accumulated at least two hours of driving data. This allows us to make sure all drivers are ready for the Personalized Feedback User Study.
Two users did not complete the study, and another two failed to place the phone in the car adequately, thus collected false data. We had them removed from our participants’ list. Eight participants are left in the usability study (five males and three females, mean = 36, Std = 3.12).
Figure 8a displays the differences between the participants, where drivers are arranged from safest to riskiest personality groups, and where User 1 is the safest driver and User 7 is the most dangerous.
4.2. Experimental Setup
For this user study, we have set up AutoCoach to have two different versions to test the acceptance and feasibility of the personalized AutoCoach compared to a version running no personalization. On the user GUI screen, we show two buttons: Version NP and Version P. To validate that the drivers have selected the correct model when experimenting, we save the version information with the driver’s data on the servers at the end of the trip. In this test, we asked each driver to experiment with both versions. The first version (NP) has the personalization feature turned off. All drivers have equal thresholds for all feedback components (
). The second version (P) uses the personalized model. Each driver will be treated based on their personal scores (P-score) and assigned group scores. In this experiment, participants were introduced to AutoCoach’s days before the test to give them time to explore it. We provided the drivers with detailed information about what AutoCoach does and what each component represents. We also provided them with the test task details. Then, we scheduled a time for the experiment for each driver individually. Before starting the test, we verbally explained to drivers the test tasks shown in
Table 6. Throughout the article, we will be referring to the non-personalized version as Version NP and the personalized version as Version P.
4.3. Quantitative Results
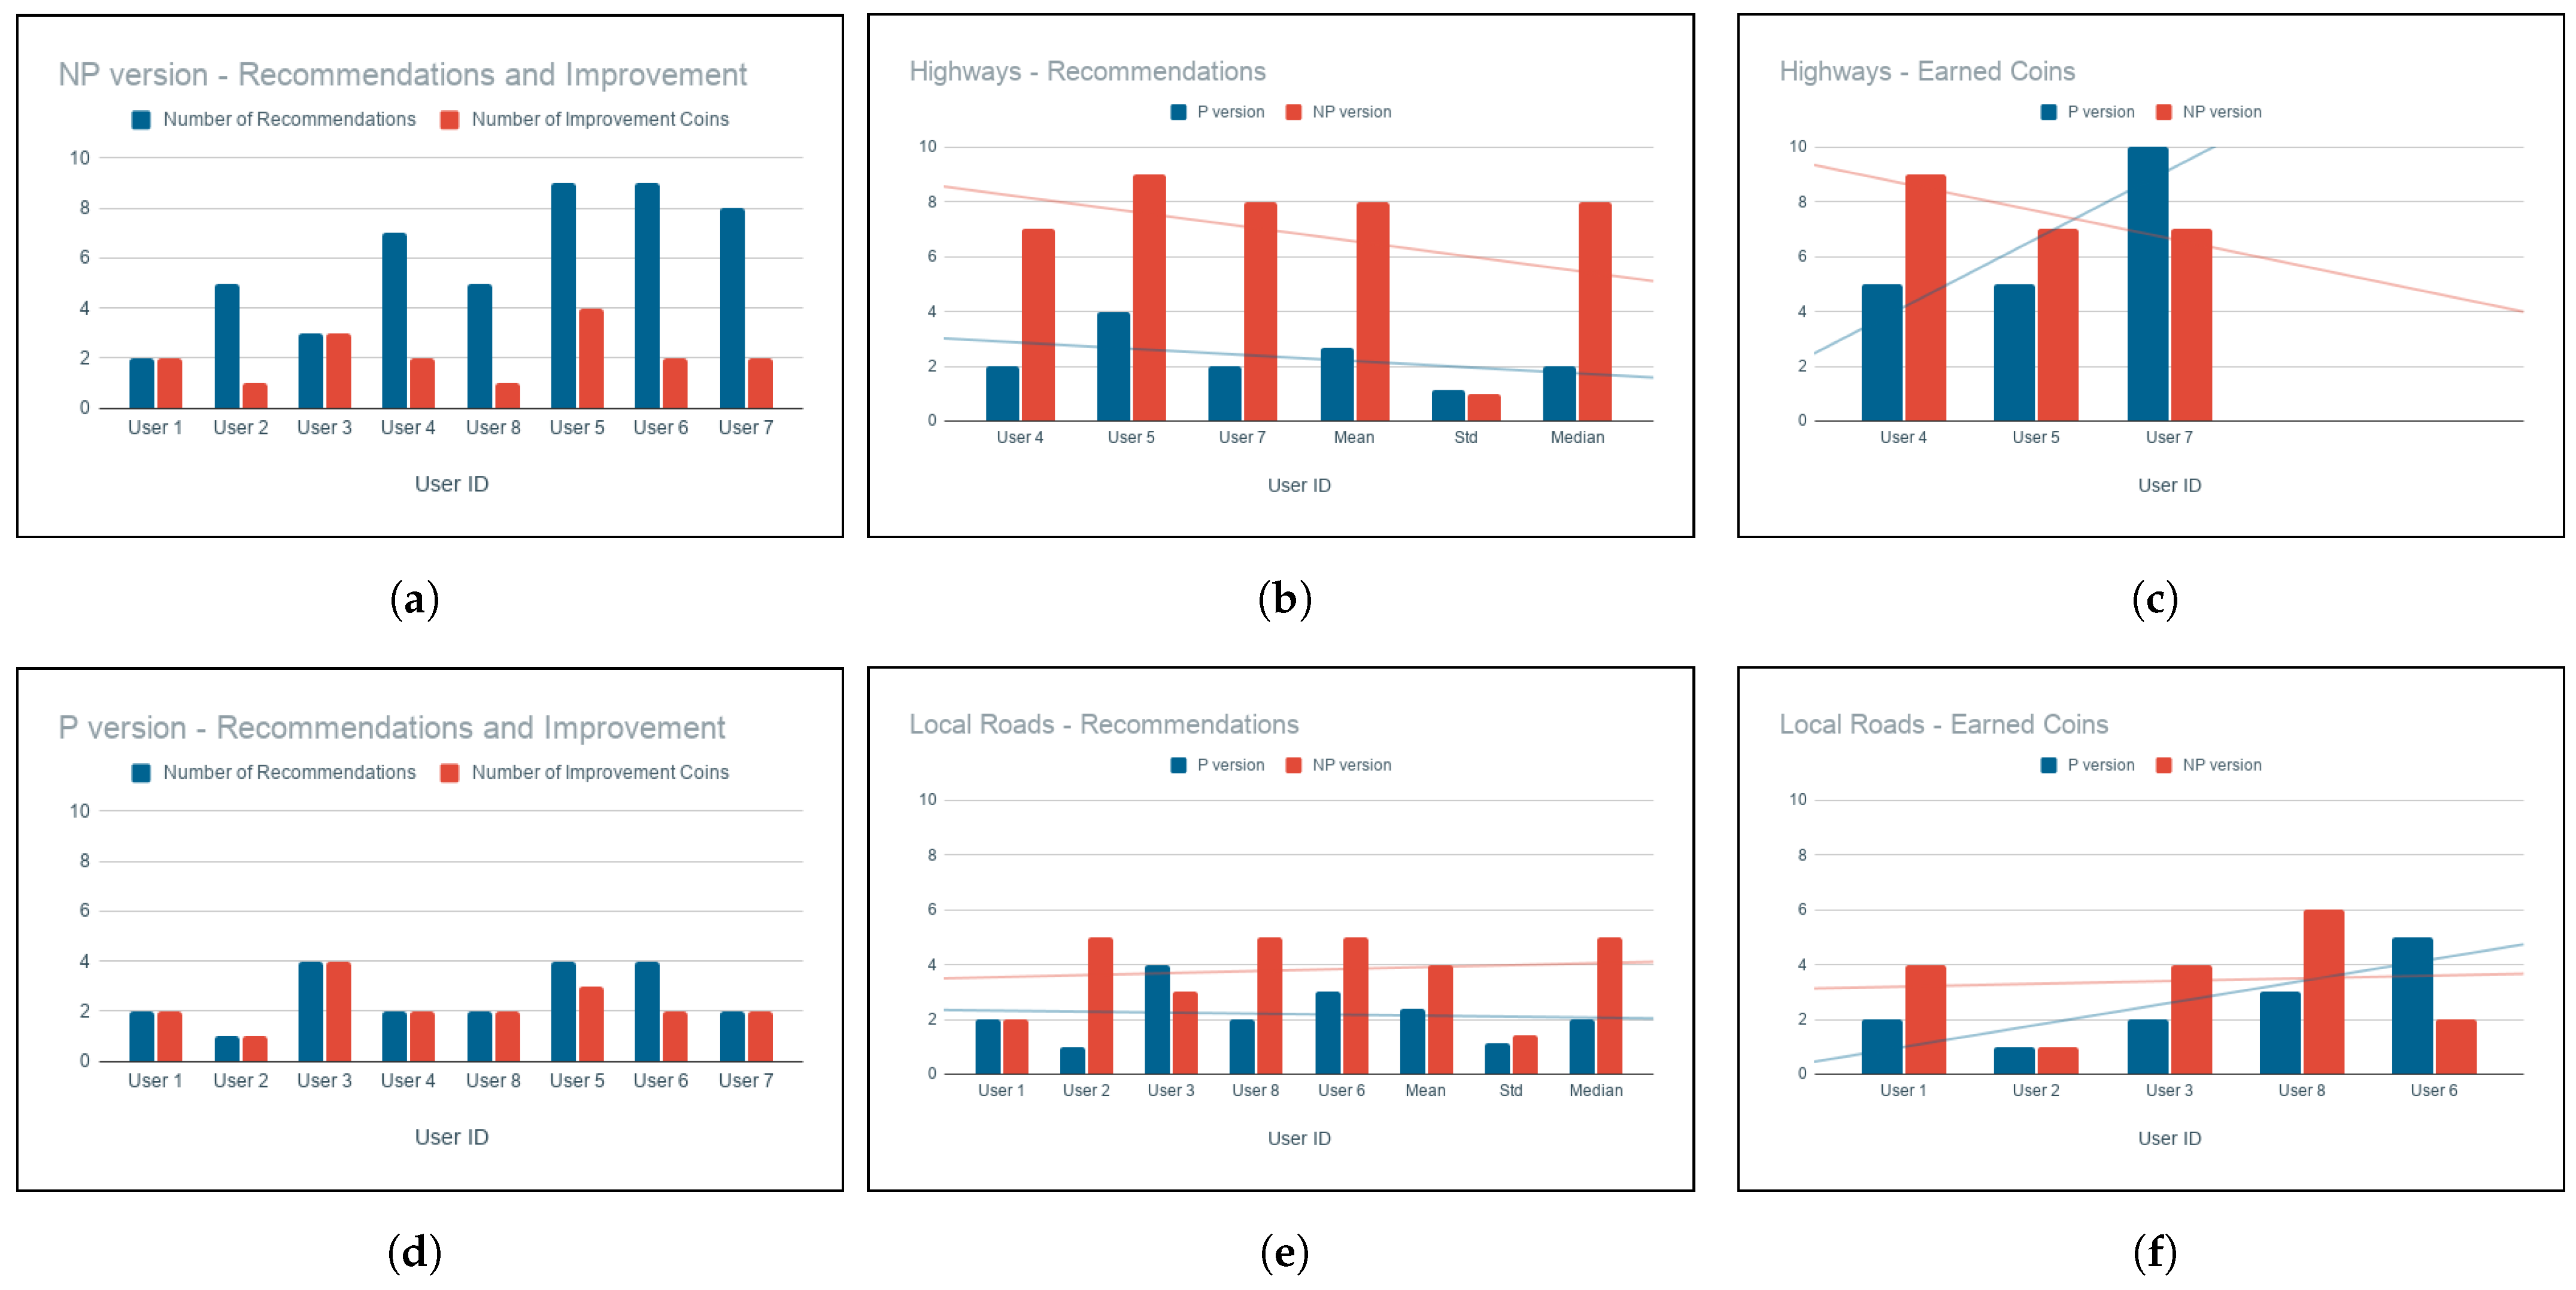
4.3.1. Recommendations vs. Improvement Coins
From the results shown in
Figure 9a,d, we notice that drivers were given much more recommendations in the NP version than in the P version. The riskier the driver, the more feedback offers he seemed to get. When we compare the number of recommendations proposed with the number of improvement coins earned, we find that drivers could not improve their behavior for all given recommendations in the NP version. On the other hand, when we look at the P version results, we can see that the offered recommendations seem to be pretty consistent among all drivers. Therefore, safer and riskier drivers were offered relatively similar amounts of feedback as the system created a personal model for each one of them. Furthermore, most drivers can catch up with the number of recommendations offered and earn the behavior improvement coins.
4.3.2. Highways vs. Local Roads
We asked drivers to drive around local roads and repeat the same trip for both versions; however, participants 4, 5, and 7 had to go through a highway for part of their trip. From the collected data shown in
Figure 9b,e, we noticed that when drivers went through highways, they were issued more recommendations in the NP version compared to drivers who remained within local roads. This is because the higher the speed, the more likely an event to be considered risky. However, in the P version, the number of recommendations seemed to be consistent. As the P version uses the two levels of personalization, it can decide whether this is a true emergency to offer a recommendation or not.
4.4. Qualitative Results
When a participant completes his experiment, we conduct a semi-structured interview right after to make sure the information is still fresh. We ask the participants 24 questions, followed by a discussion comparing the two versions. The questions covered many aspects, including:
Event detection correctness: tests if the system correctly identifies or misses events.
Feedback timeliness: tests how timely the were the proposed recommendations.
Feedback sensitivity: tests how sensitive the system in identifying risky behaviors.
Risk identification accuracy: are the identified risky events truly risky?
Safety identification accuracy: are the detected safe events truly safe?
Level of intelligence: asks questions on how a driver rates the intelligence is AutoCoach.
4.4.1. Feedback Timeliness and Sensitivity
As mentioned earlier, we assume riskier drivers need to be offered feedback sooner rather than later while ensuring that those more dangerous drivers’ “normal behavior” usually is worse than those of safer drivers. We asked drivers questions regarding the timeliness of each Version. As shown in
Figure 10a, 67.5% of drivers found that version P was more timely in offering the feedback for brakes, accelerations, and turns, while 37.5% found those were neutral for both versions. Because of the way version P is set, most drivers belonging to groups
,
,
will be getting faster feedback, and the higher the risk group, the quicker the feedback.
In regards to sensitivity, the same concepts of timeliness apply. Results have shown that participants found that version P is more sensitive than Version NP when detecting riskier behavior.
4.4.2. Level of Intelligence
Through the interview, we asked drivers to rate the level of intelligence of Version NP and Version P. Results shown in
Figure 10e exhibits that all participants highly believe that Version P is more intelligent than NP. We notice that the riskier the drivers, the less they believe Version NP is more intelligent. This is because the memory factor is more proactive for higher-risk drivers. Results shown in
Figure 10c,d state that drivers also find participant agrees that Version P is better in estimating the risks and safety of their driving behavior.
4.5. Level of Acceptance of Version NP vs. Version P
Out of the 24 interview questions, we included eleven 10-point Likert-scale questions concerning the frequency, timeliness, correctness, sensitivity, accuracy, and intelligence of the three areas presented in
Figure 7b. Questions compare between Version NP and Version P, where “1” indicates that a participant strongly agrees that Version P is more accurate than Version NP. In contrast, “10” indicates the opposite. Results in
Figure 11 show the means of Likert-scale ratings of the 8 participants.
Results indicated high acceptance for our assumption that Version P is more intelligent and helpful.
4.6. Success Assessment
We designed six policies to help drivers in better behavior adaptation. The policies allow threshold adjustments based on the driver’s driving performance. During the phases of data collection, we exposed some of our drivers to the AutoCoach system without prior knowledge that we are monitoring their driving behavior changes. We have re-clustered the drivers throughout the study to evaluate the historical change in drivers’ groups. We select results from three points of time over 8 weeks to identify whether behavioral change is significant.
Figure 12 shows the 21 drivers’ group placements at three different points of time. We notice that many drives in higher-risk groups have transitioned to less risky groups over time.
Given the null hypothesis that people will not show behavioral changes at any time, we believe that the policies support drivers to improve their driving behavior under significance level . The dataset is structured as a Likert scale ranging from 1 to 4 where drivers’ groups are represented as follows: “Worst Drivers” = 4, “Average Drivers” = 3, “Good Drivers” = 2, and “Best Drivers” = 1).
In order to test that the policies have a positive effect on influencing behavior adaptation, a one-way repeated measures ANOVA was conducted to determine whether there was a statistically significant difference in behavior adaptation using AutoCoach’s proposed policies over a period of 8 weeks. There were no outliers, and the data violated the normality of distribution at each time point, as assessed by boxplot and Shapiro–Wilk test (p < 0.001, 0.001, 0.01), respectively.
Mauchly’s test of sphericity indicated that the assumption of sphericity had been violated, , . Epsilon () was 0.664, as calculated according to Greenhouse and Geisser, and was used to correct the one-way repeated measures ANOVA. There has been statistically significant election for behavioral change at the different time points during the study, , , , with group ranks decreased from 3.05 ± 0.973 at the first point of time to 2.13 ± 1.121 into the second point of time to 2.14 ± 0.854 at the third point of time. Results indicate successful behavior improvement.
5. User Experience Discussion
AutoCoach proposed the first feedback-model design that considers the idea of penalization to driving behavior feedback engines. We built a mobile application with our innovative personality-based model and feedback design. Then, we allowed drivers to experience it and compare it with the same application with the personality option turned off. Results discussed in
Section 4.4 show that participants noticed that a personalized version could understand their driving style. During our after-driving discussion, User 4 remarked:
“When I used the P version, it gave me “behavior improvement” coins after I improved my driving when I was somewhat braking or swerving harsher than usual. It knows it is my driving style. However, in the NP version, it gave me coins all through it.”
The “behavior improvement” coins, as discussed in Section, are given to drivers after feedback is initiated and improvement is detected. What User 4 was saying proves that the personalized version knew the driver’s standard driving style and only issued feedback and improvement coins when he truly needed the feedback. On the other hand, Version NP has given feedback throughout the trip, not knowing that the aggressiveness is part of the driver’s typical driving style. As seen in the results shown in
Section 4.3.1, the personalization has given much less feedback because it knew what is genuinely a risky behavior and what is not the driver’s habit and personality group assignment.
In regards to the feedback sensitivity and frequency, User 2 stated:
“Version P has a less aggressive screen with fewer feedback and outputs. Version NP does give too much information. It feels like version P does not consider everything, and it understands how I usually drive.”
In our design, sensitivity is defined by what the system considers risky. In Version NP, the system knew events are dangerous when they exceeded the pre-set threshold. However, participants disagreed that this is an actual risk. While in the personalized version, some events could have been seen as risky, but as part of the individual behavior, they were the drivers’ normal. As User 2 said, the system understood how they usually drive.
In terms of feedback timeliness, we designed the feedback to be more proactive for higher-risk drivers. User 7, assigned to the riskiest personality group, sensed these features and stated:
“Version P was faster in offering recommendations. It offered coins in a more timely fashion. I felt it more accurate and was able to understand my driving better.”
In AutoCoach, we purposely delay feedback for safer drivers while sending it much quicker to riskier drivers assuming that they exhibit a high risk and need to be notified. In comparison, safer drivers should be treated less aggressively. From the interview and discussion with drivers, we found that drivers sensed the personalization by stating that Version P knew who they are as drivers.
As we have mentioned earlier, this study’s primary purpose was to understand the level of acceptance of personalized feedback compared to non-personalized ones. AutoCoach has successfully gained the trust of drivers as we hoped to achieve. The frequency and timeliness of feedback play a role in creating more perceived intelligence. Lowering the amounts of feedback and giving it only when truly needed reduces drivers’ stress caused by frequent feedback. When we have assigned different policies to drivers, we found that riskier drivers have noticed AutoCoach more and were more grateful for the feedback offered by AutoCoach. This acceptance could help them follow the feedback and adapt to newer and safer habits with time. AutoCoach has been shown to give a successful feedback design. We, therefore, believe that the personality-based feedback design can be applied in many other fields to provide a more pleasant UX.
6. Conclusions
This project is one of the first automobile agents to classify users into different driver-personality groups using machine learning algorithms. AutoCoach has implemented an intelligent real-time user feedback engine based on a driver’s past typical behavior and personality group assessment. In this paper, we conducted a systematic pilot study to test AutoCoach. Our pilot study has attempted to demonstrate the success of an innovative personality-based driver behavior management and feedback agent. We were exploring concepts as well as abstracting metrics when conducting this study. The validity of these concepts and the dependability of the metrics have yet to be shown. However, we conclude that by presenting our results in this manner, we have demonstrated how quantitative and qualitative approaches effectively evaluate the feasibility and acceptability of our system. Clearly, further research is required to discover the total utility of our model.
We observe that the participants’ interaction with the personalized feedback system compared to the non-personalized system was more effective. We found the majority of participants agreeing that the personalization shows more intelligent and adequate real-time feedback. We gathered sufficient quantitative and qualitative data, which indicated that the intervention was acceptable and showed a decrease in risky driving behaviors.
We learned that the timing and frequency of feedback are factors we could enhance in future research. We also learned lessons that the test delivery method could be segmented into smaller portions to make sure participants could focus on each component individually. We want to conduct a study on a larger scale to test the behavior adaptation and factors affecting this adaptation in the future. We also would like to provide a more complex rewarding and scoring engine and reach the grand goal of behavior adaptation.


 and
and 


