Article

A Battery Management System with EIS Monitoring of Life Expectancy for Lead–Acid Batteries

by
Javier Olarte
1,2,3,
Jaione Martínez de Ilarduya
1,
Ekaitz Zulueta
3,
Raquel Ferret
2,
Unai Fernández-Gámiz
4 and
Jose Manuel Lopez-Guede
3,*
1
Bcare, C/Albert Einstein 48, 01510 Miñano, Álava, Spain
2
Centre for Cooperative Research on Alternative Energies (CIC EnergiGUNE), Basque Research and Technology Alliance (BRTA), Alava Technology Park, Albert Einstein 48, 01510 Vitoria-Gasteiz, Álava, Spain
3
Department of Systems Engineering and Automation Control, University of the Basque Country UPV/EHU, C/Nieves Cano 12, 01006 Vitoria Gasteiz, Álava, Spain
4
Department of Nuclear Engineering and Fluid Mechanics, University of the Basque Country UPV/EHU, C/Nieves Cano 12, 01006 Vitoria Gasteiz, Álava, Spain
*
Author to whom correspondence should be addressed.
Electronics 2021, 10(11), 1228; https://doi.org/10.3390/electronics10111228
Submission received: 9 April 2021 / Revised: 14 May 2021 / Accepted: 19 May 2021 / Published: 21 May 2021

Abstract

:
This work presents a battery management system for lead–acid batteries that integrates a battery-block (12 V) sensor that allows the online monitoring of a cell’s temperature, voltage, and impedance spectra. The monitoring and diagnostic capabilities enable the implementation of improved battery management algorithms in order to increase the life expectancy of lead–acid batteries and report the battery health conditions. The novelty is based on the online monitoring of the evolution of electrochemical impedance spectroscopy (EIS) over a battery’s life as a way to monitor the battery’s performance. Active cell balancing is also proposed as an alternative to traditional charge equalization to minimize excessive electrolyte consumption. A battery-block sensor (VTZ) was validated by using the correlation between experimental data collected from electrochemical impedance spectroscopy lab-testing equipment and sensors that were implemented in a series of 12 V lead–acid battery blocks. The modular design and small size allow easy and direct integration into different commercial cell formats, and the proposed methodology can be used for applications ranging from automotive to stationary energy storage.

1. Introduction

The implementation of a battery management strategy for lead–acid batteries by integrating a multipurpose sensor in a 12 V block allows the online monitoring of the state of health (SOH) and state of charge (SOC). In addition, this implementation can be easily and inexpensively included in existing battery systems. Although the purpose of this article is not to detail the algorithms for determination based on characterization and modeling technologies, some related works are presented in [1,2]. Additionally, the architecture described herein implements the balancing of an active voltage cell, which could additionally improve the life expectancy of a series battery cells, as suggested by Krein and Balog [3].
In the last decade, many efforts have been devoted to the development of reliable and robust methods for determining the state of health and state of charge. Several authors have reported different ways of estimating SOC and SOH variables of batteries; they can be divided in different categories—such as direct measurements, electrical and electrochemical models, and adaptive and machine learning methods [4,5,6,7]—independently of the target technology. For example, Kumar et al. [4] mentioned the problem of SOC and SOH determination in batteries with respect to their implementation in vehicles, which is still not accurate enough, and they reviewed different SOC and SOH indication algorithms.
In the category of direct measurements, discharge capacity tests can be used to detect the capacity at the beginning of the battery’s life, or intermediate measurements can be used to determine the state of health. However, even though this type of method is accurate, it cannot always be incorporated into an intelligent diagnostic detection system by itself; see Lukic et al. [8]. Open circuit voltage (OCV) measurements are used in such technologies as lead–acid, NiCd, or Zn/Br, which are based on the relation of the OCV and SOC. This open circuit voltage usually has to be measured in offline conditions, but it can be online if the OCV is inferred from terminal voltage measurements or suitable models. Electrochemical impedance spectroscopy is another method that can be used for real-time prediction by interpreting parameters from the spectra [9,10,11]. However, initially, the electrochemical model is difficult to implement, and it is very specific for each technology; see the study of Piller et al. [12]. Thus, it is necessary to develop specific protocols for extracting EIS measurements for each type of electrochemical energy storage technology; see Meddings et al. [13]. In terms of adaptive methods based on algorithms, there are some other approaches based on time series [14] or fractional analysis [15]. Other widely used approaches are those of genetic-algorithm-based optimization, which was developed by Ramos et al. [16], or neural-network-based approaches, which were presented by Chun et al. [17]. From all of the mentioned options, it is necessary to identify the methods that can be directly implemented during real operations in stationary applications in order to avoid interfering in the operating mode, as suggested by Shahriari and Farrokhi [18]. In their work, a method for online measurement of the SOC and SOH—without the requirement of disconnecting the battery from the circuit—was developed. However, the battery was obliged to continuously charge or discharge, among other drawbacks. Furthermore, Khare et al. [19] proposed an online method for estimating the SOH of hybrid electric vehicles using various battery parameters, such as the internal resistance, terminal voltage, and specific gravity of the battery, but this differs from our target application. Sedighfar and Moniri [20] also developed an online method for the estimation of the SOC and the SOH of valve-regulated lead–acid (VRLA) batteries, which are oriented toward electric vehicle application. According to Marrero et al. [21], the integration of sensors and the development and optimization of a battery management system have great importance in the creation of battery systems in order to increase life expectancy or availability, rather than focusing only on Li-ion batteries, as the majority of researchers are doing; see also [22,23].
A battery management system for lead–acid batteries with an integrated battery-block (12 V) sensor that allows the online monitoring of the cell temperature, voltage, and impedance spectra is presented in this article. The monitoring and diagnostic capabilities enable the implementation of improved battery management algorithms in order to increase the life expectancy of lead–acid batteries and report battery heath conditions. As it is complementary to the monitoring of the evolution of EIS over a battery’s life as a way of monitoring the battery’s performance, active cell balancing is proposed as an alternative to traditional charge equalization in order to minimize excessive electrolyte consumption. The battery-block sensor was validated using the correlation between experimental data collected from electrochemical impedance spectroscopy lab-testing equipment with a series of 12 V lead–acid battery blocks. The modular design and small size allows easy and direct integration into different commercial cell formats, and the proposed methodology can be used for applications ranging from automation to stationary energy storage.
In summary, the identification of a correlation map between the EIS values and the states of health and capacity, coupled with an economical sensor, represents the key points of this work.
EIS is used extensively in many fields of electrochemistry and is useful as a tool for interpreting processes and reactions. In this work, it is used to measure dispersions from previously identified normal values and to associate these dispersions with degradation patterns or failure modes in batteries.
Section 2 provides a general description of the architecture of the battery management system and the 12 V multimodal VTZ sensor. Section 3 includes a description of the corresponding experimental setup. Section 4 presents the results of the EIS measurement tuning process in comparison to those of calibrated EIS lab equipment. Finally, the main conclusions and future directions are summarized in Section 5.

2. Battery Management System Architecture

Figure 1 shows a basic scheme of the battery management system architecture, where a series of VTZ sensors (Sensor 1, Sensor2, … Sensor n) that measure the voltage, temperature, and EIS are associated with every 12 V battery block (Batt 1, Batt 2, … Batt n), which is integrated with a battery charger.
The master battery management system controller unit additionally monitors the battery string’s current and implements communication with both the battery charger and the string of sensors. Thus, the unit is able to command different battery management strategies, diagnose battery failures, or estimate the SOH.

2.1. Description of the 12 V VTZ Sensor

The proposed VTZ sensor (Figure 2) design integrates a basic form of impedance measurement (Z) that is complementary to the conventional temperature (T) and voltage (V). The sensor is easily integrated into a series of sensors associated with a battery bank or string to achieve higher voltages, and it could easily be integrated with a higher-level battery management system that would monitor the battery string’s current. It is necessary to highlight that the VTZ sensor is not a portable measurement device, but rather an integrated device for battery blocks and modules for improving their maintenance and SOC and SOH predictions. Different studies have deepened the investigation of portable impedance measurement devices for different applications [24,25,26,27], but nevertheless, the new point of our sensor is its direct integration in an electrochemical storage system.
Figure 2a shows a VTZ sensor plate and Figure 2b,c shows its integration in the top part of 12 V high temperature lead–acid battery block.
The motivation behind developing a multipurpose sensor designed to monitor the electrochemical parameters of a 12 V lead–acid battery block was to facilitate the real-time data monitoring for a stationary application in order to increase the battery’s life expectancy by improving the battery management strategy according to the manufacturer’s recommendations. The sensors were installed in a complete battery string of lead–acid batteries together with the battery management system controller. The precise battery block voltage allowed monitoring of the voltage dispersion and the command of voltage equalization actions in the string. The VTZ sensor itself allowed active balancing during different operation stages of the battery (namely, floating or charging). Monitoring not only the ambient temperature of the battery banks, but also every individual block improved the floating voltage compensation. Finally, continuous monitoring of the electrochemical impedance spectroscopy offered reliable information on the degradation and failure modes of the battery over its lifetime.

2.2. Basic VTZ Sensor Specifications

The sensor was designed to monitor the voltage, temperature, and impedance of a 12 V lead–acid battery block. Although the design could be adapted to other battery capacities, the impedance measurement was adjusted and calibrated for lead–acid batteries with a capacity of 100 Ah. Figure 3 presents a basic block diagram of the main design components of the VTZ sensor, where Rsense is identified as the adjustable parameter that allows the calibration of the sensor. Other components included in Figure 3 are the voltage and the temperature sense, the control and communication module and the PWM control.
Table 1 illustrates the measurement accuracy of the variables monitored by the sensor. The range of temperatures that the sensor could measure was between −20 °C and 60 °C. This covers a very wide range, which includes normal operating temperatures and temperature conditions that can occur in damaged elements or in adverse weather conditions. The voltage range in which the sensor could identify this parameter ranged from 6 to 15 V, thus covering the standard and maximum range of operation of the 12 V lead–acid battery block.
For the impedance measurement, the VTZ sensor was used to perform galvanostatic electrochemical impedance spectroscopy (GEIS), in which the electrical perturbation was a current. The impedance measurement was implemented by using a simplified square-wave signal modulated at adjustable frequencies to emulate the measurement range of a laboratory EIS instrument.
In addition to the monitoring of voltage, temperature, and impedance, the VTZ allowed the active balancing of a series of cells, which allowed it to increase the life expectancy of the complete string, as shown by Krein and Balog [3].

3. Experimental Setup

Different high-temperature lead–acid batteries (12 V battery block—80 Ah) from the same manufacturer, which were intended for back-up applications, were used to develop the following experiments. These batteries had an improved performance at high temperatures compared to standard lead–acid batteries. They included an anode composed of lead (Pb), while the cathode consisted of a paste of lead oxide (PbO2). The electrodes are separated by a porous separator impregnated with an electrolyte consisting of an aqueous acid solution of H2SO4. On one hand, the electrochemical impedance spectroscopy (EIS) measurements were recorded by means of a Gamry 3000 battery tester, and on the other hand, the EIS spectra were found with three different types of VTZ sensor settings. The main difference between these sensors was in the resistance that regulated the current pulses in the impedance measurements: 25, 50, and 100 Ω. By dividing the battery voltage by the value of this resistance, the current value was obtained (I = V bat/R). Bearing in mind that the nominal voltage of the lead–acid batteries was 12 V, the currents of the pulses associated with 25, 50, and 100 Ω were 0.12, 0.24, and 0.48 A, respectively. In order to perform the measurement of the electrochemical impedance spectra, the batteries were fully charged. In order to eliminate the influence of temperature and battery SOC, the tests were always performed at room temperature (25 °C) and at 100% SOC. The relaxation times prior to performing electrochemical impedance spectroscopy measurements were more than 12 h in all cases. In the case of the Gamry 300 battery tester, the impedance measurement was performed under an excitation current of 50 mA and in a frequency range from 10 mHz to 10 kHz.

4. Results and Discussion

Herein, we present the results of the EIS measurement tuning process in comparison with calibrated EIS lab equipment and the error distribution when using the sensor in a real 125 V DC battery string.

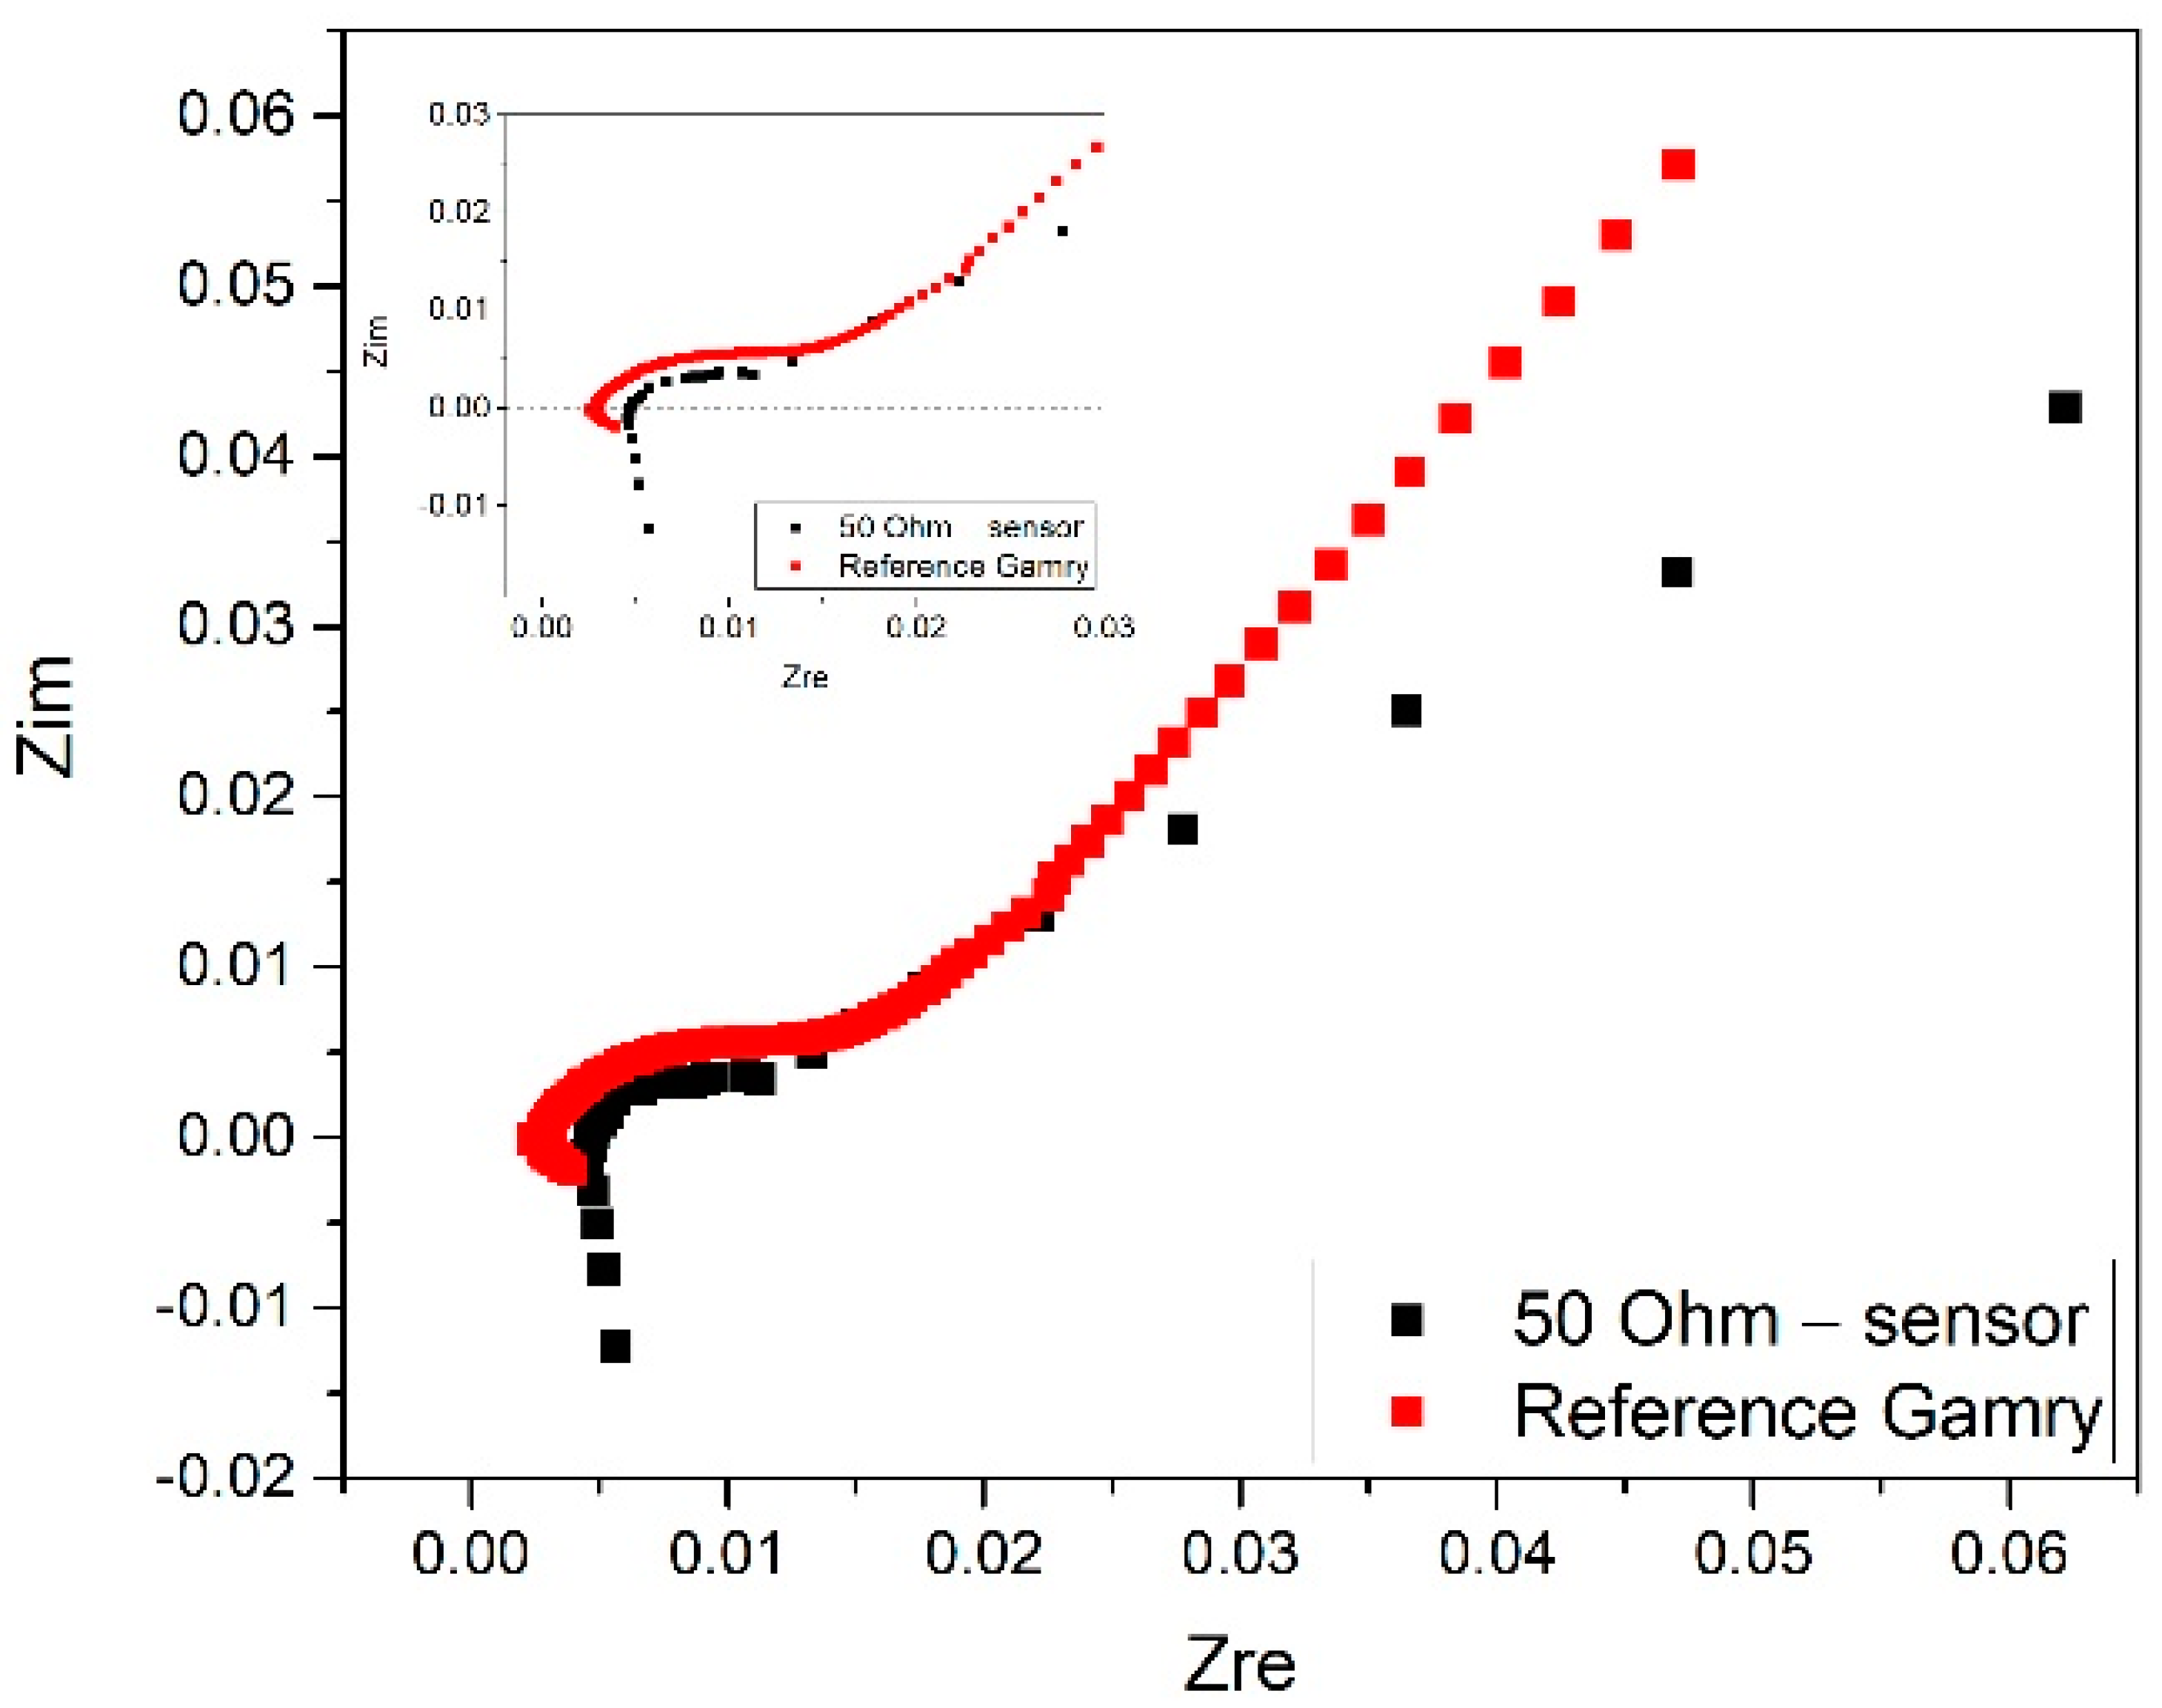
4.1. 1 kHz Calibration Process

Three different VTZ sensor setups were tested in order to calibrate the impedance measurements. As mentioned in the previous section, the greatest difference between these sensors was in the resistance that regulated the current pulses in the impedance measurement: 25, 50, and 100 Ω. The following results correspond to each different sensor. Repeatability tests were carried out on the measurements with different sensors and 10 different batteries in the same state of health in order to quantify the dispersion of the measurements.
Although the sensor provided the full range of the impedance spectrum from 10 mHz to 7 kHz for this experiment, we sought to calibrate the sensor against the measurements of the Gamry 3000 laboratory instrument based on the Rsense setting for a fixed value of 1 kHz in order to validate the calibration process. According to Nguyen, several commercially available battery testers diagnose battery aging by measuring the impedance of batteries at 1 kHz on the basis of the fact that the real part of the complex impedance of a battery at 1 kHz is almost equal to its ohmic resistance [28,29]. In the frequency range between 1 and 10 kHz, generally, only the inductance (L) and the internal resistance (Ri) are important, because the other elements of the equivalent circuit have the double-layer capacitance in parallel, which provides nearly ideal conductivity in this frequency range. This leads to a simplified equivalent circuit based on an inductance and ohmic resistance [30].
Figure 4 shows the electrochemical impedance spectra from both the Gamry tester (yellow line) and the sensor (blue line). A more detailed image of the impedance spectra is provided at higher frequencies (right bottom part of Figure 4), and it is observed that they do not show as much deviation as at lower frequencies. Regarding the 100 Ω sensor (Figure 4), the deviation in the Zreal was, approximately, ±0.0154 Ω, while the deviation in the Zim was, approximately, ±0.0111 Ω, according to the measurements from the Gamry battery tester and the sensor (Table 2).
The main deviation was observed at lower frequencies, in which the charge transfer-diffusion stage differed to a greater extent.
Figure 5 shows the electrochemical impedance spectra from both the Gamry tester (red line) and the sensor (black line). A more detailed image of the impedance spectra is provided at higher frequencies (left top part of Figure 5), and it is observed that they do not show as much deviation as at lower frequencies. Regarding the 50 Ω sensor (Figure 5), the deviation in the Zreal was approximately ±0.0128 Ω, while the deviation in the Zim was approximately ±0.0073 Ω according to the measurements from the Gamry battery tester and the sensor (Table 3).
The main deviation was observed at lower frequencies, in which the charge transfer-diffusion stage differed to a greater extent.
Figure 6 shows the electrochemical impedance spectra from both the Gamry tester (green line) and the sensor (red line). A more detailed image of the impedance spectra is provided at higher frequencies (left top part of Figure 6), and it is observed that they do not show as much deviation as at lower frequencies. Regarding the 25 Ω sensor (Figure 6), the deviation in the Zreal was approximately ±0.0111 Ω, while the deviation in the Zim was approximately ±0.0053 Ω according to the measurements from the Gamry battery tester and the sensor (Table 4).
The main deviation was observed at lower frequencies, in which the charge transfer-diffusion stage differed to a greater extent.
The voltage values are included in the tables (Table 2, Table 3 and Table 4), as they correspond to the initial voltage value before the impedance measurement and the final voltage value after the impedance measurement with both the Gamry battery tester and the sensors; they are used to ensure that the sensor does not draw a large percentage of the power from the battery. For all cases, it was observed that the voltages remained stable during the measurement; thus, the functionality and adequate consumption of the sensor were assured.
The errors in the sensor measurements with respect to the reference measurements were mainly due to the lower accuracy of the VTZ sensors compared to the Gamry battery tester. Other measurement conditions influenced the sensors’ accuracy, but are not considered in this analysis.
Despite having more dispersion of the values at lower frequencies, it is necessary to consider that the information given by this sensor will be evaluated in comparison with more historical data of the same setup and battery (via the battery management system), which will provide information about the state of health of the battery, as presented by Kiel et al. [31]. The impedance spectrum itself will not be evaluated, but the evolution of this impedance spectrum and its independent variables will. The goal is to monitor the impedance curve over the life of the battery. The sensor is able to detect these differences and compare them to its initial measurement.

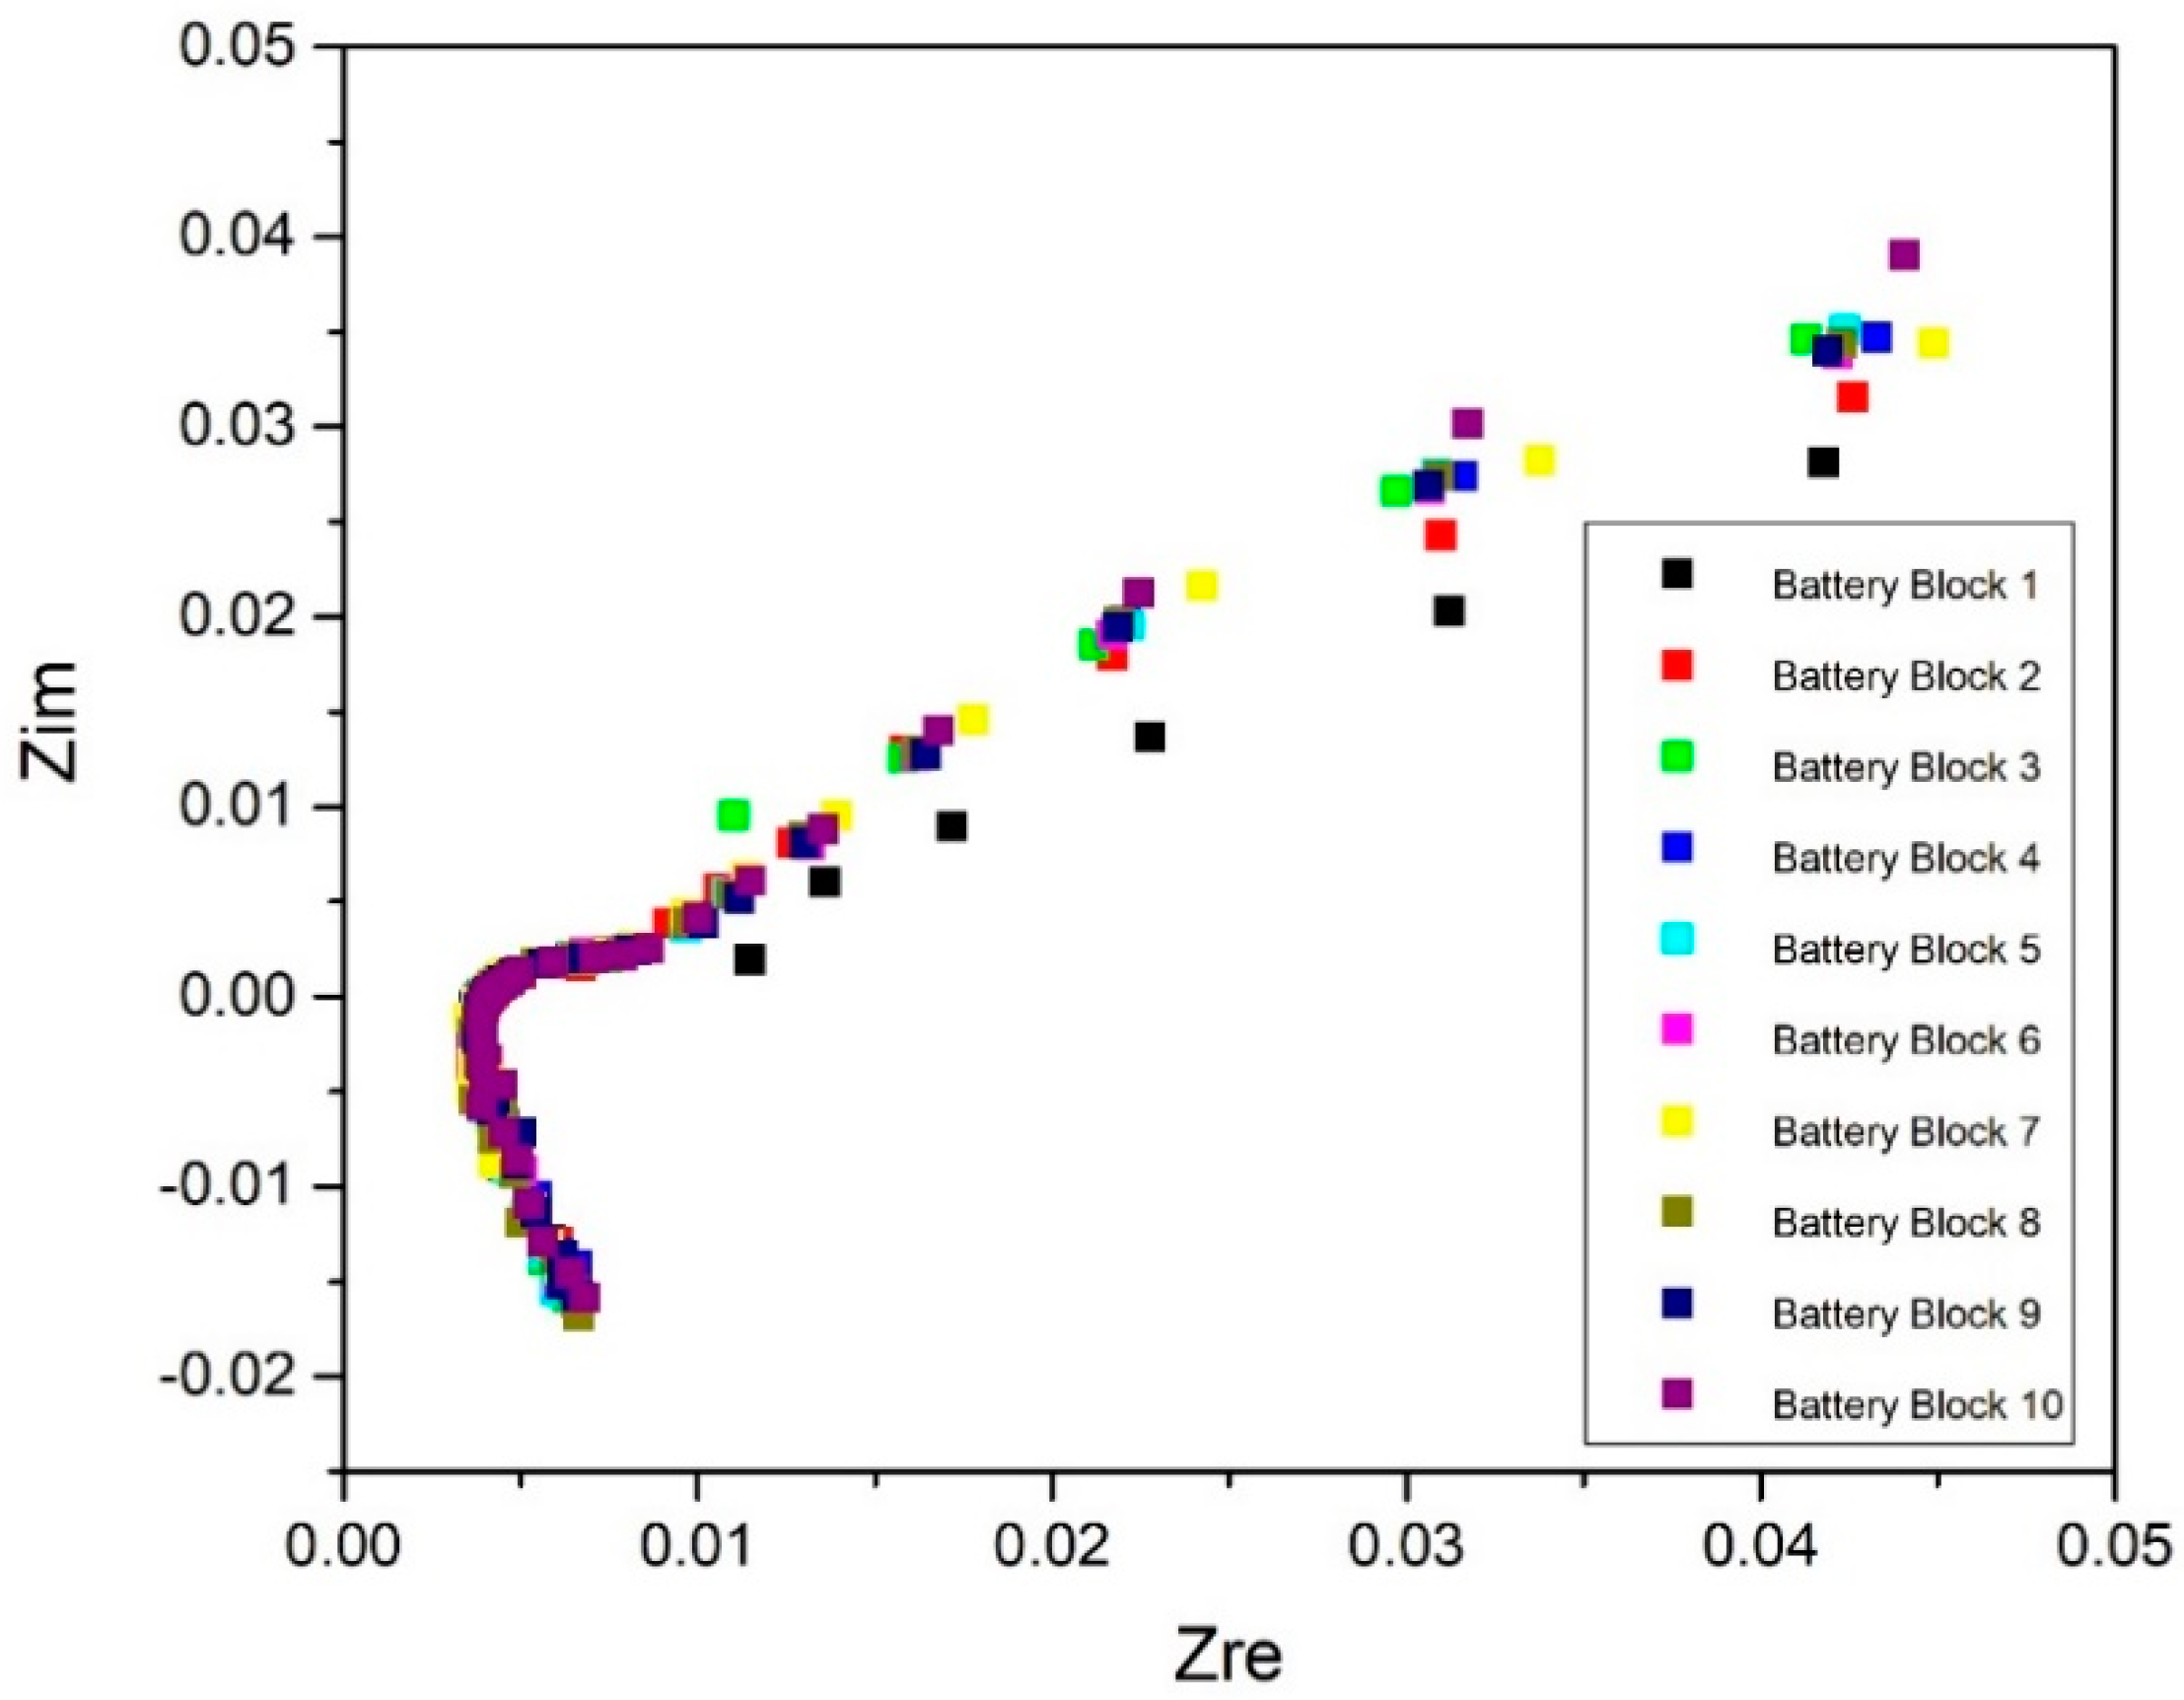
4.2. EIS Measurement Dispersion Evaluation

In the second phase, a series of tests were performed in order to determine the dispersion of the measurements among the ten sensors in a string of 10 battery blocks, as illustrated in Figure 7, where their electrochemical impedance spectra are plotted. It was observed that in an adequate initial state, the 12 V lead–acid blocks from the same manufacturer presented similar impedance spectra and, therefore, similar impedance parameter interpretations. It should be noticed that a similar dispersion was found when using the lab testing instrument.
Figure 7 shows the electrochemical impedance spectra from 10 different lead–acid battery blocks (joined in series) measured by the sensor.

5. Conclusions

This work presents a battery management system for lead–acid batteries that integrates a battery-block (12 V) VTZ sensor that allows the online monitoring of the cell temperature, voltage, and impedance spectra. The monitoring and diagnostic capabilities enable the implementation of improved battery management algorithms in order to increase the life expectancy of lead–acid batteries and report battery heath conditions. A basic calibration process with the Gamry laboratory instrument allowed the impedance value at 1 kHz to be adjusted with good precision. Subsequently, repeatability tests were carried out with a series of 10 blocks, obtaining admissible dispersion values compared to the errors of laboratory instruments. The sensor will allow the monitoring of impedance variations throughout the life of a battery and the correlation of these variations with the loss of capacity from experimental data. Although the sensor was calibrated for a 100 Ah capacity, it could be used for other capacities and even different battery technologies, such as lithium ion, vented lead–acid, or NiCd, according to the proposed adjustment procedure. Although in the proposed set up, only 1 kHz was targeted, because the sensor offers the possibility of measuring the entire spectrum of impedance, other correlations might be investigated to monitor SOC and SOH, as proposed by Meddings et al. [13] for lithium chemistries or by Kiel et al. [31] for lead–acid chemistries. Additionally, the proposed sensor design allows active balancing of the voltage dispersion during the charging process, thus avoiding the use of charge equalization and, therefore, minimizing the consumption of water, which will provide a longer life of the battery.
Regarding the experimental results presented in the article, future steps will be taken to perform the final adjustment of the VTZ to the entire range of frequencies of the EIS spectra and to perform similar analyses and calibrations in other electrochemical storage technologies. In addition, the final implementation of the sensor in lead–acid battery blocks will be developed in order to optimize the design of the final product.

Author Contributions

The investigation and proposal of the device were conducted by J.O. The writing and original draft preparation were carried out by J.O., J.M.d.I. and E.Z. R.F. performed the formal analysis. U.F.-G. and J.M.L.-G. performed the writing—review and editing. All authors have read and agreed to the published version of the manuscript.

Funding

This research was funded by the Torres Quevedo (PTQ) 2019 Aid from the State Research Agency within the framework of the State Program for the Promotion of Talent and its Employability in R + D + i, Ref. PTQ2019-010787/AEI/10.13039/501100011033.

Acknowledgments

The authors would like to express their gratitude to CIC energiGUNE for the facilities and to the Bcare innovation team for their technical and scientific contributions to this work.

Conflicts of Interest

The authors declare no conflict of interest.

Nomenclature

Definition
SOHState of Health
SOCState of Charge
OCVOpen Circuit Voltage
EISElectrochemical Impedance Spectroscopy
VRLAValve-Regulated Lead–Acid
VTZName given for the multipurpose sensor
GEISGalvanostatic Electrochemical Impedance Spectroscopy

References

  1. Olarte, J.; Zulueta, E.; Ferret, R.; Kurt, E.; Martínez de Ilarduya, J.; Lopez-Guede, J.M. High temperature lead acid battery SOC and SOH characterization based on electrochemical impedance spectroscopy data. In Proceedings of the 2020 8th European Conference Renewable Energy Systems (ECRES 2020), Istanbul, Turkey, 24–25 August 2020. [Google Scholar]
  2. Olarte, J.; Romo, S.; Martínez de Ilarduya, J.; Ferret, R.; Pacios, R.; Bekaert, E.; Zulueta, E.; Pazos, F.; Ibarrondo, X.; Alonso, N. Optimización del TCO en baterías mediante monitorización en tiempo real del estado de salud con modelos avanzados. In Proceedings of the 2020 VII Congreso Smart Grids (Smart Grids 2020), Madrid, Spain, 16 December 2020. [Google Scholar]
  3. Krein, P.; Balog, R. Life extension through charge equalization of lead-acid batteries. In Proceedings of the 24th Annual International Telecommunications Energy Conference, Montreal, QC, Canada, 29 September–3 October 2002; pp. 516–523. [Google Scholar]
  4. Kumar, B.; Khare, N.; Chaturvedi, P.K. Fpga Design Scheme for Battery SOC & SOH Algorithms for Ad-vanced BMS. IJESRT 2017, 7, 263–279. [Google Scholar]
  5. Rivera-Barrera, J.P.; Muñoz-Galeano, N.; Sarmiento-Maldonado, H.O. SoC Estimation for Lithium-ion Batteries: Review and Future Challenges. Electronics 2017, 6, 102. [Google Scholar] [CrossRef] [Green Version]
  6. Chang, W.-Y. The State of Charge Estimating Methods for Battery: A Review. ISRN Appl. Math. 2013, 2013, 1–7. [Google Scholar] [CrossRef]
  7. Zhang, R.; Xia, B.; Li, B.; Cao, L.; Lai, Y.; Zheng, W.; Wang, H.; Wang, W. State of the Art of Lithium-Ion Battery SOC Estimation for Electrical Vehicles. Energies 2018, 11, 1820. [Google Scholar] [CrossRef] [Green Version]
  8. Lukic, S.M.; Jian, C.; Bansal, R.C.; Rodriguez, F.; Emadi, A. Energy Storage Systems for Automotive Appli-cations. IEEE Trans. Ind. Electron. 2008, 55, 2258–2267. [Google Scholar] [CrossRef]
  9. Karden, E.; Buller, S.; De Doncker, R.W. A method for measurement and interpretation of impedance spectra for industrial batteries. J. Power Sources 2000, 85, 72–78. [Google Scholar] [CrossRef]
  10. Keil, P.; Rumpf, K.; Jossen, A. Thermal impedance spectroscopy for Li-ion batteries with an IR temperature sensor system. In Proceedings of the 2013 World Electric Vehicle Symposium and Exhibition (EVS27), Barcelona, Spain, 17–20 November 2013. [Google Scholar]
  11. Raijmakers, L.; Danilov, D.; van Lammeren, J.; Lammers, M.; Notten, P. Sensorless battery temperature measurements based on electrochemical impedance spectroscopy. J. Power Sources 2014, 247, 539–544. [Google Scholar] [CrossRef]
  12. Piller, S.; Perrin, M.; Jossen, A. Methods for state-of-charge determination and their applications. J. Power Sources 2001, 96, 113–120. [Google Scholar] [CrossRef]
  13. Meddings, N. Application of electrochemical impedance spectroscopy to commercial Liion cells: A review. J. Power Sources 2020, 480, 228742. [Google Scholar] [CrossRef]
  14. Alavi, S.; Birkl, C.; Howey, D. Time-domain fitting of battery electrochemical impedance models. J. Power Sources 2015, 288, 345–352. [Google Scholar] [CrossRef]
  15. Zou, C.; Zhang, L.; Hu, X.; Wang, Z.; Wik, T.; Pecht, M. A review of fractional-order techniques applied to lithiumion batteries, lead-acid batteries, and supercapacitors. J. Power Sources 2018, 390, 286–296. [Google Scholar] [CrossRef] [Green Version]
  16. Ramos, P.M.; Janeiro, F.M. Gene expression programming for automatic circuit model identification in im-pedance spectroscopy: Performance evaluation. Measurement 2013, 46, 4379–4387. [Google Scholar] [CrossRef]
  17. Chun, H.; Kim, J.; Han, S. Parameter identification of an electrochemical lithium-ion battery model with convolutional neural network. IFAC-PapersOnLine 2019, 52, 129–134. [Google Scholar] [CrossRef]
  18. Shahriari, M.; Farrokhi, M. Online State-of-Health Estimation of VRLA Batteries Using State of Charge. IEEE Trans. Ind. Electron. 2013, 60, 191–202. [Google Scholar] [CrossRef]
  19. Khare, N.; Chandra, S.; Govil, R. Statistical modeling of SoH of an automotive battery for online indication. In Proceedings of the INTELEC 2008—2008 IEEE 30th International Telecommunications Energy Conference, San Diego, CA, USA, 14–18 September 2008; pp. 1–7. [Google Scholar] [CrossRef]
  20. Sedighfar, A.; Moniri, M.R. Battery state of charge and state of health estimation for VRLA batteries using Kalman filter and neural networks. In Proceedings of the 2018 5th International Conference on Electrical and Electronic Engineering (ICEEE), Istanbul, Turkey, 3–5 May 2018; pp. 41–46. [Google Scholar]
  21. Marrero, D.; Su, A. Extending the Battery Life of the ZigBee Routers and Coordinator by Modifying Their Mode of Operation. Sensors 2020, 20, 30. [Google Scholar] [CrossRef] [Green Version]
  22. Novais, S.; Nascimento, M.; Grande, L.; Domingues, M.F.; Antunes, P.; Alberto, N.; Leitão, C.; Oliveira, R.; Koch, S.; Kim, G.T.; et al. Internal and External Temperature Monitoring of a Li-Ion Battery with Fiber Bragg Grating Sensors. Sensors 2016, 16, 1394. [Google Scholar] [CrossRef] [Green Version]
  23. Mateev, V.; Marinova, I.; Kartunov, Z. Gas Leakage Source Detection for Li-Ion Batteries by Distributed Sensor Array. Sensors 2019, 19, 2900. [Google Scholar] [CrossRef] [PubMed] [Green Version]
  24. Barreiros dos Santos, M. Portable sensing system based on electrochemical impedance spectroscopy for the simultaneous quantification of free and total microcystin-LR in freshwaters. Biosens. Bioelectron. 2019, 142, 111550. [Google Scholar] [CrossRef]
  25. Luo, T.; Li, L.; Ghorband, V.; Zhan, Y.; Song, H.; Christen, J.B. A portable impedance-based electrochemical measurement device. In Proceedings of the 2016 IEEE International Symposium on Circuits and Systems (ISCAS), Montreal, QC, Canada, 22–25 May 2016; pp. 2891–2894. [Google Scholar]
  26. Jiang, Z.; Yao, J.; Wang, L.; Wu, H.; Huang, J.; Zhao, T.; Takei, M. Development of a Portable Electrochemical Impedance Spectroscopy System for Bio-Detection. IEEE Sens. J. 2019, 19, 5979–5987. [Google Scholar] [CrossRef]
  27. Aksakal, C.; Şişman, A. On the Compatibility of Electric Equivalent Circuit Models for Enhanced Flooded Lead Acid Batteries Based on Electrochemical Impedance Spectroscopy. Energies 2018, 11, 118. [Google Scholar] [CrossRef] [Green Version]
  28. Nguyen, T.-T.; Tran, V.-L.; Choi, W. Development of the intelligent charger with battery State-Of-Health estimation using online impedance spectroscopy. In Proceedings of the 2014 IEEE 23rd International Symposium on Industrial Electronics (ISIE), Istanbul, Turkey, 1–4 June 2014; pp. 454–458. [Google Scholar]
  29. Kischkel, J. VRLA White Paper Lead Acid Battery and Its Internal Resistance; Panasonic Industry Europe GmbH: Bayern, Germany, 2008; Volume 11. [Google Scholar]
  30. Hariprakash, B.; Martha, S.K.; Shukla, A.K. Monitoring sealed automotive lead-acid batteries by sparse-impedance spectroscopy. J. Chem. Sci. 2003, 115, 465–472. [Google Scholar] [CrossRef]
  31. Kiel, M.; Sauer, D.U.; Turpin, P.; Naveed, M.; Favre, E. Validation of single frequency Z measurement for standby battery state of health determination. In Proceedings of the INTELEC 2008—2008 IEEE 30th International Telecommunications Energy Conference, San Diego, CA, USA, 14–18 September 2008; pp. 1–7. [Google Scholar]
Figure 1. Block diagram of the battery management system architecture in a battery string setup with a 12 V block.
Electronics 10 01228 g001
Figure 2. Images of the (a) VTZ sensor and (b,c) integration of the sensor in a 12 V lead–acid battery block.
Electronics 10 01228 g002
Figure 3. Block diagram of the VTZ sensor.
Electronics 10 01228 g003
Figure 4. Electrochemical impedance spectra from the Gamry 3000 battery tester and 100 Ω sensor.
Electronics 10 01228 g004
Figure 5. Electrochemical impedance spectra from the Gamry 3000 battery tester and 50 Ω sensor.
Electronics 10 01228 g005
Figure 6. Electrochemical impedance spectra from the Gamry 3000 battery tester and 25 Ω sensor.
Electronics 10 01228 g006
Figure 7. EIS measurement dispersion from 10 different 12 V lead–acid battery blocks.
Electronics 10 01228 g007
Table 1. Accuracy of the VTZ sensor.
RangeAccuracy
Temperature−20 to 60 °C±1.5 °C
Voltage6 V to 15 V±6 mV
Impedance10 mHz to 7 kHz-
Table 2. Resistances measured at 1 kHz and the voltage parameter variations before and after EIS measurements with the 100 Ω sensor.
Sensor VTZ—100 OhmReference Gamry
1 kHz Z real (Ω)0.00520.0027
1 kHz Z imaginary (Ω)0.0026−0.0003
Ordinate axis cut (Zimg = 0)0.00520.0027
Initial voltage (V)12.723612.8334
Final voltage (V)12.692712.8398
Table 3. Resistances measured at 1 kHz and the voltage parameter variations before and after EIS measurements with the 50 Ω sensor.
Sensor VTZ—50 OhmReference Gamry
1 kHz Z real (Ω)0.00450.0027
1 kHz Z imaginary (Ω)0.0017−0.0003
Ordinate axis cut (Zimg = 0)0.00470.0027
Initial voltage (V)12.488112.8334
Final voltage (V)12.450312.8398
Table 4. Resistances measured at 1 kHz and the voltage parameter variations before and after EIS measurements with the 25 Ω sensor.
Sensor VTZ—25 OhmReference Gamry
1 kHz Z real (Ω)0.00460.0027
1 kHz Z imaginary (Ω)0.0013−0.0003
Ordinate axis cut (Zimg = 0)0.00490.0027
Initial voltage (V)12.437112.8334
Final voltage (V)12.385212.8398
Publisher’s Note: MDPI stays neutral with regard to jurisdictional claims in published maps and institutional affiliations.

