Article

A Novel Low Power Method of Combining Saliency and Segmentation for Mobile Displays

1
Department of Electrical and Computer Engineering, Ajou University, Suwon 16499, Korea
2
Agency for Defense Development, Daejeon 34186, Korea
*
Author to whom correspondence should be addressed.
Electronics 2021, 10(10), 1200; https://doi.org/10.3390/electronics10101200
Submission received: 2 March 2021 / Revised: 15 May 2021 / Accepted: 17 May 2021 / Published: 18 May 2021
(This article belongs to the Special Issue Design and Implementation of Efficient Future Memory Systems)

Abstract

:
Saliency, which means the area human vision is concentrated, can be used in many applications, such as enemy detection in solider goggles and person detection in an auto-driving car. In recent years, saliency is obtained instead of human eyes using a model in an automated way in HMD (Head Mounted Display), smartphones, and VR (Virtual Reality) devices based on mobile displays; however, such a mobile device needs too much power to maintain saliency on a mobile display. Therefore, low power saliency methods have been important. CURA tried to power down, according to the saliency level, while keeping human visual satisfaction. But it still has some artifacts due to the difference in brightness at the boundary of the region divided by saliency. In this paper, we propose a new segmentation-based saliency-aware low power approach to minimize the artifacts. Unlike CURA, our work considers visual perceptuality and power management at the saliency level and at the segmented region level for each saliency. Through experiments, our work achieves low power in each region divided by saliency and in the segmented regions in each saliency region, while maintaining human visual satisfaction for saliency. In addition, it maintains good image distortion quality while removing artifacts efficiently.

1. Introduction

The human visual system does not have the same interest in all areas of an image. Visual attention is focused on objects or areas in which visual characteristics such as brightness and color are clear. Using these visual features, it is possible to calculate the degree of focus on a specific pixel in an image, and this is called saliency. There are two ways to extract saliency from an image: a user study method using an eye tracker and a saliency model applying the theory of prior experiments and visual features.
The eye tracker can track the movement of the pupil to the experimenter and measure the time the pupil stays for a specific pixel in the image. Nemoto extracted FDM (Fixation Density Map) from the image by dividing concentration on the sight, simple blinking, and movement of the eye by the time the pupil stays [1]. When determining the performance of the saliency model, the performance of the model can be determined by using the FDM as ground truth. Since FDM extracts saliency using a user study, it is impossible to calculate saliency for the images unused in a user study. Thus, we use a saliency model that calculates saliency using image pixel values automatically.
A pioneering saliency model is the Itti model [2]. It extracts color, brightness, and motion as visual features through a Gaussian filter and a Gaber filter using a feature integration theory [3], which is a biological feature in human vision, and compares the visual features with surrounding pixels to calculate image saliency. Starting with the Itti model, various saliency models, such as CovSal [4], Judd [5], and WMAP [6], have been developed. Among them, the CovSal model is used as a model to extract image saliency in this paper because it has higher saliency extraction performance and lower computational complexity than other models that use relationship to pixel values.
Since the saliency technology complements the limitations of human vision by using information on the location where vision is concentrated, it can be applied in various ways in the military field. In particular, the saliency technology is being used variously in HMD (Head Mounted Display) applications where interactions with the visual system are important. Researchers of the University of Mumbai, India, conducted a study on the Advanced Military Helmet, which displays all information related to the battlefield on a single screen by integrating augmented reality models using various wireless communication technologies and saliency into the helmet [7]. Researchers of the PLA Army College of Engineering in China proposed an object detection method through the combination of human visual salience and visual psychology to quickly and accurately detect military objects on a vast and complex battlefield [8]. As such, the saliency technology can be applied to HMD to complement the limitations of human vision and provide integrated battlefield information. However, since soldiers rely on batteries for power supply on the battlefield, a low power technology that maintains saliency is very necessary in mobile devices using batteries such as HMDs.
CURA [9], the most recently studied low power saliency study, is a mobile display low power technique that divides an image according to saliency and then uses a different display low power constant depending on the area. CURA uses JND (Just Noticeable Difference) to solve the problem of brightness difference caused by the low power technique applied differently for each divided area. When there is a difference in brightness in the area, CURA uses JND to adjust so that the user does not recognize the difference in area. However, if you look at the video provided by CURA, some artifacts, which are made by the difference in brightness between regions, can be seen even if JND is used.
In order to improve such a problem, this paper proposes a new low power method that utilizes a saliency model and an image segmentation algorithm that divides an image into multiple objects. To this end, our method combines two saliency processing levels: saliency level and pixel level synergistically. First, an image is divided into multiple regions with the same saliency level using the saliency model. Second, each saliency region is divided into subregions with the same pixel level using the segmentation algorithm. Then, a low power and high visual-quality pixel conversion is fulfilled using a well-known IQA (image quality assessment) index and gamma correction at all regions with the found both levels adaptively. As a result, our method can achieve low power and high human visual satisfaction and mitigate artifacts unlike CURA.
The rest of this paper is organized as follows. Section 2 describes related work such as saliency models, segmentation, and low power technology. In Section 3, the motivation and contributions are remarked. In Section 4, the proposed low power saliency method is described. In Section 5, the proposed low power method and existing methods are compared through experiments in the aspect of power saving and distortion. Finally, Section 6 concludes with a summary.

2. Related Work

2.1. Saliency Model

Various saliency models that calculate saliency using the relationship of current pixel values have been proposed, and the performance of this saliency model is compared through similarity with the FDM indicating the degree to which the gaze extracted from the eye tracker stays. Representative saliency models are Itti [2], CovSal [4], Judd [5], and WMAP [6]. The Itti model [2] is a representative saliency extraction model. Based on the detailed feature integration theory [3], the saliency is extracted by using the difference in color, brightness, and motion at the center and around. The Judd model [5] includes LabelMe Toolbox [10], Itti and Koch Saliency Toolbox [11], Felzenszwalb car and person detectors [12], Viola Jones Face detector [13], Steerable pyramids code [14], and five sub-models. In each model, saliency is extracted at the upper (face, human), middle (object), and lower (bright area) levels. Fernando’s WMAP (Weighted Maximum Phase Alignment) [5] extracts saliency by combining SIFT [15], which is not affected by image size and rotation among feature extraction models, and SURF [16], a SIFT performance improvement model. The CovSal model [4] extracts a saliency map from an image using a covariance descriptor that calculates nonlinear integration of features in the image.
The performance of the saliency model can be evaluated compared with FDM using evaluation matrices such as SIM, CC, NSS, AUC, IG, KL, and EMD [17]. Among them, SIM, CC, and NSS have a high correlation with human visual satisfaction. In this paper, since the CovSal model has higher SIM, CC, and NSS values than other models, we select it.

2.2. Mobile Display Low Power Method

As display power consumption increases in devices such as smartphones and HMDs that use limited batteries, a low power display technique is essential. As shown in Figure 1, the power consumption of mobile displays varies according to the values of R, G, and B channels [18]. Therefore, it is possible to increase the efficiency of the display low power technique by adjusting the low power technique according to color rather than simply reducing the pixel value of the entire image.
Anand et al. proposed PARVAI that saves power of the display while maintaining visual satisfaction by adjusting the value of the B channel with high power consumption using the difference in power consumption according to R, G, and B [19]. But the PARVAI method causes color distortion that can be observed with the naked eyes because the B-channel value is too low to save power [20]. Lin et al. proposed CURA, a low power technique that maintains visual satisfaction through different low power processing for each area divided into five areas using the Itti model. To maintain visual satisfaction, CURA tried to reduce distortion by considering JND between regions. However, in the video provided by CURA, artifacts, which are distortions caused by applying different low power techniques for each area, are observed clearly.
In this paper, the power savings of the low power technique are compared by calculating the mobile display power using the mobile display power model, Hong’s power model [21].

2.3. Segmentation

Image segmentation partitions an image into multiple segments or objects which are sets of pixels. In recent decades, a lot of image segmentation techniques have been researched. They are categorized into color-based segmentation, semantic segmentation, panoptic segmentation, panoramic segmentation, and so on. Color-based segmentation by using R, G, and B channels or their transformations has been widely studied due to its effectiveness [22]. With the advent of RGBD cameras, such as Kinect, color segmentation with the depth information has been studied. Especially, ACNet [23] considered that RGB and depth images contain unequal information as well as different context distributions. Including color-based and RGBD segmentation, abundant semantic segmentation approaches have been researched [24], which clusters parts of an image into the same object. Recently, deep neural networks (DNNs) are widely used for semantic segmentation. Meanwhile, a new kind of segmentation named panoptic segmentation [25] has emerged, which combines semantic segmentation and instance segmentation. Panoramic semantic segmentation targeting panoramic images, which have a large field of view (FoV), is also being researched [26]. This approach is expected to expand the visual range and provide the continuity of semantic information.
Meanwhile, in the aspect of application, image segmentation is geared towards applications on mobile devices, such as HMD devices, recently. Especially, in [27], pixel-wise semantic segmentation was employed to improve the mobility of visually impaired people. In [28], they suggested semantic labeling to improve navigation outcomes for prosthetic vision users. We believe that advanced segmentation techniques will be useful for people with impaired vision more and more.
In our work, we tackle employing color-based segmentation within the same saliency area since each segment consists of pixels with the similar pixel value, dealing with the unit of a segment can be power-efficient in the aspect of power management. Through various experiments, we selected the SLIC superpixel algorithm [29] to divide the objects efficiently, according to the pixel value, and reduce additional operations. The SLIC superpixel algorithm [29] is a method of classifying images according to color and position using the image and the number to be segmented. If the input number K and the total number of pixels in the image are N, the image is divided into square superpixels with a side length of S = N / K and the center of each square is designated as the search center. As for the color and space distance, which is the basis of the search, the center pixel and the Lab color space distance and the pixel distance are calculated, and Figure 2 shows an original image and the resultant image changed by the SLCI superpixel method.
Since mobile display power consumption varies according to R, G, and B values, a low power technique using the SLIC algorithm can be designed. However, if the SLIC algorithm is used in a segmented area using saliency directly, it is impossible to divide within saliencies because other areas are not excluded from its own search process. In this paper, to solve this problem, we propose a method of adjusting the initial search position in the SLIC algorithm in order to exclude pixels corresponding to other areas.

3. Motivation and Contributions

The saliency map calculated using the image pixel values can tell which area the human vision is concentrated. Therefore, there is a need for a study on an efficient method for a low power method that maintains visual satisfaction while dealing with the saliency map information efficiently. Looking at the example image as shown in Figure 3a, the simplest way to implement low power is to perform global dimming using a single gamma as shown in Figure 3b. However, since global dimming is a method that ignores saliency, visual satisfaction tends to be low. In addition, even if they have similar visual satisfaction, they have a low power-saving rate because the feature is not considered in the bright area. Figure 3c is a saliency-aware method for advanced low power and visual satisfaction like CURA. By applying different gammas according to the saliency, the visual satisfaction is high and the power saving rate is high. However, since the saliency-aware method applies a different gamma to each region, it is necessary to adjust the brightness difference between regions resulting from the difference in gamma.
CURA [9], a recently studied low power saliency-aware technique, proposed a saliency-aware low power technique using JND between regions. CURA divides the image into 5 areas using the Itti model [2] among the saliency models. When dividing the image, the number of pixels in each region is the same. Then, based on SSIM [30], different low power techniques are implemented in each area. It is claimed that JND solves the artifact problem occurring at the boundary of the regions due to different low power levels. However, as shown in Figure 4c, the difference in brightness due to the different gammas can be observed between the bat held by the man and the landscape clearly. This observation indicates that there is a limitation of using saliency only for low power and the fine-grained segmentation within a saliency region is highly required.
Thus, in this paper, we tackle proposing a low power mobile display technique that maintains high human visuality and high power saving by dividing an image into saliency regions and their objects through two-level image clustering. We also aim at mitigating artifacts which occurred in prior work. Specifically, we implemented (1) partitioning between saliencies using the CovSal saliency model and (2) partitioning within saliencies using the SLIC superpixel algorithm [29].
The contributions of this paper are summarized as follows:
  • We propose the first work combining a saliency level and a pixel level for better both low power and human visual satisfaction;
  • In order to determine a proper number of saliency clusters in the aspect of low power and computing overhead, we devise four new factors based on the CovSal saliency model;
  • In order to overcome the limitation that the SLIC superpixel algorithm cannot distinguish the areas divided in a saliency area, we devise a method of adjusting the initial search position in the SLIC algorithm in order to exclude pixels overlapping by other areas for better segmentation in each saliency area;
  • Compared to prior work, artifacts are suppressed efficiently by using a high-performance saliency model combined with pixel-level segmentation and a well-known image quality assessment index while achieving low power consumption.

4. Proposed Low Power Saliency Method

4.1. Overview of the Proposed Method

Figure 5 shows the overall flow of the proposed low power saliency method. First, our method finds the region of interest in the image using the CovSal saliency model and calculates the following four factors: (1) the sum of the pixel values in the CovSal saliency map; (2) the CovSal saliency map histogram gradient change rate; (3) the highest section pixel in the 10 sections of the CovSal saliency map; (4) the number of pixels with a pixel value of 0 in the CovSal Saliency Map. The image is divided based on these four factors.
Second, our method finds the row and column with color data in the CovSal saliency cluster divided based on the CovSal saliency. Next, it corrects the image by centering the pixel with the color value for the column and setting the pixel value to 0 for the rest of the column. Our method divides the image corrected in the previous step into a 50 × 50 square, and then sets the pixel with color data as the initial search position in the image whose pixel value is corrected at the center of the square. Then, since the image is segmented for the purpose of low power, pixels with zero brightness in the image are excluded because they do not affect the power. As a result, the image is divided into superpixels according to the CovSal saliency to implement two-stage division at the saliency level and the superpixel level.
Finally, SSIM, which is an image quality evaluation index, is set, and the SSIM index for the superpixel is set step by step by dividing it by a log scale in the target SSIM section using the brightness value of each superpixel divided in the CovSal saliency cluster. Then, based on the SSIM index set for each superpixel, the pixel value is compared to the image, and the converted low power coefficient is calculated for the pixel value implementing the target SSIM using a lookup table having the corresponding SSIM index. A low power image is implemented by adjusting the pixel value based on the superpixel using the previously calculated low power coefficient.

4.2. Clustering Based on the CovSal Saliency Model

In this paper, we use the CovSal model to discriminate saliency. This is because it has higher performance in the SIM, CC, and NSS evaluation matrices [17], which are highly correlated with human visual satisfaction, compared to the Itti model [2] used in CURA [9]. The CovSal model extracts the saliency map using the feature covariance calculated by changing the size of the patch by using the absolute value of the pixel Lab value, the pixel top-bottom, and left-right brightness difference as features. In the CovSal saliency map, values 0 to 255 are assigned for each pixel in Figure 6a as shown in Figure 6b.
Using CovSal, it is very important to determine the number of proper clusters in the saliency map. If the number is small, we will have little chance for low power. Otherwise, we will have big overheads to make the pixels of many saliency areas into low power ones. Thus, we devise a noble method to determine the number of clusters based on the CovSal model properly. For saliency-based image clustering using CovSal, the number of CovSal saliency clusters is determined by calculating the following four factors: (1) Sum of pixel values in the CovSal saliency map; (2) Gradient of the CovSal saliency map histogram; (3) The number of pixels in the highest section among 10 sections of the CovSal saliency map; (4) The number of pixels with a pixel value of 0 in the CovSal saliency map.
Among the four values, the number of pixels with a pixel value of 0 in the saliency map is applied as a factor that decreases the number of CovSal saliency clusters when the number is large. When there are multiple objects that attract attention in the CovSal saliency map, the movement of the gaze is frequent, and thus pixels with a pixel value of 0 are rare in the saliency map. If there are many pixels with a pixel value of 0 in the saliency map, there are few objects that attract attention, so the movement of the gaze is small. Since there is little gaze movement, a small number of CovSal saliency clusters is suitable. Specifically, in order to determine the number of clusters through a lot of experiments, we suggest that the number of pixels whose pixel value of the CovSal saliency map is 0 in the data set is divided by the resolution of the image and standardized. In our algorithm, if the number of pixels with a pixel value of 0 in the standardized CovSal saliency map is greater than the average in the Nemoto [1] data set, the number of clusters divided using the CovSal saliency map is reduced.
Conversely, the remaining three factors are applied so that they increase the number of saliency clustering when their values are large. That the sum of pixel values in the CovSal saliency map is large means that the gaze is not concentrated in one place, and there are several objects that attract the gaze, so gaze is concentrated across multiple areas. Since various objects exist in the image, the number of CovSal saliency clustering must be increased. In addition, in general, the histogram on the CovSal saliency map has a downward sloping shape. This is because there are few areas of the image that attract attention and are mostly backgrounds. Therefore, if there is an upward sloping shape instead of a downward sloping one in the histogram, this means that there are many objects that attract attention, so the number of CovSal saliency clustering should be increased. Finally, when the CovSal saliency map is divided into 10 sections, the last section becomes a section with a pixel value of 231 to 255. The large number of pixels with pixel values in this section means that the gaze is concentrated in several places; therefore, the number of CovSal saliency clustering should be increased. To determine a specific number of CovSal saliency clustering, the three factors are normalized when divided by the resolution and compared to the values in the data set. The number of CovSal saliency clustering increases when the value of the three factors in the image is larger than the average of the values of the three factors in the Nemoto [1] data set.
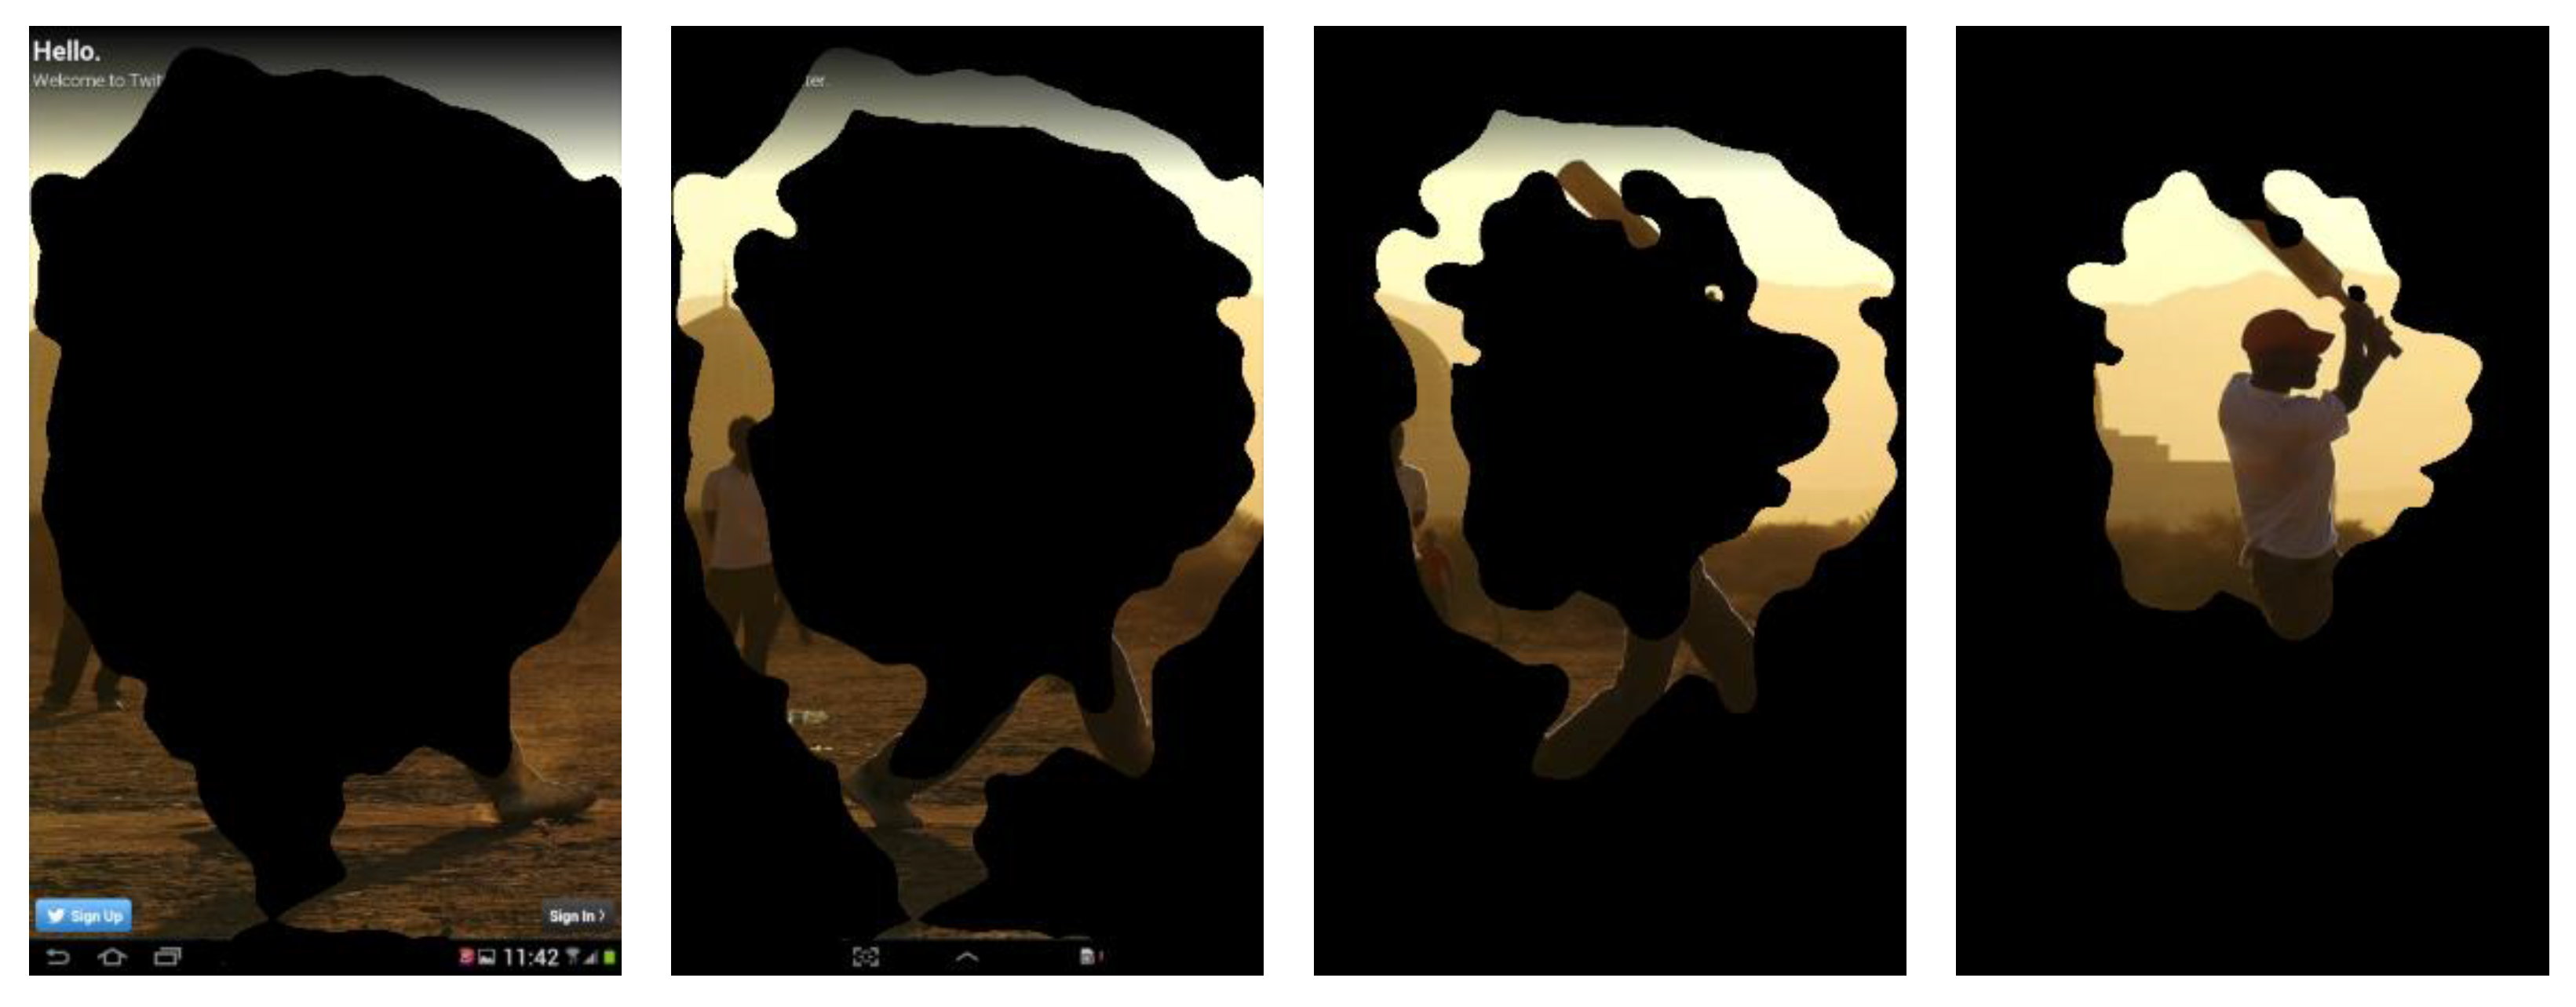
Using the four factors described above, CovSal saliency map clusters are divided into from 3 to 7 levels. In the CovSal saliency map, the number of pixels with a pixel value of 0 tends to be larger than that of pixels with a non-zero pixel value. Therefore, in CovSal saliency clustering, except for pixels with a pixel value of 0, the other clusters are adjusted so that the number of pixels in each cluster is similar. Figure 7 shows an image segmented by using the proposed CovSal saliency clustering method. It is divided into four clusters based on the four factors described above. The number of CovSal saliency clusters, which is the division criterion, is adjusted so that the number of pixels is similar for each divided cluster. Among the four images, the cluster has a higher saliency level from left to right. The leftmost cluster has more pixels than other clusters because saliency includes an area with a pixel value of 0.

4.3. SLIC Superpixel Segmentation

When SLIC [
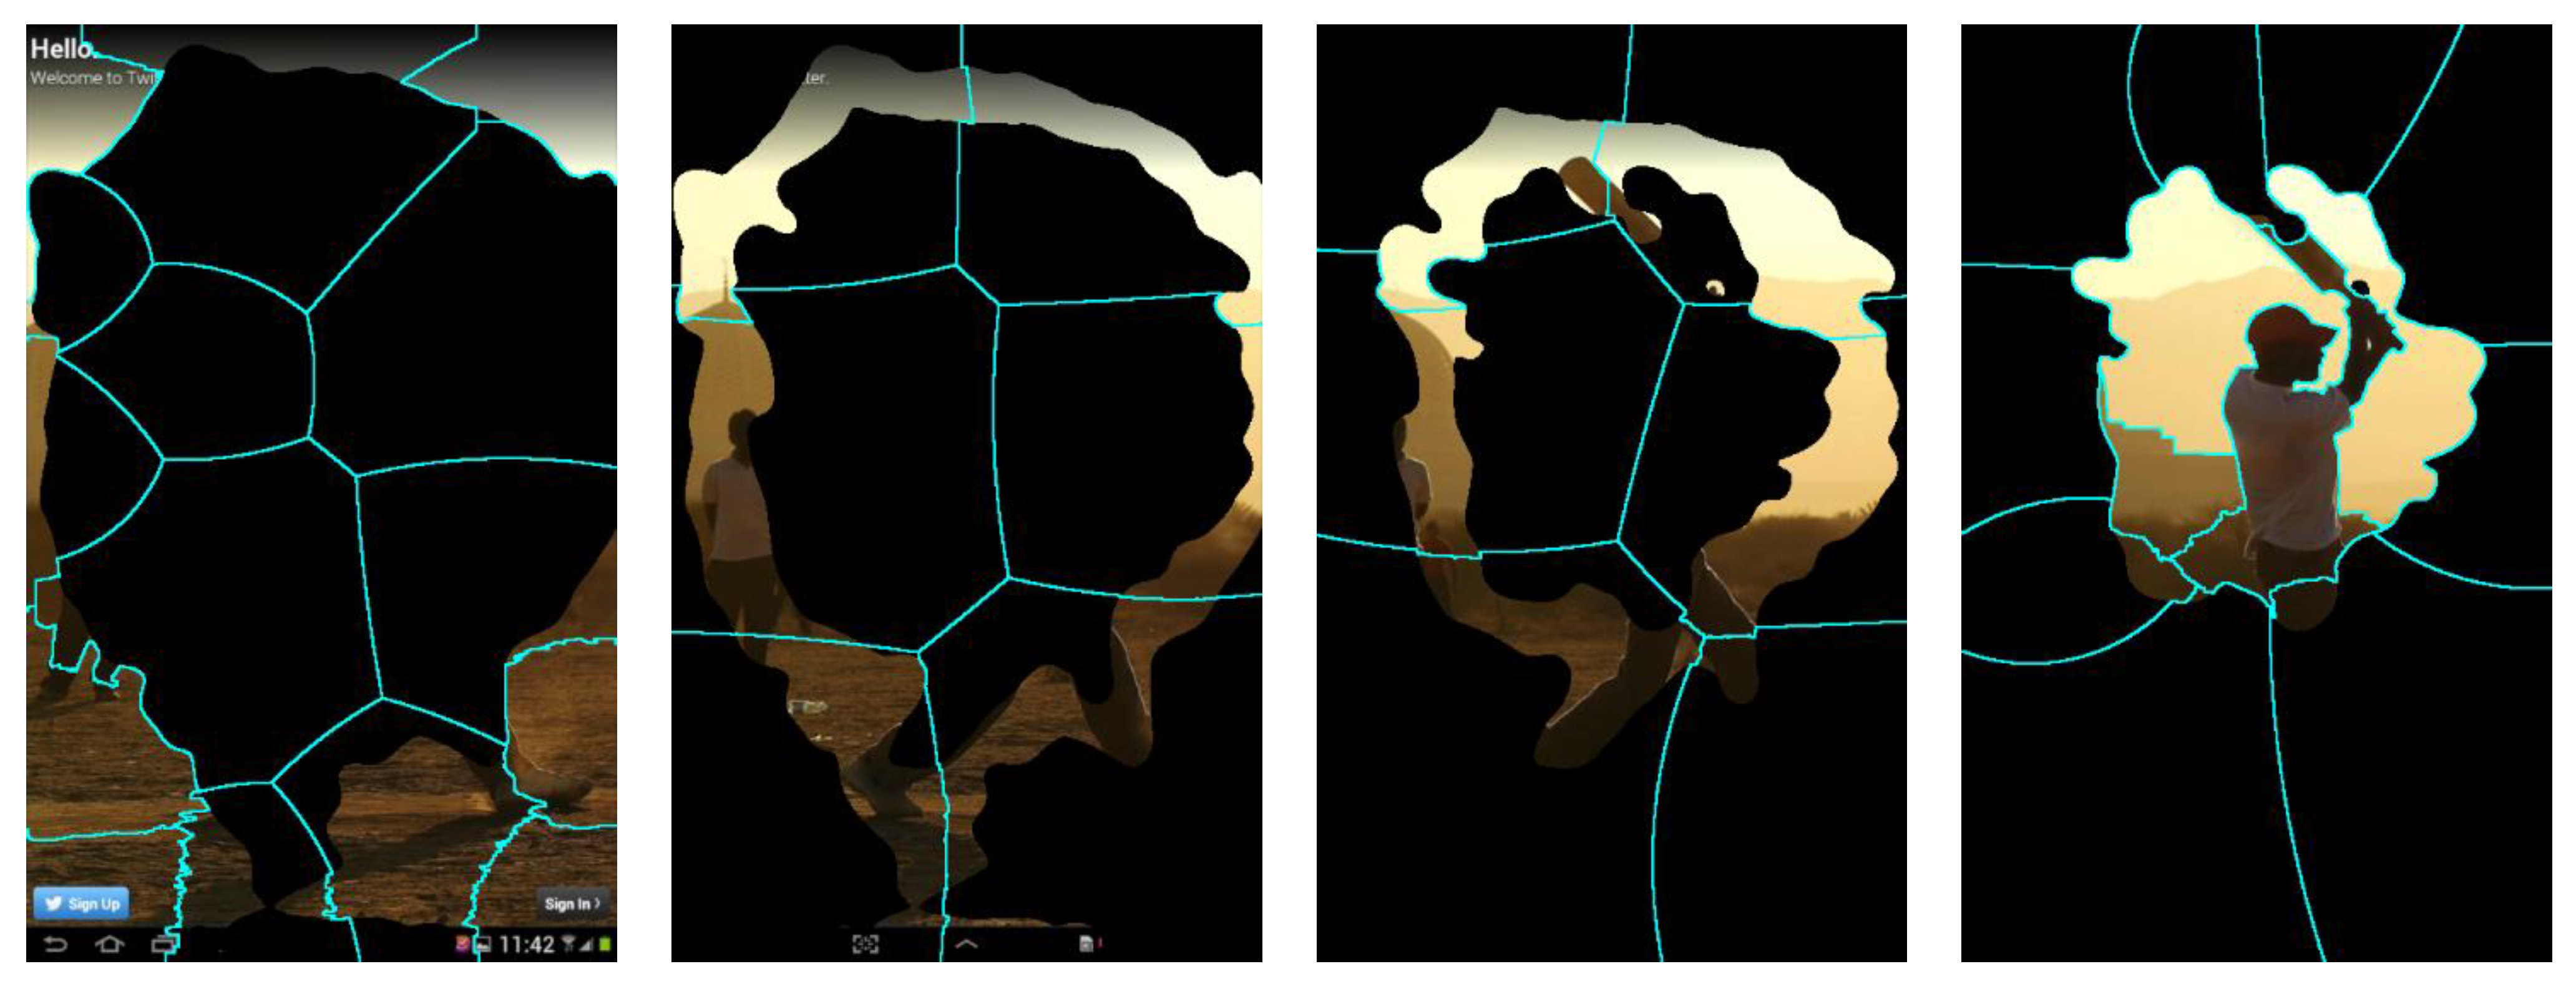
29] is performed in the region divided by CovSal, pixels of the region divided by each CovSal saliency cluster are not excluded from the search process of SLIC. This is because the pixels in the different CovSal saliency cluster are considered to be black pixels (i.e., pixels with a pixel value of 0) in the SLIC algorithm. In addition, the initial search position of the SLIC algorithm is centered on each square after dividing the image into squares by the number of inputs. Therefore, if the search center is a different saliency area, the pixels of the corresponding area may not be clustered. As can be seen from Figure 8, the original SLIC algorithm cannot be divided according to color in the saliency clusters divided by CovSal. Since the original SLIC superpixel algorithm does not recognize the area divided by CovSal saliency and divides the image based on color, the area divided into other clusters is recognized and divided as an area with a pixel value of 0 as shown in Figure 8. The first and fourth images are divided to some extent based on color because the image is concentrated at the border or center. However, in the second and third images, the saliency clusters of the pixels are formed in a ring shape, so the result of applying the SLIC superpixel cannot be divided according to the color, which means that each superpixel has different color pixels.
In order to overcome the limitations of the SLIC algorithm [29] in the CovSal saliency cluster, it is necessary to perform segmentation by separating pixels in each cluster from pixels with 0 values during the segmentation process. In addition, the initial search location should be set within the divided area through CovSal saliency clustering rather than in the entire image as is done by SLIC.
Table 1 is a CovSal clustering compression algorithm that removes regions without color values in the middle because they have different saliency levels. After finding the row and column with color data in each CovSal saliency cluster (lines 1–3), this algorithm finds the width of the row of the region with color values in the cluster and set it as the width of a compressed image which will be created. For each row of the region with color values, the number of columns of the region with color values is calculated and the maximum number of columns is set as the height of a compress image (lines 4–6). Since the number of columns of the region with color values is different for each row, it places the color value in the middle (lines 7–9) and fills the rest with 0 to create a compressed image of the CovSal saliency cluster, as shown in Figure 9.
Each image in Figure 9 is the result when the algorithm in Table 1 is applied to each one in Figure 7. Previously, Figure 8 shows that the original SLIC superpixel algorithm tries to segment according to color, but it fails to consider color in each CovSal saliency cluster. To overcome such problem, Figure 9 shows the result of correcting the image by applying the algorithm in Table 1 to improve the segmentation performance of the original SLIC superpixel algorithm. As a result of the correction, the image was divided into different regions, connecting the upper and lower pixels to the pixel with a pixel value of 0, forming an image as if it was pressed from the top. The fourth image is similar to that of Figure 7 because there are few areas divided into other areas in the middle of the image, but the other images have big differences from those of Figure 7.
Table 2 shows an algorithm for adjusting the initial search position in the process of segmenting an image using superpixels in a compressed CovSal cluster. First, with the CovSal cluster compression algorithm, the compressed image from which the pixels with different saliency levels are removed is divided into a 50 × 50 pixel square (lines 1–2). Based on the center of the square, the algorithm checks whether the area in the compressed image has no color value and sets the center as that of the search position (lines 3–9). From a low power point of view, pixels with zero brightness in the image are excluded from the superpixel search process because they do not consume power. Figure 10 shows the result of segmenting an image, according to saliency and color, using both the cluster compression algorithm applied to the clusters divided by CovSal and the initial position search algorithm for superpixels in each CovSal cluster. Unlike the existing SLIC superpixel algorithm [29], it can be seen that the image is divided according to color in the same cluster area divided by CovSal saliency.
Figure 10 shows the result of dividing the image according to color using the proposed superpixel algorithm for clusters separated by the CovSal saliency model. Compared with Figure 8, it can be seen that the segmentation performance according to color is improved. In particular, it can be seen that each cluster is well divided based on color compared to Figure 8 in the cluster areas divided according to the CovSal saliency model in the latter three images, which are divided into different areas and have a lot of pixels with the value 0. Now, it is possible to implement a low power technique in which applies different low power policies according to different colors within each cluster region while its saliency is maintained.

4.4. Low Power Image Generation

After dividing the image into CovSal saliency areas and then segmenting each saliency area into multiple superpixels based on color, different low power policies are implemented for each superpixel according to the saliency level, brightness, and average values of R, G, and B. For fair comparison with CURA [9], the image distortion degree by the low power technique is evaluated by the SSIM [30] index in the same way as CURA. Using multiple grayscale images, the SSIM indices are calculated to make up lookup tables according to the degree of pixel value change while their brightness changes. The lookup table is used to calculate a low power constant for gamma correction, which corresponds to the desired SSIM index. Since an image has different power consumption depending on the R, G, and B channel values, a low power constant is calculated in consideration of this. Especially, human vision is sensitive to changes in bright areas, and sensitivity decreases in a log scale as brightness decreases [31]. Therefore, the minimum and maximum SSIM values are set for the degree of distortion according to the number of saliency clusters and a required SSIM value is calculated in a log scale according to the saliency level. For R, G, and B channels, each required SSIM value are calculated in the same way and then each low power constant is calculated using the overall SSIM value and SSIM value per channel by reflecting the ratio of brightness of each channel over luminance.

5. Experiments and Result

5.1. Comparision of Low Power Methods

In order to compare the proposed method with existing low power methods, FSIMc [32] and Hong’s display power model [21] are used. FSIMc is an index which evaluates temporal satisfaction in black and white images, in color images [32]. It is an evaluation index created based on the characteristics that the human visual system mainly understands images according to low level characteristics. FSIMc can evaluate the degree of color distortion, which is not considered in SSIM. Hong’s power model [21] accurately calculates the display power by considering all three channels of R, G, and B and dependence between channels.
The global dimming method was implemented for mobile displays using the same pixel change ratio in all areas, and the saliency-aware method was implemented by applying different low power policies (that is, constants for gamma correction) over the saliency areas divided by using the CovSal saliency model. In order to compare the proposed method with the global dimming and saliency-aware methods, 15 images in Nemoto data set [1] were used and the image quality and power saving were calculated using FSIMc and Hong’s power model. As can be seen in Table 3, the proposed method achieves a bigger FSIMc index and a 3.2% higher power saving rate than global dimming. The reason for this difference is that brightness and saliency are different for each image area, but the global dimming method does not take this into account and implements low power by using the same pixel change ratio in all areas. Therefore, the global dimming method does not maintain saliency and has a lower power saving rate than the proposed method.
The saliency-aware method complemented the limitations of global dimming by applying different low power constants according to the saliency. However, even in the same saliency area, objects with different brightness and color exist. Since the saliency-aware method does not distinguish these objects, it has lower power saving rates and visual satisfaction than the proposed method. In Table 3, the saliency-aware method has a lower FSIMc index by 0.0103 and a 1.5% lower power saving rate than the proposed method. Also, since objects with different colors in the same saliency area are not considered, artifacts are observed due to the difference in brightness, as shown in Figure 11c.

5.2. Comparison with CURA

FSIMc and Hong’s power model are also used to compare the performance of the proposed method and CURA. The four test images were obtained from the video provided by CURA [9]. As shown in Figure 12, when we compared the images of the first column of CURA and the proposed method, we can notice that the contour of the man with a bat is clearer and the visual satisfaction of the proposed method is higher that of CURA. Also, CURA shows artifacts caused by brightness differences between the saliency regions while the proposed method does not. Similar observations can be found in the other images, which CURA and the proposed method are applied to.
In Table 4, the proposed method shows the same result with CURA in comparison with the SSIM index. But, for the FSIMc index, the proposed method shows a better result. This is because the proposed method employs different low power constants by reflecting the different effects of R, G, and B channels over the overall luminance of the display and FSIMc recognizes the color change. Also, the proposed method achieves a 2% higher power saving rate than CURA, since it uses superpixels to classify images according to color. We believe that the proposed method of the differences between saliencies and within saliencies has higher performance than CURA, while CURA considers the difference between the saliencies. Due to the limitation of the original SLIC algorithm, the proposed method cannot completely segment along the boundary of the object. If the superpixel performance of segmenting along the image boundary is improved, the proposed method is expected to have higher performance compared to CURA.

6. Conclusions

In this paper, we proposed a new segmentation-based saliency-aware low power approach by dividing images into saliencies using the CovSal saliency model and then dividing each saliency into superpixels using the SLIC superpixel algorithm. Through experiments, the proposed method shows bigger FSIMc indices and higher power saving rates than the global dimming and saliency-aware methods. Compared to CURA, the proposed method considers the image quality better by applying a technique that minimizes the distortion of the image quality and color change within the saliency areas. As a result, the proposed method shows better image quality, higher power saving rates, and no artifacts unlike CURA.
As future work, we plan to implement the proposed method in HMDs and tackle performance improvement in the aspect of a system. Especially, we will focus on improving the performance of SLIC superpixels. Also, we will consider using instance segmentation techniques such as YOLACT [33].

Author Contributions

Conceptualization, Y.-J.K.; Investigation, S.S., S.M.H., Y.-J.K.; Software, S.S., S.M.H.; Writing-original draft, S.S., S.M.H.; Visualization, S.S.; Supervision, Funding acquisition, Y.-J.K.; Writing-review & editing, Validation, Y.-J.K., J.S.P.; Project administration, J.S.P. All authors have read and agreed to the published version of the manuscript.

Funding

This work has been supported by the Future Combat System Network Technology Research Center program of Defense Acquisition Program Administration and Agency for Defense Development. (UD190033ED).

Conflicts of Interest

The authors declare no conflict of interest.

References

  1. Nemoto, H.; Korshunov, P.; Hanhart, P.; Ebrahimi, T. Visual attention in LDR and HDR images. In Proceedings of the 9th International Workshop on Video Processing and Quality Metrics for Consumer Electronics (VPQM), No. CONF, Chandler, AZ, USA, 5–6 February 2015. [Google Scholar]
  2. Itti, L.; Koch, C.; Niebur, E. A model of saliency-based visual attention for rapid scene analysis. IEEE Trans. Pattern Anal. Mach. Intell. 1998, 20, 1254–1259. [Google Scholar] [CrossRef] [Green Version]
  3. Treisman, M.A.; Gelade, G. A feature-integration theory of attention. Cogn. Psychol. 1980, 12, 97–136. [Google Scholar] [CrossRef]
  4. Oncel, T.; Porikli, F.; Meer, P. Region covariance: A fast descriptor for detection and classification. In European Conference on Computer Vision; Springer: Berlin/Heidelberg, Germany, 2006. [Google Scholar]
  5. Judd, T.M.; Ehinger, K.A.; Durand, F.; Torralba, A. Learning to predict where humans look. In Proceedings of the 2009 IEEE 12th International Conference on Computer Vision, Kyoto, Japan, 27 September–4 October 2009. [Google Scholar]
  6. López-García, F.; Fdez-Vidal, X.R.; Pardo, X.M.; Dosil, R. Scene recognition through visual attention and image features: A comparison between sift and surf approaches. In Object Recognit; Cao, T.P., Ed.; InTech: Rijeka, Croatia, 2011; Volume 4, pp. 185–196. [Google Scholar]
  7. Jalui, S.; Hait, T.; Hathi, T.; Ghosh, S. Military Helmet aided with Wireless Live Video Transmission, Sensor Integration and Augmented Reality Headset. In Proceedings of the 2019 IEEE International Conference on Communication and Electronics Systems (ICCES), Coimbatore, India, 17–19 July 2019. [Google Scholar]
  8. Hua, X.; Wang, X.; Wang, D.; Huang, J.; Hu, X. Military Object Real-Time Detection Technology Combined with Visual Salience and Psychology. Electronics 2017, 7, 216. [Google Scholar] [CrossRef] [Green Version]
  9. Lin, C.-H.; Kang, C.-K.; Hsiu, P.-C. CURA: A framework for quality-retaining power saving on mobile OLED displays. ACM Trans. Embed. Comput. Syst. (TECS) 2016, 15, 1–25. [Google Scholar] [CrossRef]
  10. Russell, B.C.; Torralba, A.; Murphy, K.P.; Freeman, W.T. LabelMe: A database and web-based tool for image annotation. Int. J. Comput. Vis. 2008, 77, 157–173. [Google Scholar] [CrossRef]
  11. Walther, D. Saliency Toolbox. Available online: http://www.saliencytoolbox.net/ (accessed on 2 March 2021).
  12. Felzenszwalb, P.F.; Girshick, R.B.; McAllester, D.; Ramanan, D. Object detection with discriminatively trained part-based models. IEEE Trans. Pattern Anal. Mach. Intell. 2009, 32, 1627–1645. [Google Scholar] [CrossRef] [PubMed] [Green Version]
  13. Paul, V.; Jones, M. Robust real-time object detection. Int. J. Comput. Vis. 2001, 4, 34–47. [Google Scholar]
  14. Simoncelli, E.P.; Freeman, W.T. The steerable pyramid: A flexible architecture for multi-scale derivative computation. In Proceedings of the 1995 IEEE International Conference on Image Processing, Washington, DC, USA, 23–26 October 1995; pp. 444–447. [Google Scholar]
  15. Lowe, D.G. Distinctive image features from scale-invariant keypoints. Int. J. Comput. Vis. 2004, 60, 91–110. [Google Scholar] [CrossRef]
  16. Herbert, B.; Tuytelaars, T.; Van Gool, L. Surf: Speeded up robust features. In European Conference on Computer Vision; Springer: Berlin/Heidelberg, Germany, 2006. [Google Scholar]
  17. Bylinskii, Z.; Judd, T.; Oliva, A.; Torralba, A.; Durand, F. What do different evaluation metrics tell us about saliency models? IEEE Trans. Pattern Anal. Mach. Intell. 2018, 41, 740–757. [Google Scholar] [CrossRef] [PubMed] [Green Version]
  18. Kim, C.; Hong, S.; Lee, K.; Kim, Y.-J. High-Accurate and Fast Power Model Based on Channel Dependency for Mobile AMOLED Displays. IEEE Access 2018, 6, 73380–73394. [Google Scholar] [CrossRef]
  19. Anand, B.; Kecen, L.; Ananda, A.L. PARVAI—HVS aware adaptive display power management for mobile games. In Proceedings of the 2014 IEEE Seventh International Conference on Mobile Computing and Ubiquitous Networking (ICMU), Singapore, 6–8 January 2014. [Google Scholar]
  20. Jin, J.-C.; Lee, J.-H.; Kim, E.-S.; Kim, Y.-J. OPT: Optimal human visual system-aware and power-saving color transformation for mobile AMOLED displays. Multimed. Tools Appl. 2018, 77, 16699–16720. [Google Scholar] [CrossRef]
  21. Hong, S.; Kim, S.-W.; Kim, Y.-J. 3 channel dependency-based power model for mobile AMOLED displays. In Proceedings of the 2017 IEEE 54th ACM/EDAC/IEEE Design Automation Conference (DAC), New York, NY, USA, 19–23 June 2017. [Google Scholar]
  22. Cheng, H.; Jiang, X.; Sun, Y.; Wang, J. Color image segmentation: Advances and prospects. Pattern Recognit. 2001, 34, 2259–2281. [Google Scholar] [CrossRef]
  23. Hu, X.; Yang, K.; Fei, L.; Wang, K. ACNET: Attention Based Network to Exploit Complementary Features for RGBD Semantic Segmentation. In Proceedings of the 2019 IEEE International Conference on Image Processing (ICIP), Taipei, Taiwan, 22–25 September 2019. [Google Scholar]
  24. Liu, X.; Deng, Z.; Yang, Y. Recent progress in semantic image segmentation. Artif. Intell. Rev. 2019, 52, 1089–1106. [Google Scholar] [CrossRef] [Green Version]
  25. Kirillov, A.; He, K.; Girshick, R.; Rother, C.; Dollár, P. Panoptic Segmentation. 2019. Available online: https://arxiv.org/abs/1801.00868 (accessed on 4 May 2021).
  26. Xu, Y.; Wang, K.; Yang, K.; Sun, D.; Fu, J. Semantic segmentation of panoramic images using a synthetic dataset. In Proceedings of the Artificial Intelligence and Machine Learning in Defense Applications. SPIE-Int. Soc. Opt. Eng. 2019, 11169, 111690B. [Google Scholar]
  27. Yang, K.; Bergasa, L.M.; Romera, E.; Cheng, R.; Chen, T.; Wang, K. Unifying terrain awareness through real-time semantic segmentation. In Proceedings of the 2018 IEEE Intelligent Vehicles Symposium (IV), Institute of Electrical and Electronics Engineers (IEEE), Changshu, China, 26–30 June 2018; pp. 1033–1038. [Google Scholar]
  28. Horne, L.; Alvarez, J.; McCarthy, C.; Salzmann, M.; Barnes, N. Semantic labeling for prosthetic vision. Comput. Vis. Image Underst. 2016, 149, 113–125. [Google Scholar] [CrossRef]
  29. Achanta, R.; Shaji, A.; Smith, K.; Lucchi, A.; Fua, P.; Süsstrunk, S. SLIC superpixels compared to state-of-the-art superpixel methods. IEEE Trans. Pattern Anal. Mach. Intell. 2012, 34, 2274–2282. [Google Scholar] [CrossRef] [PubMed] [Green Version]
  30. Wang, Z.; Bovik, A.C.; Sheikh, H.R.; Simoncelli, E.P. Image quality assessment: From error visibility to structural similarity. IEEE Trans. Image Process. 2004, 13, 600–612. [Google Scholar] [CrossRef] [PubMed] [Green Version]
  31. Gonzales, C.R.; Woods, R.E. Digital Image Processing, 3rd ed.; Pearson: Upper Saddle River, NJ, USA, 2008. [Google Scholar]
  32. Zhang, L.; Zhang, L.; Mou, X.; Zhang, D. FSIM: A feature similarity index for image quality assessment. IEEE Trans. Image Process. 2011, 20, 2378–2386. [Google Scholar] [CrossRef] [Green Version]
  33. Bolya, D.; Zhou, C.; Xiao, F.; Lee, Y.J. YOLACT: Real-Time Instance Segmentation. In Proceedings of the IEEE/CVF International Conference on Computer Vision (ICCV), Institute of Electrical and Electronics Engineers (IEEE), Seoul, Korea, 27 October–2 November 2019; pp. 9157–9166. [Google Scholar]
Figure 1. Display power consumption of a Galaxy S3 smartphone when a different single color is displayed on the screen: Red, Green, Blue, and White. R + G + B means the simple sum the power consumed when Red, Green, and Blue colors are displayed independently.
Electronics 10 01200 g001
Figure 2. SLIC superpixel method.
Electronics 10 01200 g002
Figure 3. Low power saliency methods. (a) Original image; (b) global dimming; (c) saliency-aware method; (d) proposed method.
Electronics 10 01200 g003
Figure 4. Comparison between an original image and its resultant image from CURA.
Electronics 10 01200 g004
Figure 5. Overall flow of the proposed method.
Electronics 10 01200 g005
Figure 6. Comparison between an original image and its CovSal model saliency map. (a) Original image. (b) CovSal saliency map.
Electronics 10 01200 g006
Figure 7. Example of the proposed CovSal saliency clustering method: 4 clusters.
Electronics 10 01200 g007
Figure 8. Superpixels of CovSal clusters.
Electronics 10 01200 g008
Figure 9. Compressed CovSal clusters.
Electronics 10 01200 g009
Figure 10. CovSal cluster divided by the proposed superpixel method based on color.
Electronics 10 01200 g010
Figure 11. Comparison of the existing methods and proposed one: (a) original image, (b) global dimming, (c) saliency aware dimming, (d) proposed method.
Electronics 10 01200 g011aElectronics 10 01200 g011b
Figure 12. Comparison of CURA and the proposed method: (a) original image, (b) CURA, (c) proposed method.
Electronics 10 01200 g012aElectronics 10 01200 g012b
Table 1. CovSal cluster compressing algorithm.
Input: I S (CovSal saliency cluster image)
Output: I c o m (Compressed CovSal cluster image)
1: r c ( i ) = row location of i th image color data row
2: C c ( i ,   j ) = location of (i, j) th image color data
3: r n ( i ) = number of i th row image color data column
4:FOR i = 1: number of r c
5:Start = max( r n ( i ) ) − r n ( i )
6:FOR j = 1: r n ( i )
7: I c o m ( r c , Start) = I S ( r c ( i ) , C c ( r c ( i ) , j))
8:END FOR
9:END FOR
Table 2. Initial position search algorithm for superpixels in a compressed CovSal image.
Input: I c o m (Compressed CovSal cluster image)
Output: C (Compressed image superpixel search center)
1: r n u m = (row of I c o m )/50
2: C n u m = (column of I c o m )/50
3:FOR i = 1: r n u m
4:FOR j = 1: C n u m
5:IF center of (i, j)th 50 × 50 square of I c o m ! = 0
6:C = center of (i, j)th 50 × 50 square of I c o m
7:END IF
8:END FOR
9:END FOR
Table 3. Comparison of power savings and FSIMc.
Global DimmingSaliency-AwareProposed Method
SSIM index0.950.940.95
FSIMc index0.98230.97230.9826
Power saving rate (%)38.7640.3341.90
Table 4. Comparison of image quality indices and power savings.
CURAProposed Method
SSIM index0.950.95
FSIMc index0.98120.9826
Power saving rate (%)39.4741.90
Publisher’s Note: MDPI stays neutral with regard to jurisdictional claims in published maps and institutional affiliations.

