Article

Combining Energy Management Indicators and Life Cycle Assessment Indicators to Promote Sustainability in a Paper Production Plant

by
Edwin Espinel Blanco
1,
Guillermo Valencia Ochoa
2,* and
Jorge Duarte Forero
2
1
Facultad de Ingeniería, Universidad Francisco de Paula Santander, Vía Acolsure, Sede el Algodonal Ocaña, Ocaña-Norte de Santander 546552, Colombia
2
Programa de Ingeniería Mecánica, Universidad del Atlántico, Carrera 30 Número 8-49, Puerto Colombia, Barranquilla 080007, Colombia
*
Author to whom correspondence should be addressed.
Resources 2020, 9(6), 75; https://doi.org/10.3390/resources9060075
Submission received: 27 March 2020 / Revised: 7 June 2020 / Accepted: 17 June 2020 / Published: 21 June 2020
(This article belongs to the Special Issue Energy Efficiency in Water Distribution and Supply Systems)

Abstract

:
This paper presents the application of an energy characterization method based on the ISO 50001 standard in a dry paper production plant. This plant operates using electricity, gas, and coal as energy sources. The last two energy sources are used to produce the steam and hot air used in the paper drying process. Through energy characterization, indicators such as energy baseline and consumption indicators were calculated for the plant, with which improvement opportunities were identified. These improvement opportunities were used as case studies for each energy source used and were based on the actual state of the plant. 2011 Midpoint+ ILCD method data was selected from the Ecoinvent database, using OpenLCA 1.7.0 for the energy assessment. The impact categories analyzed in this study were ecotoxicity, eutrophication of rivers and seas, climate change, and human toxicity. As a result of this work, it was found that energy-saving was possible by adjusting the production rate to a load factor of 77%, which implies a gas consumption of 1.6 kWh/kg and a value in the climate change category of 88.5 kg of CO2 equivalent. In addition, some technological improvement opportunities were economical and environmentally evaluated as a result of the sustainable improvement strategy implemented with energy management and life cycle assessment. The study of these technological opportunities showed that in order to achieve a sustainable industrial process, it is important to take into account energy, economic, and environmental criteria in the continuous improvement of the paper production process. In addition, it is of vital importance to analyze alternatives for technological change, which have a greater impact than operational alternatives according to energy, environmental and economic criteria.

1. Introduction

Since 1992, when the Rio Convention on Climate Change was held [1], the United Nations Industrial Development Organization (UNIDO) has recognized the need for an international standard in response to climate change since global energy consumption has been based on fossil fuels over the last century, which has increased 20 times [2]. On the other hand, the International Energy Agency projects a 25% increase in oil production between 2018 and 2050 due to world demand. This will trigger a proportional increase in the emissions of carbon dioxide from oil burning [3].
In 2011, the ISO 50001 standard was released and was presented as a method to support improvements in an organization’s energy use and energy efficiency to maintain and improve its energy management system [4]. Despite this, the increase in pollution and its effects are increasingly noticeable on the planet [5], which have led nations to create agreements such as those acquired in the Paris agreement [6], in which commitments of the subscribed nations were established. Long-term goals include keeping the average temperature increase below 2 °C from preindustrial levels and working towards an increase of only 1.5 °C. This, together with the development of the ISO 50001 technical standard, has led to an increase in research to improve energy management in organizations by applying this standard.
This international standard explains the minimum requirements needed to achieve efficient energy management in any organization under the principle of continuous improvement of energy management [7] and is based on the continuous improvement Plan–Do–Check–Act system to incorporate energy management in the daily practices of an organization [8]. The ISO 50001 standard requires the complement of other families of ISO 50001 standards, which were published in later years. These standards complement and indicate how an integrated energy management system should be carried out appropriately in each of the stages, and their possible integration with other tools such as environmental impact assessments [9].
Therefore, a series of investigations that have focused on the implementation of the standard has been generated. In 2013 [10], a methodology based on flowcharts and software called the ISO 50001 analyzer was described [11], which was used to facilitate the development of an energy management system to support compliance. This software also guides energy management consultants to better understand the requirements of the standard [12].
On the other hand, a study of the state-of-the-art and perspective of the energy management systems in Italian industries was carried out. The study demonstrated that although Italy is one of the leading countries in energy policy, it lags behind German industries. In addition, it was shown that the definition of energy performance indicators and the construction of a baseline and a monitoring plan are fundamental for compliance with the standard [13].
Life cycle assessment (LCA) provides an alternative assessment method to analyze the environmental impacts attributed to a product. In this method, the process is analyzed from the collection of the raw material, through the entire production process, up to the final use and disposal of the product [14]. This analysis can be applied to different types of processes such as welding [15], the agricultural process [16], generation systems [17], and the treatment of materials [18], among other processes. An example of the application in LCAs is a study carried out on the use of granular material for road applications, which evaluates the ecotoxicity, the toxicity generated in this process, and quantifies the release of water and its impact on the surrounding environment [19]. Similarly, an LCA was applied to a portable refrigerator, which went from using mains electricity to being a solar-thermal portable refrigerator. The costs of the equipment using the electrical grid as a power source were USD1790, spending 21.5% on materials, 6.1% on manufacturing, 0.3% on transportation, and 72.1% on consumption. Contrast this to the thermoelectric device, where its costs amounted to $573, distributed as 78.4% on materials, 21.3% on manufacturing, 0.3% on transportation, and 0% on use [20].
In Colombia, an analysis of the energy and carbon footprint for a bamboo board manufacturing process showed that their combination is completely possible and helps derive relevant indicators for the organization that undergoes this process, which is a starting point for the subsequent application of these standards [21]. Similarly, LCAs have been carried out on energy-consuming products in companies using the Input–Output LCA. In this work, it was found that energy use was environmentally significant for all equipment. Moreover, the Input–Output LCA approach is easier to implement when life cycle costs are linked to environmental impacts [22]. Similarly, this environmental analysis using LCAs was also applied to paper production processes, in which materials, energy, and emissions were compared for the manufacture of Tissue paper from virgin pulp and recycled pulp. It was found that these two processes are major contributors in the following impact categories: human toxicity, climate change, human health and ecosystems, and fossil fuel depletion [23]. Likewise, in Iran, an environmental impact assessment of a paper production plant was carried out. For this, one metric ton was used as the functional unit, and the CML2 Baseline2000 was used as the solution method. Abiotic depletion, acidification, eutrophication, global warming, ozone layer depletion, human toxicity, freshwater aquatic ecotoxicity, marine aquatic ecotoxicity, terrestrial ecotoxicity, and photochemical oxidation were used as categories to be analyzed. Obtained as a result, the use of bagasse and electricity contributed the least impact value because both inputs used renewable sources [24].
Taking into account that the work reviewed above focuses on LCAs independent of energy management. Moreover, that is the only case in which this integration of energy management with environmental analysis through LCAs was presented, and it was in a manufacturing process of bamboo tables. The main contribution of this document is to present the integration of an energy management indicator based on ISO 50001 and an environmental impact assessment using an LCA for a dry paper production plant. The study will focus on the energy improvement opportunities found in the characterization process to promote sustainability in industrial processes. This work is developed from a methodological section in which the tools used and the fundamental equations involved in the development of this document are detailed. Subsequently, the results of the application of this methodology are presented together with the analysis of the mimes. Finally, the conclusions reached with this work are shown.

2. Methodology

To have a clear understanding of the methods used to carry out this research, this section provides a description of the process being analyzed, the energy analysis approach used to establish the scenarios studied, and the LCA method applied in this process.

2.1. Description and Information about the Process

The LCA was applied to a paper manufacturing process for a plant in the Colombian Caribbean. This section presents the plant’s production process, together with the distribution of energy in it, using a map, which allows the areas or equipment and the destination of the energy to be known. This map is shown in Figure 1.
This production process starts with the raw material (1), which is mainly recycled paper and cardboard. This raw material passes through the pulping machine (2), which through the application of water and an agitator, driven by an electric motor, leaves the raw material ready for the cleaning process (3), which, through a chemical process, is cleaned and discolored. Then, it goes to the refiner (4), where the desired thickness of the raw material is given to the sheet, to finally arrive at the drying machine (5), which confirms the paper sheets, which are delivered as a final product in rolls (6).

2.2. Energy Management

Figure 2 presents the methodology applied to the paper production process for the detection of energy improvement opportunities based on the change in the operational variables present in the process [25]. A brief description of the phases by which the selection of improvement opportunities in the production process is presented. The initial phase is the collection of data on production and energy consumption data between January and October 2018. These data were subjected to a filtration process, in which the days in which the plant was not in typical production were discarded.
Subsequently, a selection of significant energy uses and a selection of operational variables that have a major impact on energy consumption were made. An energy baseline was also generated, to which a base period must be fixed. For this, a minimum number of data was determined from the samples and was calculated using Equation (1).
n 0 = z 2 × C V 2 e 2
where z is the standard normal distribution value for a given confidence level, e is the desired level of accuracy, and CV is the coefficient of variance, which is obtained by Equation (2).
C V = σ x  
where x is the sample mean value, and σ is the standard deviation, which is the weighting of the dispersion for the ratio and interval variable [26]. This measure of dispersion is calculated by Equation (3).
σ = i = 1 n ( x i x ) 2 ( n 1 )
Having the minimum number of data, the baseline model was calculated, as shown the Equation (4).
E =   E o + m × P
where E is the energy consumption, P is the equipment or plant production, Eo is the energy demanded by the plant not associated with the production.
This mathematical model will be used as a fundamental model for the energy performance indicators calculation, which allows the finding of days when the production process behaved in an energy-efficient way. This day allows us to review the values of the operational variables on those days to replicate these operations and achieve prolonged energy savings, and in this way, find the opportunities for energy savings.
Therefore, the energy performance indicator studied was the consumption index (IC) to show the energy consumption (E) variation as a function of production (P), as shown in Equation (5), where if the sample works in areas of low consumption index, medium index, or areas of high consumption index is presented.
IC = E P
Besides, it reveals the influence of the load factor of the production line or equipment on the energy consumption per unit produced. To obtain this index, as shown in Equation (6), the energy consumption given by the baseline (Equation (4)) is divided by the production.
IC   =   m + E o P
A graphical representation of the index consumption indicator is presented in Figure 3, where three operational zones can be observed, and in this way, it is possible to identify in which of these the sample is found. Figure 3 shows a decreasing exponential behavior of the consumption index as a function of the production increment, and the value at which the asymptote starts to appear is known as the critical production rate. This rate is the minimum production value required to obtain a time-invariant consumption index.
By studying the consumption rate, it is possible to identify the operational area where the consumption rate is highest, which implies low production with high consumption of the energy study and therefore increases the potential environmental impacts. Thus, the adequate selection of the plant’s production level will allow, in addition to an increase in productivity, greater efficiency in the process, an increase in economic savings, and a decrease in negative impacts on the environment in the different categories studied.
As a result of this energy–environmental study, some actions for improvement are generated in the short term by increasing competitiveness based on the application of good practices. Good practices are considered as an optimized way of making paper production in this case, which has been identified based on the joint experience of plant personnel and energy experts.
Therefore, these measures on how best to develop, operate, and maintain production systems make it possible to achieve greater energy efficiency since the implementation of good practices is related to changes in procedures and associated training, where economic investments tend to be minimal, making them suitable for rapid implementation.

2.3. Economic Evaluation

An important factor for the implementation of energy improvement projects is economic viability. This viability can be calculated using indicators such as net present value (NPV), internal rate of return (IRR), or the capital recovery period. The NPV and IRR were used to calculate the economic viability of the proposed alternatives, and the respective formulas are shown in Equations (7) and (8).
N P V = I + i = 1 n Q i ( 1 + T I ) i
where I is the initial investment, Q the calculated cash flow or profit, n the number of years, and TI the interest rate.
N P V = I + i = 1 n Q i ( 1 + I R R ) i
where IRR is cleared by equating the NPV to zero.

2.4. Life Cycle Analysis

Life cycle analysis is defined as a set of interrelated and sequential stages of a system, starting with the acquisition of the raw material and ending with its final disposal.

2.4.1. Goal and Scope

With this in mind, an LCA focuses on recognizing that any decision has an influence on every event in the cycle, and this impacts the economy, society, and the environment. Therefore, with the LCA, opportunities and risks of any product, technology, or change in the process are identified [27,28].
To carry out a life cycle analysis, one must start by defining the objectives and scope, which must be clearly defined and consistent with the motivation of the analysis. The scope must be compatible with the objectives and must be technically and economically viable [29]. Figure 4 presents the scope of the analysis proposed in this paper.
This scope is defined, taking into account the physical limitations of the energy study carried out. On the other hand, the time limit will be projected to 20 years of paper production; all data obtained are for this time limit. Likewise, everything concerning natural resources, their exploitation, resource distribution, transformation, and second distribution was taken into account. The sum of this makes up a door-to-door study. For this reason, this document did not take into account the effects of client distribution, use, end of life, and decommissioning of the production plant.

2.4.2. Inventory Analysis

The data used for the analysis are from January to October 2018 in a paper manufacturing plant, which is in the same period as the energy assessment. This guarantees correct results for the base case of the life cycle analysis [30]. If the dry paper production process is considered as a generic system, with n inputs of raw materials and energy, and n outputs of products and wastes, the overall environmental load balance will be determined by Equation (9). The solution of the complete system allows a specified knowledge of the origin of the contamination that is attributed to each product of the plant [31].
i = 1 n MI i × v m , MI i + i = 1 n EI i × v e , EI i i = 1 n W i × v e , W i = i = 1 n P i × v e , P i
where MI i is the mass inputs, EI i are the energy inputs, P i are the outlet stream related to products and products, W i is the residues, and v m , e is the mass and energy ecovectors of the streams.
For this case study, each input stream of the system studied has a related ecovector, and its content must be allocated among the output streams of the process. The balance of each one of the elements of the ecovector must be closed in such a way that the total amount of contaminant at the process outlet must be equal to the amount of contaminant of the input streams plus the generation in the same process [32].
Therefore, the inventory or environmental load balance of the dry paper process is developed in an analogous way to the material balance. The process is divided into subsystems, as showed in Figure 1, and in each one of them, the system equations that allow the calculation of the ecovectors of the output or intermediate currents are proposed and solved. Thus, the quantities of each raw material needed for the production of dry paper are calculated. A functional unit of 1 kg of dry paper produced was selected.
The life cycle inventory was also developed in the operational condition, where potential energy-savings were identified. Thus, the values used to calculate the potential environmental impacts for each of the case studies are presented in Table 1.

2.4.3. Environmental Impact Assessment

The environmental impact assessment consists of three elements, which are fundamental for the correct application of the methodology, and thus, high-quality results in the process. The first is selection, which impacts the categories, category indicators, and characterization models chosen. In second place is the classification of life analysis impacts. Finally, there is characterization, which includes the calculation of the results of category indicators [33].
For selection and classification, the impact categories that can be assigned must be known. These categories are classes that represent the environmental consequences derived from the production processes selected for the life cycle analysis. There are several impact categories, of which this paper will analyze ecotoxicity, eutrophication of rivers and seas, climate change, and human toxicity [34].
On the other hand, characterization involves passing the results of the life cycle impact common units and adding up all the impacts in the same category. All the categories of environmental impacts are characterized by multiplying the emission or consumption by a characterizing factor; thus, converting the environmental units to the unit of the selected indicator. The unit of the indicator is selected, taking the most representative category as a basis, and the characterization factor is used to pass the rest of the categories to the selected unit. Taking into account the above, the analysis was carried out using the ILCD 2011 Midpoint+ method through openLCA 1.7.0.

2.5. Energy and Environmental Integration

Considering the objective of the evaluation of environmental impacts using the methodology of analysis of life cycle with the standard ISO 14001 [27], this is oriented to implant systems of environmental management that allow the industries to reduce the impacts on the environment. The objective of a system of energy management using the standard ISO 50001 [35] is the improvement of the energy performance of the organization; both are based on a system of continuous improvement with very aligned results that can be united, as shown in Figure 5.
It is noted that the analysis of the life cycle in each of its stages through the ISO 14001 standard is aimed at enabling organizations to assess and improve their environmental impact without establishing a methodology to control energy performance [36]. Therefore, the evaluation of the capacity of the organizations to manage energy resources, energy use and environmental impact, allows the identification of energy-environmental saving opportunities integrated to the energy management standard, which allows the planning, implementing, evaluating and reviewing of an energy management system with environmental performance indicators. These indicators allow the measurements of the results of operational and technological change improvement actions from an energy and environmental point of view, planned and followed-up through a continuous improvement process.
Since the ISO 50001 energy management standard and the ISO standard both use the ISO management system model of continuous improvement and these are designed to be compatible with the management system standards [37], the proposal raised in this document allows the use of the same tools and techniques for common activities, such as document management, audit planning, corrective measures, and energy–environmental improvement opportunities and management, in general.
Thus, the energy and environmental evaluation of the system will allow the improvement of the management of resources and time in operational decision-making because it reduces the time of administration of the standard, which can be dedicated to identify and take advantage of the opportunities of energy-saving and reduction of the environmental impact of the system, in each one of the stages of the life cycle. In addition, this proposal allows for easier planning of management activities and indicator monitors, which promote the faster implementation of energy efficiency and environmental conservation measures.

3. Results and Discussion

3.1. Energy Management

The paper production plant that was subjected to this analysis has three energetics that feeds the power of the process. Table 2 shows these three energetics and the percentage of use in each one of them. The coal used in the process is destined for the steam generation required in the paper-drying machine. Likewise, the gas used in the production process is used to back-up the boiler for the process, in addition to the drying chamber, which, together with the steam, is responsible for the paper-drying process. The high consumption of these two energy sources for the drying machine, together with the consumption of electricity by the Yankee drying motor, makes this equipment the most suitable for energy analysis.
The results show that in this process, when moving to a high production level (70% of maximum capacity), the percentage contribution of electricity increases by 1.3% concerning the base production condition (62% of maximum capacity), while the contribution of coal and natural gas drops by 0.65%, respectively. These results are due to the increase in energy consumed by electric motors in the dry paper plant, which is taken directly from the network since the burners and boilers are always operating at the same load regardless of the level of production. In cases where the operational regime of the production plant was reduced (55% of the maximum capacity), the energy taken from the network decreases, and therefore the predominant energy sources are gas and coal, registering increases of 2.38 concerning the base operation condition.
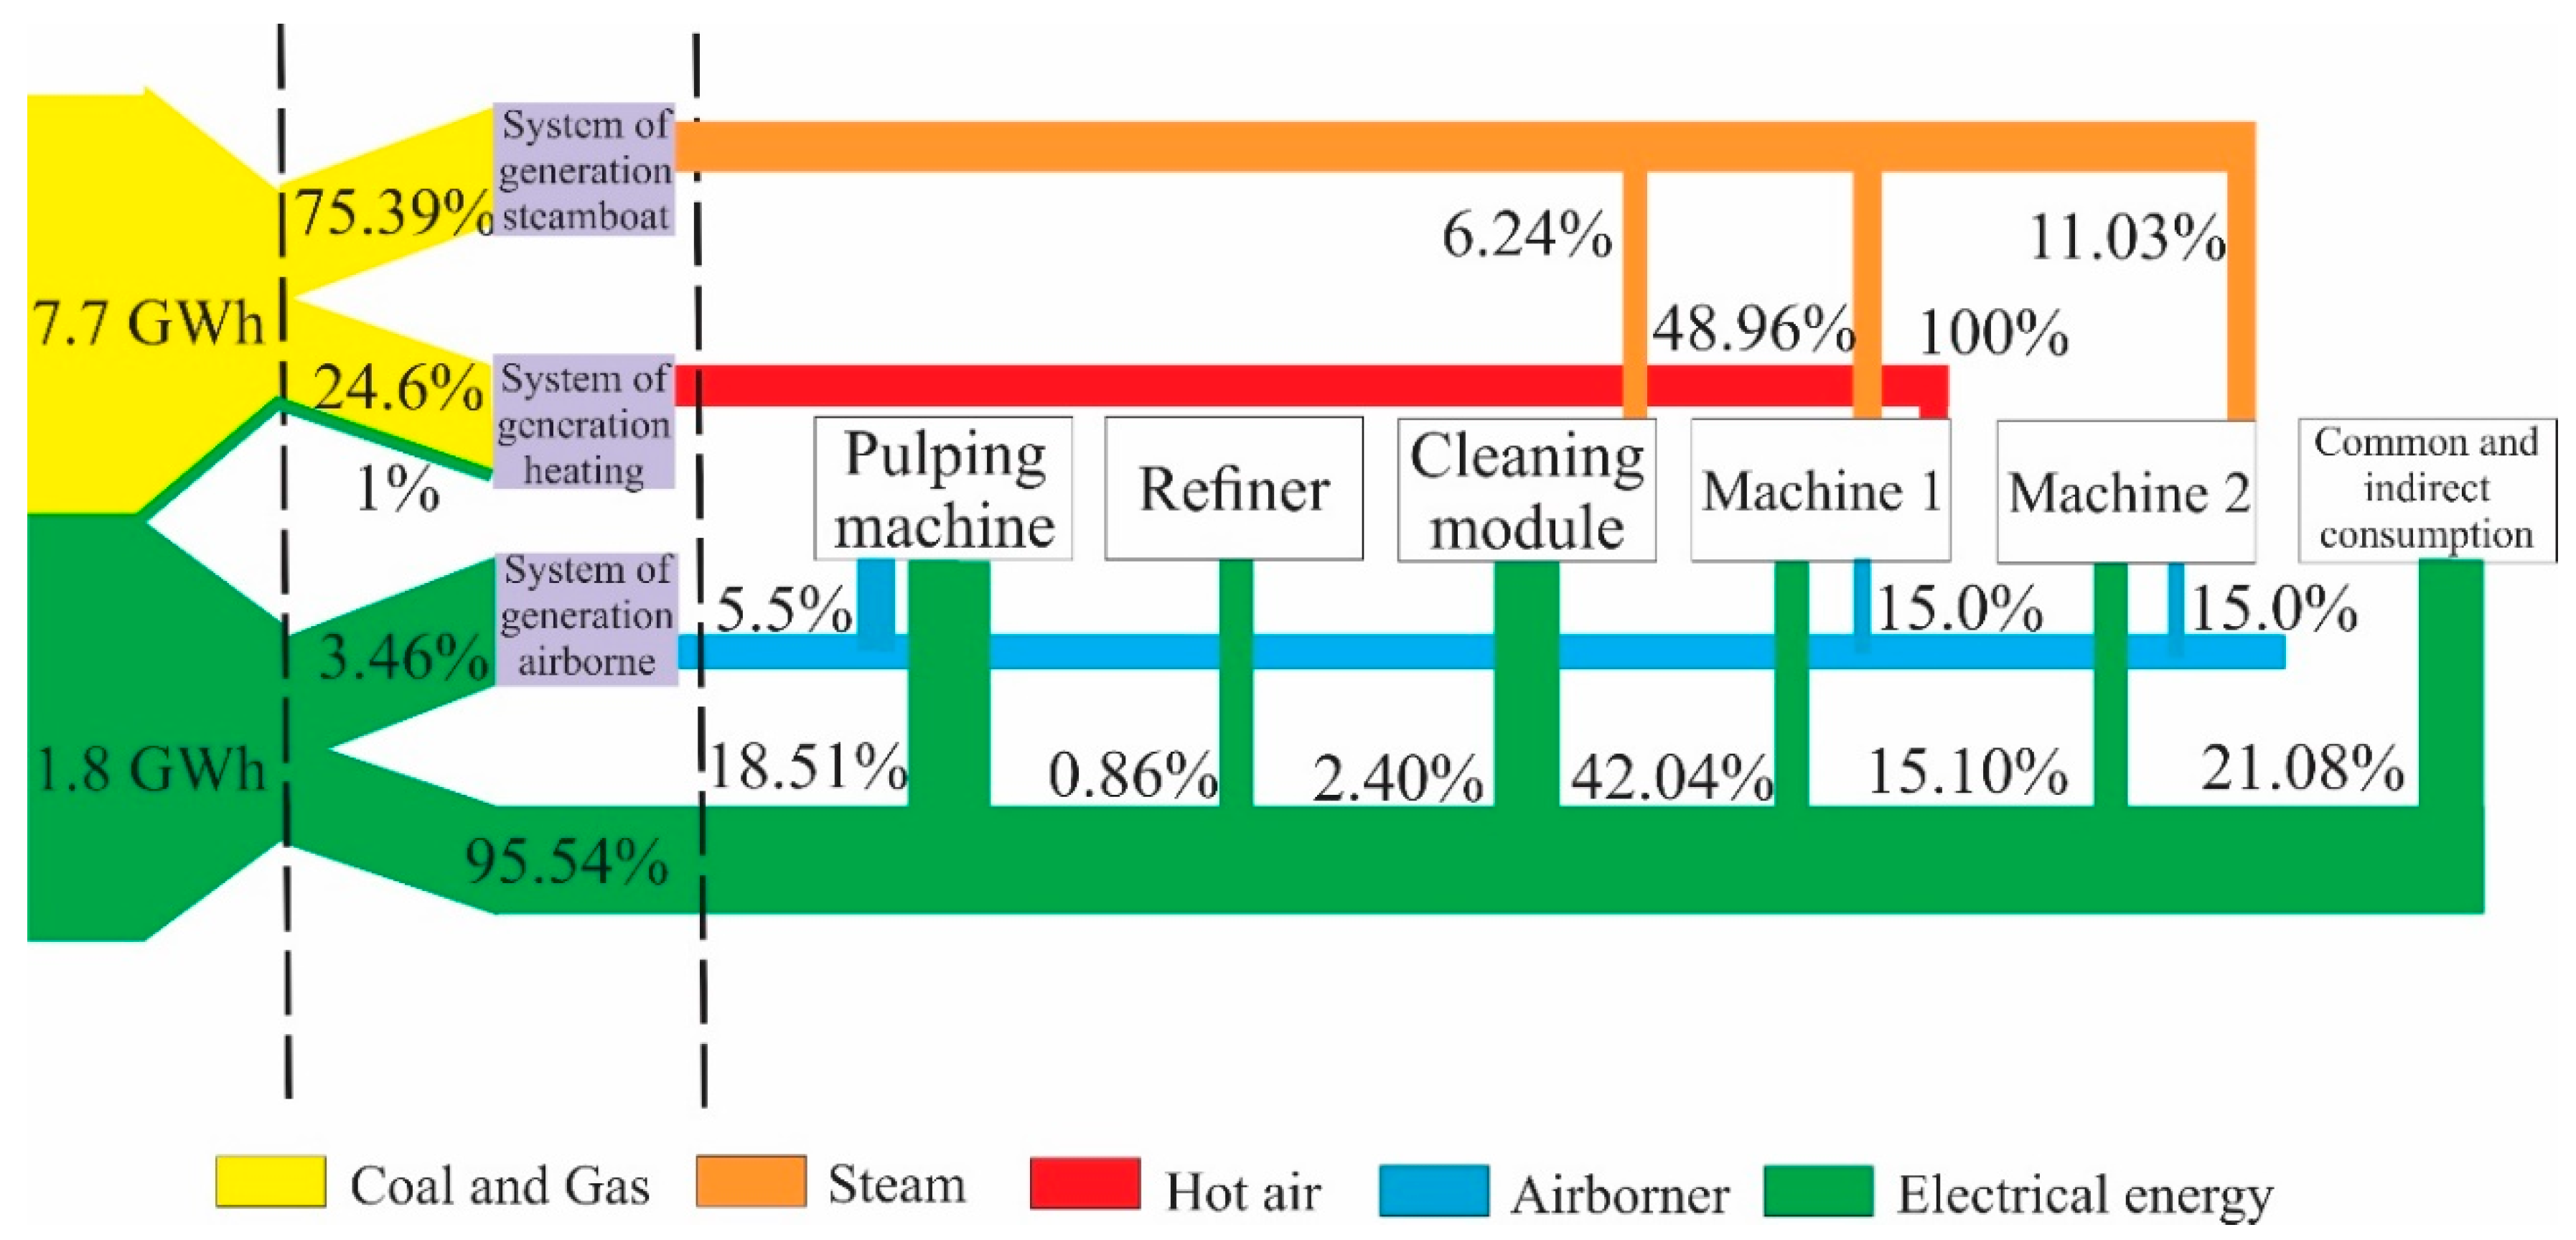
The contribution made by these three energy sources to each of the subprocesses can be determined by the measurement installed in the main equipment of the plant. 
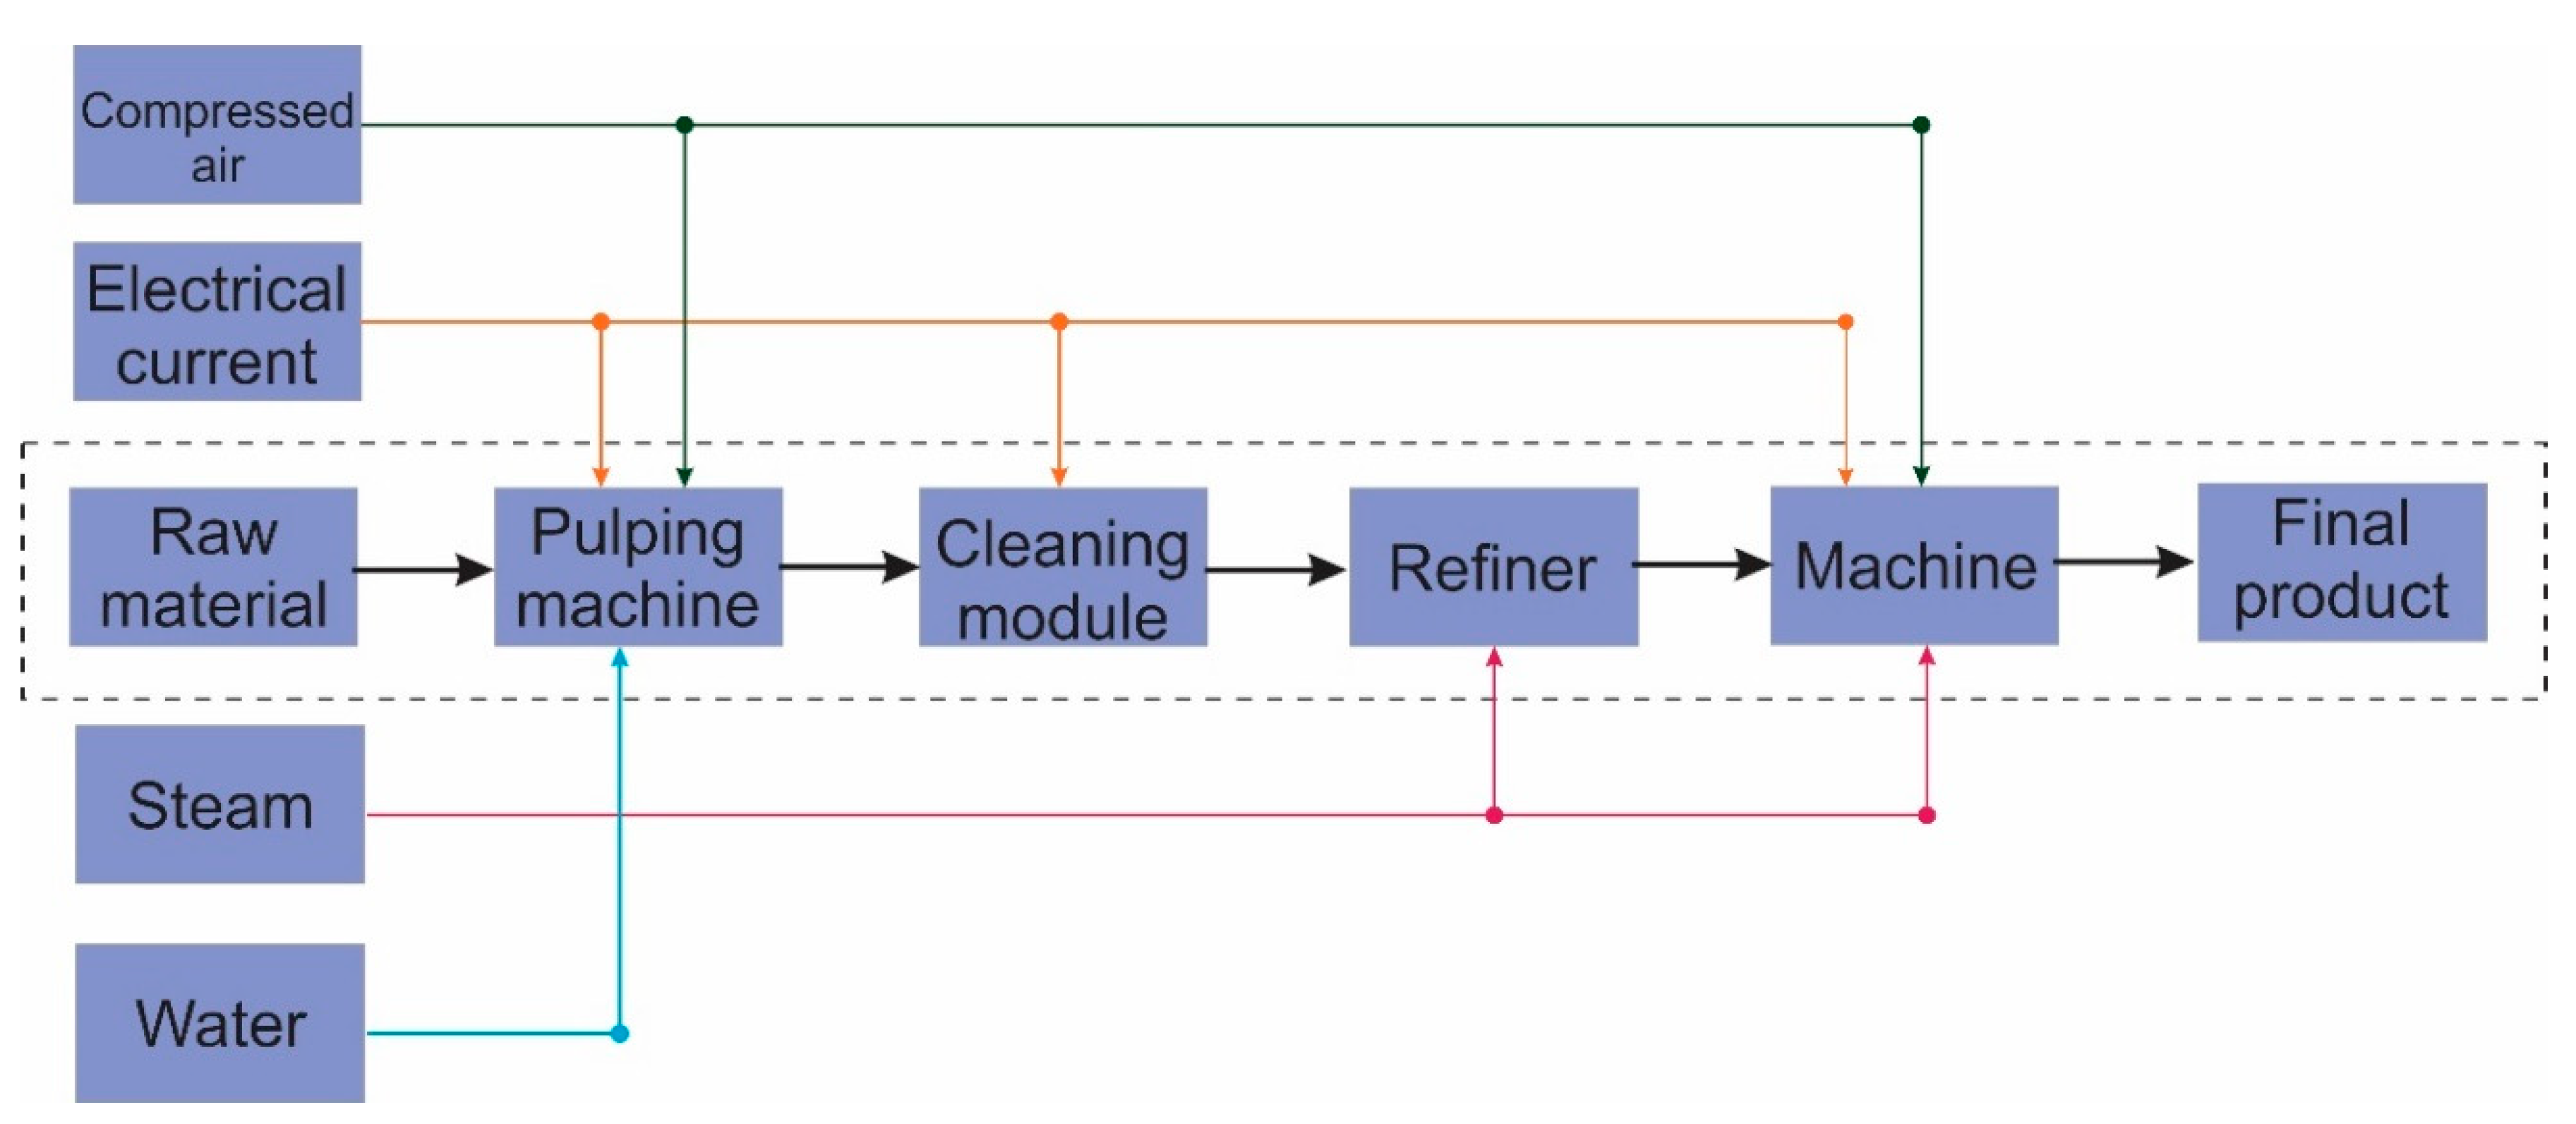
Figure 6 shows the result of the analysis of the percentage distribution and the path along the process of the energetics. In addition, the production process is presented in a clearer way, where it is important to highlight the high energy consumption of Machine 1, which is responsible for making the soft paper produced by the factory.
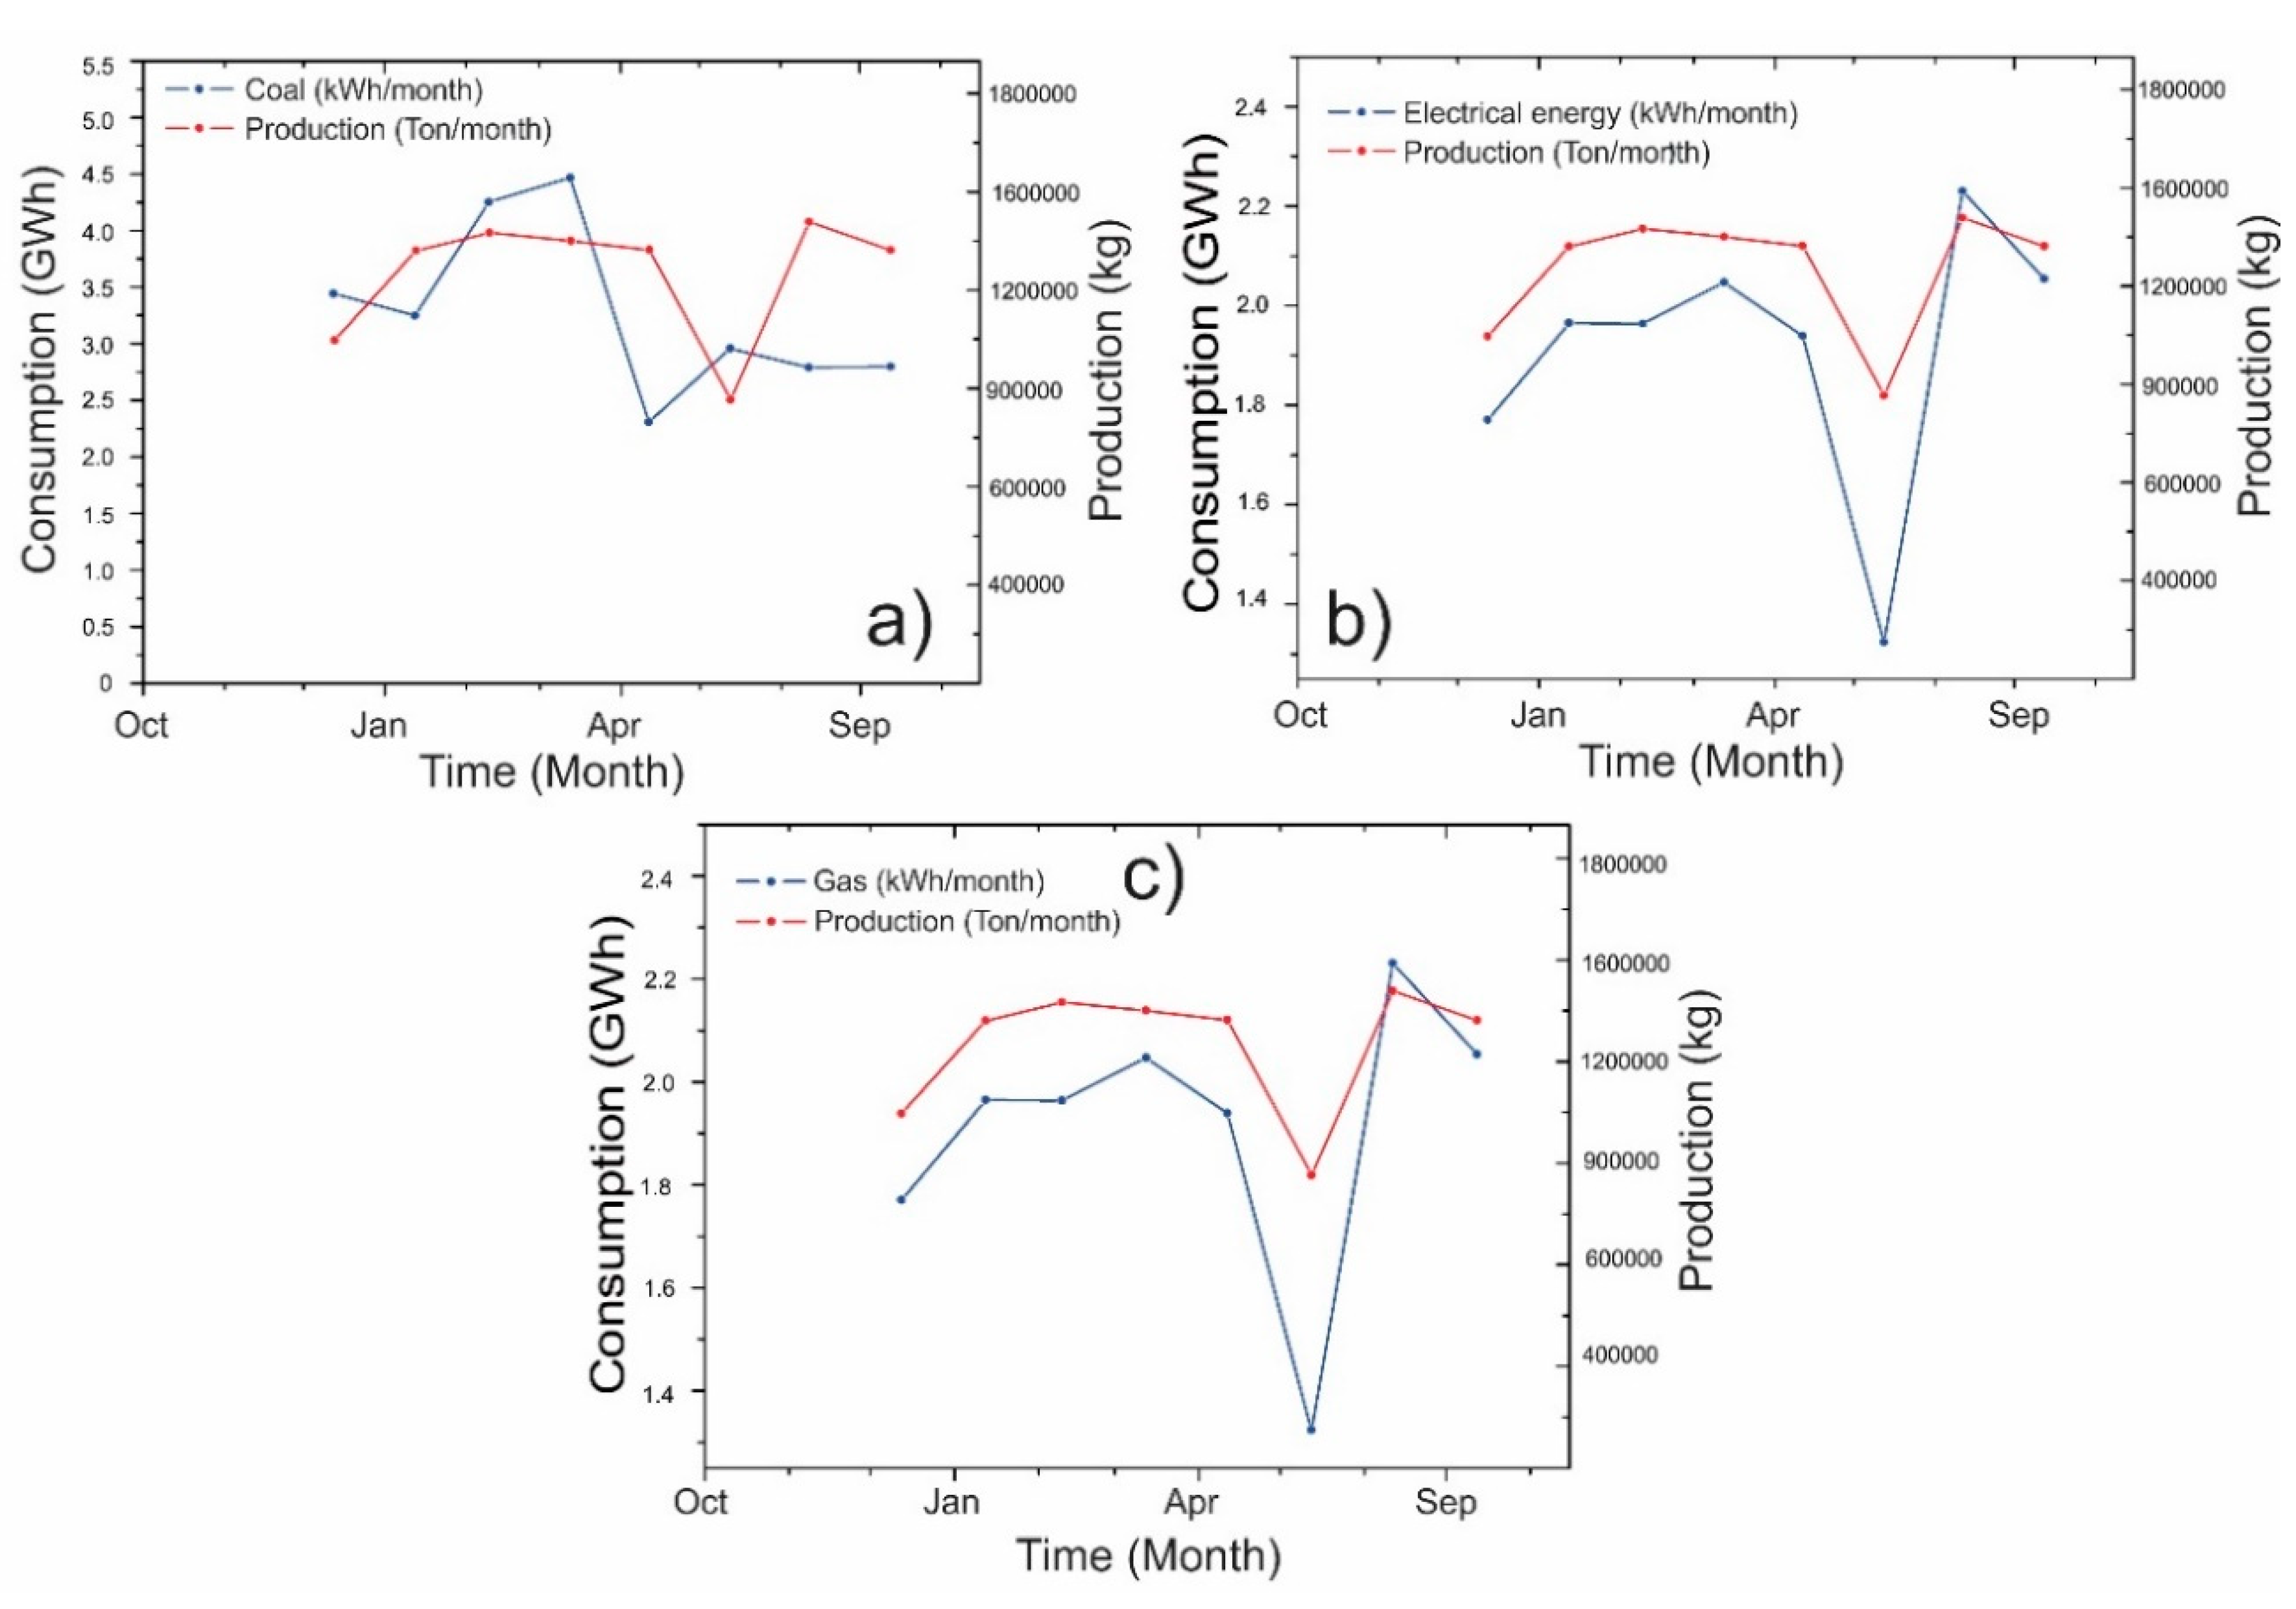
The relationship between energy consumption and monthly production is analyzed with historical data on the production and consumption of electrical energy present in the production plant. Using this information, a graph was made, showing the variation in consumption and production over time. Figure 7b shows a clear correlation between electricity production and consumption. This is because the variation in consumption is generated by changes in operations that directly affect the power demanded by production equipment.
In the same way, Figure 7c shows a similar behavior of the gas when varying the production. It presents a good behavior, unlike the one presented in Figure 7a, in which the consumption of coal presents a different behavior to the production, showing that these variations of consumption are not associated with production but are possibly outside the optimal parameters.
Based on Machine 1 being a significant energy consumer in the plant, the baselines for electricity, gas, and coal consumption were calculated, allowing us to calculate the energy performance indicators considered for the diagnosis of the current process behavior. The grade of association between the comparative movements of the different energy sources and the dry production rate is evidenced in the correlation coefficient of the proposed baseline: for electricity consumption (Figure 8a) with a correlation coefficient of 0.7586; for coal (Figure 8b) with 0.6539, which is a consequence of the low variation of the coal rate supplied to the steam boiler; for the gas consumption (Figure 8c), which reached a coefficient of 0.8169. These results show the simultaneous use of energy from the network, the steam boiler in the drying process from coal, and the process of heating the air using the natural gas burner, whose consumption is regulated to the different operating regimes.
In the case of the electric energy consumption indicator presented in 
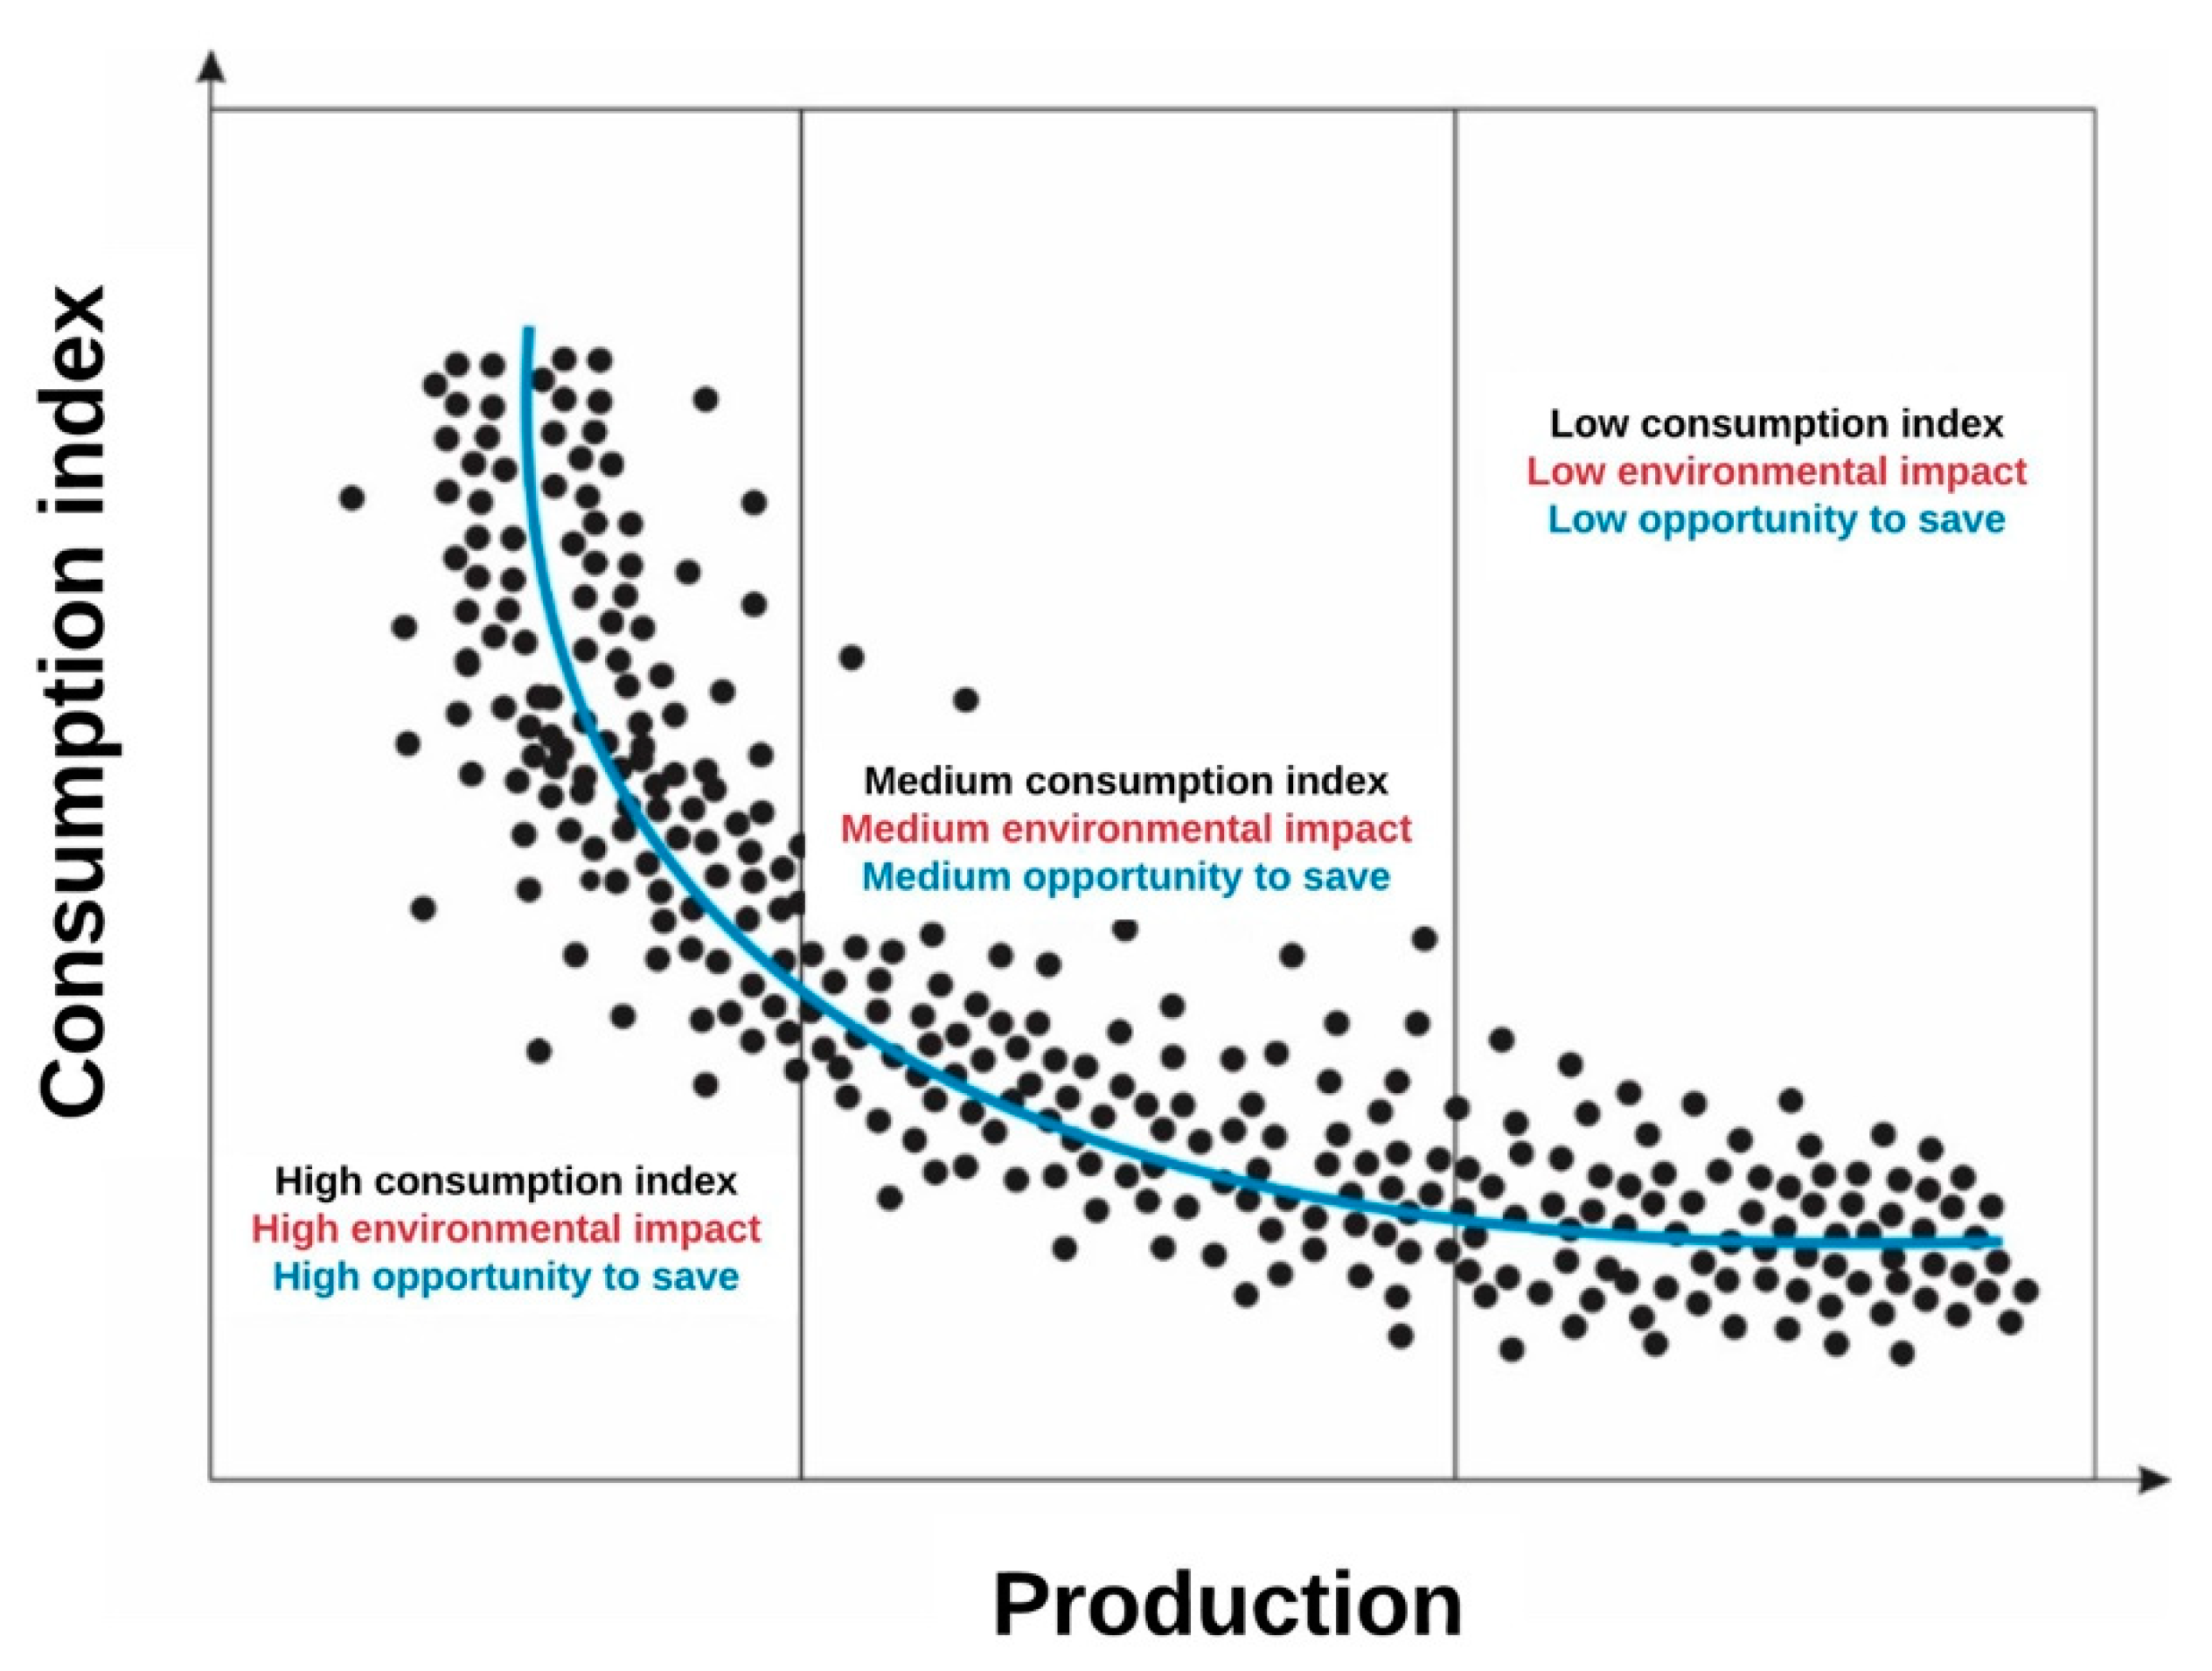
Figure 8d, the consumption index graph for electric energy is presented, where it is possible to identify the critical point of production for a consumption index of 0.9854 kWh/kg, with a load factor of 77.27%, which is above the average load factor that only reaches 65.61%, showing a wide range of opportunities for improvement that can be obtained by reducing the time lost in production and improving production planning.
On the other hand, Figure 8e shows the consumption rate graph for coal, where the index can be seen to be slightly more dispersed than the electrical energy index, which shows that gas consumption is not adequately controlled according to the production rate. In addition, it was possible to identify that 1.6 kWh/kg is the index corresponding to the critical point of production in which low indexes are reached; with a production equivalent to 77.26% of the machine load factor, this point is reached. Therefore, the plan should be moved to produce dry paper at a new rate, and possibly increase the final processed product inventory that allows the plant to serve the market more effectively by incurring better times and better quality of service. Likewise, Figure 8f shows the behavior of the consumption index for gas, which reaches its critical point at a production of the same value as the previous trend graphs, showing similar behavior.
These three opportunities for savings were found by calculating the critical consumption rates for each of the energy sources. These savings were consolidated in a matrix presented in Table 3. This includes the area in which these savings are presented, the equipment in which these savings occur, the savings measure adopted, the percentage of savings in the plant, the equipment, and the amount of monthly energy saved.

3.2. Life Cycle Environmental Analysis

For the environmental impact assessment, the 2011 ILCD Midpoint+ V1.10 method was used. This method was applied for the base case, and all three cases derived from the results of the energy assessment. Moreover, the three saving opportunities found will be the case studies used for the life cycle analysis, in which the ecotoxicity of rivers, terrestrial and aquatic eutrophication, climate change, and human toxicity will be the categories analyzed. 
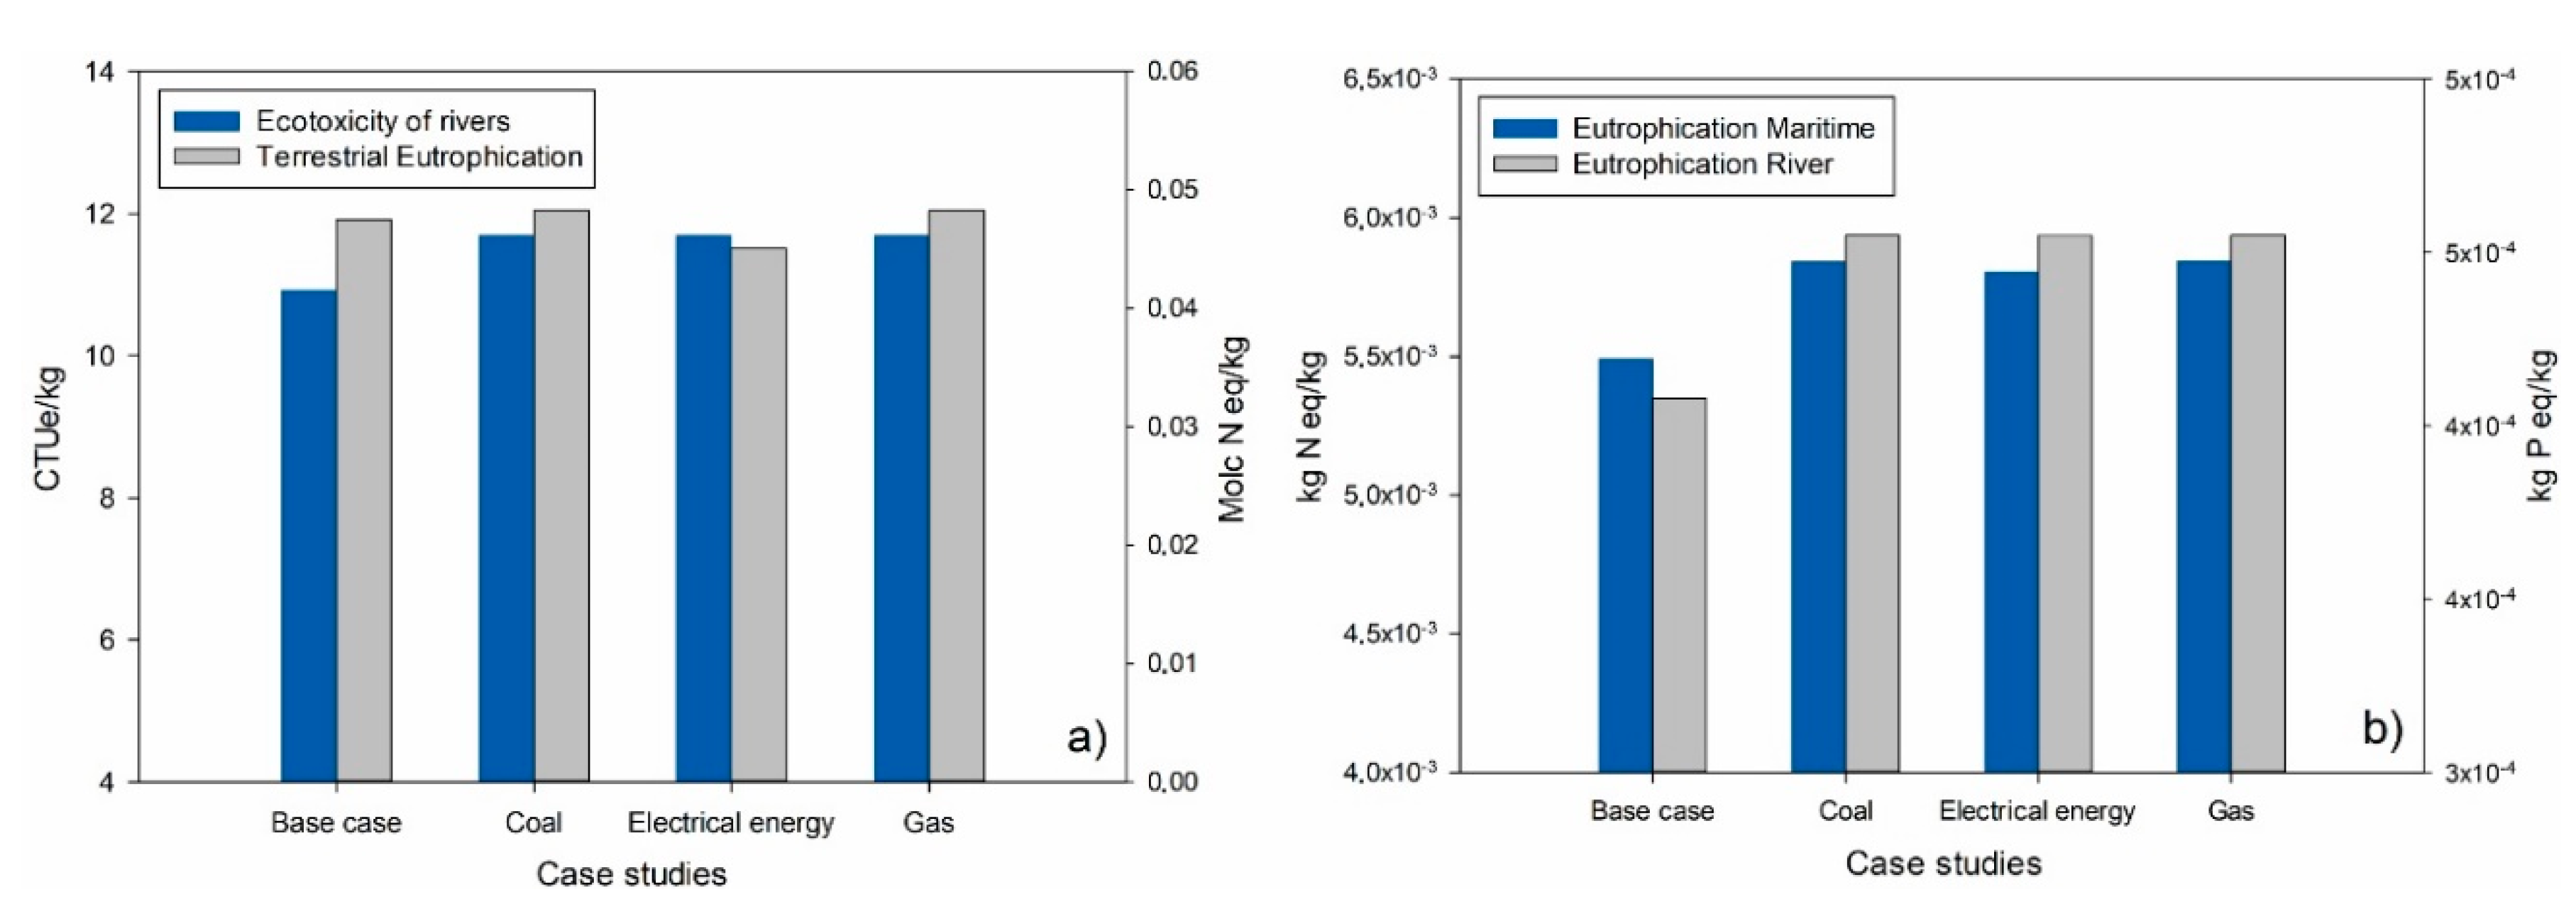
Figure 9a shows the ecotoxicity of rivers, which is measured in CTUe, the comparative toxic unit for ecosystems.
For the base case, the ecotoxicity per kg produced was 10.93 CUTe. For the other three study cases, a very similar increase was presented, with differences of no more than 5% between the base case and the other three cases. This similarity in the increase is because the ecotoxicity is due to industrial organic waste and, taking that into account for all three cases, the increase of the processed raw material was the same. Therefore, the industrial wastes are proportional to the three case studies, and the way to reduce this is to design new alternatives to recycle the waste of the plant [38] or a proposed solution based on the circular economy approach [39] to promote sustainability in industrial processes, which attend to the energy and environmental criteria [40].
The eutrophication of the land is also presented in Figure 9a. This impact category represents the phenomenon that occurs due to an increase in nutrients in the ground, which causes excessive plant growth and organizes it by triggering decay. The land eutrophication is measured in moles of nitrogen equivalent, which is decreased by the measurement of electric energy saving. This is due to the decrease in emissions caused by the low demand for electricity, which is generated by thermoelectrics.
Similarly, the eutrophication of the water was measured. Figure 9b shows the results for both marine and river eutrophication. As for marine eutrophication, it is measured in kg of nitrogen equivalent, and as with land eutrophication, the smallest increase in impact is in the case of electrical energy, reaching 0.045 kg of nitrogen equivalent. This value means an increase of 5.5%. On the other hand, for river eutrophication, it is measured in kg of phosphorus equivalent, and unlike the two previous cases, the increase was the same for the three case studies. It went from 4.078 × 10⁻⁴ kg of phosphorus equivalent to a value of 4.54 × 10⁻⁴ kg of phosphorus equivalent.
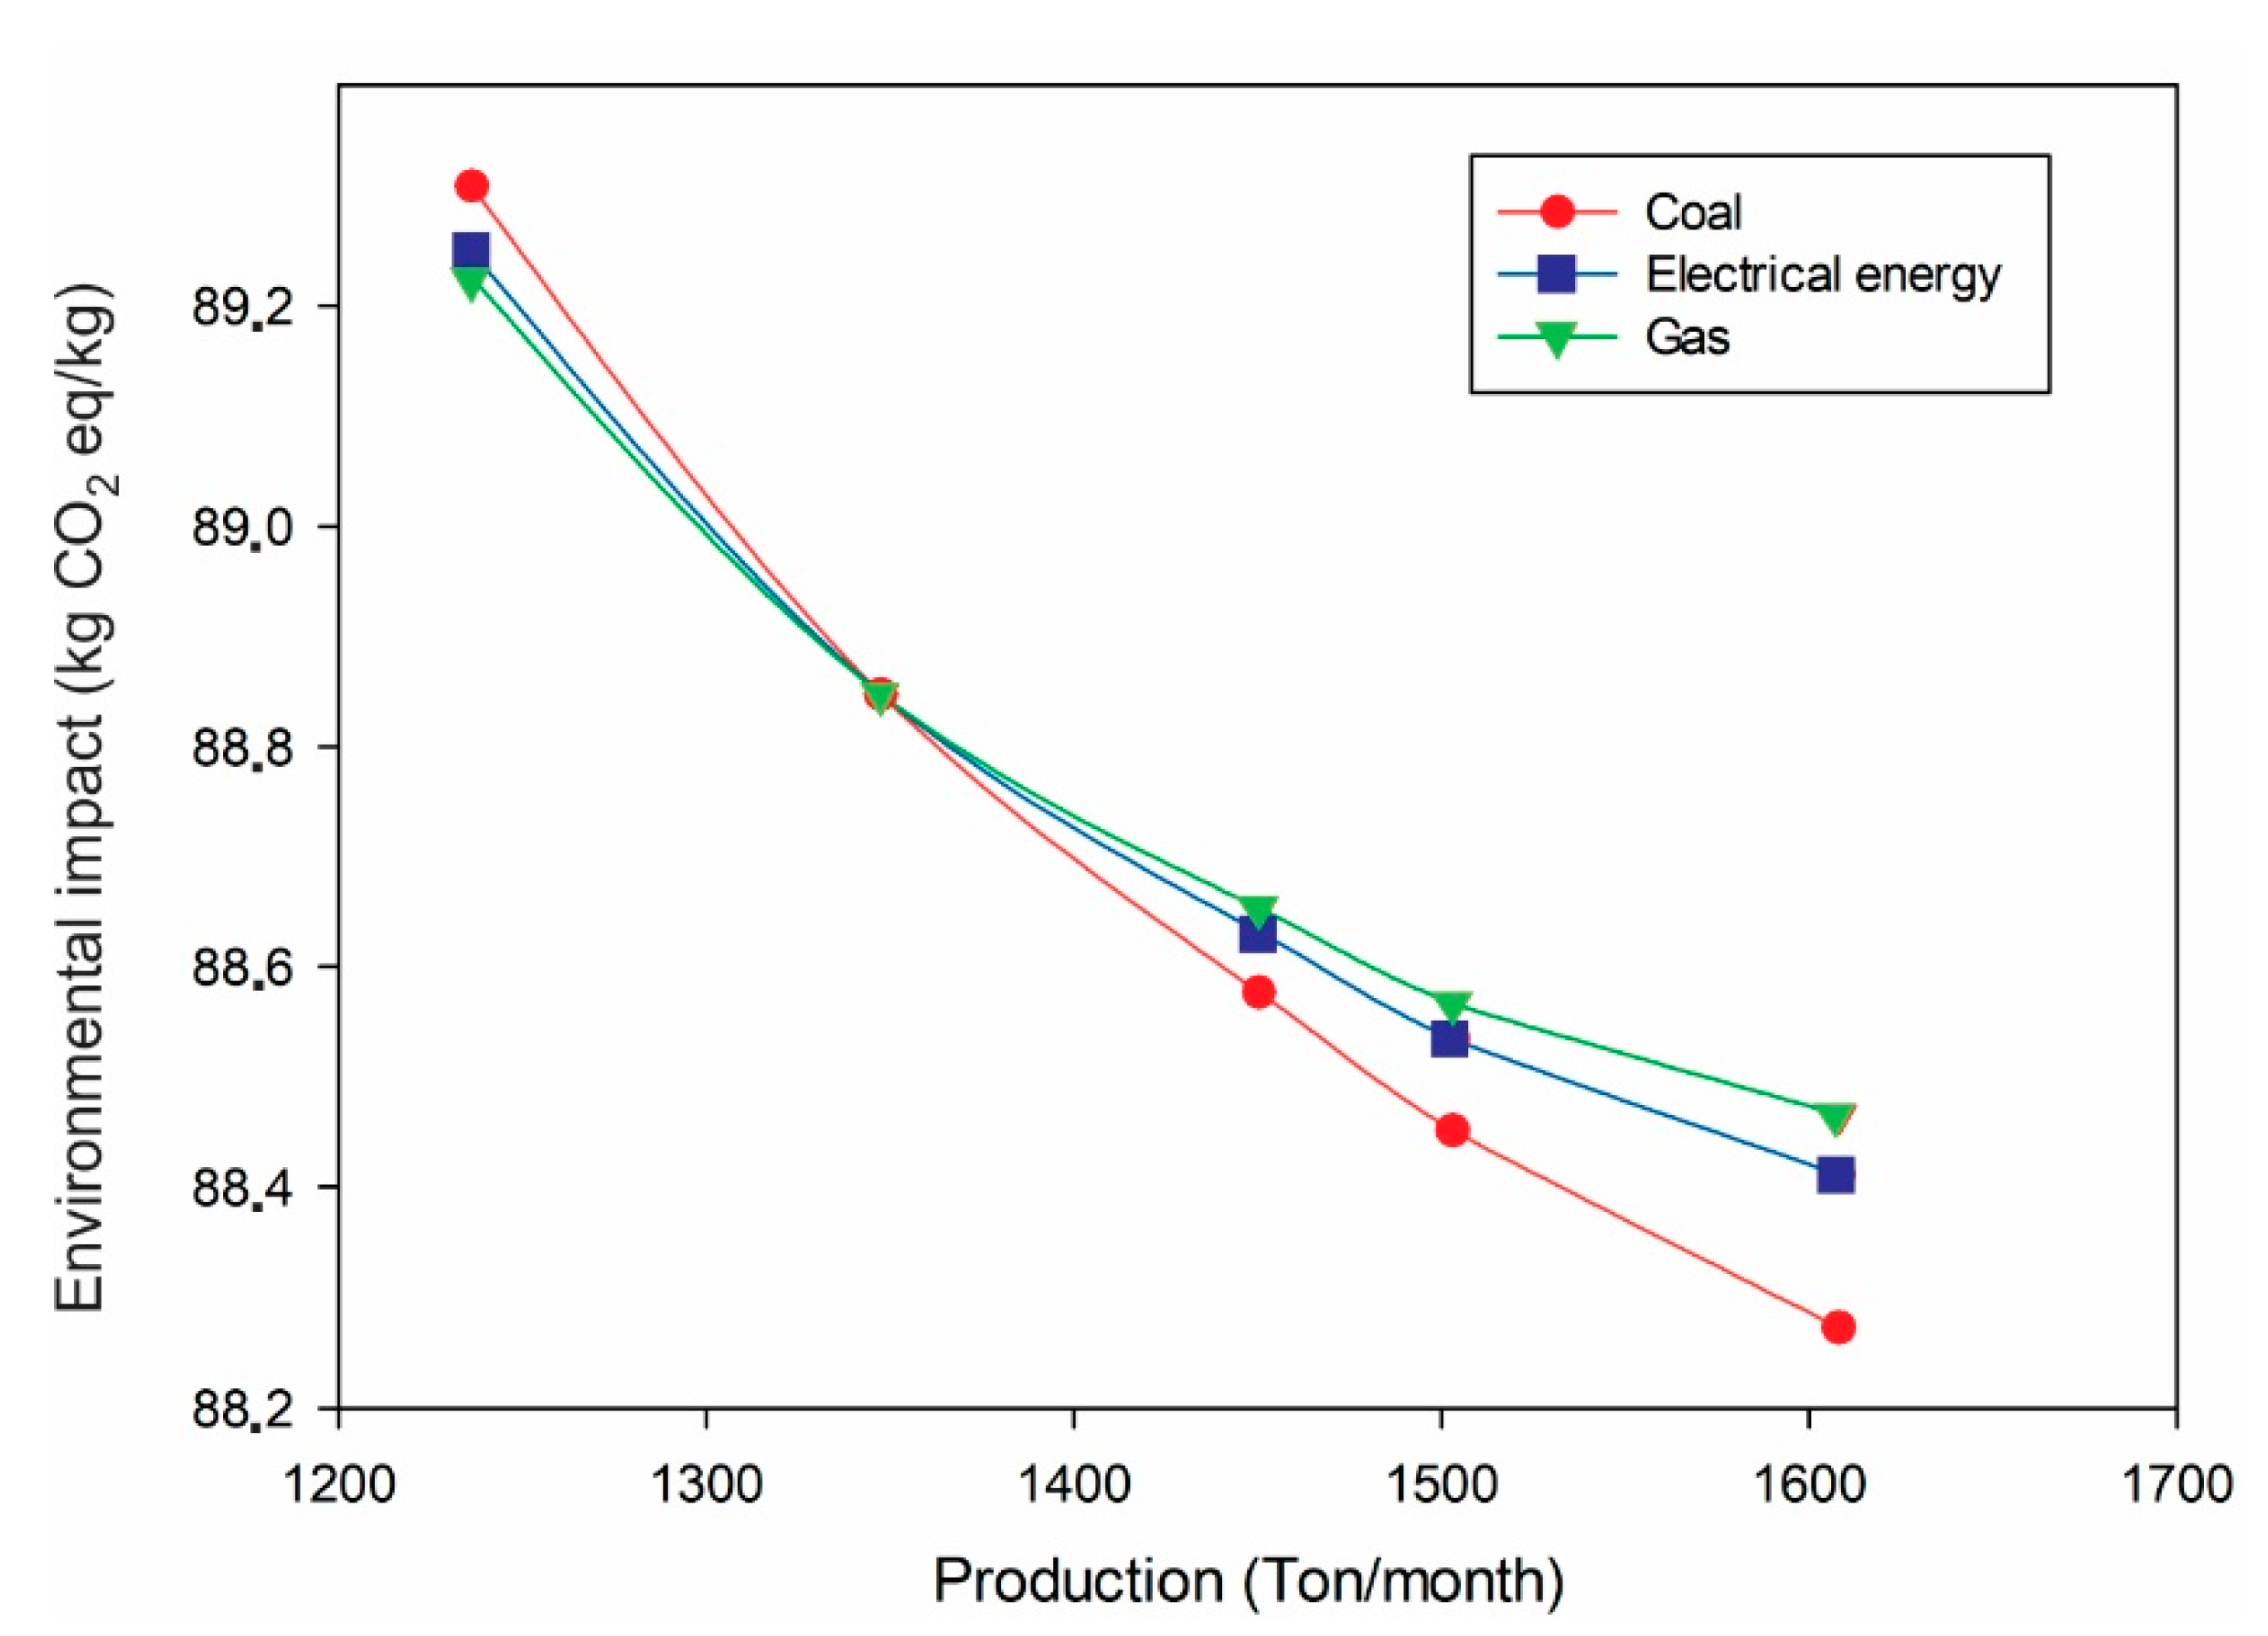
On the other hand, the pollutant emission with the greatest impact on climate change is CO 2 . For this reason, in the impact assessment of the paper manufacturing process, the results of the effect generated by this process are presented as CO 2 equivalent. In Figure 10, the kg of C O 2 equivalent generated by the variation in paper production can be seen for each of the three case studies. This shows that for all the case studies analyzed in this work, the increase in production is a positive aspect in terms of energy, economy, and the environment for the production process.
Moreover, it can be seen how the changes in coal consumption are those that most affect the formation of CO2 equivalent to process waste. This is because coal as a fuel is a large source of CO2 generation, which is why in recent years, it has been decided by European countries to leave this fuel aside. It is expected that this path will be taken by American companies. Additionally, the effect of the increase in the plant’s operational regime on the potential environmental impacts is observed in the climate change category, where the plant manages to drop to almost 88.3 kg CO2 equivalent for Improvement Action 3 in which carbon is involved, while the impact of gas reaches values of 88.5 kg CO2 equivalent in Improvement Action 2.
On the other hand, the environmental impacts calculated by the LCA can be analyzed through the standardization of the same. This normalization is done by dividing the value obtained in the LCA by the standard value provided by the method for each of the impacts under study [41]. These normalization values are presented in Table 4 [42].
This normalization value is fundamental because the values of the calculated impact categories are presented in different units, and this normalization allows them to be transferred to a reference unit. This reference unit allows the analysis and comparison of each of the calculated impact categories, as well as the comparison with the values used in the normalization. Table 5 shows the results of the environmental impact normalized in the categories available in the method.
For all the case studies considered, 15 impact categories are presented, in which each of the results is multiplied by 100 to be presented as a percentage of the reference standard value and thus evaluate the percentage of variation in each of the case studies. For the case study on coal, the impact category that presented a positive result concerning the base case was climate change, which presented a value of 0.005% lower than the reference value, this being the case study in which climate change had a greater decrease concerning the base case. On the other hand, in the case of electrical energy, the behavior was equal to that of coal, in which the only thing that was achieved was a reduction in climate change. Similarly, in the case of gas, this behavior was maintained. Demonstrating this, in the three case studies, there was a decrease in CO2 emissions, despite the increase in production. Another impact that presented a decrease in their values was acidification in the case of electricity. This impact went from 0.084% of the reference value to 0.080%, which meant a decrease of 0.004%.
The remaining 13 impact categories showed an increase in their values concerning the reference value. The category that stands out for its increase is human toxicity. This toxicity is divided into toxicity with carcinogenic effects and toxicity without carcinogenic effects. About human toxicity without carcinogenic effects, the greatest increase occurred in the case of gas, increasing by 0.033%. This represents almost three times the increase in the case of coal, which was the least increased in the three case studies. On the other hand, human toxicity with carcinogenic effects presented a higher increase than that observed in toxicity without carcinogenic effects. The greatest increase was observed in the case of gas, reaching an increase of 0.056%. On the other hand, the case study with the smallest increase for this impact category was the coal case, with 0.054%. As for the impact categories with the smallest increase, it was land use. The increase in this category reached 0.000052% for the three case studies.

3.3. Opportunities for Technological Improvement

This section presents opportunities for improvement, taking into account energy, environmental, and economic criteria. Therefore, alternatives for generating the energy demanded by Machine 1 were evaluated through three internal combustion engines (ICEs) from different manufacturers.
These high-impact alternatives in the supply of the energy network allow the decentralization of the power generation system using gas engines, which are expected to have an even higher performance in the industry, due to their high power densities, high efficiencies, and low emission levels, in addition to a high degree of availability [43].
The importance and relevance of these generation engines are given by their versatility in application to industries in the oil, textile, cement, pharmaceutical, plastic, and paper sectors [44]. Natural gas is one of the most successful fuels in replacing conventional liquid fuels such as diesel and gasoline worldwide since it can be extracted from large reserves of fossil fuels [45]. Thus, natural gas engines are an attractive alternative to current diesel engine technology for heavy-duty applications due to fuel prices, less expensive after-treatment devices, and a growing network of gas service stations worldwide [46].
The difference that the alternatives present is the investment cost, maintenance cost, and efficiencies. The variables analyzed are presented in Table 6 and are compared for each of the three alternatives.
For the selection of the most suitable alternative, a detailed engineering study, assembly, and commissioning must be taken into account. Additionally, the nationalization of the inputs to be used and the maintenance activities to keep the equipment in optimal operation are of vital importance. This work is projected with an evolution period of 10 years, a projection of 3.7% annual average for the CPI, and a TMR of 2200 dollars/USD fixed in the project’s horizon. 
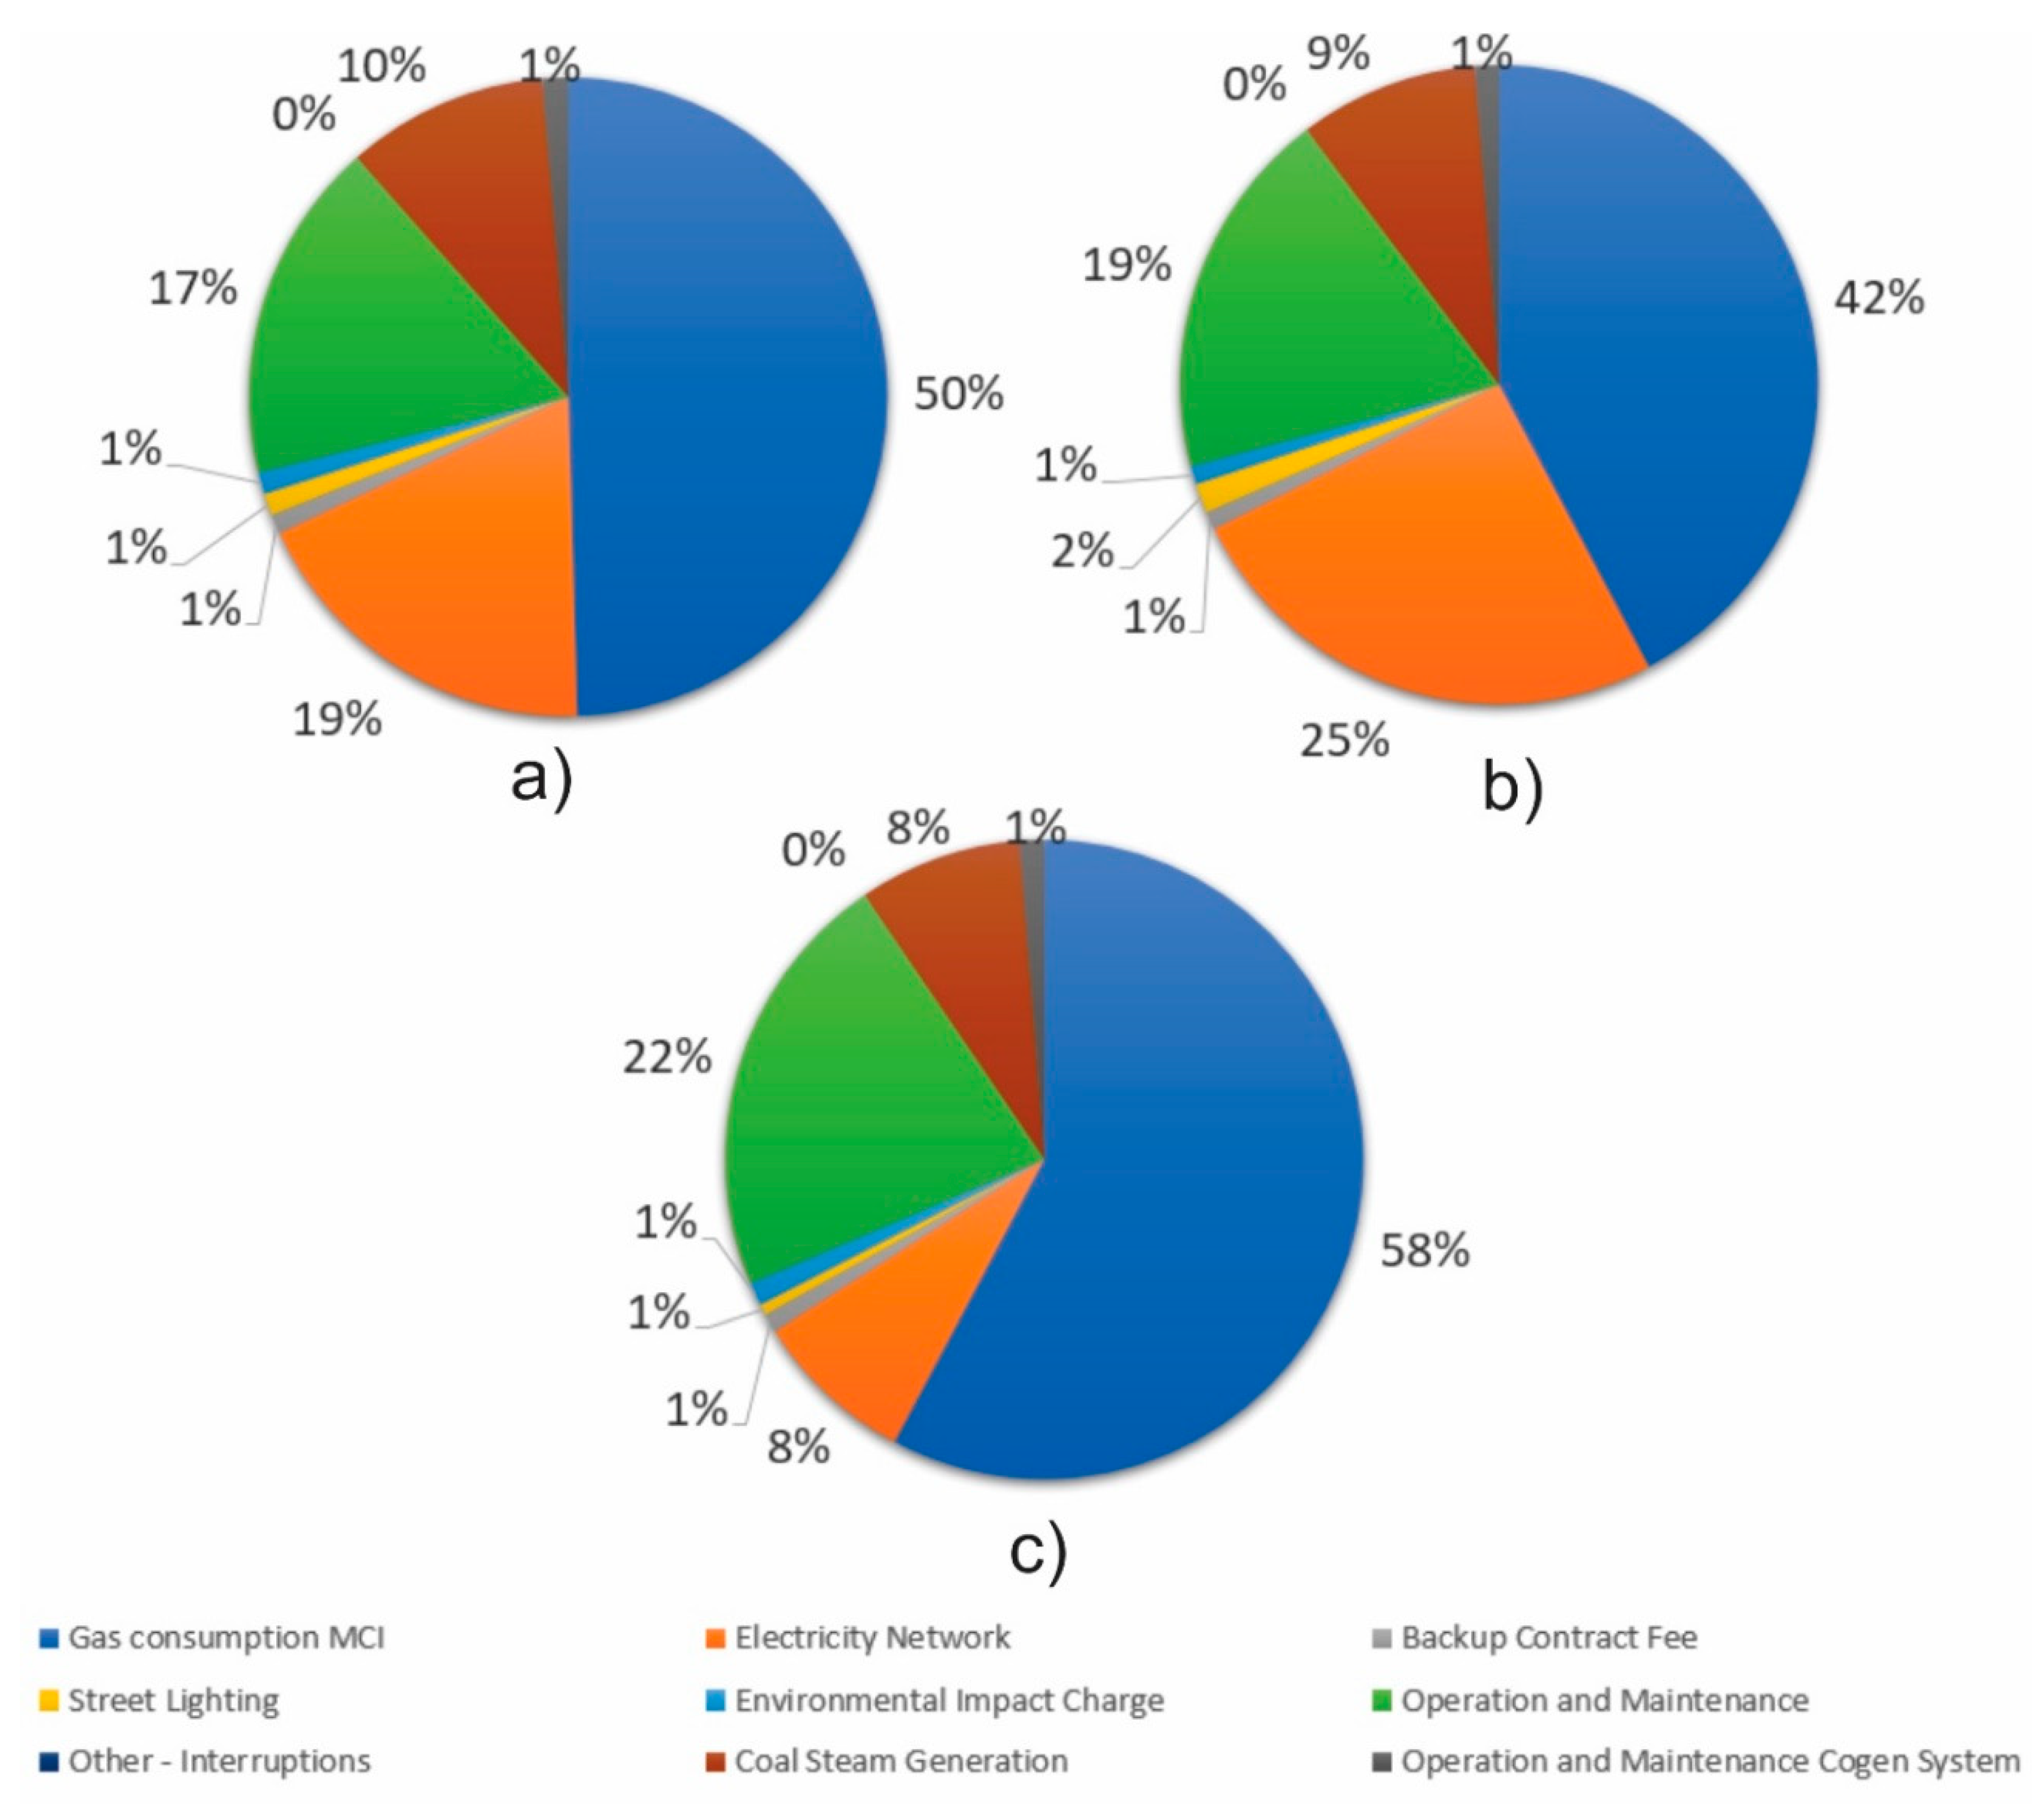
Figure 11 shows the percentages of costs of the operational variables that were taken into account for the selection of the alternatives.
Figure 11a represents Option 1, which is the APG1000 Waukesha engine and a total annual cost of USD216,777. Of this cost, 50% is for gas consumption, 19% belongs to the electricity grid, and 17% to operational and maintenance costs. On the other hand, Figure 11b represents Option 2, the JMS 320 engine of the Jenbacher brand, which has an annual cost of USD233,398. Of this cost, 42% is spent on gas consumption, 25% on electricity and 19% on operational and maintenance costs. Finally, in Figure 11c, Option 3 is represented. In this one, Cummins’ QSK-60G engine is used, for which 58% of the costs are destined for gas consumption, 22% to operation and maintenance costs, and 8% to the electrical network. This last alternative has an annual cost of USD227,137. The costs of Options 1–3 represent 65.4%, 70.4%, and 68.5% of the cost of the case, respectively.
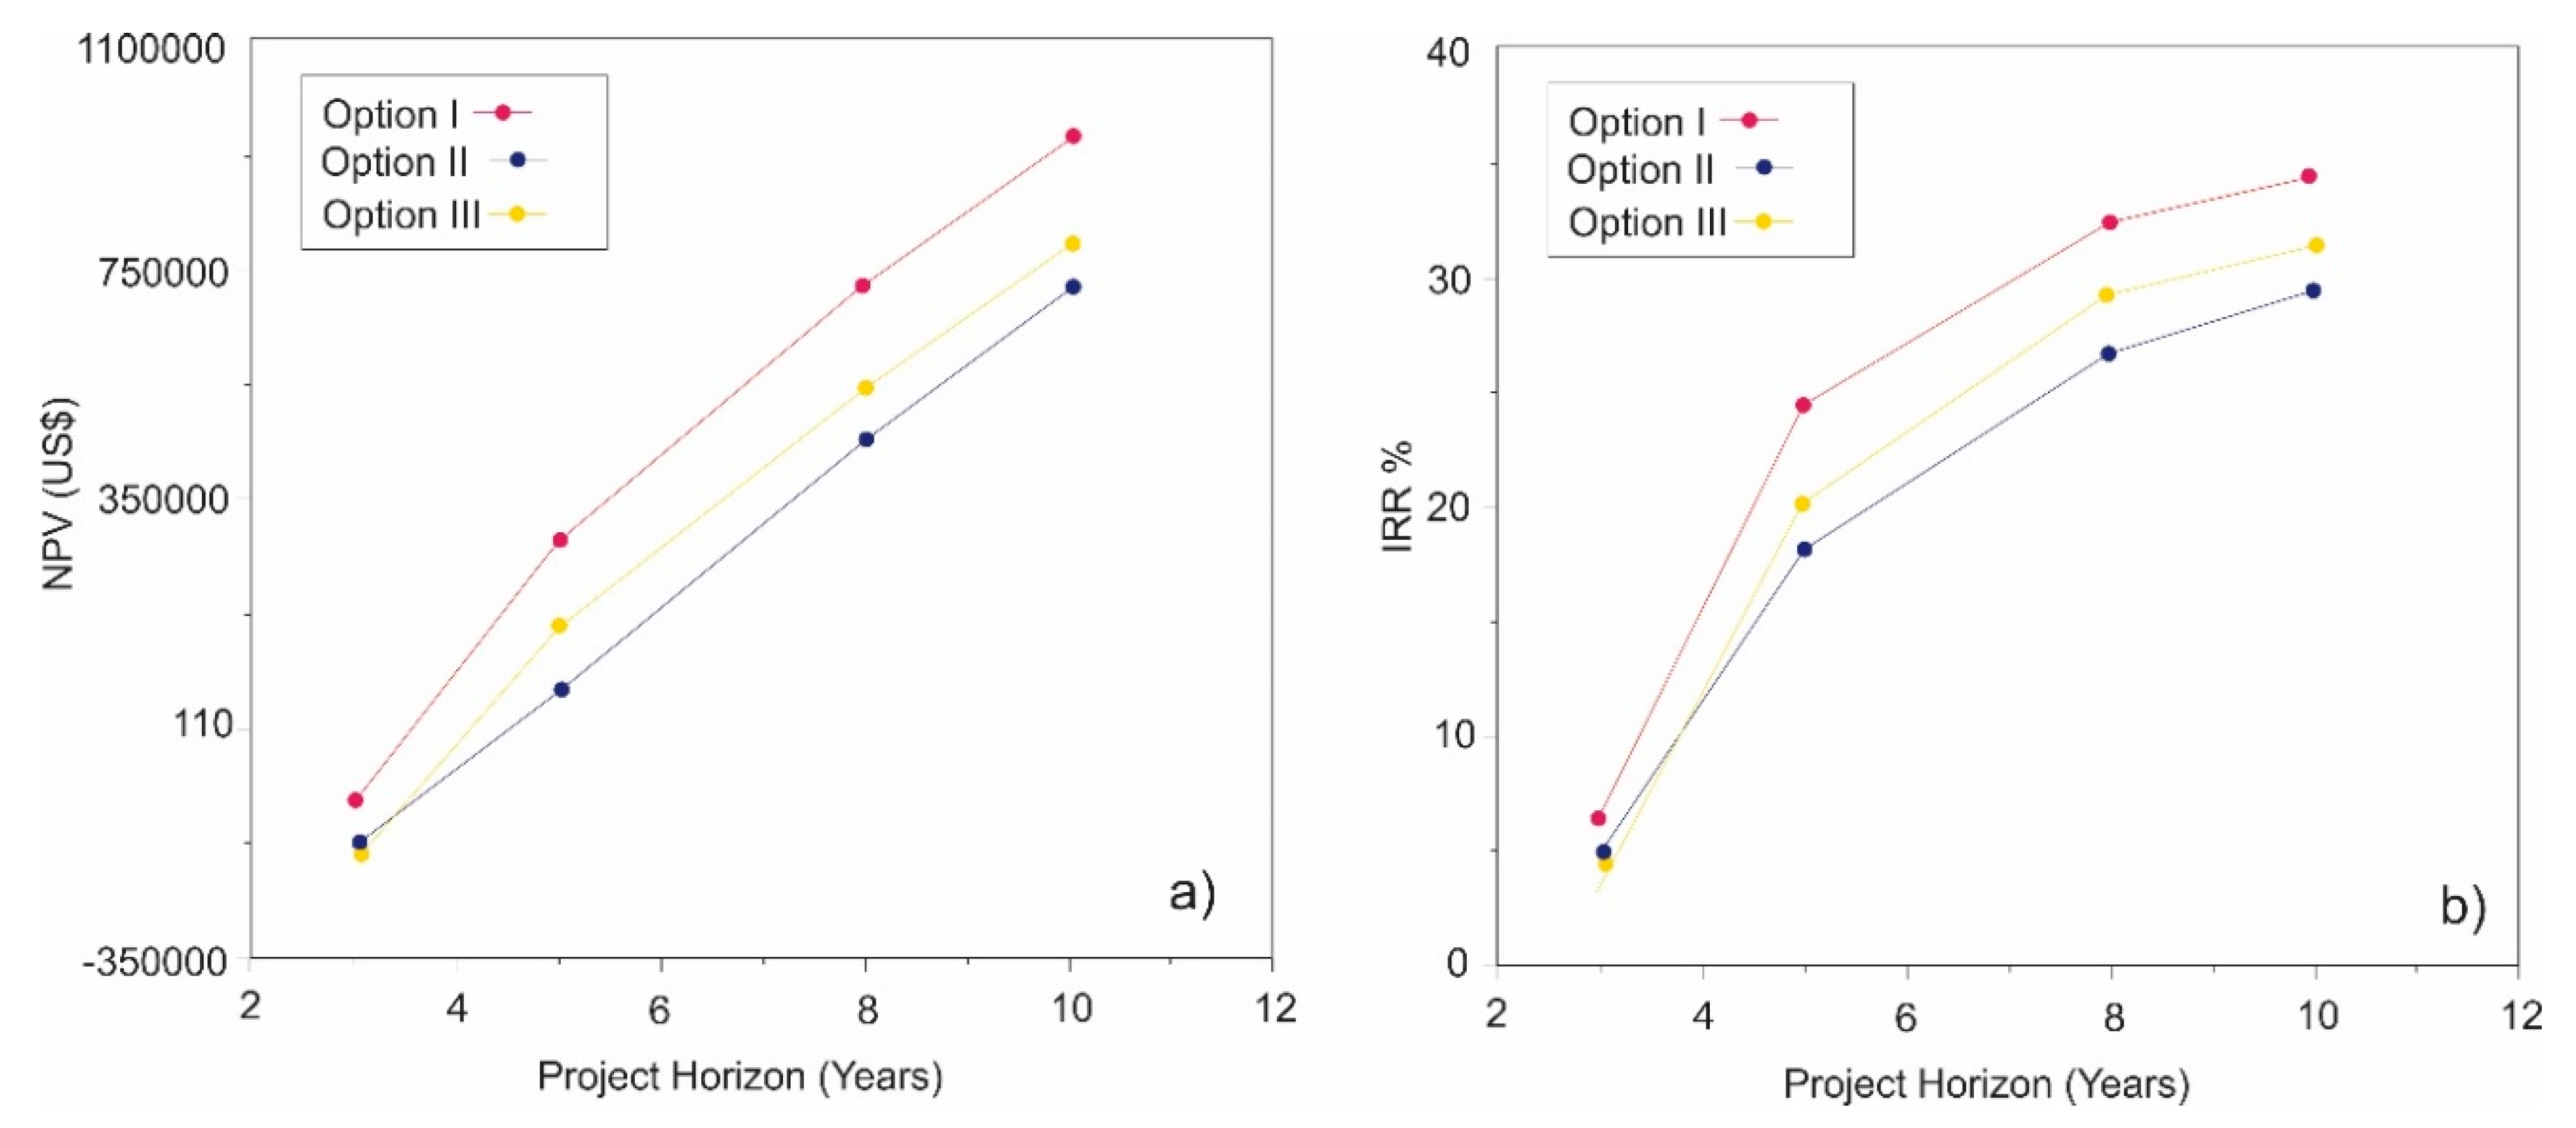
Taking into account these alternatives, a financial evaluation was made, and the result of this evaluation is presented in Figure 12. In Figure 12a, in which the net present value is evaluated, it can be seen that the most convenient option is the one to choose. On the other hand, Figure 12b shows the behavior of the internal rate of return in time. This rate also shows the most suitable option for the proposed technological modification. It is recommended to evaluate new clean energy systems generation based on the energy and potential environmental impacts, such as the fuel cells, solar, or wind energy [45].
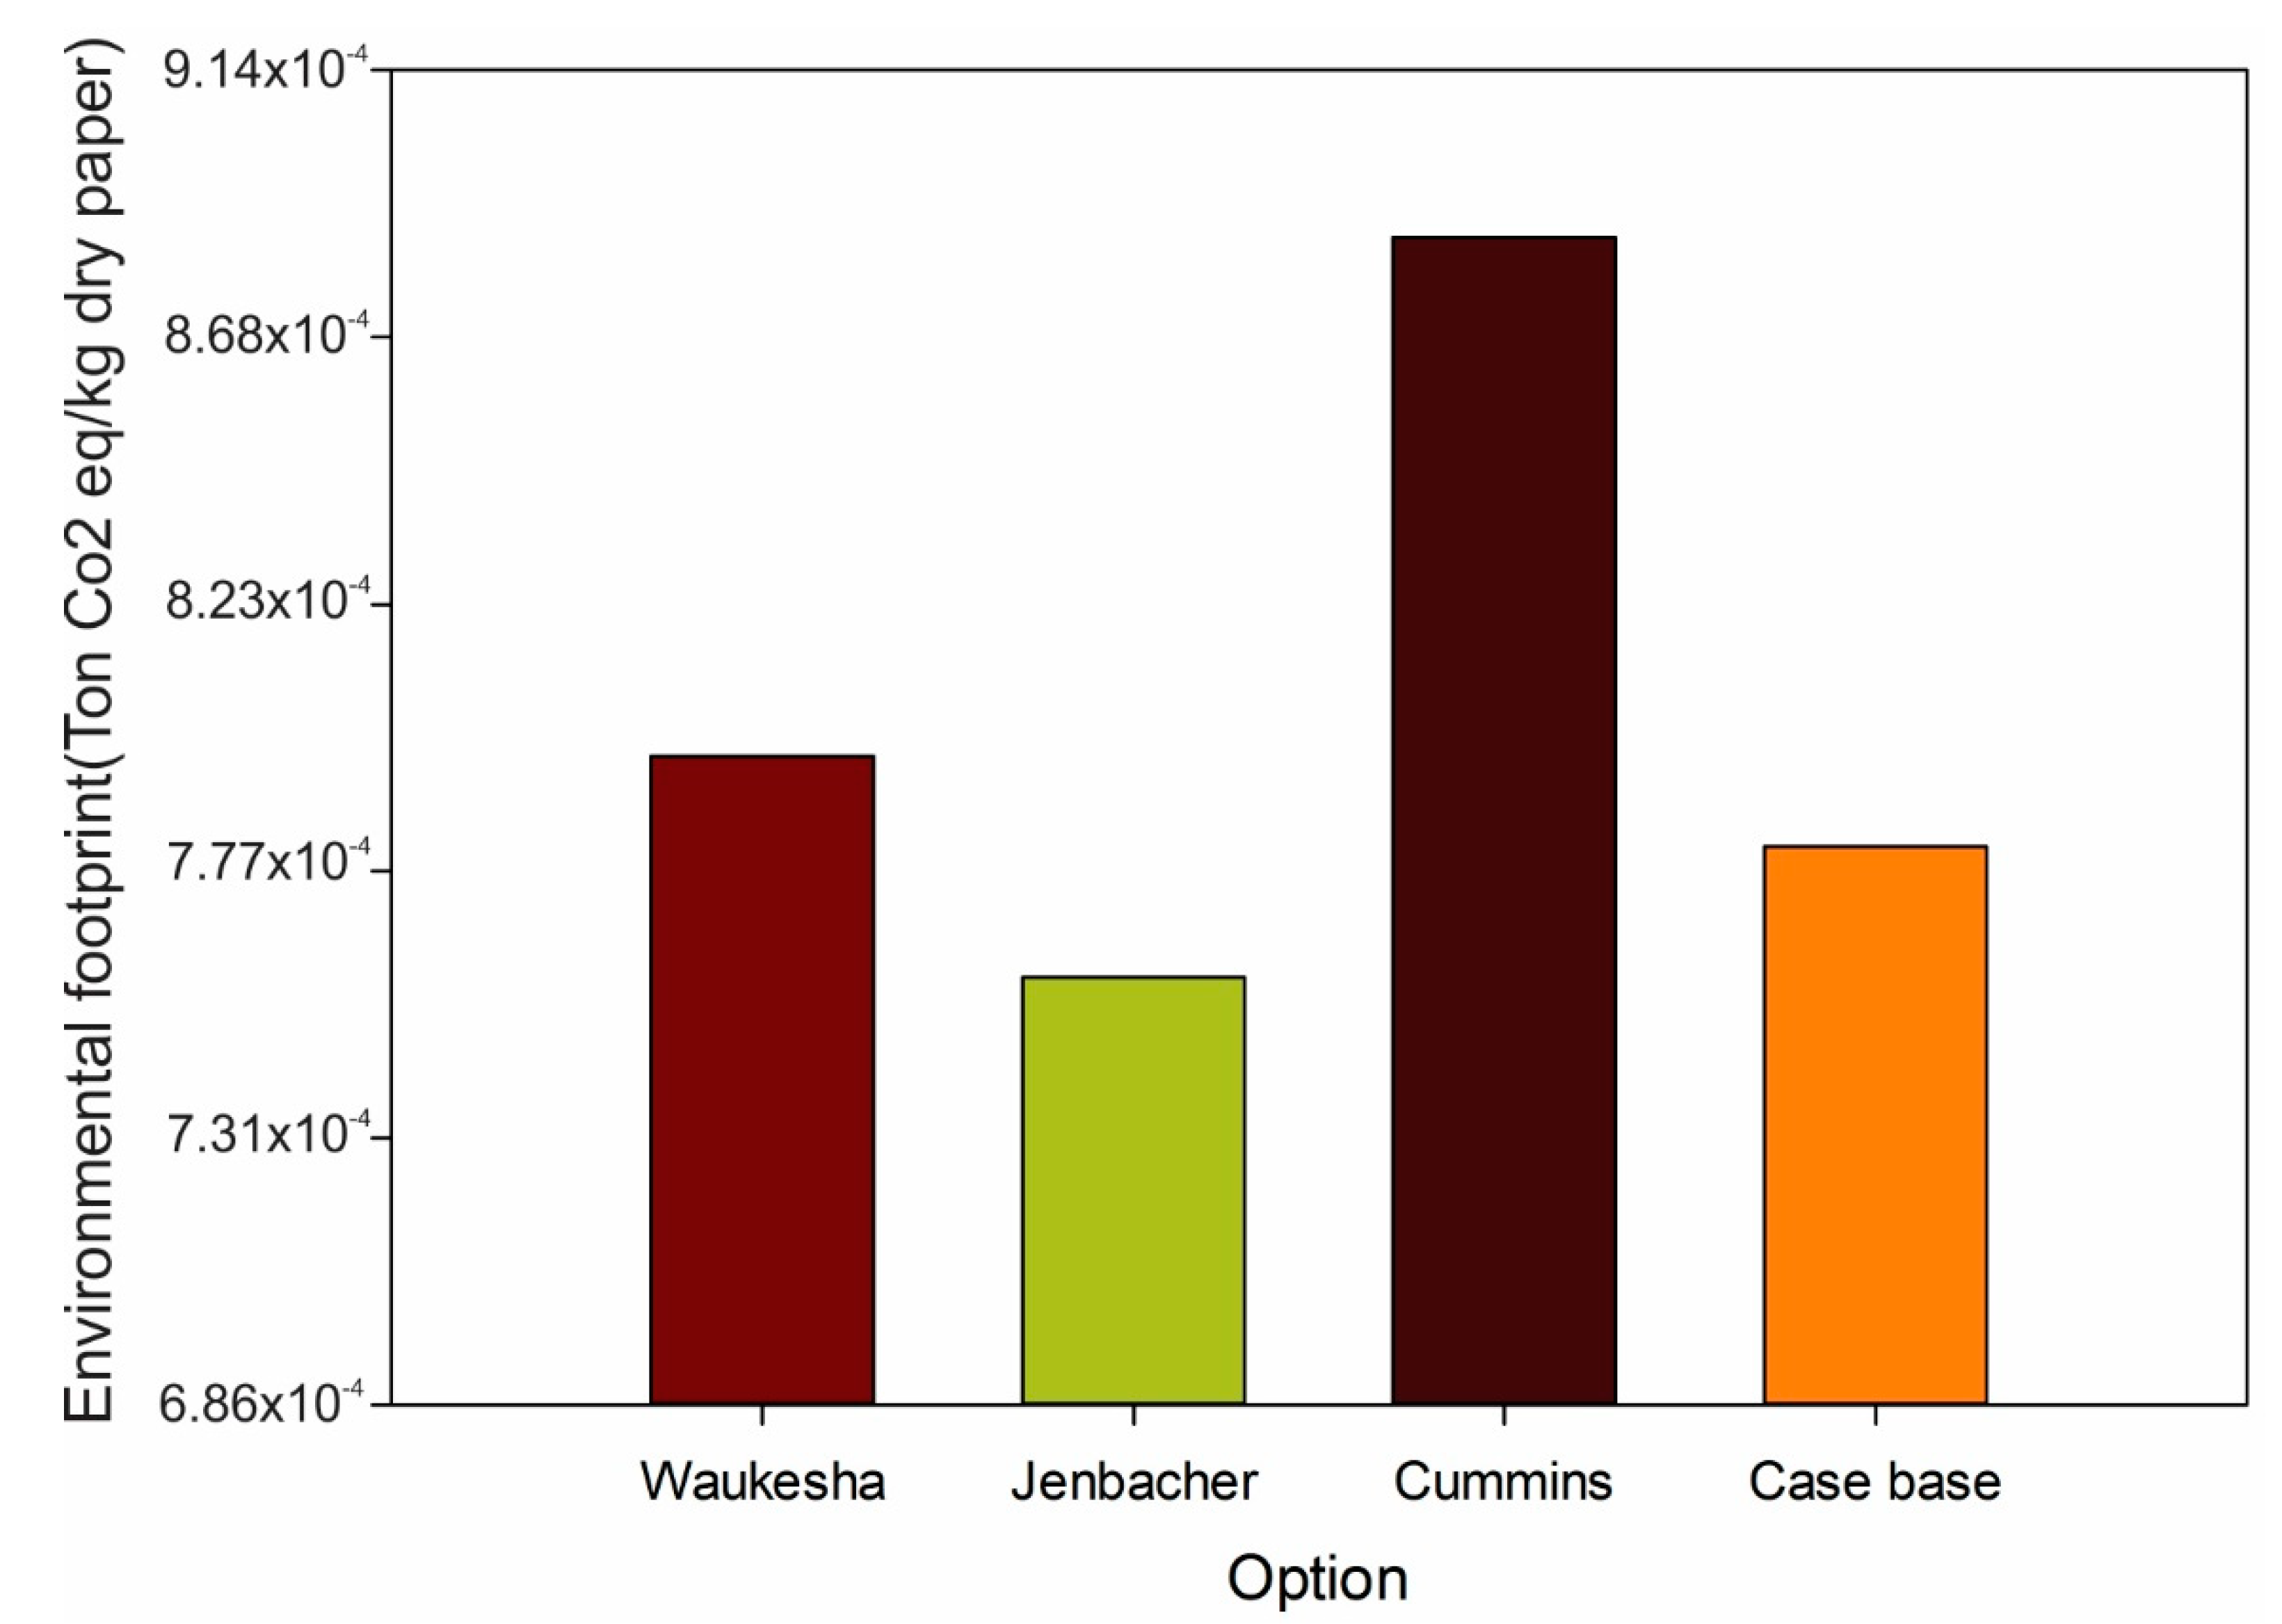
In addition to the economic factor, it is important to take into account the environmental factor. This will ensure that the actions taken are sustainable over time, given their energy, economic, and environmental benefits. For this, the environmental footprint generated by the base case and by the 3 ICE options was calculated. In Figure 13, the environmental footprint is presented in units of a ton of CO2 equivalent.
In this figure, we can observe the behavior of the environmental footprint in each of the engines studied. Options 1 and 3 exceed the tons of carbon equivalent produced by the plant under current conditions. On the other hand, Option 2 represents a decrease of approximately 4.57 × 10⁻⁵ ton CO2 eq/kg of dry paper, making this option the most environmentally viable.

4. Conclusions

Finally, the development of this work allows us to conclude that the consumption not associated with production for gas and coal is 20%, as opposed to 65% for electrical energy, which indicates strong consumption that does not contribute to production. In the baselines by energy, a very high adjustment was achieved in the model for gas and electricity. However, in the case of coal, this value was very low. This can be explained by the fact that there is no measurement of the steam that enters the machine.
On the other hand, the results observed in the life cycle analysis allow us to conclude that although the increase in production is 13%, the increase in emissions did not exceed a 9% increase concerning the base case. All this showed that the results of this work are positive from the energy, economic, and environmental points of view.
The application of an energy assessment in the production processes, in combination with a life cycle analysis, offers the possibility of obtaining a global vision of the decisions and opportunities found from the process of energy characterization and application of the ISO 50001 standard. This helps not only to weigh up energy opportunities from an economic point of view but also from an environmental and social one.
The life cycle analysis made it possible to evaluate the impacts generated by the dry paper production process. The study was able to make a comparison of the environmental impacts generated in the category of climate change kg of CO2 equivalent emitted into the atmosphere, and the effects that occur. The environmental impact value that occurs in the plant with current processes were observed, and what the potential emissions when implementing some energy-saving opportunities are. It can be noted that the energy-saving Opportunity 2 that proposes the potential reduction of energy consumption and emission of kg of CO2 equivalent by adjusting the production to a load factor of 77% implies a gas consumption of 1.6 kWh/kg and an impact in the category of climate change of 88.5 kg CO2 equivalent/kg of paper produced. This represents a decrease from the base case. On the other hand, human toxicity without carcinogenic effects presented the greatest increase in the case of gas, with an increase of 0.033%, almost triple the lowest increase presented in the three cases studied. Likewise, human toxicity with carcinogenic effects for the gas case reached an increase of 0.056%. On the other hand, the case with the smallest increase for this impact category was that of coal, with 0.054%. As for the impact categories with the smallest increase, it was land use. The increase in this category reached 0.000052% for the three case studies. This is positive because to achieve energy savings of 1.51%, there is a smaller increase in the impact categories.
From the improvement opportunities considering technological change, although Option 1 for the implementation of an engine is the most economically feasible, by taking into account environmental performance, this option presented a greater ecological footprint than the base case study. However, Option 2 presented the lowest carbon footprint and the second-best economic option. With this, it was demonstrated that to achieve sustainable industrial processes, it is important to take into account energy, economic and environmental criteria in the continuous improvement of the paper production process, and technological change alternatives have the largest impact of operational alternatives, according to energy, environmental and economic criteria.

Author Contributions

Conceptualization: E.E.B.; methodology: G.V.O. and J.D.F.; software: E.E.B., G.V.O., and J.D.F.; validation: E.E.B. and J.D.F.; formal analysis: E.E.B., G.V.O., and J.D.F.; investigation: E.E.B., G.V.O., and J.D.F.; resources: G.V.O. and J.D.F.; writing—original draft preparation: G.V.O.; writing—review and editing: G.V.O. and J.D.F.; funding acquisition: G.V.O. and J.D.F. All authors have read and agreed to the published version of the manuscript.

Funding

This work was supported by the Universidad del Atlántico, and Universidad Francisco de Paula Santander in Ocaña Norte de Santander.

Acknowledgments

This research was supported by the Mechanical Engineering Program of Universidad del Atlántico. The Kai Research Group supports G. Valencia and J. Duarte.

Conflicts of Interest

The authors declare no conflict of interest.

Nomenclature

CTUh Comparative Toxic Unit for human
kg   N   eq kg of Nitrogen equivalent
kg   P   eq kg of Phosphorus equivalent
Molc   N   eq mol of Nitrogen equivalent
CTUe Comparative Toxic Unit for aquatic
σ Standard deviation
CV Coefficient of Variance
n o Minimum number of data

References

  1. Osorio Zapata, E.M.; ONU (Organización de las Naciones Unidas); IDEAM; PNUD; MADS; DNP; CANCILLERÍA. Convención Marco sobre el Cambio Climático—PARIS. J. Chem. Inf. Model. 2015, 21930, 40. [Google Scholar]
  2. UNIDO. Industrial Development Report 2011 Industrial Energy Efficiency for Sustainable Wealth Creation; UNIDO: Vienna, Austria, 2011; ISBN 9789211064483. [Google Scholar]
  3. U.S. Energy Information Administration. International Energy Outlook 2019 with projections to 2050. Available online: https://www.eia.gov/outlooks/ieo/pdf/ieo2019.pdf (accessed on 20 January 2020).
  4. ICONTEC. Ntc-Iso 50001; ICONTEC: Bogota, Colombia, 2011; p. 24. [Google Scholar]
  5. Akimoto, H. Global Air Quality and Pollution. Science 2003, 302, 1716–1719. [Google Scholar] [CrossRef] [PubMed] [Green Version]
  6. Naciones Unidas. Acuerdo de París; Naciones Unidas: New York, NY, USA, 2015; p. 29. [Google Scholar]
  7. Girbau-LListuella, F.; Díaz-González, F.; Sumper, A. Optimization of the operation of smart rural grids through a novel energy management system. Energies 2018, 11, 9. [Google Scholar] [CrossRef] [Green Version]
  8. Jovanović, B.; Filipović, J.; Bakić, V. Energy management system implementation in Serbian manufacturing —Plan-Do-Check-Act cycle approach. J. Clean. Prod. 2017, 162, 1144–1156. [Google Scholar] [CrossRef]
  9. Petrecca, G. Industrial Energy Management: Principles and Applications. Ind. Energy Manag. 1993, 49, 6221. [Google Scholar]
  10. Jovanović, B.; Filipović, J. ISO 50001 standard-based energy management maturity model—Proposal and validation in industry. J. Clean. Prod. 2016, 112, 2744–2755. [Google Scholar] [CrossRef]
  11. Dall’O’, G.; Ferrari, S.; Bruni, E.; Bramonti, L. Effective implementation of ISO 50001: A case study on energy management for heating load reduction for a social building stock in Northern Italy. Energy Build. 2020, 219, 110029. [Google Scholar] [CrossRef]
  12. Gopalakrishnan, B.; Ramamoorthy, K.; Crowe, E.; Chaudhari, S.; Latif, H. A structured approach for facilitating the implementation of ISO 50001 standard in the manufacturing sector. Sustain. Energy Technol. Assess. 2014, 7, 154–165. [Google Scholar] [CrossRef]
  13. Bonacina, F.; De Propris, L.; Marchegiani, A.; Mori, F. Industrial Energy Management Systems in Italy: State of the Art and Perspective. Energy Procedia 2015, 82, 562–569. [Google Scholar] [CrossRef] [Green Version]
  14. van der Giesen, C.; Cucurachi, S.; Guinée, J.; Kramer, G.J.; Tukker, A. A critical view on the current application of LCA for new technologies and recommendations for improved practice. J. Clean. Prod. 2020, 259, 120904. [Google Scholar] [CrossRef]
  15. Yilbas, B.S.; Shaukat, M.M.; Afzal, A.A.; Ashraf, F. Life cycle analysis for laser welding of alloys. Opt. Laser Technol. 2020, 126, 106064. [Google Scholar] [CrossRef]
  16. Cheng, G.; Zhao, Y.; Pan, S.; Wang, X.; Dong, C. A comparative life cycle analysis of wheat straw utilization modes in China. Energy 2020, 194, 116914. [Google Scholar] [CrossRef]
  17. Ramírez, R.; Gutiérrez, A.S.; Eras, J.J.C.; Valencia, K.; Hernández, B.; Forero, J.D. Evaluation of the energy recovery potential of thermoelectric generators in diesel engines. J. Clean. Prod. 2019, 241, 118412. [Google Scholar] [CrossRef]
  18. Orcesi, A.D.; Feraille, A.; Chataigner, S. Fatigue strengthening of steel structures using high modulus CFRP plates: Development of a life-cycle analysis approach. Constr. Build. Mater. 2019, 227, 116628. [Google Scholar] [CrossRef]
  19. Jullien, A.; Proust, C.; Yazoghli-Marzouk, O. LCA of alternative granular materials—Assessment of ecotoxicity and toxicty for road case studies. Constr. Build. Mater. 2019, 227, 116737. [Google Scholar] [CrossRef]
  20. Rahman, S.M.A.; Hachicha, A.A.; Ghenai, C.; Saidur, R.; Said, Z. Performance and life cycle analysis of a novel portable solar thermoelectric refrigerator. Case Stud. Therm. Eng. 2020, 19, 100599. [Google Scholar] [CrossRef]
  21. Restrepo, A.; Becerra, R.; Tibaquirá, J.E.G. Energetic and carbon footprint analysis in manufacturing process of bamboo boards in Colombia. J. Clean. Prod. 2016, 126, 563–571. [Google Scholar] [CrossRef]
  22. Junnila, S. Life cycle management of energy-consuming products in companies using IO-LCA. Int. J. Life Cycle Assess. 2008, 13, 432. [Google Scholar] [CrossRef]
  23. Masternak-Janus, A.; Rybaczewska-Błazejowska, M. Life cycle analysis of tissue paper manufacturing from virgin pulp or recycled waste paper. Manag. Prod. Eng. Rev. 2015, 6, 47–54. [Google Scholar] [CrossRef]
  24. Poopak, S.; Agamuthu, P. Life cycle impact assessment (LCIA) of paper making process in Iran. Afr. J. Biotechnol. 2011, 10, 4860–4870. [Google Scholar]
  25. Pelser, W.A.; Vosloo, J.C.; Mathews, M.J. Results and prospects of applying an ISO 50001 based reporting system on a cement plant. J. Clean. Prod. 2018, 198, 642–653. [Google Scholar] [CrossRef]
  26. Aitchison, J. The statistical analysis of compositional data. J. R. Stat. Soc. 1982, 44, 139–160. [Google Scholar] [CrossRef]
  27. Díaz de Junguitu, A.; Allur, E. The Adoption of Environmental Management Systems Based on ISO 14001, EMAS, and Alternative Models for SMEs: A Qualitative Empirical Study. Sustainability 2019, 11, 7015. [Google Scholar] [CrossRef] [Green Version]
  28. Ochoa, G.V.; Rojas, J.P.; Forero, J.D. Advance Exergo-Economic Analysis of a Waste Heat Recovery System Using ORC for a Bottoming Natural Gas Engine. Energies 2020, 13, 267. [Google Scholar] [CrossRef] [Green Version]
  29. Ren, J. Chapter 16—Integrated data Envelopment Analysis, Weighting Method and Life Cycle Thinking: A Quantitative Framework for Life Cycle Sustainability Improvement; Ren, J., Toniolo, S., Eds.; Elsevier: Amsterdam, The Netherlands, 2020; pp. 329–344. ISBN 978-0-12-818355-7. [Google Scholar]
  30. Gençer, E.; O’Sullivan, F.M. A Framework for Multi-level Life Cycle Analysis of the Energy System. In 29 European Symposium on Computer Aided Process Engineering; Kiss, A.A., Zondervan, E., Lakerveld, R., Özkan, L., Eds.; Elsevier: Amsterdam, The Netherlands, 2019; Volume 46, pp. 763–768. ISBN 1570-7946. [Google Scholar]
  31. Valencia, G.; Cardenas-Gutierrez, J.; Forero, J. Exergy, Economic, and Life-Cycle Assessment of ORC System for Waste Heat Recovery in a Natural Gas Internal Combustion Engine. Resources 2020, 9, 2. [Google Scholar] [CrossRef] [Green Version]
  32. Zhou, Z.; Tang, Y.; Chi, Y.; Ni, M.; Buekens, A. Waste-to-energy: A review of life cycle assessment and its extension methods. Waste Manag. Res. 2017, 36, 3–16. [Google Scholar] [CrossRef]
  33. Valencia, G.; Benavides, A.; Cárdenas, Y. Economic and environmental multiobjective optimization of a wind-solar-fuel cell hybrid energy system in the Colombian Caribbean region. Energies 2019, 12, 2119. [Google Scholar] [CrossRef] [Green Version]
  34. McClelland, S.C.; Arndt, C.; Gordon, D.R.; Thoma, G. Type and number of environmental impact categories used in livestock life cycle assessment: A systematic review. Livest. Sci. 2018, 209, 39–45. [Google Scholar] [CrossRef]
  35. Morales, A.; Valencia, G.E.; Cardenas, Y.D. Identification of energy saving potential in steam boiler through an ISO Identification of energy saving potential in steam boiler through an ISO 50001 standard. J. Phys. Conf. Ser. 2018, 1126, 1–7. [Google Scholar] [CrossRef]
  36. Navajas, A.; Uriarte, L.; Gandía, L.M. Application of eco-design and life cycle assessment standards for environmental impact reduction of an industrial product. Sustainability 2017, 9, 1724. [Google Scholar] [CrossRef] [Green Version]
  37. Poveda-Orjuela, P.P.; García-Díaz, J.C.; Pulido-Rojano, A.; Cañón-Zabala, G. ISO 50001: 2018 and Its Application in a Comprehensive Management System with an Energy-Performance Focus. Energies 2019, 12, 4700. [Google Scholar] [CrossRef] [Green Version]
  38. Ochoa, G.V.; Peñaloza, C.A.; Rojas, J.P. Thermoeconomic modelling and parametric study of a simple orc for the recovery ofwaste heat in a 2 MW gas engine under differentworking fluids. Appl. Sci. 2019, 9, 4256. [Google Scholar] [CrossRef] [Green Version]
  39. Valencia, G.; Peñaloza, C.; Forero, J. Thermo-Economic Assessment of a Gas Microturbine-Absorption Chiller Trigeneration System under Different Compressor Inlet Air Temperatures. Energies 2019, 12, 4643. [Google Scholar] [CrossRef] [Green Version]
  40. Tong, L.; Pu, Z.; Ma, J. Maintenance Supplier Evaluation and Selection for Safe and Sustainable Production in the Chemical Industry: A Case Study. Sustainability 2019, 11, 1533. [Google Scholar] [CrossRef] [Green Version]
  41. Aymard, V.; Botta-Genoulaz, V. Normalisation in life-cycle assessment: Consequences of new European factors on decision-making. Supply Chain. Forum 2017, 18, 76–83. [Google Scholar] [CrossRef]
  42. Munshi, A.; Gaster, B.; Mattson, T.G.; Ginsburg, D. OpenCL Programming Guide; Pearson Education: London, UK, 2011; ISBN 0132594552. [Google Scholar]
  43. Ochoa, G.V.; Isaza-Roldan, C.; Forero, J.D. A phenomenological base semi-physical thermodynamic model for the cylinder and exhaust manifold of a natural gas 2-megawatt four-stroke internal combustion engine. Heliyon 2019, 5, e02700. [Google Scholar] [CrossRef] [Green Version]
  44. Piero Rojas, J.; Valencia Ochoa, G.; Duarte Forero, J. Comparative Performance of a Hybrid Renewable Energy Generation System with Dynamic Load Demand. Appl. Sci. 2020, 10, 3093. [Google Scholar] [CrossRef]
  45. Valencia, G.; Duarte, J.; Isaza-Roldan, C. Thermo-economic analysis of different exhaust waste-heat recovery systems for natural gas engine based on ORC. Appl. Sci. 2019, 9, 4071. [Google Scholar] [CrossRef] [Green Version]
  46. Alibaba, M.; Pourdarbani, R.; Hasan, M.; Manesh, K.; Valencia, G.; Duarte, J. Thermodynamic, exergo-economic and exergo-environmental analysis of hybrid geothermal-solar power plant based on ORC cycle using emergy concept. Heliyon 2020, 6, e03758. [Google Scholar] [CrossRef]
Figure 1. Simplified diagram of the paper plant production process.
Resources 09 00075 g001
Figure 2. Process of selection of improvement opportunities for the paper production plant.
Resources 09 00075 g002
Figure 3. Graphical representation of the index consumption indicator.
Resources 09 00075 g003
Figure 4. Scope and boundary conditions of the LCA for paper production.
Resources 09 00075 g004
Figure 5. Integration of management systems.
Resources 09 00075 g005
Figure 6. Productive energy diagram.
Resources 09 00075 g006
Figure 7. Consumption trend against monthly production for (a) coal, (b) electrical energy, and (c) natural gas.
Resources 09 00075 g007
Figure 8. Energy analysis for (a) baseline electricity, (b) coal baseline, (c) gas baseline, (d) electricity consumption indicator, (e) coal consumption indicator, and (f) gas consumption indicator.
Resources 09 00075 g008
Figure 9. Case studies environmental impact result for (a) ecotoxicity of rivers and terrestrial eutrophication, (b) eutrophication the rivers and maritime.
Resources 09 00075 g009
Figure 10. Climate change environmental impact for different production rates and energy sources.
Resources 09 00075 g010
Figure 11. Annual cost equivalent percentages for the, (a) Option 1, (b) Option 2, and (c) Option 3.
Resources 09 00075 g011
Figure 12. Economic evaluation annual (a) net present value (NPV), and (b) internal rate of return (IRR).
Resources 09 00075 g012
Figure 13. Environmental footprint produced monthly.
Resources 09 00075 g013
Table 1. Life cycle inventory to develop the environmental impact assessment for the four different case scenarios.
Energy or Raw MaterialBase CaseCoal CaseElectric Power CaseGas Case
Gas (m3)194,210.23194,210.23194,210.23193,734.09
Coal (Ton)41,971.8941,918.1241,971.8941,971.89
Paper (Ton)1347.4511503.181503.181503.18
Electric Energy (kWh)1,269,988.241,269,988.241,085,096.2441,269,988.24
Table 2. Energy consumed.
EnergeticsLow ProductionBase ProductionHigh Production
Consumption (GWh)Variation (%)Consumption (GWh)Variation (%)Consumption (GWh)Variation (%)
Coal3.812.383.81-3.81−0.65
Gas3.962.383.96-3.96−0.65
Electrical energy1.39−4.771.85-2.311.3
Table 3. Energy-saving opportunities.
ItemArea Saving MeasuresPotential Savings
Plant (%)Equipment (%)kWh/Month
1ManufacturingAdjust the production to a load factor of 77% to find a rate of electricity consumption of 0.9854 kWh/kg0.70566.204369,067.77
2ManufacturingAdjust the production to a load factor of 77% to find a gas consumption rate of 1.6 kWh/kg0.35233.671036,761.39
3ManufacturingAdjust the production to a load factor of 77% to find a coal consumption rate of 1.1 kWh/kg0.45762.786944,789.44
Table 4. Reference values for normalization of each impact category.
Impact CategoryUnitAmount
Climate changekg CO2 eq1.11
Ozone depletionkg CFC-11 eq1.17 × 10−10
Human toxicity, noncancer effectsCTUh2.17 × 10−6
Human toxicity, cancer effectsCTUh4.56 × 10−9
Particulate matterkg PM2.5 eq4.54 × 10−6
Ionizing radiation HHkBq U235 eq4.17 × 10−5
Photochemical ozone formationkg NMVOC eq7.33 × 10−6
Acidificationmolc H+ eq4.01 × 10−5
Terrestrial eutrophicationmolc N eq1.27 × 10−5
Freshwater eutrophicationkg P eq2.54 × 10−8
Marine eutrophicationkg N eq9.92 × 10−7
Freshwater ecotoxicityCTUe3.19 × 10−2
Land usekg C deficit1.04 × 10−4
Water resource depletionm3 water eq9.47 × 10−8
Mineral, fossil and ren resource depletionkg Sb eq7.60 × 10−9
Table 5. Normalized environmental impact.
Impact CategoryBase Case (%)Coal Case (%)Electrical Energy Case (%)Gase Case (%)
Climate change1.261.251.251.25
Ozone depletion9.80 × 10−39.87 × 10−39.88 × 10−39.88 × 10⁻³
Human toxicity, noncancer effects11.8511.8611.8811.88
Human toxicity, cancer effects1.911.971.971.97
Particulate matter9.46 × 10−20.109.87 × 10−20.10
Ionizing radiation HH4.17 × 10−24.65 × 10−24.65 × 10−24.65 × 10⁻²
Photochemical ozone formation4.02 × 10−24.14 × 10−24.08 × 10−24.15 × 10⁻²
Acidification8.46 × 10−28.59 × 10−28.02 × 10−28.60 × 10⁻²
Terrestrial eutrophication2.78 × 10−22.92 × 10−22.89 × 10−22.92 × 10⁻²
Freshwater eutrophication6.23 × 10−36.95 × 10−36.95 × 10−36.95 × 10⁻³
Marine eutrophication1.80 × 10−21.92 × 10−21.91 × 10−21.92 × 10⁻²
Freshwater ecotoxicity0.290.310.310.31
Land use4.47 × 10−44.99 × 10−44.99 × 10−44.99 × 10⁻⁴
Water resource depletion3.70 × 10−34.13 × 10−34.13 × 10−34.13 × 10⁻³
Mineral, fossil and ren resource depletion1.98 × 10−22.16 × 10−22.16 × 10−22.16 × 10⁻²
Table 6. Variables for comparison.
ICE ModelInstalled Capacity (kWe)Available Capacity (kWe)Generating Production (kWh/kg of Dry Paper)Purchase Network or Backup (kWh/kg of Dry Paper)Gas Consumption Generation (m3/kg of Dry Paper)
Case base----0.4129-
Option 1APG1000110010800.34930.06350.1019
Option 2JMS 320105010300.31590.09690.0928
Option 3QSK-60G140013800.38000.03290.1234

