Article

Nitrogen Fertilization and Harvest Timing Affect Switchgrass Quality

1
Oklahoma Agricultural Experiment Station Field and Research Service Unit, Stillwater, OK 74078, USA
2
Plant and Soil Sciences Department, Oklahoma State University, Stillwater, OK 74078, USA
*
Author to whom correspondence should be addressed.
Resources 2020, 9(6), 61; https://doi.org/10.3390/resources9060061
Submission received: 28 April 2020 / Revised: 25 May 2020 / Accepted: 26 May 2020 / Published: 28 May 2020
(This article belongs to the Special Issue Assessment of Biomass for Bioenergy)

Abstract

:
Early season switchgrass (Panicum virgatum L.) can be used as animal feed and mature late-season biomass as a biofuel feedstock. However, nitrogen (N) application and harvest timing effects on the quality of both end-use need further evaluation. This study evaluated the changes in nutritive quality for animal feed and biofuel feedstock, under different N application rates (0 to 235 kg N ha−1 yr−1) and different harvest times at a fixed N rate. Plant N removal increased with increasing N application rate (P < 0.05). The largest single difference (27%) was found between 0 and 33.6 kg N ha−1 application rates. Nitrogen removal decreased during subsequent harvests at a fixed N rate (P ≤ 0.0001). Forage quality was affected by N rates, although it was especially impacted by harvesting time. Fibers and most minerals in the biomass increased as accumulated growing degree days (AGDD) increased (P ≤ 0.0001), but N and total digestible nutrients (TDN) decreased as AGDD increased (P ≤ 0.0001). High crude protein and minerals with low fiber are desired forage qualities and the opposite is true for biofuel feedstock. Earlier harvests are beneficial for hay production or livestock grazing, and late-season harvests are better for biofuel production.

1. Introduction

Public interests in plant-based renewable fuels within the United States have been varied over the last decade or so, gaining or declining often based on oil production, fuel costs, and economic and political changes. There have been calls for the development of renewable transportation fuels for many years, in order to help mitigate environmental degradation and lessen greenhouse gas emissions [1,2,3]. Switchgrass (Panicum virgatum) has been identified as a viable source of sustainable biomass for fuel conversion [4,5], especially as a potential for liquid transportation fuel. Other potential uses that can be used for products like bioplastics and bioactive compounds prior to conversion for energy use also make it an attractive source of material, and potential for phytoremediation. [6,7,8,9,10,11]. Given an alternative fuel infrastructure and market for bio-based products, the development of practices for switchgrass management are desirable. A focus on a dual-use harvest management program, in which switchgrass biomass is harvested as forage in the early growing season, and harvested for biofuel feedstock later in the season, has been studied by Richner et al. [12], to develop production options for producers.
Managing switchgrass as a dual-use crop could be ideal for many areas of North America [13]. Switchgrass as biofuel biomass and forage hay would be attractive to growers desiring to use land unsuitable for other crops. Considering its wide adaptability across North America, Casler et al. [14] demonstrated that the latitude of origin of a switchgrass cultivar affects the yield potential and nutrient content of harvested biomass. Desirable quality required is dependent upon its intended end use [15,16]. Management decisions, such as fertilization and harvest timing, can affect biomass quality. High concentrations of nutrients in harvested biomass can cause fouling of processing equipment and produce a lower-quality fuel [17,18,19]. However, more nutrients, such as protein and minerals, and less fiber are preferred as feed for livestock consumption. Many studies have shown harvest timing had a greater effect on biomass quality and mineral content than nitrogen (N) fertilization [20,21,22,23]. Harvest timing and number of harvests per year can affect stand longevity and total yield of the stand [12,24,25,26,27].
Several parameters of plant biomass are often used to determine the forage quality for livestock uses. They can also be used in accessing quality for biofuel production. Common parameters used are crude protein (calculated from N content by multiplying N content by 6.25), mineral contents, acid detergent fiber (ADF), neutral detergent fiber (NDF), and total digestible nutrients (TDN). Neutral detergent fiber measures the fibrous fraction of the forage, comprised of cellulose, hemicellulose, and lignin. These components are the slowly digestible and indigestible parts of the plant, so it is directly linked to animal intake of the forage. Acid detergent fiber measures the cellulose and lignin component of the plant, and determines forage digestibility for livestock. As ADF increases, total digestibility will decrease. Total digestible nutrient is a measure of energy that can be derived from the forage and is calculated using ADF values [12,28]. Nutrient contents of harvested biomass also affect the quality and its use. Nutrient concentration within the plant can greatly affect the quality of biofuel produced and the conversion process. A large amount of nutrients in the biomass, especially N, is known to cause fouling of equipment [19,29]. On the other hand, higher nutrient concentrations in the forage would be desirable for livestock consumption. The desired qualities for the two different uses are in opposition to one another. This makes harvest timing critical, as concentrations of quality parameters change with morphological and phenological growth stages during the growing season.
Fertilization and harvest timing can affect switchgrass biomass quality. These two management practices can be used in producing quality switchgrass for biofuel production or as forage. The objectives of this study were to evaluate how N rates affect N, ADF, NDF and TDN contents, and to monitor selected quality parameters during the growing season, by harvesting switchgrass at different accumulated growing degree days (AGDD) to aid the decision on final use.

2. Materials and Methods

2.1. Experiment Design and Treatment Description

A nitrogen (N) fertilization study was initiated in 2008 in Stillwater, OK, in a previously established Kanlow switchgrass stand (36°08′01.54″ N: 97°06′17.16″ W), using eight N rates (0, 33.6, 67.2, 100.8, 134.4, 168.0, 201.6, and 235 kg N ha−1) in a randomized complete block design (RCBD) with 4 replications. Each plot measured 6.1 × 6.1 m and was fertilized each year after soil sampling in the spring. Nitrogen was applied manually as urea (46-0-0). The N input was a single application when rates were ≤ 67.2 kg N ha−1, and a split-application when rates were ≥ 100.8 kg N ha−1. The 67.2 kg N ha−1 or less rate was applied in mid-March and the remaining N of other treatments was applied in early May to reach total N needed. Triple superphosphate (TSP; 0-46-0) was applied only to individual plots where soil test P was deficient, in order for mitigate any N × P interaction. The soil at the site is a Norge loam (fine silty, mixed, active, and thermic Udic Paleustoll) [30].

2.2. Soil Analysis

Soil samples were collected from a 0 to 15 cm soil layer from each plot before fertilization each year (Table 1). Samples were oven-dried at 65 °C for 24 h and ground to pass through a 2-mm sieve. Soil pH was measured with an electrode in a 1:1 soil:water suspension. Plant available N was extracted by 1M KCl and analyzed by a flow-injection analyzer [31]. Plant available phosphorus (P), potassium (K), calcium (Ca), and magnesium (Mg) were extracted using a Mehlich-3 solution [32]. Sulfate-S was extracted by 0.008M calcium phosphate. Micronutrients iron (Fe), zinc (Zn), boron (B), and copper (Cu) were extracted by DPTA-Sorbitol [33]. All nutrients in the extracts were quantified by a Spectro inductively coupled plasma (ICP) spectrometer [34]. The soil pH and nutrient contents were consistent and slightly or not different across years, as per the standard deviation (Table 1). These ensured treatments were different and affected only by the nitrogen rates and harvest timing.

2.3. Switchgrass Biomass Harvest Sampling

Research plots (6.1 × 6.1 m) were divided into two subplots, each 3.0 × 6.1 m for separate sampling (harvest) regimes. One subplot was harvested using a flail harvester as a single harvest after senescence and killing frost in November of each year and analyzed for biomass nutrient composition. The other subplot was further divided into 0.9 × 3.0 m sections to harvest at pre-determined intervals during the year. These temporal harvests were hand-harvested with garden shears and prepared for nutrient analysis.
In four replications of one N rate each year, harvest date was used as a treatment to evaluate biomass quality throughout the growing season. Therefore, the average N rate of 134.4 kg N ha−1 for 2008, 2009, and 2010 has been chosen for the temporal sampling from June to February or March of the following year. The harvest dates, accumulated growing degree days (AGDD) since Jan. 1 of each year, and growth stages [35,36] are listed in Table 2. Growing degree days were calculated as shown in Equation (1) [21].
GDD = [(maximum daily temperature + minimum daily temperature)/2] − 10 °C,
Daily maximum and minimum temperatures in Stillwater (2008, 2009 and 2010) were obtained from the Oklahoma Mesonet [37]. Accumulated growing degree days was calculated by summing positive GDD (GDD > 0), beginning January 1 of each year [6,9]. The mean growth stage count (MSC) in Table 2 was calculated using Equation (2) [36].
MSC = [0.875 + (0.0017 × AGDD)],
Switchgrass growth stages and descriptions are found in Moore et al. [36], and MSC values of 0.0 to 4.9 were used to describe switchgrass growth stages (Table 2). Estimated MSC > 4.9 were listed as “post-ripening/senescence” in our study, since some harvests took place after physiological maturity and senescence.

2.4. Sample Preparation for Nutrient Analysis and Biomass Quality

Switchgrass plant samples were chopped and ground to pass through a 1.0-mm sieve. Acid detergent fiber (ADF) and neutral detergent fiber (NDF) were determined by the filter bag technique [15]. Total digestible nutrient (TDN) is a measure of forage energy and was calculated from ADF values: TDN = [98.625 − (1.048 × ADF)], as per Ashworth et al. [16] Plant samples were digested with nitric acid (HNO3) for mineral nutrients, in which 0.5 g of ground plant materials were predigested for 1 h with 10 mL of trace metal grade HNO3 in the HotBlock™ Environmental Express block digester. The digestion products were then heated to 115 °C for 2 h and diluted with deionized water to 50 mL [38]. Digested samples were analyzed by an ICP for P, K, Ca, Mg, S, Cu, Fe, Zn, and Mn. Total N was determined with a carbon/nitrogen (C/N) dry combustion analyzer.

2.5. Statistical Analysis

Differences in biomass quality indices and nutrient content were determined using analysis of variance (ANOVA) and Duncan’s multiple range test. Only a few outliers were removed from the replication dataset of treatments by using IML and UNIVARIATE (ROBUSTSCALE) procedures of the SAS program, and the statistical analyses were performed with n = 3 for those specific treatments [39]. To evaluate biomass quality as affected by N rates and harvest date, regression analyses were performed for all replicated data by fertilizer rates, and by harvest date in AGDD. Nitrogen and mineral concentrations were evaluated for all study years, but ADF, NDF and TDN were evaluated for 2009 and 2010. Trend analysis was conducted using best-fit models determined from linear and quadratic regression by level of significance, using P ≤ 0.05. The higher level of significance for each model (lower P-value) was used to determine a best-fit model, using the PROC REG procedure in SAS ver. 9.4. Equation coefficients of each model were tested for significance as well (Tables S1–S4, Supplementary Material).

3. Results

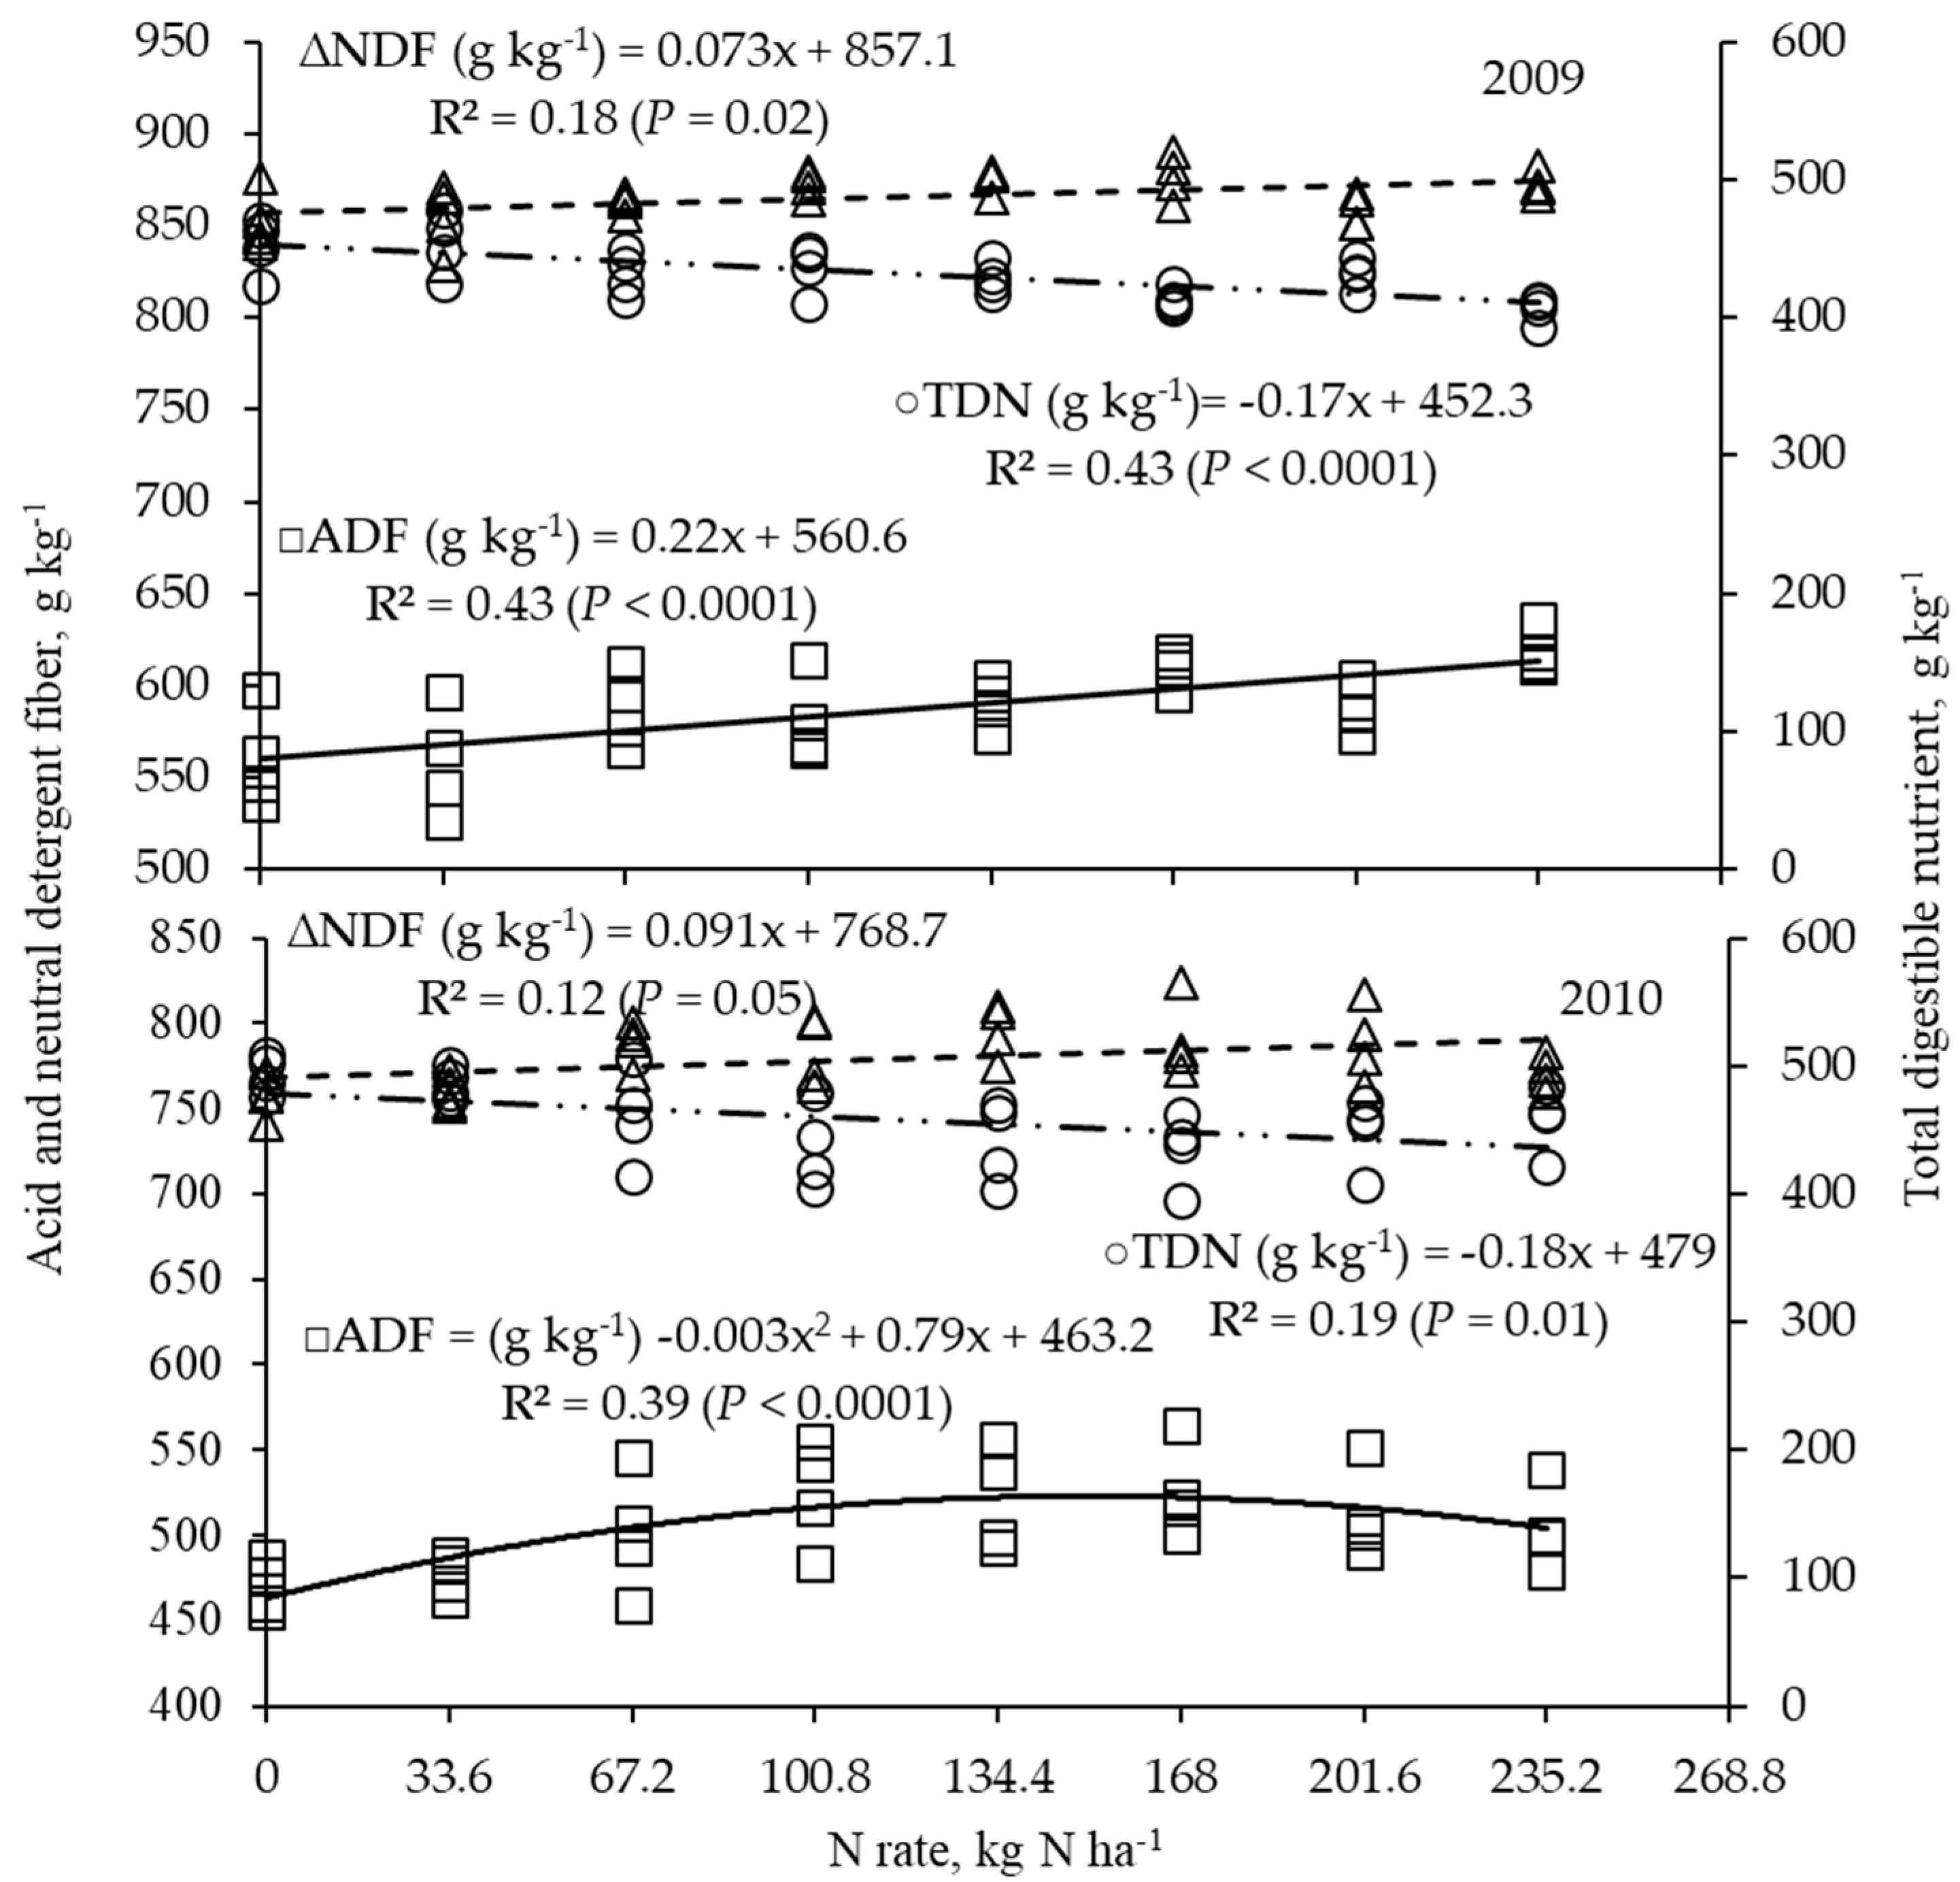
3.1. Biomass Quality Parameters as Affected by Nitrogen Fertilization Rates

The relationships between N, ADF, NDF and TDN in plant biomass harvested at maturity and N application rates are shown in Figure 1 and Figure 2. Regression analysis indicated increases in N (P = 0.002 in 2008 and 2009, and P = 0.03 in 2010) (Figure 1), ADF (P < 0.0001 in 2009, and P < 0.0001 in 2010), and an increase or no change in NDF (P = 0.02 in 2009, and P = 0.05 in 2010) (Figure 2) as N application rates increased. Trend analysis showed decreases in TDN (P < 0.0001 in 2009, and P = 0.01 in 2010) by N application rate (Figure 2). In the 2009 study year, ADF tended to increase with increasing N fertilization, from a low value of 536 g kg−1 in the control to a high value of 636 g kg−1 with 235.2 kg N ha−1 of input. A numerical increase in NDF was seen with increased N rates, ranging from 829 g kg−1 for 33.6 kg N ha−1 to 890 g kg−1 for 168.0 kg N ha−1 applied. Total digestible nutrients tended to decrease as N rate increased from 394 g kg−1 at 235.2 kg N ha−1 to 472 g kg−1 at 0 kg N ha−1 (Figure 2).
In 2010, no forage analysis was significantly affected by N application rates using ANOVA and PROC GLM. This could be a lack of need for N fertilizer applications in native prairie grasses, as they evolved without additional fertilization [40,41]. Acid detergent fiber tended to increase to a high of 564 g kg−1 at 168 kg N ha−1 applied, then decreased. The data appeared to be widely scattered. Neutral detergent fiber followed a similar pattern to ADF, reaching a maximum average of 796 g kg−1 at 134.4 kg N ha−1. The highest individual value for NDF was 824 g kg−1 at 168.0 kg N ha−1. Total digestible nutrients decreased slowly with an increased N rate to an average of 435 g kg−1 at 100.8 kg N ha−1. Total digestible nutrients reached a high of 509 g kg−1 at 0 kg N ha−1, and an individual low value of 403 g kg−1 at 134.4 kg N ha−1. Significant differences were not identified in N concentration and other forage quality parameters by nitrogen rate, although significant linear trends were found in all regression analyses, except for NDF in 2009 (P = 0.076).

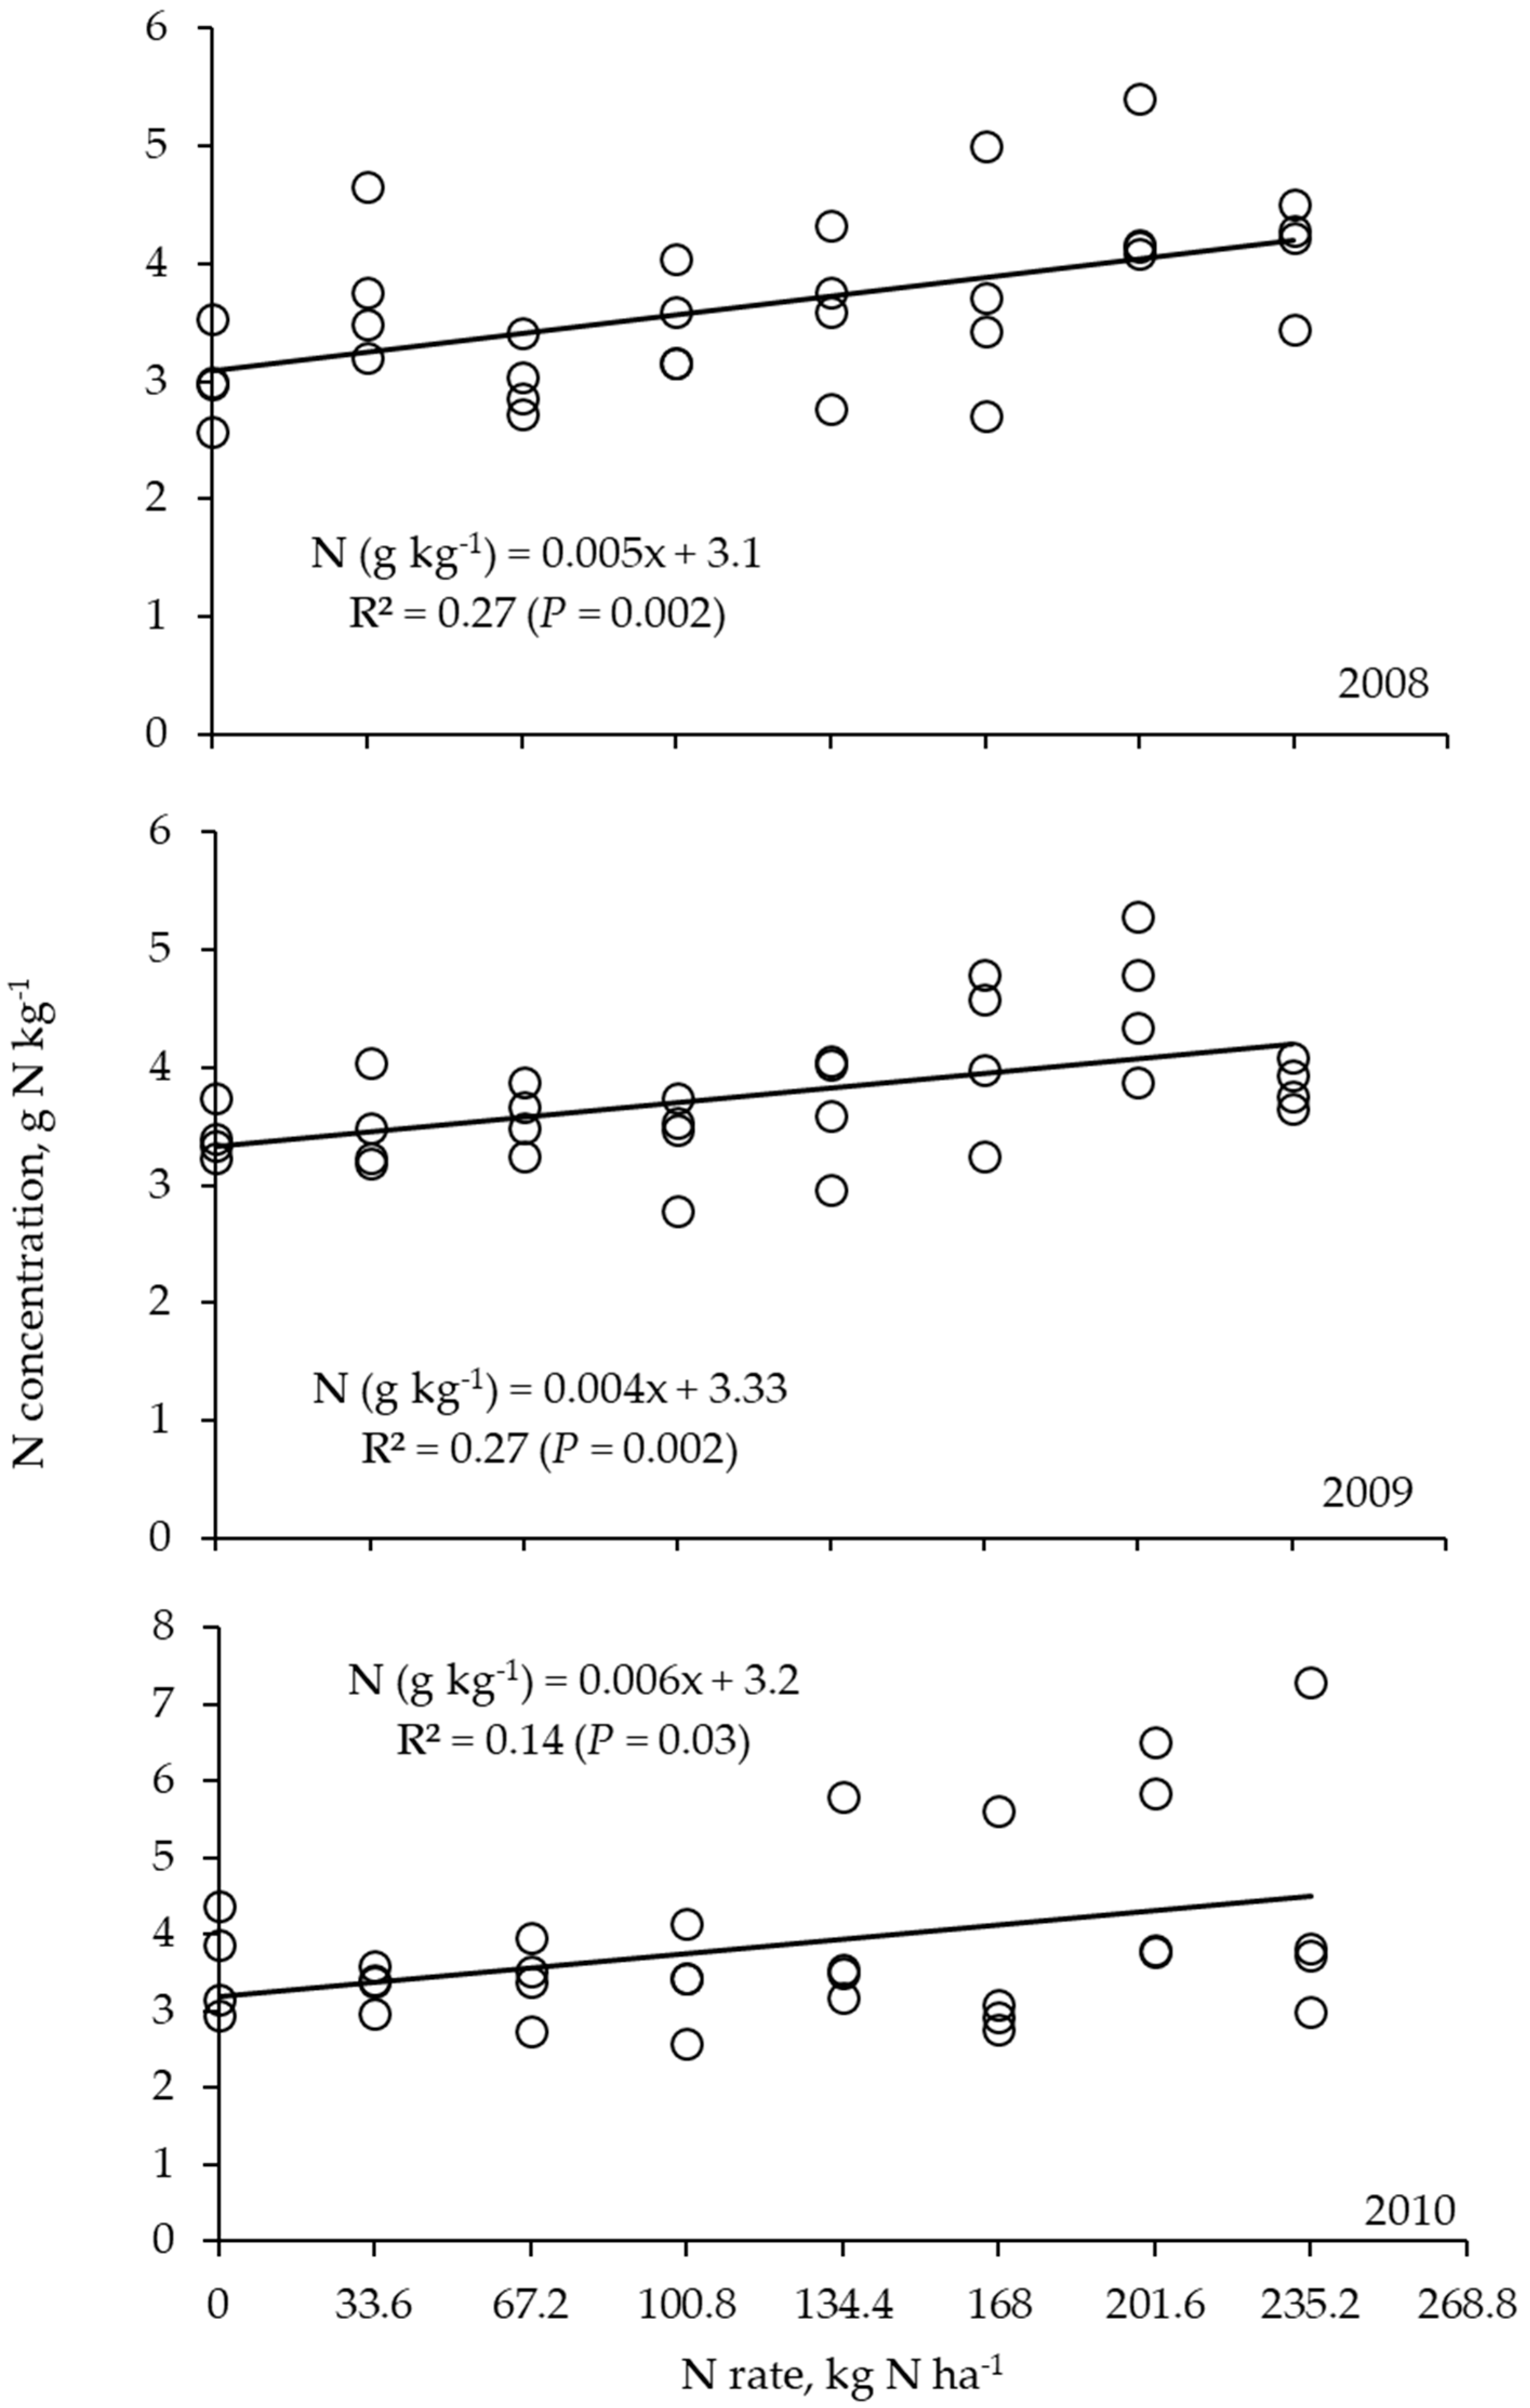
3.2. Mineral Concentration as Affected by Nitrogen Fertilization Rates

Mineral concentrations of harvested biomass at maturity had no significant differences with respect to N rates, with a few exceptions (Table 3). In 2008, nitrogen concentration within harvested biomass increased significantly (P = 0.013) with increasing N rates, from an average of 3.02 g kg−1 in the control to 4.44 g kg−1, with the application of 201.6 kg N ha−1. The largest single increase in N occurred between the control plot and the lowest N rate, 33.6 kg N ha−1, from 3.02 g kg−1 to 3.78 g kg−1 (Table 3). Phosphorus and potassium concentrations did not change significantly by N rates (P > 0.05). Other differences in nutrient concentrations due to N rate were insignificant (P > 0.05). There were significant differences according to Duncan’s multiple range test in Mg between the 67.2 and 134.4 kg N ha−1 rates, and in Cu between the 33.6 and 67.2 kg N ha−1 rates in 2008.
In 2009, significant differences were shown in N and P (P = 0.012 and 0.0003, respectively). Nitrogen concentration (g kg−1) tended to increase with increasing N rate, from an average of 3.43 g kg−1 for the control to 4.57 g kg−1 for the 201.6 kg N ha−1 rate, then decreasing at the 235.2 kg N ha−1 rate to 3.86 g kg−1. Phosphorus concentration decreased with increasing N rate, ranging from 0.41 to 0.80 g kg−1.
In 2009, more significant differences were seen in K, Ca, Mg, S, Cu, Fe, Zn and Mn; often with one rate being significantly different from others according to Duncan’s multiple range test. P-values of all micronutrients except Cu were insignificant (Table 3). In 2010, no significant differences in macronutrient concentration between N rates were found. Significant differences (P < 0.05) in 2010 were only shown in Zn. Differences in concentration by Duncan’s multiple Range tests in secondary and micronutrient concentrations were shown in P, S, and Zn among N treatments. In similar studies focused on switchgrass nutrient concentration, response to N fertilization was shown to be insignificant for most parameters [42].

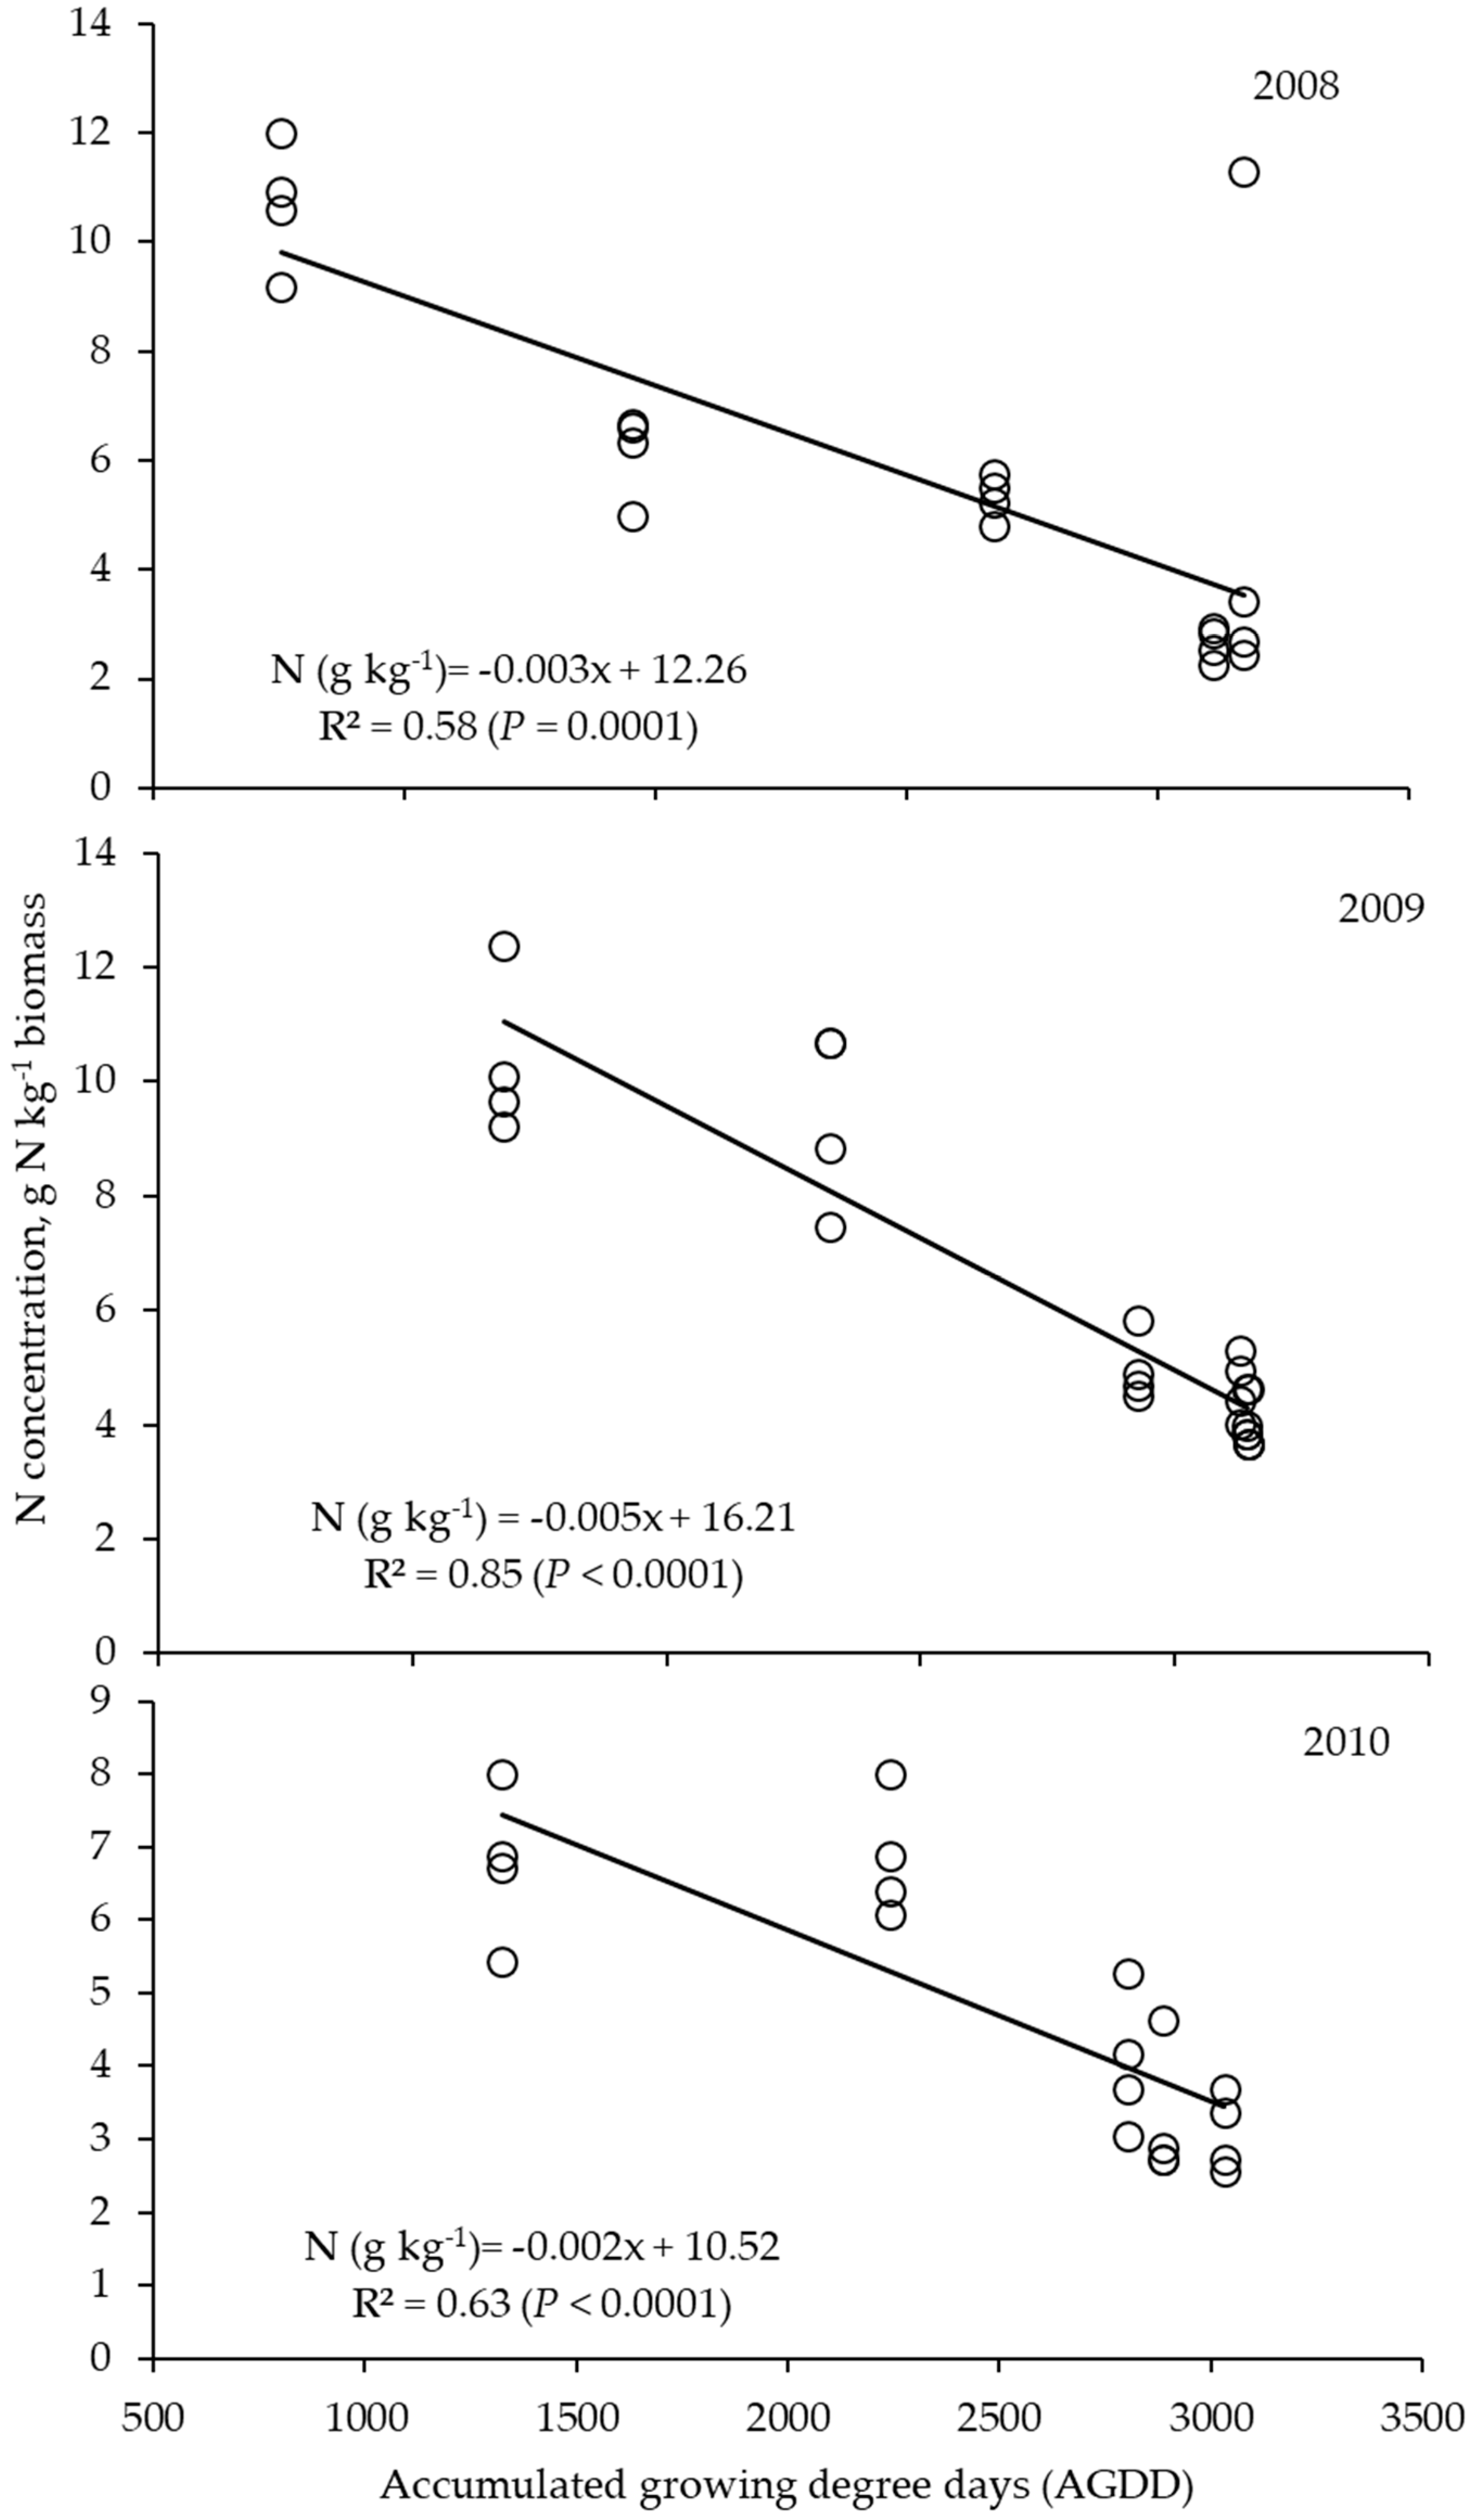
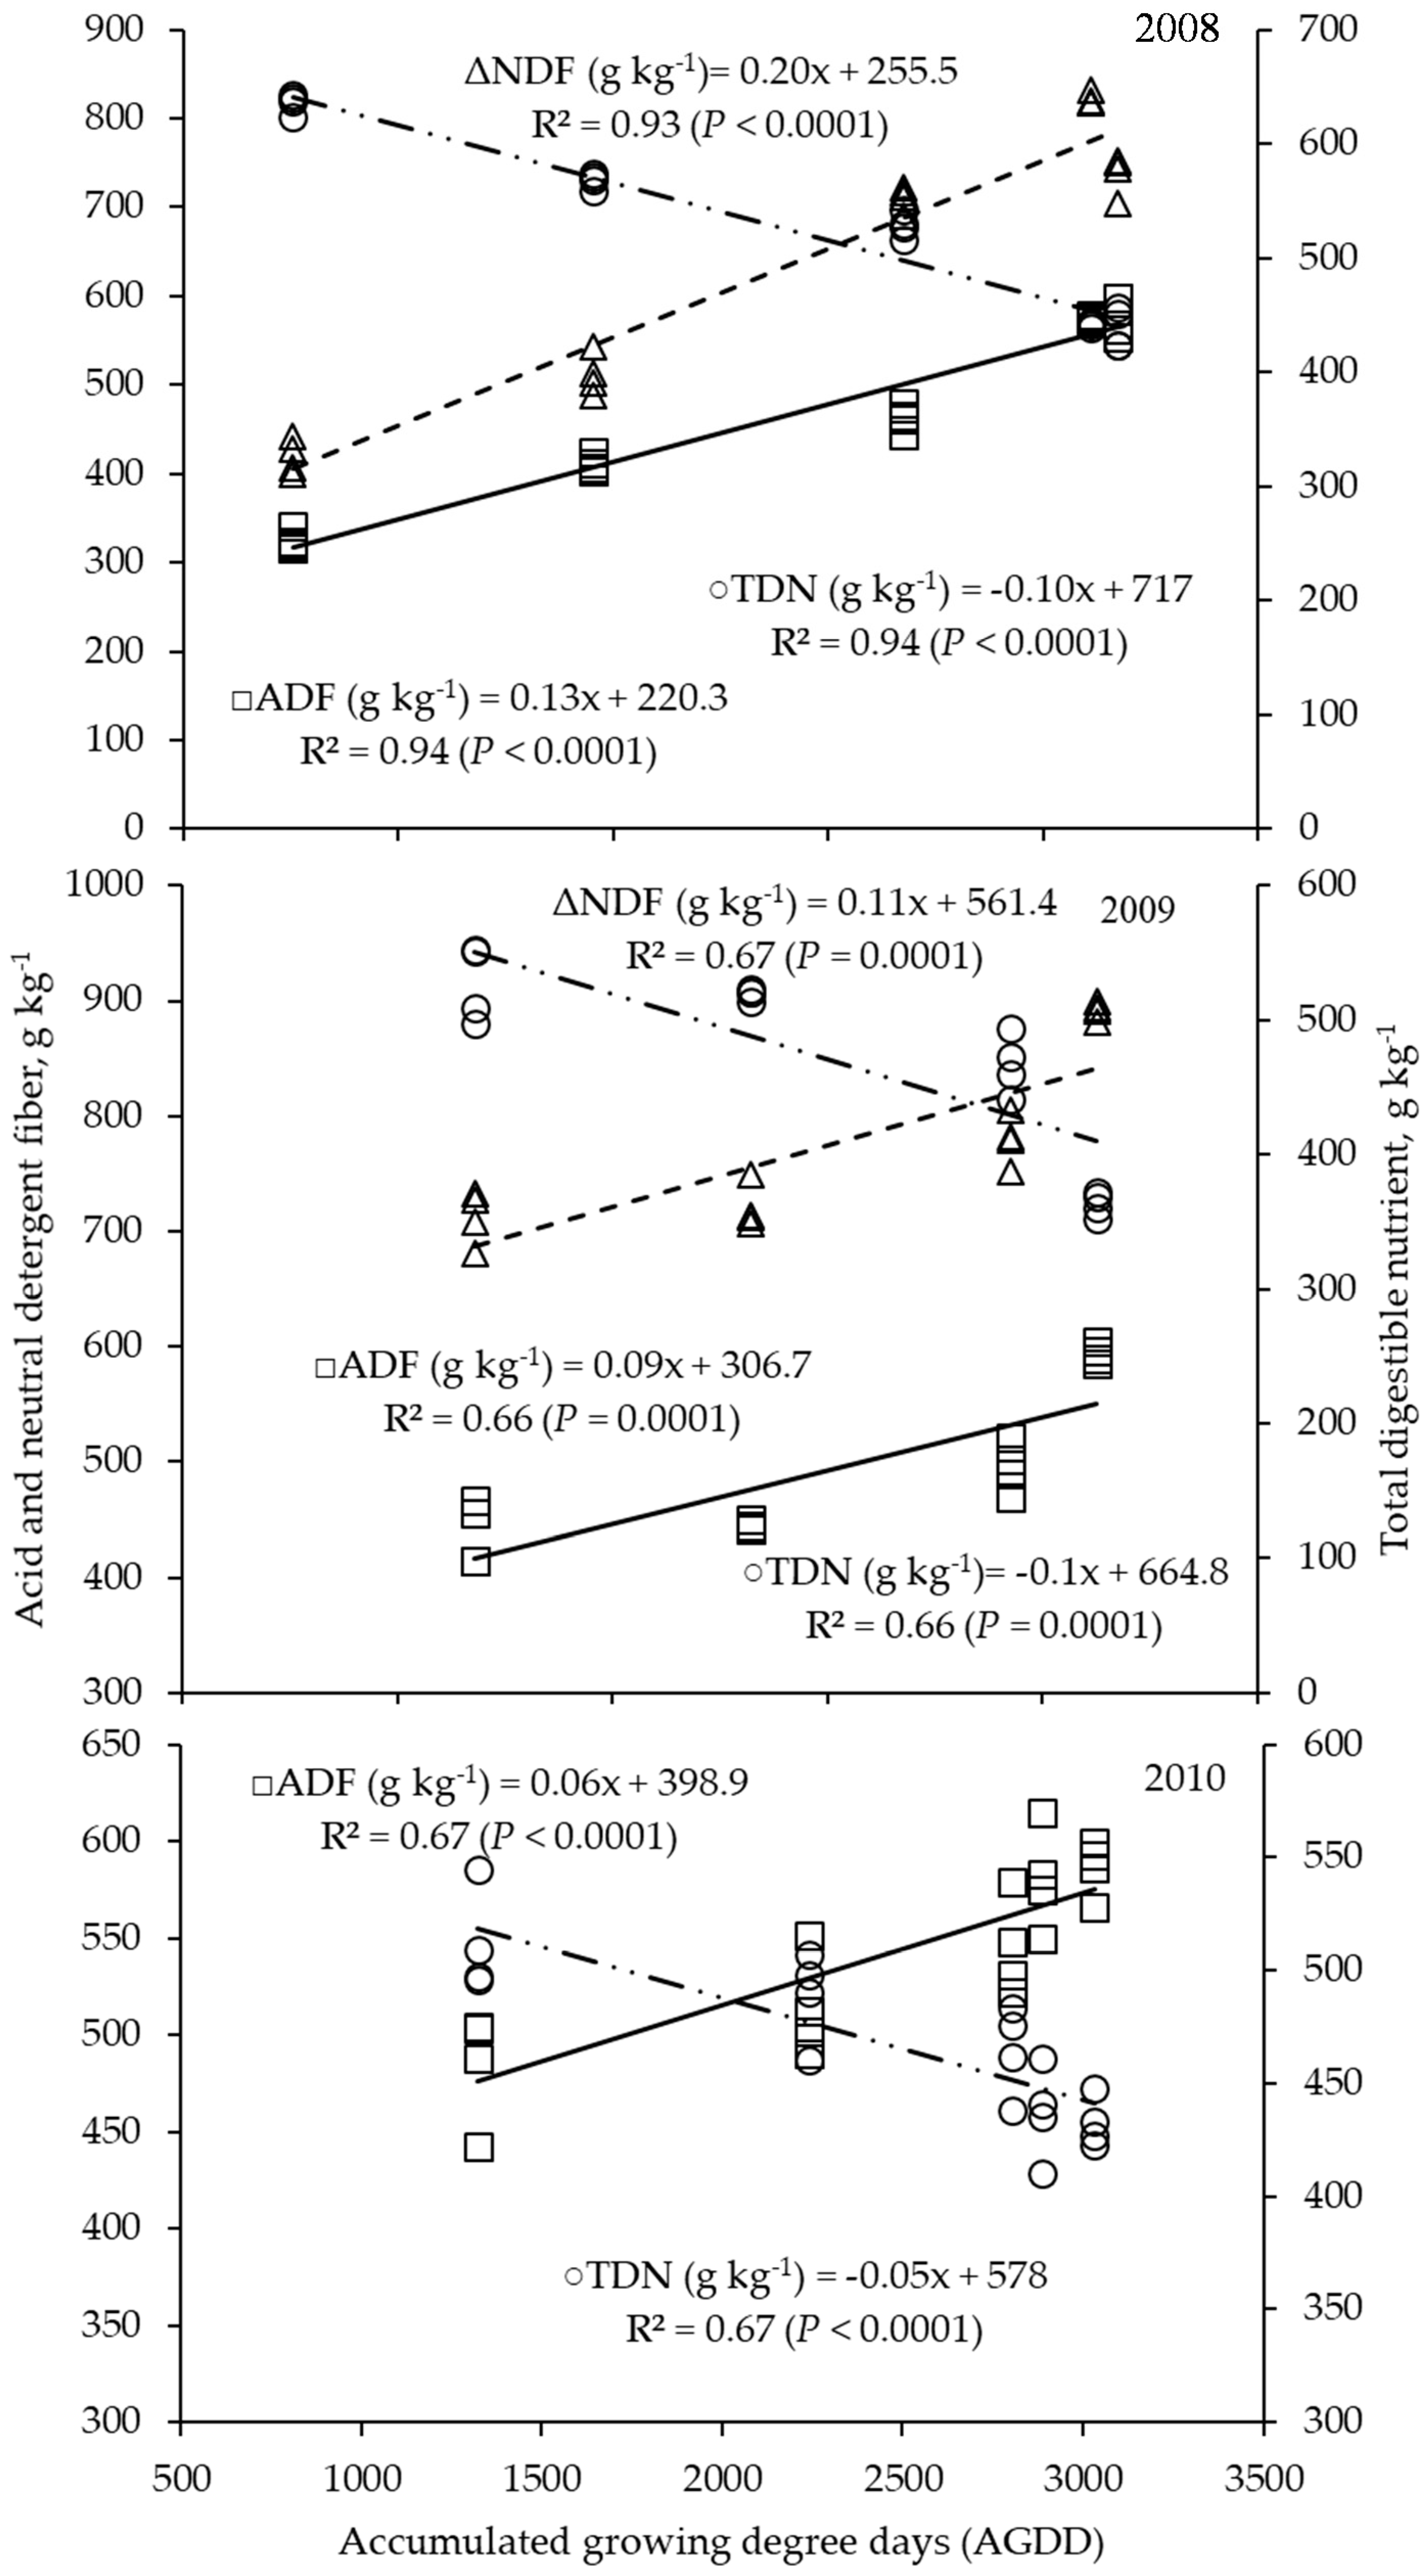
3.3. Biomass Quality Parameters as Affected by AGDD

The relationship between tested quality parameters (N, ADF, NDF, and TDN) and AGDD are shown in Figure 3 and Figure 4. Parameters ADF and NDF tended to increase with maturity as the harvesting date got later and AGDD increased (P < 0.0001). These results were similar to Sena et al. [15], who found that the NDF exhibited a consistent positive trend through the end of the growing season, and that the ADF increased consistently through the season in two switchgrass cultivars.

3.4. Mineral Concentration as Affected by Accumulated Growing Degree Days

Significant differences in mineral concentrations existed among biomass harvested with various AGDD (Table 4). In 2008, all mineral concentrations analyzed showed significant differences (P < 0.05) by AGDD. In most cases, mineral concentrations of nutrients decreased with increasing AGDD. Significant differences were shown in all nutrients except Fe in 2009. For the 2010 season, significant differences were seen in all minerals, except in Ca and Fe. Significant differences were not detected in Ca and Fe in 2010. In 2010, phosphorus, sulfur and manganese were not analyzed due to errors in laboratory analysis and lack of data. Significant variation in annual and field-to-field production has been shown in other studies [43].

4. Discussion

Acid detergent fiber and neutral detergent fiber increased with increasing N rates. Total digestible nutrients generally decreased with increasing fertilizer N rates. These trends of decreases in TDN and increases in ADF and NDF with increased N fertilization may be due more to the late single harvest rather than N fertilization rates. It would be expected that N applications would encourage a delayed growth response, because of adequate N provided. With lower stress to the plant due to fertilization, maturity and seed production was delayed, therefore more vegetative growth with N fertilization would be expected [40].
The concentration of N in the biomass generally increased with increasing fertilizer N rates, regardless of the study year. In each year, the highest mean N concentration was found in plots receiving the 201.6 kg N ha−1. Nitrogen concentration in harvested biomass can significantly affect the quality to meet the final use of the crop. High concentrations of nutrients, especially N, can cause fouling of equipment in the biofuel conversion process [17], thus lignin and cellulose with low nutrient content is needed for biofuel conversion. Nutrients and protein are desirable for livestock consumption. Therefore, harvest for biofuel feedstock should take place after senescence to avoid high N in the biomass [19,44].
Those trends in NDF and ADF in switchgrass in our study were also similar to NDF and ADF trends reported by Aurangzaib et al. [45], and Kering et al. [27]. Nitrogen and TDN, on the other hand, decreased with increasing AGDD and later harvest date (P < 0.001) (Figure 3 and Figure 4). Commonly, nitrogen and nonstructural carbohydrates decline, and lignin and cellulose increase through the growing season of switchgrass [45]. These changes are gradually taking place with plant growth as it moves to maturity and completes its cycle of producing seed.
The ADF and NDF in biomass harvested after flowering and senescence are high, whereas N and TDN have all decreased to low levels. These high ADF and NDF provide lignocellulosic material needed for biofuel conversion. The low N and other nutrients are considered favorable because large concentrations of nutrients can foul conversion equipment used in biofuel production. Therefore, monitoring the quality before harvest may be beneficial to determine the appropriate use, grazing and hay for livestock use or biomass feedstock for biofuel production [46].
Biomass harvested after a killing frost would be mostly fibrous with low nutritive value. Switchgrass harvested at this late time of maturity makes a very low-quality hay with low crude protein and high fiber contents and is likely unpalatable to livestock [12,16]. The high ADF and NDF of late-harvested biomass, however, is more desirable in lignocellulosic biofuel conversion [47]. If the end-use is for biofuel feedstock, this would suggest higher fertilization rates can increase biomass yields with high lignin and cellulose content if harvested late [48]. Low ADF and NDF and high N (crude protein) and TDN would be better for livestock feeding. Total digestible nutrient is a measure of the energy value of the hay and is inversely related to ADF. Lower ADF and NDF would indicate more digestibility and forage intake by animals, with less plant cell wall fibrous materials, making forage more palatable and a greater amount consumed and digested [12,49]. A high-quality livestock forage should have ADF < 300 g kg−1, NDF < 400 g kg−1, and TDN > 600 g kg−1 and N > 30 g kg−1 [16], but the late-harvested, i.e., post senescence, switchgrass is far from considered a quality forage. Therefore, earlier harvest, prior to reproductive growth stages, perhaps early July, should be considered if feeding switchgrass to livestock is desired.
Similar to Sena et al. [15] and Ashworth et al. [44], N concentration in switchgrass was high if harvested in the early season (May–June), and declined throughout the rest of the growing season. Generally, mineral concentration in the plant decreases as the season progresses, as would be expected in native perennial grasses. All mineral analyses indicated decreases in mineral concentration with increasing AGDD. Not all decreases are significant based on Duncan’s multiple range test; such as P, Ca, and S in 2010 and Fe in 2009 and 2010. As previously mentioned, year-to-year variation is not uncommon in switchgrass [41,43]. These types of decreases have been shown in another study regarding harvest timing as well [50]. Since mineral concentrations decreased as AGDD increased, harvesting at earlier growing season with lower AGDD would preserve more nutrients and favor forage use, while a later season harvest with higher AGDD would offer more desired quality for biofuel production.

5. Conclusions

Acid detergent fiber, neutral detergent fiber, total digestible nutrient, and nitrogen (or crude protein) and mineral concentrations were affected by N application rates for switchgrass production. Those quality parameters were especially impacted by harvesting time. Overall, fibers and most minerals in the biomass increased as AGDD increased, but N and TDN decreased as AGDD increased. Since high crude protein and minerals, and low fiber are desired forage quality and the opposite is true for biofuel feedstock, earlier harvests are beneficial for hay production or livestock forage grazing, and late-season harvests are better for biofuel production. Our results are consistent with the literature concerning forage quality patterns throughout the growing season, therefore, these trends will help in the decision-making for switchgrass management for biomass and/or forage.

Supplementary Materials

The following are available online at https://www.mdpi.com/2079-9276/9/6/61/s1, Table S1: Equation parameters of linear regression models between nitrogen (N) concentrations in switchgrass biomass as a function of the amount of N applied in 2008, 2009, and 2010, Table S2: Equation parameters between acid detergent fiber (ADF), neutral detergent fiber (NDF), and total digestible nutrients (TDN) and nitrogen application rates in 2009 and 2010, Table S3: Equation parameters of linear regression models between nitrogen (N) concentrations in switchgrass biomass as a function of accumulated growing degree days (AGDD) in 2008, 2009, and 2010, Table S4. Equation parameters between acid detergent fiber (ADF), neutral detergent fiber (NDF), and total digestible nutrients (TDN) and accumulated growing degree days (AGDD) in 2008, 2009, and 2010.

Author Contributions

Conceptualization, J.M. and H.Z.; methodology, J.M. and H.Z.; software, J.A.; validation, J.M., J.A. and H.Z.; formal analysis, J.A.; investigation, J.M. and J.A.; resources, J.M.; data curation, J.M.; writing—original draft preparation, J.M.; writing—review and editing, J.A. and H.Z.; visualization, J.M.; supervision, H.Z.; project administration, H.Z.; funding acquisition, H.Z. All authors have read and agreed to the published version of the manuscript.

Funding

This research was partially funded by the Oklahoma Bioenergy Center and Oklahoma Agriculture Experiment Station.

Conflicts of Interest

The authors declare no conflict of interest.

References

  1. Nikièma, P.; Rothstein, D.E.; Min, D.H.; Kapp, C.J. Nitrogen fertilization of switchgrass increases biomass yield and improves net greenhouse gas balance in northern Michigan, U.S.A. Biomass Bioenerg. 2011, 35, 4356–4367. [Google Scholar] [CrossRef]
  2. Zhenmin, L.; Espinosa, P. Tackling climate change to accelerate sustainable development. Nat. Clim. Chang. 2019, 9, 494–496. [Google Scholar] [CrossRef]
  3. Moosmann, L.; Urruita, C.; Siemons, A.; Cames, M.; Schneider, L. International Climate Negotiations: Issues at Stake in View of the COP25 UN Climate Change Conference in Madrid. Available online: http://www.europarl.europa.eu/supporting-analyses (accessed on 8 May 2020).
  4. McLaughlin, S.B.; Kszos, L.A. Switchgrass as a bioenergy crop. In Encyclopedia of Plant and Crop Science; Goodman, R.M., Ed.; CRC Press: Boca Raton, FL, USA, 2004; Volume 1, pp. 1207–1212. [Google Scholar]
  5. McLaughlin, S.B.; Kszos, L.A. Development of switchgrass (Panicum virgatum) as a bioenergy feedstock in the United States. Biomass Bioenerg. 2005, 28, 515–535. [Google Scholar] [CrossRef]
  6. Wright, L. Worldwide commercial development of bioenergy with a focus on energy crop-based projects. Biomass Bioenerg. 2006, 30, 706–714. [Google Scholar] [CrossRef]
  7. Keshwani, D.R.; Cheng, J.J. Switchgrass for bioethanol and other value-added applications: A review. Bioresour. Technol. 2009, 100, 1515–1523. [Google Scholar] [CrossRef] [PubMed] [Green Version]
  8. Brown, C.; Griggs, T.; Keene, T.; Marra, M.; Skousen, J. Switchgrass biofuel production on reclaimed surface mines: I. Soil quality and dry matter yield. Bionerg. Res. 2016, 9, 31–39. [Google Scholar] [CrossRef] [Green Version]
  9. Vaneeckhaute, C.; Meers, E.; Michels, E.; Ghekiere, G.; Accoe, F.; Tack, F.M.G. Closing the nutrient cycle by using bio-digestion waste derivatives as synthetic fertilizer substitutes: A field experiment. Biomass Bioenerg. 2013, 55, 175–189. [Google Scholar] [CrossRef] [Green Version]
  10. Priefer, C.; Jörissen, J.; Frör, O. Pathways to shape the bioeconomy. Resources 2017, 6, 10. [Google Scholar] [CrossRef] [Green Version]
  11. Jeke, N.N.; Zvomuya, F.; Ross, L. Accumulation and partitioning of biomass, nutrients, and trace elements in switchgrass for phytoremediation of municipal biosolids. Int. J. Phytoremediat. 2016, 18, 892–899. [Google Scholar] [CrossRef]
  12. Richner, J.M.; Kallenbach, R.L.; Roberts, C.A. Dual use switchgrass: Managing switchgrass for biomass production and summer forage. Agron. J. 2014, 106, 1438–1444. [Google Scholar] [CrossRef]
  13. Mosali, J.; Biermacher, J.T.; Cook, B.; Blanton, J. Bioenergy for cattle and cars: A switchgrass production system that engages cattle producers. Agron. J. 2013, 105, 960–966. [Google Scholar] [CrossRef] [Green Version]
  14. Casler, M.D.; Vogel, K.P.; Taliaferro, C.M.; Wynia, R.L. Latitudinal adaptation of switchgrass populations. Crop Sci. 2004, 44, 293–303. [Google Scholar] [CrossRef]
  15. Sena, K.L.; Goff, B.; Davis, D.; Smith, S.R. Switchgrass growth and forage quality trends provide insight for management. Crop Forage Turfgrass Manag. 2018, 4, 170053. [Google Scholar] [CrossRef]
  16. Ashworth, A.; Moore, P.; King, R.; Pote, D.; Douglas, J.; Jacobs, A. Switchgrass nitrogen fertility response and nutrient cycling in a hay system. Agron. J. 2020. [Google Scholar] [CrossRef] [Green Version]
  17. Heaton, E.A.; Dohleman, F.G.; Long, S.P. Seasonal nitrogen dynamics of Miscanthus x giganteus and Panicum virgatum. GCB Bioenerg. 2009, 1, 297–307. [Google Scholar] [CrossRef]
  18. Anderson, E.K.; Parrish, A.S.; Voight, T.B.; Owens, V.N.; Hong, C.H.; Lee, D.K. Nitrogen fertility and harvest management of switchgrass for sustainable bioenergy feedstock production in Illinois. Ind. Crops Prod. 2013, 48, 19–27. [Google Scholar] [CrossRef]
  19. Ibrahim, M.; Hong, C.O.; Singh, S.; Kumar, S.; Osborne, S.; Owens, V. Switchgrass biomass quality as affected by nitrogen rate, harvest time, and storage. Agron. J. 2017, 109, 86–96. [Google Scholar] [CrossRef] [Green Version]
  20. Madakadze, I.; Stewart, K.; Peterson, P.; Coulman, B.; Samson, R.; Smith, D. Light interception, use-efficiency and energy yield of switchgrass (Panicum virgatum L.) grown in a short season area. Biomass Bioenerg. 1998, 15, 475–482. [Google Scholar] [CrossRef]
  21. Sanderson, M.A.; Moore, K.J. Switchgrass morphological development predicted from day of the year or degree day models. Agron. J. 1991, 91, 732–734. [Google Scholar] [CrossRef]
  22. Vogel, K.P.; Brejda, J.J.; Walters, D.T.; Buxton, D.R. Switchgrass biomass production in the Midwest USA. Agron. J. 2002, 94, 413–420. [Google Scholar] [CrossRef]
  23. Casler, M.D.; Boe, A.R. Cultivar × environment interactions in switchgrass. Crop Sci. 2003, 43, 2226–2233. [Google Scholar] [CrossRef] [Green Version]
  24. Parrish, D.J.; Fike, J.H. The biology and agronomy of switchgrass for biofuels. Crit. Rev. Plant Sci. 2005, 24, 423–459. [Google Scholar] [CrossRef]
  25. Aravindhakshan, S.C.; Epplin, F.M.; Taliaferro, C.M. Switchgrass, bermudagrass, flaccidgrass, and lovegrass biomass yield response to nitrogen for single and double harvest. Biomass Bioenerg. 2011, 35, 308–319. [Google Scholar] [CrossRef]
  26. Guretzky, J.A.; Biermacher, J.T.; Cook, B.J.; Kering, M.K.; Mosali, J. Switchgrass for forage and bioenergy: Harvest and nitrogen rate effects on biomass yields and nutrient composition. Plant Soil 2011, 339, 69–81. [Google Scholar] [CrossRef] [Green Version]
  27. Kering, M.K.; Guretzky, J.A.; Interrante, S.M.; Butler, T.J.; Biermacher, J.T.; Mosali, J. Harvest timing affects switchgrass production, forage nutritive value, and nutrient removal. Crop Sci. 2013, 53, 1809–1817. [Google Scholar] [CrossRef] [Green Version]
  28. Moore, J.E. Forage Quality Indices: Development and Application. In Forage Quality, Evaluation, and Utilization, 1st ed.; Fahey, G.C., Jr., Ed.; ASA, CSSA, and SSSA: Madison, WI, USA, 2015; pp. 967–998. [Google Scholar] [CrossRef]
  29. McKendry, P. Energy production from biomass (part 1): Overview of biomass. Bioresour. Technol. 2002, 83, 37–46. [Google Scholar] [CrossRef]
  30. Web Soil Survey. Available online: https://websoilsurvey.sc.egov.usda.gov/App/HomePage.htm (accessed on 10 October 2019).
  31. Kachurina, O.; Zhang, H.; Raun, W.; Krenzer, E. Simultaneous determination of soil aluminum, ammonium- and nitrate-nitrogen using 1 M potassium chloride extraction. Commun. Soil Sci. Plant Anal. 2000, 31, 893–903. [Google Scholar] [CrossRef]
  32. Mehlich, A. Mehlich 3 soil test extractant: A modification of Mehlich 2 extractant. Commun. Soil Sci. Plant Anal. 1984, 15, 1409–1416. [Google Scholar] [CrossRef]
  33. Hanson, D.; Kotuby-Amacher, J.; Miller, R.O. Soil analysis: Western States Proficiency Testing Program for 1996. Fresenius J. Anal. Chem. 1998, 360, 348–350. [Google Scholar] [CrossRef]
  34. Soltanpour, P.N.; Johnson, G.W.; Workman, S.M.; Jones, J.B., Jr.; Miller, R.O. Inductively coupled plasma emission spectrometry and inductively coupled plasma-mass spectrometry. In Methods of Soil Analysis, Part 3. Chemical Methods; Sparks, D.L., Ed.; SSSA and ASA: Madison, WI, USA, 1996; SSSA Book Ser. 5; pp. 91–139. [Google Scholar]
  35. Mitchell, R.B.; Moore, K.J.; Moser, L.E.; Fritz, J.O.; Redfearn, D.D. Predicting developmental morphology in switchgrass and big bluestem. Agron. J. 1997, 89, 827–832. [Google Scholar] [CrossRef] [Green Version]
  36. Moore, K.J.; Moser, L.E.; Vogel, K.P.; Waller, S.S.; Johnson, B.E.; Pedersen, J.F. Describing and quantifying growth stages of perennial forage grasses. Agron. J. 1991, 83, 1073–1077. [Google Scholar] [CrossRef] [Green Version]
  37. Oklahoma Mesonet. Available online: www.mesonet.org (accessed on 10 October 2019).
  38. Jones, J.B.; Case, V.W. Sampling, Handling, and Analyzing Plant Tissue Samples. In Soil Testing and Plant Analysis, 3rd ed.; Westerman, R.L., Ed.; SSSA: Madison, WI, USA, 1990; pp. 404–410. [Google Scholar]
  39. Antonangelo, J.A.; Zhang, H. Heavy metal phytoavailability in a contaminated soil of northeastern Oklahoma as affected by biochar amendment. Environ. Sci. Pollut. Res. 2019, 26, 33582–33593. [Google Scholar] [CrossRef] [PubMed]
  40. Thomason, W.E.; Raun, W.R.; Johnson, G.V.; Taliaferro, C.M.; Freeman, K.W.; Wynn, K.J.; Mullen, R.W. Switchgrass response to harvest frequency and time and rate of applied nitrogen. J. Plant Nutr. 2005, 27, 1199–1226. [Google Scholar] [CrossRef]
  41. Hong, C.O.; Owens, V.N.; Bransby, D.; Farris, R.; Fike, J.; Heaton, E.; Kim, S.; Mayton, H.; Mitchell, R.; Viands, D. Switchgrass response to nitrogen fertilizer across diverse environments in the USA: A regional feedstock partnership report. Bioenerg. Res. 2014, 7, 777–788. [Google Scholar] [CrossRef]
  42. Ameen, A.; Tang, C.; Liu, J.; Han, L.; Xie, G.H. Switchgrass as forage and biofuel feedstock: Effect of nitrogen fertilization rate on the quality of biomass harvested in late summer and early fall. Field Crops Res. 2019, 235, 154–162. [Google Scholar] [CrossRef]
  43. Ashworth, A.J.; Rocateli, A.C.; West, C.P.; Brye, K.R.; Popp, M.P. Switchgrass growth and effects on biomass accumulation, moisture content, and nutrient removal. Agron. J. 2017, 109, 1359–1367. [Google Scholar] [CrossRef] [Green Version]
  44. Schmer, M.R.; Vogel, K.P.; Mitchell, R.B.; Dien, B.S.; Jung, H.G.; Casler, M.D. Temporal and spatial variation in switchgrass biomass composition and theoretical ethanol yield. Agron. J. 2012, 104, 54–64. [Google Scholar] [CrossRef] [Green Version]
  45. Aurangzaib, M.; Moore, K.J.; Archontoulis, S.V.; Heaton, E.A.; Lenssen, A.W.; Fei, S. Compositional differences among upland and lowland switchgrass ecotypes grown as a bioenergy feedstock crop. Biomass Bioenerg. 2016, 87, 169–177. [Google Scholar] [CrossRef] [Green Version]
  46. Wilson, D.M.; Dalluge, D.L.; Rover, M.; Heaton, E.A.; Brown, R.C. Crop management impacts biofuel quality: Influence of switchgrass harvest time on yield, nitrogen and ash of fast pyrolysis products. Bioenerg. Res. 2013, 6, 103–113. [Google Scholar] [CrossRef]
  47. Tubeuileh, A.; Rennie, T.J.; Goss, M.J. A review on biomass production from C4 grasses: Yield and quality for end-use. Curr. Opin. Plant Biol. 2016, 31, 172–180. [Google Scholar] [CrossRef] [PubMed]
  48. Lindsay, K.R.; Popp, M.P.; West, C.P.; Ashworth, A.J.; Rocateli, A.C.; Farris, R.; Kakani, V.G.; Fritschi, F.B.; Green, V.S.; Alison, M.W.; et al. Predicted harvest time effects on switchgrass moisture content, nutrient concentration, yield, and profitability. Biomass Bioenerg. 2018, 108, 74–89. [Google Scholar] [CrossRef]
  49. Popp, M.P.; Ashworth, A.J.; Moore, P.A., Jr.; Owens, P.R.; Douglas, J.L.; Pote, D.H.; Jacobs, A.A.; Lindsay, K.R.; Dixon, B.L. Fertilizer recommendations for switchgrass: Quantifying economic effects on quality and yield. Agron. J. 2018, 110, 1854–1861. [Google Scholar] [CrossRef] [Green Version]
  50. Makaju, S.O.; Wu, Y.Q.; Zhang, H.; Kakani, V.G.; Taliaferro, C.M.; Anderson, M.P. Switchgrass winter yield, year-round elemental concentrations, and associated soil nutrients in a zero input environment. Agron. J. 2013, 105, 463–470. [Google Scholar] [CrossRef] [Green Version]
Figure 1. Changes in nitrogen (N) concentrations in switchgrass biomass as a function of the amount of N applied.
Resources 09 00061 g001
Figure 2. Relationship of acid detergent fiber (ADF), neutral detergent fiber (NDF), and total digestible nutrients (TDN) and nitrogen application rates.
Resources 09 00061 g002
Figure 3. Nitrogen concentration as affected by accumulated growing degree days.
Resources 09 00061 g003
Figure 4. Acid detergent fiber (ADF), neutral detergent fiber (NDF), and total digestible nutrients (TDN), as affected by accumulated growing degree days.
Resources 09 00061 g004
Table 1. Soil pH and plant available nutrients tested by year (2008, 2009, and 2010). Samples prior to fertilizer application (pre-season soil sampling).
YearpHNO3-N
-N
PKSO4-SCaMgFeZnBCu
mg kg−1
20086.32.716.81208.8161432648.50.70.341.38
Std. dev.0.190.42.9170.91713410.70.070.010.11
20096.27.1151155.5161232460.30.820.361.5
Std. dev.0.198.62.7200.0172339.30.090.030.04
20106.42.516114.66.3158731558.40.720.271.5
Std. dev.0.111.03.013.21.8158298.00.180.010.28
Averaged data was calculated from samples taken on each plot. Std. dev. = Standard deviation of the mean (n = 32).
Table 2. Dates of periodic plant biomass harvests from one of the nitrogen treatments (134.4 kg N ha−1) and associated accumulated growing degree days (AGDD).
YearHarvestDateJulian DOYAGDDGrowth Stage
2008112 June 2008164755E1
2008224 July 20082061452R2
200835 September 20082492175S3
2008430 October 20083042611Senescence
200854 December 20083392672Senescence
2009628 February 20094252748V0
200913 July 20091841180E4
200929 August 20092211822S0
2009325 September 20092682426S5
2009419 November 20093232627Senescence
2010526 January 20103912642G5
201062 March 20104262642G5
2010115 July 20101961323R1
201023 September 20102462240S4
2010328 October 20103012803Senescence
201042 December 20103362878
288
Senescence
201157 January 20113722888G5
2011625 March 20114493031V1
Growth stages [35], using estimated mean stand count (MSC) calculated from AGDD by calendar year as MSC = 0.875 + (0.0017 × AGDD) [36]. Julian DOY: Julian day of the year.
Table 3. Mineral concentrations of harvested biomass, as affected by nitrogen (N) fertilization rate.
YearN RateNPKCaMgSCuFeZnMn
kg ha−1g kg−1mg kg−1
200803.02c0.903.951.831.35ab0.507.7ab58.019.051.8
33.63.78abc0.883.352.181.50ab0.488.1a57.015.659.1
67.23.01c0.833.281.651.30b0.436.4b63.913.044.7
100.83.48bc0.853.251.951.48ab0.457.2ab61.814.247.9
134.43.61abc1.004.252.001.78a0.538.0ab62.417.948.4
168.03.71abc0.783.631.931.58ab0.457.0ab57.015.357.2
201.64.44a0.803.801.901.58ab0.487.1ab55.715.546.2
235.24.12ab0.753.231.931.60ab0.487.4ab56.915.644.4
Avg.3.640.853.591.921.520.477.459.115.749.9
Std. dev.0.700.160.830.340.290.081.111.73.813.5
P0.0130.4790.4410.6330.3510.8020.3150.9770.4860.515
F test3.430.980.810.721.100.531.10.21.00.6
CV%19.1318.9723.0717.6319.0317.2214.719.724.226.9
200903.43bc0.80a2.32a1.62ab1.04ab0.36bc2.0c32.5ab15.4ab70.7a
33.63.48bc0.77a2.34a1.92a1.19a0.41ab2.4bc32.0ab15.3ab66.5ab
67.23.57bc0.64ab2.37a1.60ab1.05ab0.37abc2.5b45.6a12.9ab64.5ab
100.83.38c0.76a2.42a1.67ab1.09ab0.39abc2.8b34.0ab15.9ab52.7ab
134.43.66bc0.66ab2.41a1.57ab1.13a0.38abc2.7b33.4ab14.4ab58.2ab
168.04.15ab0.53bc2.01ab1.48ab1.08ab0.39abc2.9b33.4ab12.0ab53.6ab
201.64.57a0.68ab2.14ab1.65ab1.16a0.44a3.6a37.5ab16.4a46.3ab
235.23.86bc0.41c1.70b1.24b0.93b0.33c2.5b20.6b11.3b39.7b
Avg.3.760.662.211.591.080.382.733.614.256.5
Std. dev.0.550.160.390.320.130.050.515.63.219.5
P0.0120.00030.1020.2160.1260.091<0.00010.5270.1450.292
F test3.496.832.011.521.872.098.90.91.81.3
CV%14.7423.9917.5120.0112.3913.2319.046.322.634.6
201003.590.73a1.842.801.460.50a2.444.525.2a85.1
33.63.340.56b2.062.411.230.41ab1.943.817.8b77.6
67.23.410.56b2.052.191.340.38ab2.443.716.0b78.0
100.83.400.58b2.221.991.240.35b2.739.415.1b67.8
134.44.000.57b1.682.091.430.37b1.840.015.0b71.3
168.03.600.55b1.822.101.410.38ab2.240.514.4b64.6
201.64.980.62ab1.662.361.620.46ab3.041.317.4b62.3
235.24.460.54b1.522.561.540.42ab2.341.315.0b70.2
Avg.3.850.591.862.311.410.412.341.917.072.1
Std. dev.1.140.110.450.500.240.080.87.44.518.1
P0.4500.2050.3680.3230.3050.1360.4160.9850.0050.678
F test1.011.551.161.251.291.821.10.24.30.7
CV%29.5818.6024.4621.7717.2519.3332.220.026.425.1
Avg.: Average. Std. dev.: Standard deviation of the mean (n = 4). CV%: Coefficient of variation as a percentage. Numbers in a column followed by the same letter exhibited no significant differences (P > 0.05) whereas ‘a’ means higher than ‘b’ and not different from ‘ab’ or ‘abc’ based on Duncan’s Multiple Range Test.
Table 4. Mineral concentrations in harvested biomass as affected by harvest timing (AGDD, accumulated growing degree days).
YearAGDDNPKCaMgSCuFeZnMn
g kg−1mg kg−1
2008754.77.10a1.78a15.13a2.30a1.80a0.83a25.7b106.8ab26.2a77.7a
14524.51b1.15b7.93b2.03ab1.50ab0.60b23.3b88.7ab22.7ab82.0a
21753.44bc1.10b6.38c1.68b1.38bc0.50bc5.9b54.8ab19.3bc54.8b
26113.26bc0.78c3.58d1.68b1.43b0.40cd12.2b145.6a15.5c47.0b
26722.95c0.75c2.93d1.45b1.08cd0.35d6.2b134.2a15.2c41.4b
27483.04c0.50d1.50e1.48b1.01d0.07e220.5a16.0b8.5d43.6b
Avg.4.051.016.441.771.360.4750.694.417.957.7
Std. dev.1.630.444.640.490.340.2489.164.66.519.7
P<0.0001<0.0001<0.00010.02720.0013<0.0001<0.00010.0440<0.00010.0010
F Test15.5931.17204.593.497.2349.714.32.815.37.6
CV%40.2943.9610.4727.5024.6014.3187.956.436.434.2
2009118010.34a1.64a10.1a2.17ab1.95a0.77a9.4a60.225.9a77.6a
18229.42a1.55a7.87b2.69a2.07a0.81a9.8a75.129.4a68.7ab
24264.99b1.08b4.22c1.24c1.05b0.39b5.2b81.216.2b50.6bc
26274.68b0.76c2.29d1.29c1.05b0.36b1.5c43.014.1b42.1c
26424.00b1.00b1.75d2.00b------------------
26424.00b1.00b1.00e2.00b------------------
Avg.6.241.174.131.901.530.586.564.921.459.7
Std. dev.2.800.353.280.630.550.223.727.77.221.3
P<0.0001<0.0001<0.00010.0007<0.0001<0.0001<0.00010.26160.00060.0148
F Test41.9733.45327.328.6326.2152.0440.01.616.36.1
CV%44.8529.588.95533.2236.2238.5719.142.833.835.7
201013236.76a1.007.75a2.251.75a1.005.5a70.123.1a---
22406.84a1.006.25b2.251.75a1.004.6b92.120.4ab---
28034.04b1.003.00c1.751.50ab1.004.2b110.519.3ab---
28883.24bc1.001.75d1.751.00b---3.0c55.718.2bc---
30313.08c1.001.25d1.501.00b---3.1c97.814.5c---
Avg.4.791.004.001.901.401.004.185.219.1---
Std. dev.1.880.002.700.550.500.001.342.14.6---
P<0.0001---<0.00010.28590.0489---<0.00010.25690.0056---
F Test39.65---70.181.423.29---16.61.56.3---
CV%39.320.0017.0829.0835.900.0032.849.424.0---
Avg.: Average. CV%: Coefficient of variation as a percentage. Std. dev.: Standard deviation of the mean (n = 4). Numbers in a column followed by the same letter exhibited no significant differences (P > 0.05) whereas ‘a’ means higher than ‘b’ and not different from ‘ab’ or ‘abc’ based on Duncan’s Multiple Range Test.

