Article

Multi-Decadal Nutrient Management and Trends in Two Catchments of Lake Okeechobee

Department of Civil and Environmental Engineering, University of South Florida, Tampa, FL 33620, USA
*
Author to whom correspondence should be addressed.
Resources 2024, 13(2), 28; https://doi.org/10.3390/resources13020028
Submission received: 18 November 2023 / Revised: 19 January 2024 / Accepted: 4 February 2024 / Published: 13 February 2024

Abstract

:
Despite years of efforts to improve water quality, harmful algal blooms remain a chronic phenomenon, with devastating environmental, economic, and social impacts in many regions worldwide. In this study, we assessed the complexity of nutrient pollution attributed to harmful algal blooms in South Florida (USA) by analyzing 20 years of flow and nutrient data within two headwater basins in the Lake Okeechobee (LO) watershed. The study used an established advanced regression method, the Weighted Regression on Time, Discharge, and Season (WRTDS) method, as an analysis framework to examine the impact of nutrient management practices on water quality trends. The WRTDS method produced total phosphorus (TP) and total nitrogen (TN) concentration and flux trends, which were then compared with existing and historic nutrient management records within the basin. Results from this study highlight divergences in progress to improve water quality. Nutrient management practices only had a weak impact on TP and TN flux trends in one of the two basins, where TP flux decreased 2% per year, and TN flux decreased 0.1% per year. TP and TN flux increased in the second basin. Variances of improvement between the two basins are likely attributable to differences in contemporary point source loading and legacy nutrient pools from non-point source inputs 20 years or more before the analysis period. The long-lasting impacts of legacy nutrients also emphasize a need for investments in technologies and practices that can withdraw nutrients from enriched soil and water.

Graphical Abstract

1. Introduction

Nutrients, such as nitrogen and phosphorus, are vital for the growth of living things. However, high nutrient concentrations can be considered pollutants to surface and ground waters. Eutrophication, an excess of nutrients within surface water, triggers algal growth or harmful algal blooms. Nutrients within surface and groundwater originate from natural and anthropogenic sources related to land uses in a watershed. Anthropogenic nutrient sources can include direct discharges (point sources) and indirect diffusion (non-point sources) into waterways [1].
Excess nutrients that accumulate within the soil, the vadose zone, and groundwater are called “legacy” sources [2,3]. Various species of legacy nutrients can be stored within soil and water: organic forms of nutrients are deposited within the soil profile, inorganic phosphorus accumulates in soils, and inorganic nitrogen persists in groundwater in the form of nitrate [2,3,4]. Due to hydrologic travel time and biogeochemical nutrient cycling, time lags contribute to accumulating legacy nutrients [2]. Unlike nitrogen, phosphorus does not cycle from the terrestrial environment to the atmosphere. Therefore, any phosphorus applied but not used by plants or exported remains stored within soils. Legacy sources of nitrogen and phosphorus can continue to contribute to the enrichment of waterways for a long time, sometimes decades [5,6]. The variability of both legacy and contemporary nutrient sources within a watershed makes nutrient pollution a complex environmental problem. Social, ecological, and economic factors increase this complexity, as each social–ecological system is unique to a watershed’s characteristics [7,8].
Improvement in water quality via implementing best management practices (BMPs) has often been slower and less impactful than predicted by modeling studies at the watershed scale [9]. BMPs are widely implemented to reduce nutrient pollution, yet gaps regarding treatment performance still exist. Most research studies on BMP performance have been short-term empirical studies of single BMPs assessing their potential to treat nutrient pollution over limited time and spatial scales [9,10,11]. However, BMP treatment efficiency may decrease over time, and limited data show long-term nutrient treatment performance at the watershed level [9,12,13,14,15]. In addition to gaps regarding BMP performance, watershed properties, such as hydrologic timing and release of nutrients from legacy pools, impact the effectiveness of site-level treatments at the watershed scale [3,16].
Long-term monitoring of surface waters can be used to examine whether BMP implementation within a watershed improves water quality. Due to testing costs, water quality concentration data are typically collected less frequently than discharge measurements. Therefore, values are estimated when measured concentration data are unavailable at the frequency required for an analysis. Of the four types of load estimation methods (aggregation or interpolation, ratio estimators, regression, and advanced regression), advanced regression methods are the most complex and flexible but require longer data records [17].
The Weighted Regression on Time, Discharge, and Season (WRTDS) is an existing advanced regression method that utilizes long-term water quality records and daily discharge data to estimate daily concentration and flux values [18]. The influence of year-to-year discharge variability can be filtered from water quality trends by using the “flow-normalization” method of WRTDS [19]. The United States Geological Survey (USGS) utilized the WRTDS methodology to analyze water quality trends of US rivers at approximately 1500 sites [20,21]. Recent refinements to the WRTDS method and studies have shown trend estimation with WTRDS can be completed with datasets as short as ten years [19,22]. The capability to remove or consider the influence of the discharge variability has been used to link sediment trends to changes in land use land cover and evaluate the effectiveness of nutrient control strategies in the Lake Erie [23] and St. John’s River Watersheds [24].
Lake Okeechobee (LO) in South Florida has a surface area of 1730 km2 and is classified as shallow, with a mean depth of approximately 2.7 m [25]. The LO watershed is a part of the Greater Everglades ecosystem and is the most upstream source of nutrient pollution to LO, the St. Lucie, the Caloosahatchee, and the Everglades [26,27]. The impairment of LO impacts ecosystems and communities that depend on it for water supply and economic livelihood [28]. Agriculture within the LO watershed has thrived since the 1850s due to large-scale drainage and flood protection engineering projects in South Florida. By the 1960s, engineering projects were completed that altered the hydrology, hydraulics, and water quality within the lake and its watershed [25,29,30].
Beef cattle ranching has been a dominant land use in the LO watershed for hundreds of years [31]. In the 1920s and 1930s, improved drainage in the region allowed ranching to intensify from native grasses to high-producing grasses, known as improved pasture, to increase the carrying capacity of agricultural lands [32,33]. In 2019, improved pasture was the largest land use within the watershed [34]. In the 1950s, the dairy industry began to develop on the northern side of LO and within the Taylor Creek Nubbins Slough (TCNS) and Kissimmee River sub-watersheds [31].
The water quality and nutrient loading from the TCNS sub-watershed of LO have been a concern since channelization projects within the sub-watershed were completed in 1969. Ongoing water quality studies, nutrient management programs, and policies since the channelization projects have focused on reducing phosphorus loads to LO. In 1975, Davis and Marshall [35] concluded that most of the phosphorus loading to LO was from the TCNS sub-watershed. Frederico [36] completed a regression analysis in six basins within TCNS and determined poor water quality was linked to dairy operations.
By 1978, the Taylor Creek Headwaters Program began, providing 100% of the cost for dairy BMPs, including fencing, watering facilities, shade structures, water retention, and water conservation practices within the Taylor Creek Headwaters basin. In 1981, the US Department of Agricultural Rural Clean Waters Program expanded the Taylor Creek Headwaters program to provide a 75% cost share of BMPs for the entire TCNS sub-watershed. In 1987, the “Dairy Rule” was added to the Florida Administrative Code (F.A.C.), a compilation of administrative rules for the state, requiring dairy operations to have approved collection and treatment systems from areas with a high intensity of cattle [37]. From 1989 to 1992, a buy-out program offered dairy operators financial incentives to move out of the watershed and accept future land use restrictions. Many farms that received the financial incentive to close dairy operations shifted to beef operations, with some changing to citrus and hay [37,38]. By 1992, other programs specified what types of BMPs were required to collect, capture, treat, and dispose of nutrients in dairy operations within the LO watershed [39].
After the Dairy Rule, the emphasis shifted to reducing nutrient loads from other agricultural non-point sources. In the late 1980s, additional rules (Rule 40E-61 F.A.C.) limited the average annual phosphorus concentration based on land use [40]. In 2013, revised biosolids disposal rules (Rule 62-640 F.A.C.) were enacted, requiring farmers that land apply biosolids within the LO watershed to demonstrate no new watershed P loading [25,41].
In 2020, all agricultural producers within the LO watershed were mandated to enroll in the Florida Department of Agricultural and Consumer Services (FDACS) BMP program [42]. FDACS identifies applicable BMPs to a site via commodity-based BMP manuals and categorizes these practices into three types. BMPs for cattle or cow/calf operations are described in Table 1 [43]. The performance of cow/calf BMPs on nutrient reduction in Florida is known to be limited; a meta-analysis completed in 2016 only identified four studies suitable for determining the effectiveness of cow/calf BMPs in reducing nutrient pollution [44].
Monitoring and BMP studies in the LO watershed, explicitly focusing on the nutrient runoff concentrations for improved pasture and dairy land uses, are summarized in Table 2. Monitoring runoff concentrations shows the greatest total phosphorus (TP) and total nitrogen (TN) concentrations associated with dairy operations before BMP implementation. Before BMPs, catchments with dairy operations recorded TP concentrations between 1.26 and 6.78 mg/L, and TN concentrations are primarily in the form of Total Kjeldahl Nitrogen (TKN), ranging between 1.30 and 11.20 mg/L [46,47]. Before BMPs, catchments with improved pasture as the major agricultural land use and without dairy operations recorded TP concentrations between 0.24 mg/L and 0.96 mg/L and TKN between 1.33 and 2.75 mg/L [36,46]. After BMP implementation, results varied between dairy and improved pasture sites. At the dairy operations, TP concentrations decreased within the catchment [48]. At an improved pasture site, after water control structure BMPs were implemented, TN concentration decreased from 3.31 to 2.86 mg/L, while TP concentrations increased from 0.66 mg/L to 0.86 mg/L [49].
Mass balance and modeling studies have parameterized TP loading (or flux) from land uses in the LO watershed and estimated TP storage within upland soils. Table 3 summarizes TP loading from land uses within the TCNS watershed; values in the table are a singular value for the study area and can fluctuate based on variables such as fertilizer usage, herd size, and historical land use. Mass balance studies have estimated that 70% of phosphorus imported into LO is stored in upland soils that had previously been phosphorus sinks [37,46]. Using the Watershed Assessment Model, Khare et al. [47] estimated that 61–65% of loading from the TCNS watershed was from legacy, not contemporary sources.
This study aims to evaluate the impact of pasture BMPs for beef cattle (cow/calf) operations on water quality within the LO watershed. Due to the size and complexity of LO’s watershed and the historical record of land use and water quality within TCNS, two basins within the TCNS sub-watershed were selected for the study. The WRTDS method produced flow-normalized TN and TP concentration and flux trends. Flow-normalized trends were then compared with nutrient management practices to assess the progress in water quality in the two basins.

2. Materials and Methods
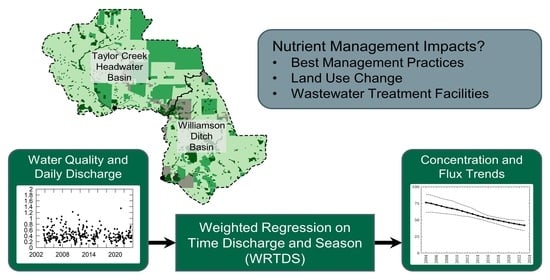
2.1. Study Sites

Two primarily agricultural headwater basins within the TCNS sub-watershed (Taylor Creek Headwaters and Williamson Ditch; Figure 1) were selected for the analysis. Taylor Creek Headwaters basin has a drainage area of 124 square kilometers (km2) and was targeted for nutrient reduction in the 1978 Taylor Creek Headwaters Program. In 1982, 14 dairy barns within the catchment and 75 km2 of high-intensity dairy areas and pastures in the basin were enrolled in the program [50]. Williamson Ditch was constructed for flood control before 1953 and has a drainage area of 85 km2. Agricultural production within the Williamson Ditch basin has historically been primarily beef cattle and citrus without dairy operations [36]. Land use areas for both basins were determined by spatial coverage of land use codes for 1988, 1995, 1999, 2004, 2008, and 2017, which were downloaded from the South Florida Water Management District’s (SFWMD) Geospatial Database. Spatial coverage data were tabulated using ESRI ArcGIS Pro 3.0.3 and are listed in Table 4.

2.2. Water Quality Analysis
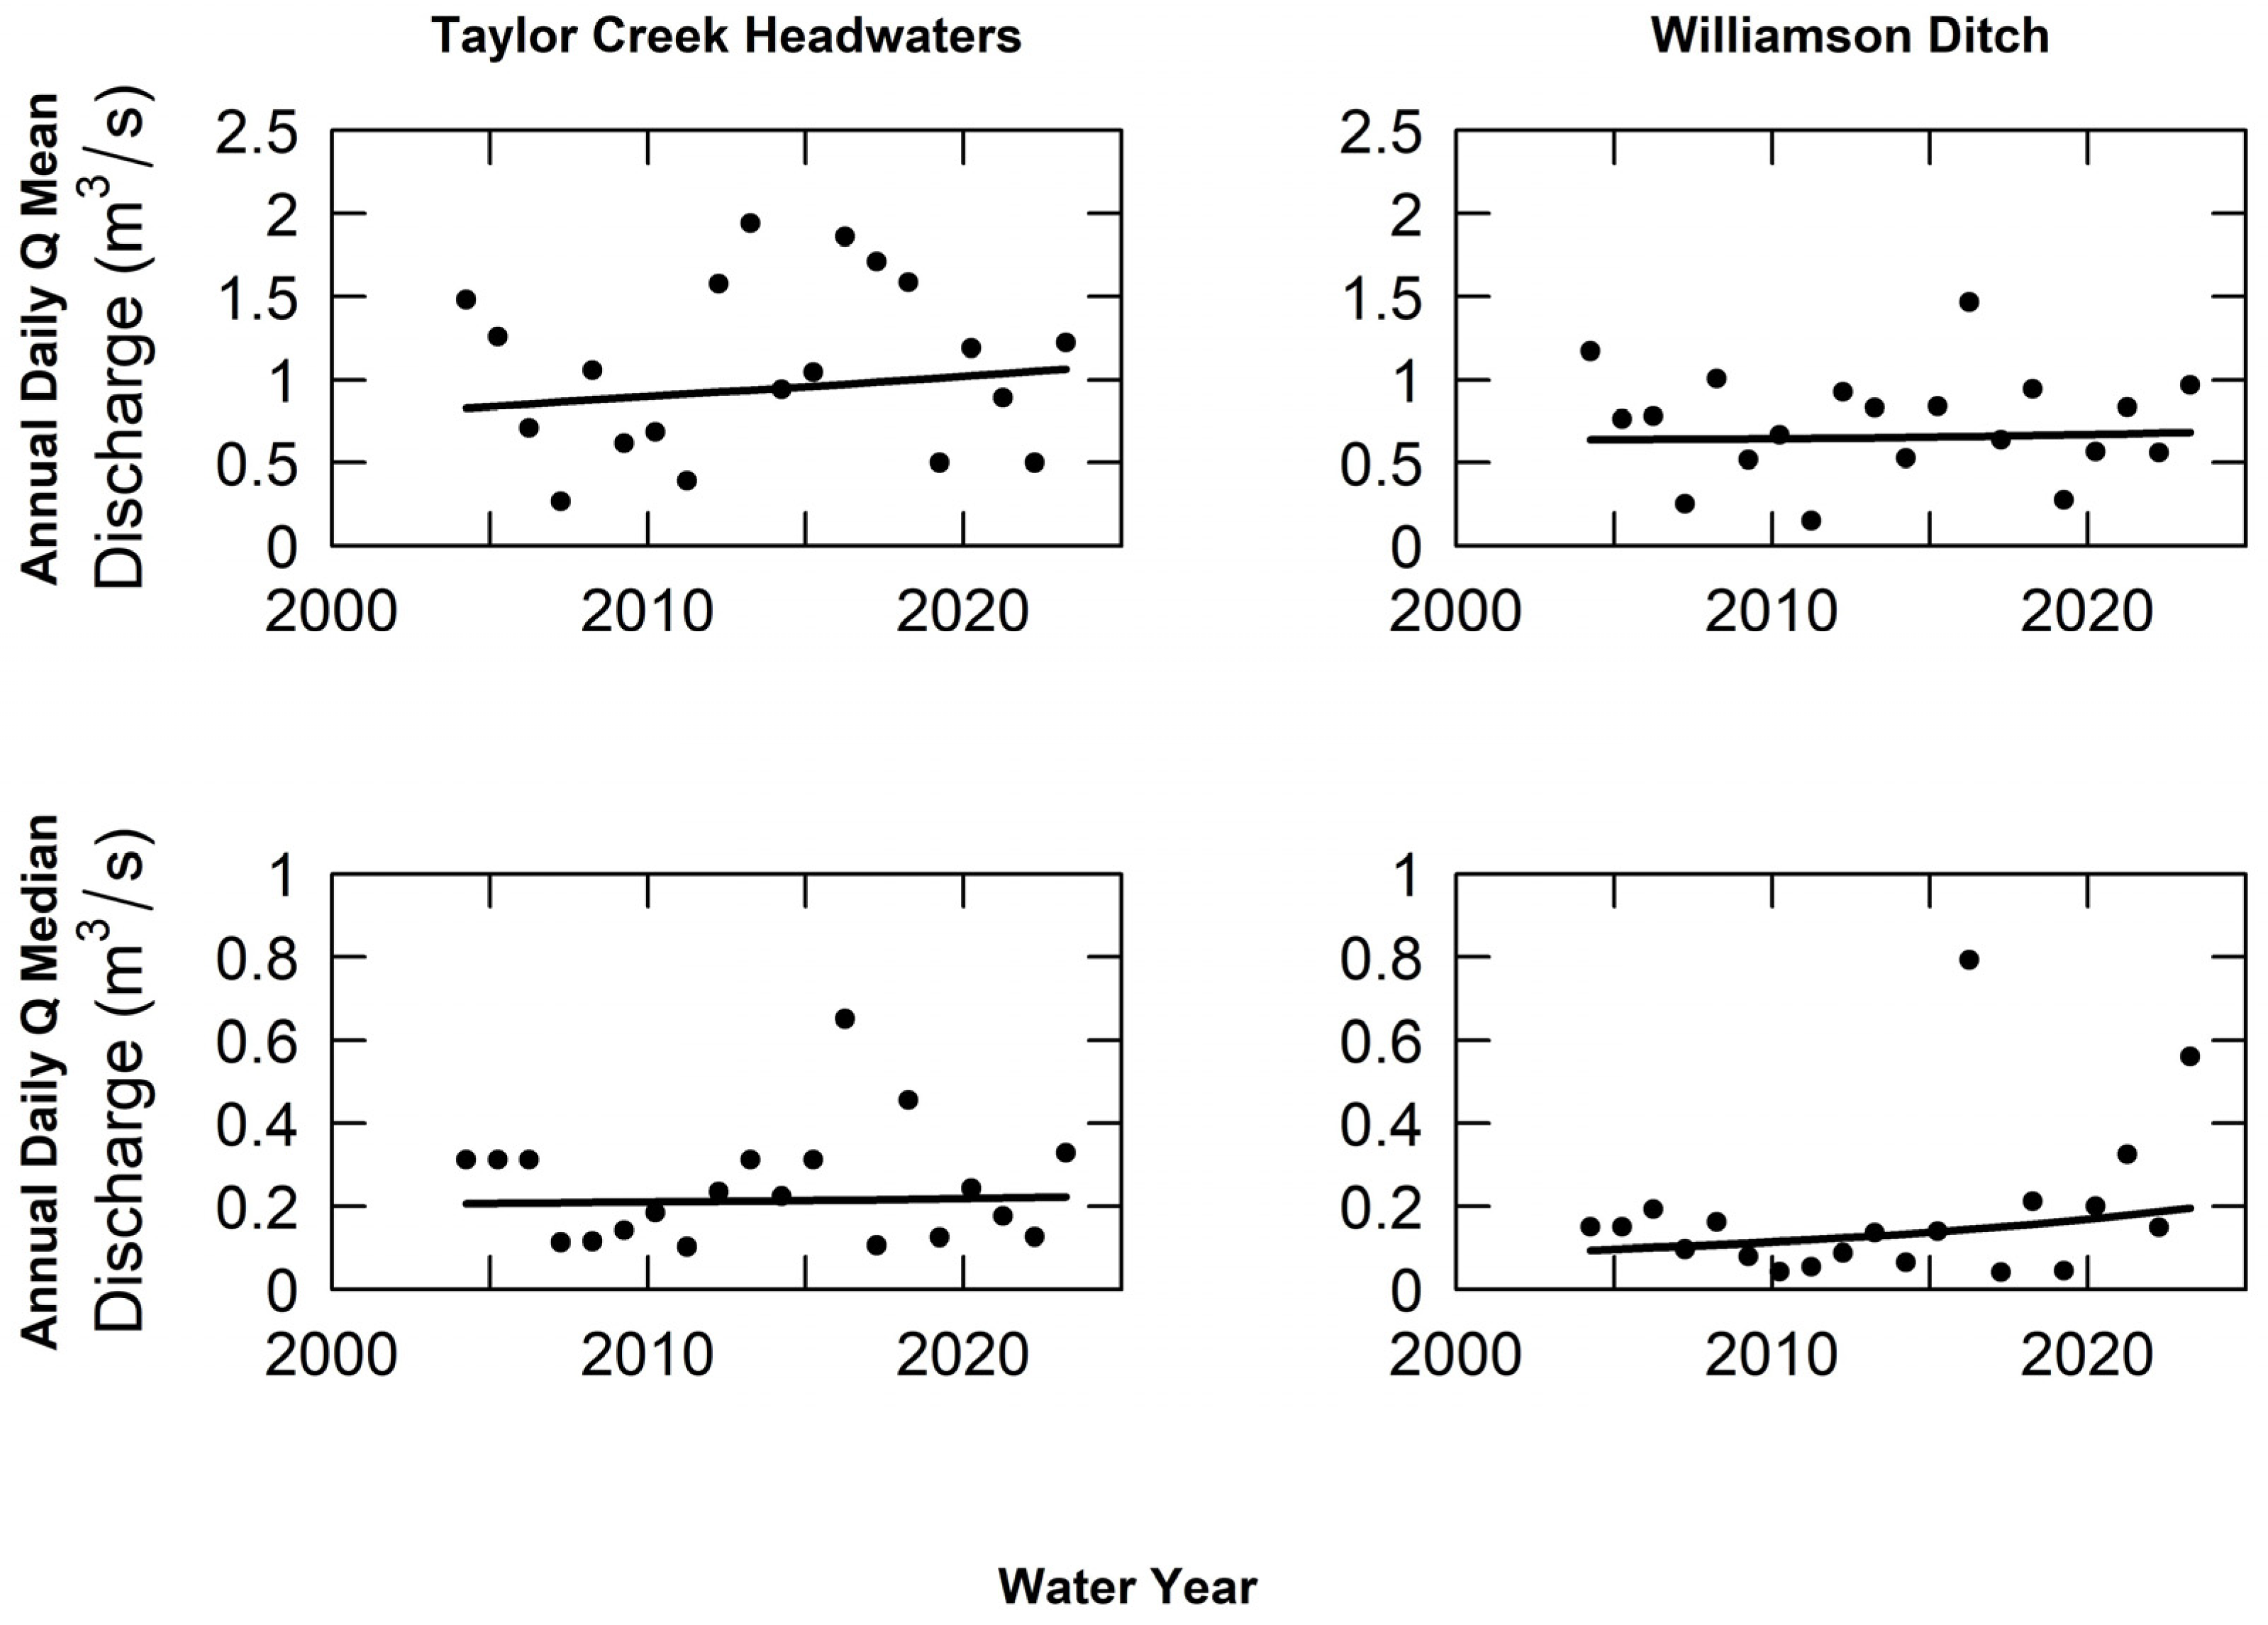
The WRTDS method was used to produce flow-normalized trends of TN and TP for the basins. The approach uses USGS’s R-studio package Exploration and Graphics for RivEr Trends (EGRET) within the R software environment (version 4.2.1) to first estimate concentration and flux and then compute flow-normalization trends [18,19,53]. The general model of WRTDS is
ln ( c ) = β 0 + β 1 t + β 2 ln ( Q ) + β 3 sin ( 2 π t ) + β 4 cos ( 2 π t ) + ε ,
where fitted coefficients are the βn values, c is the concentration, Q is daily mean discharge, t is decimal time in years, and ε is uncertainty. A locally weighted regression is used to fit coefficients, resulting in a unique set of coefficients for each pair of discharge and time variables over the dataset domain. The WRTDS model fit can be adjusted by changing parameters for calibration point weights for time, discharge, and seasonal dimensions. As no considerable improvement was observed by changing parameters, default parameters were used in this analysis. Daily concentration estimates from the WRTDS model are used to calculate the estimated flux [18,54].
Model fit was assessed quantitatively using the flux bias statistic. Hirsch and DeCicco [19] define the flux bias statistic as a dimensionless representation of the difference between the sum of the estimated flux and the sampled value on all days where water quality was sampled. The flux bias statistic (B) is calculated as
B = i = 1 n k · c ^ i · Q i i = 1 n k · c i · Q i   i = 1 n k · c ^ i · Q i ,    
where k is a unit conversion factor, ci is the measured concentration on sampled days, ĉi is the estimated concentration on sampled days, n is the number of sampled days, and Qi is the discharge on sampled days.
After the model fit was assessed, the EGRET package (version 3.0.7) was used to normalize concentration and flux by flow to remove sub-annual variations in water quality. Hirsch and DeCicco [19] describe the flow-normalization method in detail. Generally, the flow normalization integrates fitted daily estimates of concentration or flux over a probability density function of daily mean discharges associated with each day of the year. The length of time, or number of years, associated with the probability density function can be adjusted within EGRET. Choquette et al. [55] describe how adjusting the time-window parameter changes the length of time the discharge probability density function is assumed to be stationary. A time window of zero assumes that flow is stationary over the entire study period, and a single discharge probability density function is used for the flow-normalization method, whereas a non-zero time window is based on a moving window. The uncertainty of the flow-normalized values was evaluated using a second R-studio package developed by the USGS, the Exploration and Graphics for River Trend confidence interval (version 2.0.4), which runs a block bootstrap method evaluation to describe the uncertainty of flow-normalized results [56]. For this analysis, flow-normalized values were calculated based on a 15-year window. Then, flow-normalized trends of TN and TP were evaluated to determine insights into the long-term progress of water quality improvement.

2.2.1. Discharge

The USGS continuously records the discharge for each basin. Daily mean discharge data were downloaded from DBHydro, SFWMD’s database for hydrologic, hydrogeologic, and water quality data [57]. The data utilized are listed in Table 5. Daily discharge is an input for WRTDS, a natural log function, and there cannot be negative or zero values within the input data. Negative values cannot be input in WRTDS due to the regression analysis and the complications that tailwaters can present in water quality analysis. Still, due to the small percentage (<0.5%) of negative discharge values within the record, the dataset was utilized for the WRTDS analysis [20]. Per data entry methodology in Hirsch and DeCicco [19] and Oelsner et al. [20], negative values were replaced with zero values, and a very small constant was added to each daily discharge in the stream record. In this analysis, the very small constant was equal to one percent of the recorded minimum positive flow value, less than the recommendation in Hirsch and DeCicco [19]. This value was selected to ensure the small value would not compromise the statistical methods of the small discharges recorded in the basin.
Due to the influence of discharge on concentration, daily discharge data input into WRTDS were graphically evaluated using the additional functionality of EGRET. Annualized statistics were calculated as discrete annual values and a continuous smoothed trend along the decimal time. The smoothing method is based on a locally weighted scatterplot smoothing (LOWESS) to create a smooth representation of the median of the distribution over time [19].

2.2.2. Nutrient Concentrations

Nutrient concentration sample data were also downloaded from DBHydro; the data utilized are listed in Table 6. Grab samples are collected approximately twice a month by SFWMD to monitor water quality. Gaps between sampling events are more likely to occur during the dry season (December to April). TN data were extended before 10 July 2014 by adding the two constituents of TN, Total Kjeldahl Nitrogen and NOx (nitrate and nitrite). Samples with data quality remark codes that indicate inaccurate measurements, referred to as data quality flags in Table 6, were removed from the dataset utilized for the analysis. Per data entry methodology in Hirsch and DeCicco [19], zero and negative values were replaced with the reportable detection limit for the given parameter and annotated as a censored value with a “<” remark code in the input data file for EGRET.

2.3. Nutrient Sources and Treatment

Point and non-point sources of nutrient pollution and treatment practices within the basins were investigated to examine the relationship between water quality trends and known treatment practices. Permitted activities were compiled from the Florida Department of Environmental Protection OCULUS and Nexus Portal websites by searching records of biosolids applications and wastewater treatment plants, which includes permits for dairy and domestic wastewater operations [58,59]. Available land use and land cover data not accounted for within permitted activities were assumed to be associated with contributions to nutrient loading, such as fertilizer usage or the presence of an onsite sewage treatment and disposal system.
FDACS provided anonymized agricultural BMP enrollment data to analyze enrollment coverage of all BMPs and the number of cow/calf BMPs for the predominant pasture land use in the basins. BMP enrollment data consisted of one geodatabase and one tabular database linked with an anonymous numerical identifier. The geodatabase included coverage of BMP enrollment within the TCNS sub-watershed. The tabular database had the year of enrollment and responses to questions within the 2008 FDACS Cow/Calf BMP manual. FDACS representatives completed responses to questions within the tabular database, and questions indicate which BMPs are required to be implemented by producers enrolled in the FDACS BMP program. This analysis defines a cow/calf BMP as questions within the tabular database designated with a “yes”. BMP enrollment data were processed using the spatial database to identify IDs within the boundaries of Taylor Creek Headwater and Williamson Ditch catchments. Finally, “yes” responses in the tabular database for each numerical identification were totaled to determine the number of cow/calf BMPs required to be implemented within the catchment.

3. Results

3.1. Discharge Analysis

Annualized daily discharge variability for Taylor Creek Headwaters and Williamson Ditch are shown in Figure 2. Results in Figure 2, Figure 3, Figure 4 and Figure 5 are shown over time in a hydrologic, or water year (WY), which spans from October 1 to September 30. Over the analysis period, daily discharge ranged between 0.00 m3/s and 42.76 m3/s for Taylor Creek Headwaters and between 0.00 m3/s and 21.15 m3/s for Williamson Ditch. The mean daily discharge in Taylor Creek Headwaters has a broader range within the analysis period than Williamson Ditch. Taylor Creek Headwaters had a slightly increasing mean daily discharge, and Williamson Ditch had a slightly increasing median daily discharge, but other trends show minimal changes between WY2004 and WY2023. Seasonal annualized discharge trends for both basins are shown in Figure 3. The annual maximum 30-day mean of daily discharges, a high flow statistic, within the wet season (May to November) and dry season (December to April) shows the difference in the maximum average of daily discharge within a 30-day window. Annualized seasonal 30-day maximums had slightly decreasing trends in both basins in the wet season. During the dry season, annualized 30-day maximums were scattered within a range of 0 to 2 m3/s. In both basins, annual and seasonal statistics do not show considerable variations or trends during the analysis period.

3.2. Water Quality Trends

The WRTDS model was fit to TN and TP sample data in both basins. The flux bias statistics, which provide a dimensionless representation of model fit, are listed in Table 7 for each model. The flux bias statistics for each model are between −0.01 and 0.01 and close to zero, suggesting an acceptable, good model fit [19].
Flow-normalized water quality trends (solid line) with confidence intervals (dashed line) from EGRET are shown in Figure 4 (concentration) and Figure 5 (flux). Flux is the product of discharge and concentration; considering the normalized trend of both concentration and flux can provide different insights into the pollutant sources within a basin. Broadly, a trend in normalized concentration indicates a change in the contribution of a point source or base flow within the basin, and a change in the trend of a normalized flux indicates a change in the contribution from a non-point source. Trends in flux can be more affected by contributions from non-point sources because as discharges increase, so does the contribution of runoff from non-point sources (e.g., due to fertilizer and manure washing away from the land to water). In contrast, point source contributions are likely higher as discharges decrease because effluents from point sources are generally independent of the runoff quantity. Therefore, point sources make up a larger fraction of the flow under low flow conditions [18].
In the Taylor Creek Headwaters basin, TN and TP concentrations increased after WY2015. However, over the whole analysis period, TP flux decreased from 76 to 42 kg/d (45%), and TN flux decreased slightly from 220 to 217 kg/d (2%). The unit area TP flux, dividing TP flux by the basin’s drainage area, decreases from 2.2 to 1.2 kg/ha/yr over the analysis period. The decreasing nutrient flux could indicate a drawdown of nutrients stored in upland soils after implementing BMPs. Since average discharges and TP flux have decreasing trends, an increasing TP concentration trend within the analysis period was unexpected. These results indicate that TN and TP concentration changes could be attributed to a growing contribution from a point source in the basin.
TN and TP concentration and flux trends in the Williamson Ditch basin increased from WY2004 to WY2023; TP flux increased from 24 to 57 kg/d (140%), and TN rose mildly from 112 to 126 kg/d (11%). The unit area TP flux rose from 1.0 to 2.4 kg/ha/yr over the analysis period. Because the concentration and flux both increased, the increase in nutrient concentrations was attributed to increased loading or flux of nutrients from the basin to the surface water and an increasing contribution from a point source.

3.3. Nutrient Sources and Treatment

Taylor Creek Headwaters and Williamson Ditch basins do not have any biosolids application permits within the OCULUS database; however, both basins have wastewater treatment permits. Permitted wastewater treatment plants were assumed to account for the location and type of contemporary point sources in the basins. Since the permitted capacity represents the maximum threshold of a given wastewater system, capacity was not considered to represent flows, effluent concentrations, or effluent loads. Available land use and land cover data were utilized to investigate windows of time when the capacity of a treatment operation increased after a permit was approved.
Taylor Creek Headwaters basin has two wastewater treatment permits associated with a single dairy producer and four dairy barns. Wastewater from the dairy farm is treated and stored in waste storage lagoons and then land applied within a sprayfield. The dairy operation is located within the Otter Creek tributary at the northern edge of the Taylor Creek Headwater basin boundary. The dairy farm has permits in OCULUS beginning in 1989, and the treatment capacity of the operation increased in both 2006 and 2021. The increased capacity is likely related to increased dairy land use within the basin. From 2005 to 2017, 18.3 km2 of other land uses, including field crops, confined feeding operations, improved pasture, upland forest, and upland nonforest, were transformed into dairy land use within the basin.
Williamson Ditch Basin has one municipal wastewater treatment facility and one industrial wastewater treatment facility. The industrial facility is at the northeastern edge of the basin and is permitted to treat 0.91 million liters per day (MLD). The municipal wastewater treatment facility is in close proximity (<2 km) to the sampling point for the Williamson Ditch basin and has permits in OCULUS since the 1990s. In 1997 and 2006, the facility increased its permitted capacity. Increased capacity was also reflected in land use for sewage treatment in the basin; from 1995 to 2008, land used for sewage treatment increased from 10 km2 to 66 km2. Today, the facility is permitted for 18.2 MLD and effluent discharges are split between deep water aquifer injections, onsite detention, and two land application locations within the basin. One land application location is at the facility, and the other is at an agricultural site within the basin.
Cow/calf BMPs implemented in the enrollment program are quantified over time in Table 8; land parcels associated with the program are hatched in Figure 6 to show spatial coverage over time. BMP enrollment in the cow/calf program began in 2000 in the Taylor Creek Headwaters Basin and in 2010 in the Williamson Ditch Basin. Enrollment within the program grew over time, and by 2020, most landowners in the basins were enrolled.
Since 2020, agricultural producers within the study area have been mandated to enroll in the BMP program [42]. An agricultural producer is enrolled in the BMP program after the following steps are completed: (1) the producer contacts FDACS regarding enrolling, (2) an FDACS representative visits the site to identify all applicable BMPs, and (3) a notice to implement is signed. FDACS identifies applicable BMPs via commodity-based BMP Manuals; FDACS BMP types are described in Table 1. Producers are required to implement all applicable BMPs as soon as possible but no later than 18 months after an initial site visit. After enrolling a site, FDACS performs site visits every two years to confirm that BMPs are maintained. Once a producer is enrolled in the program and BMPs are implemented, implementation will continue into the future [43].

4. Discussion

Although there have been large investments in BMPs to manage agricultural nutrient sources from the LO watershed in the last 5 decades, nutrient concentrations associated with improved pastures are similar to those of the 1970s. After smoothing high frequency and seasonal variabilities in the data using the WRTDS method, the two adjacent headwater basins within the TCNS sub-watershed had different flow-normalized water quality trends. TP flux decreased in the Taylor Creek Headwaters basin, while TP and TN concentrations rose simultaneously during the analyzed period. In the Williamson Ditch basin, TP and TN concentration and flux increased with varying rates over the analyzed period. Differences in contemporary point sources and historical land uses between the two basins provide insights into differing water quality trends during the WRTDS analysis period.
Regarding point sources (wastewater treatment plants and dairy operations), both basins would benefit from implementing advanced nutrient removal technologies. For the Williamson Ditch Basin, increased trends of TN and TP concentrations and fluxes (from WY2004–WY2016) are linked to the expansion of the municipal wastewater treatment facility (between 1997 and 2006) and increased land application of treated effluent. For Taylor Creek Headwaters, nutrient concentrations could be decreased by implementing chemical phosphate removal and reusing treated wastewater within expanding dairy operations [60].
Before the analyzed period, the basins had different land uses, contributing to differences in legacy nutrient pools. Hydrologic and biogeochemical cycling lags of legacy nutrients could continue contributing to the TP exported downstream during the analyzed period. The dairy buy-out implemented in the 1980s only impacted the Taylor Creek Headwaters basin, where TP flux in WY2004 was still elevated at 2.2 kg/ha/yr. Over the analyzed period, TP flux decreased to 1.2 kg/ha/yr, approaching the average loading for unimproved pasture (0.64 kg/ha/yr), possibly due to the combination of depleting legacy sources and BMP implementation. At the same time, the Williamson Ditch basin, a basin without a history of dairy operations, has an increasing TP flux trend from 1.0 kg/ha/yr in WY2004, despite BMP implementation.
BMPs implemented at cow/calf operations on improved pasture in the study area are very similar to practices implemented in the 1980s. These BMPs can decrease contemporary loading with non-structural (Type I) and structural (Type II) BMPs. Still, as seen in TP flux trends in the Taylor Creek Headwaters basin, it may take decades for BMP implementation to reduce TP loading if historical land uses contributed to legacy nutrient pools [2,3,4,5,6,61,62,63,64]. New and innovative BMPs are needed to control phosphorus remobilization downstream or deplete legacy phosphorus sources more efficiently [49,60,65].
The results of the WRTDS method in the context of the historical nutrient sources, management, and research in the LO watershed highlight the variability of nutrient dynamics within two headwater basins. The difference in flux and concentration trends provided insight into the reasons for the mixed progress from nutrient management between the basins. Although the method is limited from wide use in the LO watershed by the constraint of a positive continuous discharge record without tailwater effects, it could still provide additional insights into nutrient management progress in other agricultural or urban watershed uplands.

Author Contributions

Conceptualization, R.Z.C., S.J.E. and M.N.; methodology, R.Z.C.; software, R.Z.C.; validation, R.Z.C.; formal analysis, R.Z.C.; investigation, R.Z.C.; resources, R.Z.C., S.J.E. and M.N.; data curation, R.Z.C.; writing—original draft preparation, R.Z.C.; writing—review and editing, R.Z.C., S.J.E. and M.N.; visualization, R.Z.C.; supervision, S.J.E. and M.N.; project administration, S.J.E. and M.N.; funding acquisition, S.J.E. and M.N. All authors have read and agreed to the published version of the manuscript.

Funding

This publication was developed under Assistance Agreement No. 84009001 awarded by the U.S. Environmental Protection Agency to USF. It has not been formally reviewed by EPA. The views expressed in this document are solely those of the authors and do not necessarily reflect those of the Agency. EPA does not endorse any products or commercial services mentioned in this publication.

Data Availability Statement

Water quantity and water quality monitoring data evaluated in this paper are available in DBHYDRO: https://my.sfwmd.gov/dbhydroplsql (accessed on 11 October 2023). Anonymized BMP enrollment data used during the study were provided by a third party. Direct requests for these materials may be made to the provider as indicated in the acknowledgments.

Acknowledgments

The authors thank and acknowledge partners who have contributed time, institutional knowledge, and data available to this research. Elizabeth ‘Betsey’ Boughton at Archbold Biological Station for her time and expertise regarding working ranchlands in Florida’s complex ecosystems. FDACS staff were also generous with their time, knowledge, and data available regarding the FDACS BMP program and the methods for tracking enrollment.

Conflicts of Interest

The authors declare no conflicts of interest. The funders had no role in the design of the study; in the collection, analyses, or interpretation of data; in the writing of the manuscript; or in the decision to publish the results.

References

  1. Masters, G.M.; Ela, W.P. Water Pollution. In Introduction to Environmental Engineering and Science; Pearson: London, UK, 2008; pp. 173–266. [Google Scholar]
  2. van Meter, K.J.; Basu, N.B.; Veenstra, J.J.; Burras, C.L. The Nitrogen Legacy: Emerging Evidence of Nitrogen Accumulation in Anthropogenic Landscapes. Environ. Res. Lett. 2016, 11, 035014. [Google Scholar] [CrossRef]
  3. Chen, D.; Shen, H.; Hu, M.; Wang, J.; Zhang, Y.; Dahlgren, R.A. Legacy Nutrient Dynamics at the Watershed Scale: Principles, Modeling, and Implications, 1st ed.; Elsevier Inc.: Amsterdam, The Netherlands, 2018; Volume 149. [Google Scholar]
  4. Ator, S.W.; Blomquist, J.D.; Webber, J.S.; Chanat, J.G. Factors Driving Nutrient Trends in Streams of the Chesapeake Bay Watershed. J. Environ. Qual. 2020, 49, 812–834. [Google Scholar] [CrossRef]
  5. Sharpley, A.; Jarvie, H.P.; Buda, A.; May, L.; Spears, B.; Kleinman, P. Phosphorus Legacy: Overcoming the Effects of Past Management Practices to Mitigate Future Water Quality Impairment. J. Environ. Qual. 2013, 42, 1308–1326. [Google Scholar] [CrossRef]
  6. Van Meter, K.J.; Basu, N.B.; Van Cappellen, P. Two Centuries of Nitrogen Dynamics: Legacy Sources and Sinks in the Mississippi and Susquehanna River Basins. Glob. Biogeochem. Cycles 2017, 31, 2–23. [Google Scholar] [CrossRef]
  7. Shortle, J.S.; Mihelcic, J.R.; Zhang, Q.; Arabi, M. Nutrient Control in Water Bodies: A Systems Approach. J. Environ. Qual. 2020, 49, 517–533. [Google Scholar] [CrossRef]
  8. O’Higgins, T.G.; DeWitt, T.H.; Lago, M. Ecosystem-Based Management, Ecosystem Services and Aquatic Biodiversity; Springer Nature: London, UK, 2020; ISBN 9783030458423. [Google Scholar]
  9. Liu, Y.; Engel, B.A.; Flanagan, D.C.; Gitau, M.W.; McMillan, S.K.; Chaubey, I. A Review on Effectiveness of Best Management Practices in Improving Hydrology and Water Quality: Needs and Opportunities. Sci. Total Environ. 2017, 601–602, 580–593. [Google Scholar] [CrossRef]
  10. Yoder, L.; Chowdhury, R.R.; Hauck, C. Watershed Restoration in the Florida Everglades: Agricultural Water Management and Long-Term Trends in Nutrient Outcomes in the Everglades Agricultural Area. Agric. Ecosyst. Environ. 2020, 302, 107070. [Google Scholar] [CrossRef]
  11. Osmond, D.; Meals, D.W.; Hoag, D.L.K.; Arabi, M. How to Build Better Agricultural Conservation Programs to Protect Water Quality: The NIFA-CEAP Experience; Soil and Water Conservation Society: Ankeny, IA, USA, 2012; ISBN 9780976943297. [Google Scholar]
  12. Aguilar, M.F.; Dymond, R.L. Evaluation of Stormwater Control Measure Performance Uncertainty. J. Environ. Eng. 2019, 145, 04019060. [Google Scholar] [CrossRef]
  13. Hoss, F.; Fischbach, J.; Molina-Perez, E. Effectiveness of Best Management Practices for Stormwater Treatment as a Function of Runoff Volume. J. Water Resour. Plan. Manag. 2016, 142, 05016009. [Google Scholar] [CrossRef]
  14. Liu, Y.; Bralts, V.F.; Engel, B.A. Evaluating the Effectiveness of Management Practices on Hydrology and Water Quality at Watershed Scale with a Rainfall-Runoff Model. Sci. Total Environ. 2015, 511, 298–308. [Google Scholar] [CrossRef] [PubMed]
  15. National Resource Council. Urban Stormwater Management in the United States; National Academies Press: Washington, DC, USA, 2009; ISBN 0309125405. [Google Scholar]
  16. Kleinman, P.J.A.; Fanelli, R.M.; Hirsch, R.M.; Buda, A.R.; Easton, Z.M.; Wainger, L.A.; Brosch, C.; Lowenfish, M.; Collick, A.S.; Shirmohammadi, A.; et al. Phosphorus and the Chesapeake Bay: Lingering Issues and Emerging Concerns for Agriculture. J. Environ. Qual. 2019, 48, 1191–1203. [Google Scholar] [CrossRef]
  17. Lee, C.J.; Hirsch, R.M.; Schwarz, G.E.; Holtschlag, D.J.; Preston, S.D.; Crawford, C.G.; Vecchia, A.V. An Evaluation of Methods for Estimating Decadal Stream Loads. J. Hydrol. 2016, 542, 185–203. [Google Scholar] [CrossRef]
  18. Hirsch, R.M.; Moyer, D.L.; Archfield, S.A. Weighted Regressions on Time, Discharge, and Season (WRTDS), with an Application to Chesapeake Bay River Inputs. JAWRA J. Am. Water Resour. Assoc. 2010, 46, 857–880. [Google Scholar] [CrossRef]
  19. Hirsch, R.M.; De Cicco, L.A. User Guide to Exploration and Graphics for RivEr Trends (EGRET) and DataRetrieval: R Packages for Hydrologic Data. In Hydrologic Analysis and Interpretation; US Geological Survey: Reston, VA, USA, 2015. [Google Scholar]
  20. Oelsner, G.P.; Sprague, L.A.; Murphy, J.C.; Zuellig, R.E.; Johnson, H.M.; Ryberg, K.R.; Falcone, J.A.; Stets, E.G.; Vecchia, A.V.; Riskin, M.L.; et al. Water-Quality Trends in the Nation’s Rivers and Streams, 1972–2012—Data Preparation, Statistical Methods, and Trend Results; U.S. Geological Survey Scientific Investigations Report; US Geological Survey: Reston, VA, USA, 2017; 136p. [Google Scholar] [CrossRef]
  21. Murphy, J.; Sprague, L. Water-Quality Trends in US Rivers: Exploring Effects from Streamflow Trends and Changes in Watershed Management. Sci. Total Environ. 2019, 656, 645–658. [Google Scholar] [CrossRef]
  22. Chanat, J.G.; Moyer, D.L.; Blomquist, J.D.; Hyer, K.E.; Langland, M.J. Application of a Weighted Regression Model for Reporting Nutrient and Sediment Concentrations, Fluxes, and Trends in Concentration and Flux for the Chesapeake Bay Nontidal Water-Quality Monitoring Network, Results through Water Year 2012; US Geological Survey: Reston, VA, USA, 2016. [Google Scholar]
  23. Murphy, J.C. Changing Suspended Sediment in United States Rivers and Streams: Linking Sediment Trends to Changes in Land Use/Cover, Hydrology and Climate. Hydrol. Earth Syst. Sci. 2020, 24, 991–1010. [Google Scholar] [CrossRef]
  24. Canion, A.; Hoge, V.; Jobes, T.; Dobberfulh, D. Phosphorus and Nitrogen Export Associated with Biosolids Applications in Tributary Watersheds of the St. Johns River; St. Johns River Water Management District: Palatka, FL, USA, 2021. [Google Scholar]
  25. Engstrom, D.R.; Schottler, S.P.; Leavitt, P.R.; Havens, K.E. A Reevaluation of the Cultural Eutrophication of Lake Okeechobee Using Multiproxy Sediment Records. Ecol. Appl. 2006, 16, 1194–1206. [Google Scholar] [CrossRef]
  26. National Academies of Sciences, Engineering, and Medicine. Progress toward Restoring the Everglades: The Eighth Biennial Review—2020; National Academies of Sciences, Engineering, and Medicine: Washington, DC, USA, 2021; ISBN 9780309679787. [Google Scholar]
  27. Reddy, K.R.; Newman, S.; Osborne, T.Z.; White, J.R.; Fitz, H.C. Phosphorous Cycling in the Greater Everglades Ecosystem: Legacy Phosphorous Implications for Management and Restoration. Crit. Rev. Environ. Sci. Technol. 2011, 41, 149–186. [Google Scholar] [CrossRef]
  28. Lodge, T.E. Lake Okeechobee and the Everglades Headwaters. In The Everglades Handbook; CRC Press: Boca Raton, FL, USA, 2021; pp. 167–191. [Google Scholar] [CrossRef]
  29. Rivera-Monroy, V.H.; Cattelino, J.; Wozniak, J.R.; Schwartz, K.; Noe, G.B.; Castaneda-Moya, E.; Koch, G.R. The Life of P: A Biogeochemical and Sociopolitical Challenge in the Everglades. In The Coastal Everglades: The Dynamics of Social-Ecological Transformation in the South Florida Landscape; Boyer, J.N., Davis, S.E., Eds.; Oxford University Press: New York, NY, USA, 2019; pp. 99–128. [Google Scholar]
  30. Sklar, F.H.; Chimney, M.J.; Newman, S.; McCormick, P.; Gawlik, D.; Miao, S.L.; McVoy, C.; Said, W.; Newman, J.; Coronado, C.; et al. The Ecological–Societal Underpinnings of Everglades Restoration. Front. Ecol. Environ. 2005, 3, 161–169. [Google Scholar] [CrossRef]
  31. Flaig, E.G.; Reddy, K.R. Fate of Phosphorus in the Lake Okeechobee Watershed, Florida, USA: Overview and Recommendations. Ecol. Eng. 1995, 5, 127–142. [Google Scholar] [CrossRef]
  32. Yariett, L.L. History of the Florida Cattle Industry. Rangelands 1985, 7, 205–207. [Google Scholar]
  33. Boggess, C.F.; Flaig, E.G.; Fluck, R.C. Phosphorus Budget-Basin Relationships for Lake Okeechobee Tributary Basins. Ecol. Eng. 1995, 5, 143–162. [Google Scholar] [CrossRef]
  34. South Florida Water Management District (SFWMD). South Florida Environmental Report, Chapter 8B: Lake Okeechobee Watershed Protection Plan Annual Progress Report; SFWMD: West Palm Beach, FL, USA, 2023. [Google Scholar]
  35. Davis, F.E.; Marshall, M.L. Marshall Chemical and Biological Investigations of Lake Okeechobee January 1973–June 1974 Interim Report; Resources Planning Department, Central and Southern Florida Flood Control District: West Palm Beach, FL, USA, 1975. [Google Scholar]
  36. Federico, A. Investigations of the Relationship Between Land Use, Rainfall, and Runoff Quality in the Taylor Creek Watershed; Resources Planning Department, Central and Southern Florida Flood Control District: West Palm Beach, FL, USA, 1977. [Google Scholar]
  37. Hiscock, J.G.; Thourot, C.S.S.; Zhang, J. Phosphorus Budget—Land Use Relationships for the Northern Lake Okeechobee Watershed, Florida. Ecol. Eng. 2003, 21, 63–74. [Google Scholar] [CrossRef]
  38. Havens, K.E.; Eric, G.; Flaig, R. Thomas James, Sergio Lostal, and Dera Muszick. Results of a Program to Control Phosphorus Discharges from Dairy Operations in South-Central Florida, USA. Environ. Manag. 1996, 20, 585–593. [Google Scholar] [CrossRef] [PubMed]
  39. Bottcher, A.B.; Tremwel, T.K.; Campbell, K.L. Best Management Practices for Water Quality Improvement in the Lake Okeechobee Watershed. Ecol. Eng. 1995, 5, 341–356. [Google Scholar] [CrossRef]
  40. Swift, D.; VanArman, J.; Gulick, L.; Federico, T. Interim Surface Water Improvement and Management Swim Plan for Lake Okeechobee; South Florida Water Management District: West Palm Beach, FL, USA, 1989. [Google Scholar]
  41. Florida Adminstrative Code (F.A.C.) Rule 62-640. Available online: https://www.flrules.org/gateway/ChapterHome.asp?Chapter=62-640 (accessed on 11 October 2023).
  42. Florida Department of Environmental Protection (FDEP). Lake Okeechobee Basin Management Action Plan; Florida Department of Environmental Protection (FDEP): Tallahassee, FL, USA, 2020. [Google Scholar]
  43. FDACS. Available online: https://www.fdacs.gov/Agriculture-Industry/Water/Agricultural-Best-Management-Practices (accessed on 15 March 2022).
  44. Frydenborg, B.R.; Frydenborg, R.B. A Meta-Analytical Approach for Determining the Effectiveness of Agricultural Best Management Practices (BMPs) for Reducing Nutrient Pollution in Florida Phase 2: Cow/Calf Operations, Vegetable Crops, and Agronomic Crops; Fydenborg EcoLogic, LLC.: Tallahassee, FL, USA, 2016. Available online: https://ccmedia.fdacs.gov/content/download/76315/file/NC1_FinalReport.pdf (accessed on 3 February 2021).
  45. Florida Department of Agriculture and Consumer Services (FDACS). Best Management Practices for Florida Cow/Calf Operations; FDACS: Tallahassee, FL, USA, 2008. [Google Scholar]
  46. He, Z.; Hiscock, J.G.; Merlin, A.; Hornung, L.; Liu, Y.; Zhang, J. Phosphorus Budget and Land Use Relationships for the Lake Okeechobee Watershed, Florida. Ecol. Eng. 2014, 64, 325–336. [Google Scholar] [CrossRef]
  47. Khare, Y.P.; Paudel, R.; Wiederholt, R.; Abiy, A.Z.; Van Lent, T.; Davis, S.E.; Her, Y. Watershed Response to Legacy Phosphorus and Best Management Practices in an Impacted Agricultural Watershed in Florida, U.S.A. Land 2021, 10, 977. [Google Scholar] [CrossRef]
  48. Goldstein, A.L.; Berman, W. Phosphorus Management on Confinement Dairies in Southern Florida. Ecol. Eng. 1995, 5, 357–370. [Google Scholar] [CrossRef]
  49. Bohlen, P.J.; Villapando, O.R. Controlling Runoff from Subtropical Pastures Has Differential Effects on Nitrogen and Phosphorus Loads. J. Environ. Qual. 2011, 40, 989–998. [Google Scholar] [CrossRef]
  50. Ritter, G.J.; Allen, L.H. Taylor Creek Headwaters Project Phase I Report; Water Quality; Resource Planning Department, South Florida Water Management District: West Palm Beach, FL, USA, 1982. [Google Scholar]
  51. Environmental Systems Research Institute, Inc. (ESRI). National Geographic. Scale Not Given. National Geographic Style Base. Available online: https://tiles.arcgis.com/tiles/P3ePLMYs2RVChkJx/arcgis/rest/services/NatGeoStyleBase/MapServer (accessed on 2 March 2023).
  52. ESRI. National Geographic. [Vector Tile Service]. Scale Not Given. “National Geographic Style”. Available online: https://basemaps.arcgis.com/arcgis/rest/services/World_Basemap_v2/VectorTileServer (accessed on 2 March 2023).
  53. R Core Team. R: A Language and Environment for Statistical Computing; R Foundation for Statistical Computing: Vienna, Austria, 2022. [Google Scholar]
  54. Oelsner, G.P.; Stets, E.G. Recent Trends in Nutrient and Sediment Loading to Coastal Areas of the Conterminous U.S.: Insights and Global Context. Sci. Total Environ. 2018, 654, 1225–1240. [Google Scholar] [CrossRef]
  55. Choquette, A.F.; Hirsch, R.M.; Murphy, J.C.; Johnson, L.T.; Confesor, R.B. Tracking Changes in Nutrient Delivery to Western Lake Erie: Approaches to Compensate for Variability and Trends in Streamflow. J. Great Lakes Res. 2019, 45, 21–39. [Google Scholar] [CrossRef]
  56. Hirsch, R.M.; Archfield, S.A.; De Cicco, L.A. A Bootstrap Method for Estimating Uncertainty of Water Quality Trends. Environ. Model. Softw. 2015, 73, 148–166. [Google Scholar] [CrossRef]
  57. South Florida Water Management District (SFWMD). DBHYDRO. Available online: https://my.sfwmd.gov/dbhydroplsql/show_dbkey_info.main_menu (accessed on 11 October 2023).
  58. FDEP OCULUS. Available online: https://depedms.dep.state.fl.us/Oculus/servlet/search (accessed on 12 November 2023).
  59. FDEP Information (Nexus) Portual. Available online: https://prodenv.dep.state.fl.us/DepNexus/public/searchPortal (accessed on 12 November 2023).
  60. Zhang, J.; Burke, P.; Iricanin, N.; Hill, S.; Gray, S.; Budell, R. Long-Term Water Quality Trends in the Lake Okeechobee Watershed, Florida. Crit. Rev. Environ. Sci. Technol. 2011, 41, 548–575. [Google Scholar] [CrossRef]
  61. Khare, Y.P.; Naja, G.M.; Paudel, R.; Martinez, C.J. A Watershed Scale Assessment of Phosphorus Remediation Strategies for Achieving Water Quality Restoration Targets in the Western Everglades. Ecol. Eng. 2020, 143, 105663. [Google Scholar] [CrossRef]
  62. Reddy, K.R.; Kadlec, R.H.; Flaig, E.; Gale, P.M. Phosphorus Retention in Streams and Wetlands: A Review. Crit. Rev. Environ. Sci. Technol. 1999, 29, 83–146. [Google Scholar] [CrossRef]
  63. Reddy, K.R.; Flaig, E.G.; Graetz, D.A. Phosphorus Storage Capacity of Uplands, Wetlands and Streams of the Lake Okeechobee Watershed, Florida. Agric. Ecosyst. Environ. 1996, 59, 203–216. [Google Scholar] [CrossRef]
  64. Swain, H.M.; Bohlen, P.J.; Campbell, K.L.; Lollis, L.O.; Steinman, A.D. Integrated Ecological and Economic Analysis of Ranch Management Systems: An Example From South Central Florida. Rangel. Ecol. Manag. 2007, 60, 1–11. [Google Scholar] [CrossRef]
  65. Osmond, D.L.; Shober, A.L.; Sharpley, A.N.; Duncan, E.W.; Hoag, D.L.K. Increasing the Effectiveness and Adoption of Agricultural Phosphorus Management Strategies to Minimize Water Quality Impairment. J. Environ. Qual. 2019, 48, 1204–1217. [Google Scholar] [CrossRef] [PubMed]
Figure 1. The two basins in the TCNS catchments sub-watershed to LO were selected for the analysis [51,52]. Discharge and water quality are measured as water within the Taylor Creek Headwaters Basin discharges to Taylor Creek to the south, and the Williamson Ditch Basin discharges to Taylor Creek to the southwest (inset map shows the location of the study area within Florida, USA).
Resources 13 00028 g001
Figure 2. Discrete (dots) and locally weighted smoothed (solid curve) annualized daily discharge (Q) trends for Taylor Creek Headwaters and Williamson Ditch.
Resources 13 00028 g002
Figure 3. Discrete (dots) and locally weighted smoothed (solid curve) annualized maximum (max) 30-day mean of daily discharge trends for Taylor Creek Headwaters and Williamson Ditch for wet (May to November) and dry (December to April) seasons.
Resources 13 00028 g003
Figure 4. Annualized concentration water quality trends (solid line) are enclosed by the 90% confidence interval (dashed line).
Resources 13 00028 g004
Figure 5. Annualized flux water quality trends (solid line) are enclosed by the 90% confidence interval (dashed line).
Resources 13 00028 g005
Figure 6. Spatial distribution land use land cover (LULC) for (a) 1999, (b) 2004, (c) 2008, (d) 2017, and (2017) overlayed with agricultural best management practice (Ag. BMP) enrollment in the Taylor Creek Headwaters and Williamson Ditch catchments during (a) 2000–2004, (b) 2005–2009, (c) 2010–2014, (d) 2015–2019, and (e) 2020–2021. Cow/Calf BMP enrollments are grouped based on the time of enrollment, and all other agricultural commodity BMPs are categorized together.
Resources 13 00028 g006
Table 1. Types and examples of cow/calf best management practices (BMPs) as defined by the Florida Department of Agricultural and Consumer Services (FDACS).
BMP TypesBMP DescriptionBMP Examples
INon-structural,
Low Cost
Soil Testing
Slow-Release Fertilizer
Timing Fertilizer Application
II 1Structural,
Moderate Cost
Fencing
Culverts
Sediment Traps
Tailwater Recovery Systems
Water-Control Structures
III 1Structural,
High Cost
Grade Stabilization
Stormwater Retention/Detention
1 Type II and Type III BMPs are considered advanced treatment, and opportunities exist for cost-sharing with FDACS and the agricultural producer [43,44,45,46].
Table 2. Nutrient runoff concentrations from pasture and dairy land use in LO watershed at different phases of BMP implementation within the basin.
Study YearMajor Agricultural
Land Use Land Cover
(Percentage of Basin)
BMP
Implementation Stage
Runoff Concentration (mg/L)
TN 2TP
1977
[36]
Improved pasture (85%)
Dairy (8.7%)
Before
Taylor Creek
Headwaters
Program: No existing BMPs
TKN: 1.30–5.39
Nitrite: 0.007–0.03
Nitrate: 0.004–0.311
1.26–2.90
Improved pasture (80%)
Citrus (6%)
TKN: 1.17–1.93
Nitrite: 0.004–0.033
Nitrate: 0.007–0.345
0.27–0.905
Improved pasture (79%)
Dairy (21%)
TKN: 2.36–11.20
Nitrite: 0.009–1.56
Nitrate: 0.004–1.88
2.01–6.21
Improved pasture (86%)
Crop (4%)
TKN: 1.33–2.75
Nitrite: 0.007–0.021
Nitrate: 0.004–0.380
0.238–0.957
1995
[48]
Dairy (100%)Before
Dairy Rule
Not Reported6.78
Dairy (100%)After
Dairy Rule
2.70
Improved pasture (100%)0.66–0.74
2011 1
[49]
Improved pasture
(100%)
Before BMP
(Water-Control Structure)
3.310.66
After BMP
(Water-Control Structure)
2.860.89
1 Values are reported as flow-weighted mean concentrations. 2 Total Nitrogen is the addition of Total Kjeldahl Nitrogen (TKN = ammonia + organic nitrogen) and NOx (NOx = nitrate + nitrite).
Table 3. Total phosphorus (TP) loading of select land uses in the TCNS sub-watershed to LO from previous modeling studies.
Land Use Land CoverTP Loading (kg/ha/yr)
2014 [46]2021 [47]
Abandoned Dairy8.824.45
Citrus0.862.21
Dairy3.4011
Improved Pasture1.511.82
Low Density Residential0.340.63
Unimproved Pasture0.310.96
Table 4. Percentage of land use land cover of the Taylor Creek Headwaters and Williamson Ditch Basin from 1988 to 2017.
BasinLand Use Land Cover198819951999200520082017
Taylor Creek HeadwatersAgriculturalImproved Pasture65.9%57.2%62.9%60.0%63.0%55.9%
Pasture14.6%3.4%9.5%9.4%7.0%6.1%
Dairy0.8%9.9%6.3%6.3%6.3%21.1%
Cattle Feeding Operation--0.4%0.3%2.0%0.3%
Citrus Groves2.9%3.6%4.3%4.2%4.2%4.1%
Cropland-4.3%4.4%7.0%4.8%1.0%
Other Agricultural0.4%0.4%0.4%0.8%0.7%0.7%
UrbanLow Density Residential1.8%0.0%0.3%0.9%1.2%1.4%
Other Urban0.4%2.7%1.3%1.2%1.2%1.2%
Upland Forest3.8%7.0%1.0%0.8%0.6%0.6%
Upland Nonforest-2.9%0.6%0.7%1.0%0.4%
Wetland9.4%6.3%7.6%7.8%7.4%6.7%
Water0.1%2.2%0.5%0.4%0.4%0.2%
Williamson DitchAgriculturalImproved Pasture65.9%48.8%60.1%49.7%54.5%52.3%
Pasture7.9%13.9%14.4%16.0%17.7%17.7%
Dairy-0.2%0.1%0.1%0.1%0.6%
Cattle Feeding Operation------
Citrus Groves3.8%4.2%4.2%4.2%4.2%4.2%
Cropland-2.8%3.8%10.3%3.5%3.1%
Other Agricultural0.4%0.3%0.7%0.5%0.6%0.6%
UrbanLow Density Residential5.0%0.0%4.1%5.2%5.4%4.1%
Other Urban1.8%8.1%2.0%3.2%3.1%4.4%
Upland Forest5.6%15.3%1.7%1.3%1.6%1.6%
Upland Nonforest-1.0%0.8%0.6%1.4%1.4%
Wetland9.7%4.8%7.7%8.4%7.6%9.7%
Water0.1%0.7%0.4%0.5%0.5%0.5%
Table 5. Daily mean discharge data utilized from the SFWMD database.
Basin
(USGS ID)
Data UtilizedDaily Mean Discharge Values
TotalMissingZerosNegativeEstimated
Taylor Creek Headwaters
(02274010)
7 August 2003–
23 September 2023
7368019930172
Williamson Ditch
(02274490)
4 September 2003–
23 September 2023
735503490229
Table 6. Nutrient data values from the SFWMD database.
Basin
(SFWMD ID)
Parameter (mg/L)Data UtilizedData Values
TotalCensored Values 1Data Quality Flag 2
Taylor Creek Headwaters
(TCNS 213)
Total Nitrogen10 July 2014–
21 September 2023
12601
Total Kjeldahl Nitrogen20 August 2003–
17 March 2014
19902
Nitrate and Nitrite20 August 2003–
21 September 2023
199202
Total Phosphorus20 August 2003–
21 September 2023
32603
Williamson Ditch
(TCNS 214)
Total Nitrogen25 June 2014–
6 September 2023
12601
Total Kjeldahl Nitrogen4 September 2003–
17 February 2014
17303
Nitrate and Nitrite4 September 2003–
17 February 2014
171500
Total Phosphorus4 September 2003–
9 September 2023
30001
1 Censored values are samples reported as zero or a negative value. Censored values have been replaced with the reportable detection limit, annotated, and included in the analysis. 2 Data quality flags are samples reported with a data quality remark code that indicates inaccurate sampling values. Data values with a data quality flag have not been included in the analysis.
Table 7. Flux bias statistic, a representation of the model fit, for WRTDS models.
BasinFlux Bias Statistic
TNTP
Taylor Creek Headwaters−0.0050.002
Williamson Ditch0.004−0.002
Table 8. Cumulative total BMPs implemented within the FDACS cow/calf BMP program in basins Taylor Creek Headwaters and Williamson Ditch.
BasinYear of EnrollmentCumulative Total
Type I BMPsType II BMPs
Taylor Creek Headwaters2000–2004702
2005–2009702
2010–201428611
2015–2019103222
2020–2021149326
Williamson Ditch2010–20142929
2015–201980516
2020–2021105966
Disclaimer/Publisher’s Note: The statements, opinions and data contained in all publications are solely those of the individual author(s) and contributor(s) and not of MDPI and/or the editor(s). MDPI and/or the editor(s) disclaim responsibility for any injury to people or property resulting from any ideas, methods, instructions or products referred to in the content.

