1. Introduction
This study compares district heating substations (DHSs) for single- and two-family houses (SFH, TFH) to determine which system is more suitable for use in a local district heating network (DHN) primarily consisting of SFH and TFH. DHSs with lower return temperatures have the potential to reduce heat loss, pumping power, and pipe diameters. A hardware-in-the-loop test rig (HiL) is used to conduct a dynamic comparative measurement of the DHS for SFH and TFH. Previous research has examined the effect of building technology (the term building technology includes DHS and the control of the heating and domestic hot water system) on reducing return temperatures in DHNs and identified a significant impact. Henke et al. [
1] measured seven innovative domestic hot water (DHW) systems for multi-family houses. Three of the seven systems delivered average return temperatures below 35 °C. The most cost-effective of the three systems already amortized itself after one year due to the lower return temperatures. Gustafsson et al. [
2] proposed an optimal control strategy for the radiator system temperature with the potential to reduce return temperature by up to 4.8 °C compared to temperature control strategies based solely on outdoor temperature. The authors established the optimal radiator system temperatures for various DHN feed temperatures by minimizing the volume flow in the radiator system. This generated a novel radiator system control curve based on the primary supply temperature, thereby maximizing the temperature difference between supply and return. Van Oevelen et al. [
3] investigated the influence of an optimized secondary side radiator flow temperature on the DHN in different operating cases:
High-temperature DHN feed of 95 to 63 °C;
Low-temperature DHN feed of 65 bis 48 °C;
Oversizing the heating system design.
In the high-temperature case, the average DHN return temperatures can be lowered by 6 °C, while in the case of low DHN feed temperatures, only 2.6 °C can be achieved. With 100% oversizing of the heating system design, the return temperature could be reduced by 9.8 °C. This combination of measures ultimately led to a maximum decrease in the return temperature of up to 18.2 °C. Siuta-Olcha et al. [
4] demonstrated the benefits of replacing a bifunctional area substation with compact heat exchanger heat stations with weather automation in 13 multi-family buildings connected to the DHN. In particular, the use of a weather monitor in the area substation resulted in a 23.6% reduction in corrected heat consumption in one heating system the following year. Additionally, the conversion of the area substation to individual substations in the buildings was found to have reduced actual heat consumption for tap water needs by an average of 29% over 10 years. Tahiri et al. [
5] developed a two-stage proportional gain control concept and tested it in a multi-story residential building. The results from the field test indicated a 7 °C reduction in the energy-weighted DHN return temperature and a 23.6% decrease in the total DHN flow compared to the conventional thermostatic control. Vannahme et al. [
6] discovered that replacing thermostatic valves with digital controllers in DHS has a significant effect on reducing return temperatures by up to 20 K. The results of all these studies indicate potential for improving the efficiency of DHN systems through further advancements of state-of-the-art DHSs. The study at hand presents a metrological comparison between a standard DHS and a novel one in order to provide input for the further development of DHSs for SFH/TFH.
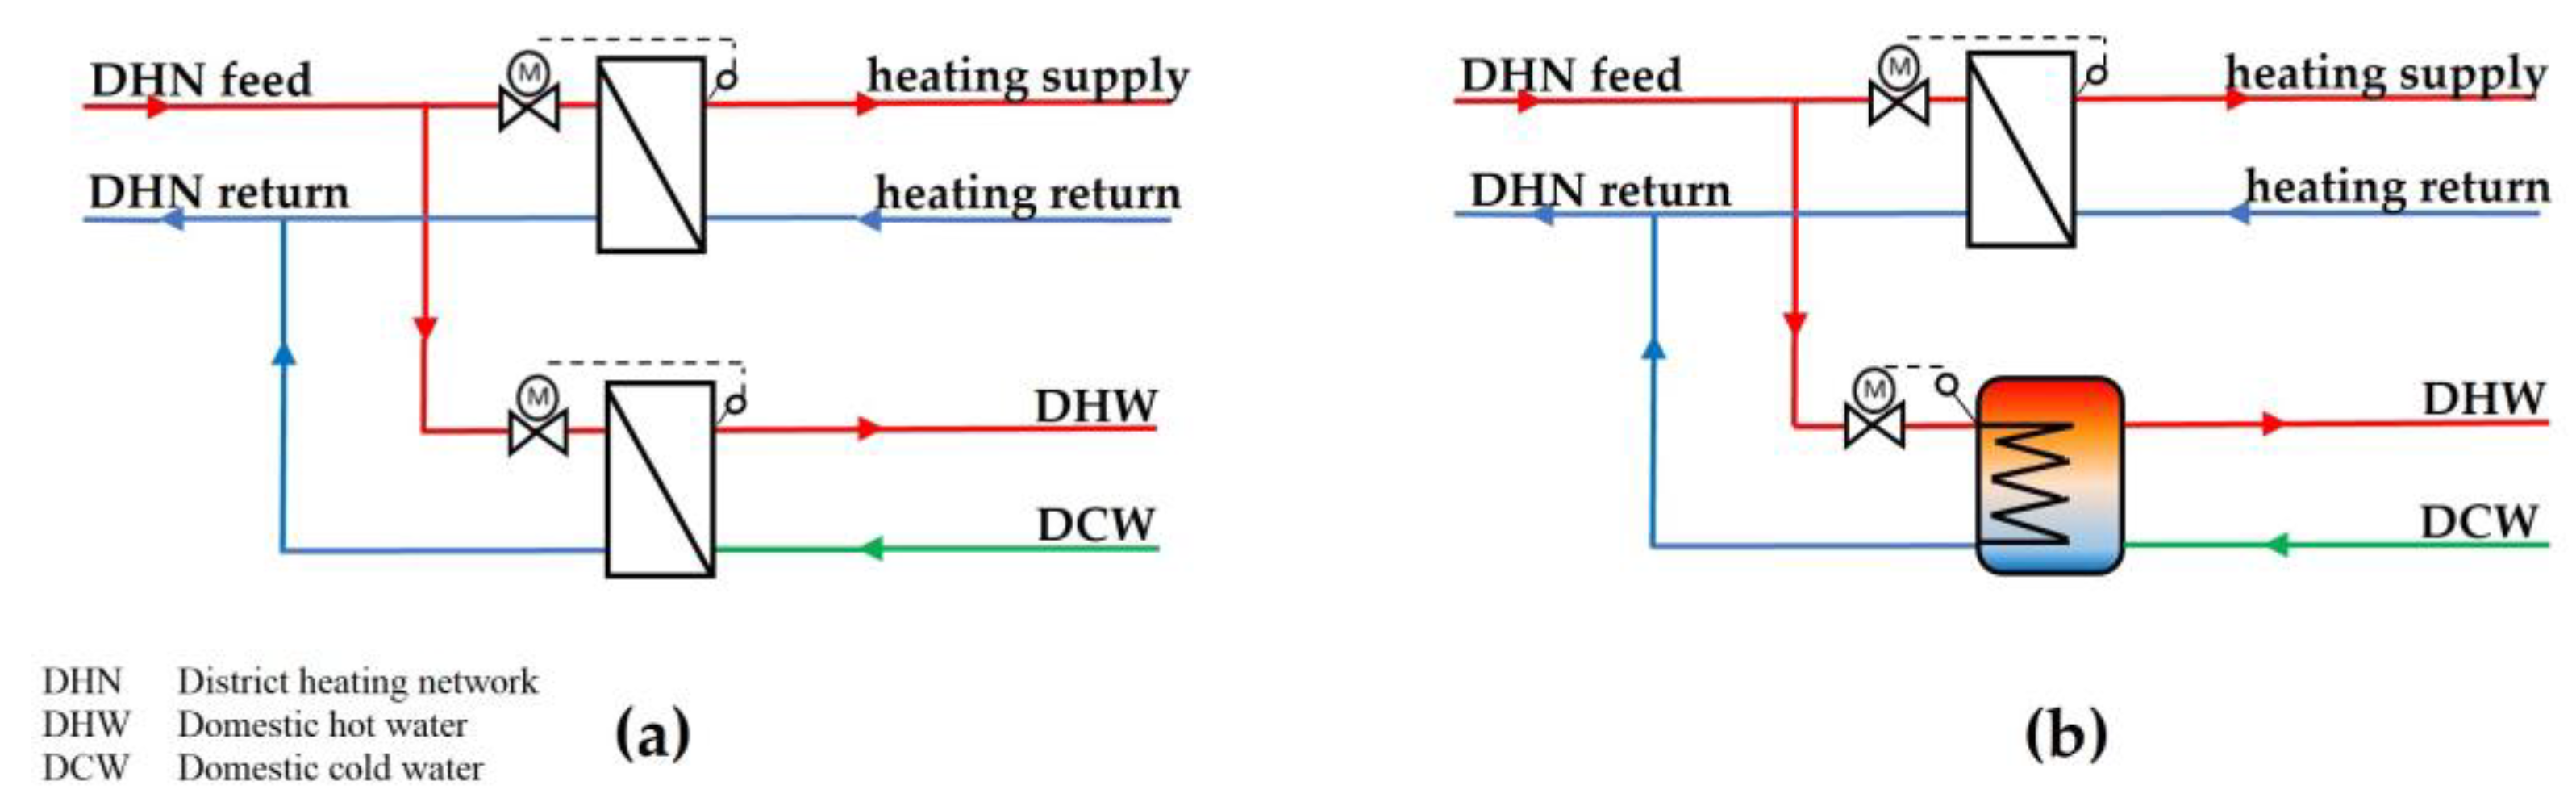
This section will provide an overview of DHSs available for SFH/TFH, followed by a discussion of the newer DHS concept. In Germany, two common types of DHS systems are used in local DHNs, wherein the main consumers are SFH and TFH: continuous-flow system (CFS) and storage system (SS) (the abbreviations CFS and SS were not defined by the authors; they are taken from [
7]) [
7,
8] (
Figure 1). Parallel or one-stage connection is the term used for CFSs in Sweden [
9]. According to [
10], CFSs require high thermal power for a short period of time to meet DHW demand. During a DHW cycle, CFSs enable low return temperatures to the DHN. SSs are characterized by lower connected loads and the balancing effect of the storage capacity, which occurs mainly during DHW withdrawal. However, the space requirement, the higher return temperatures, and the potential for contamination of drinking water must be taken into consideration as potential disadvantages.
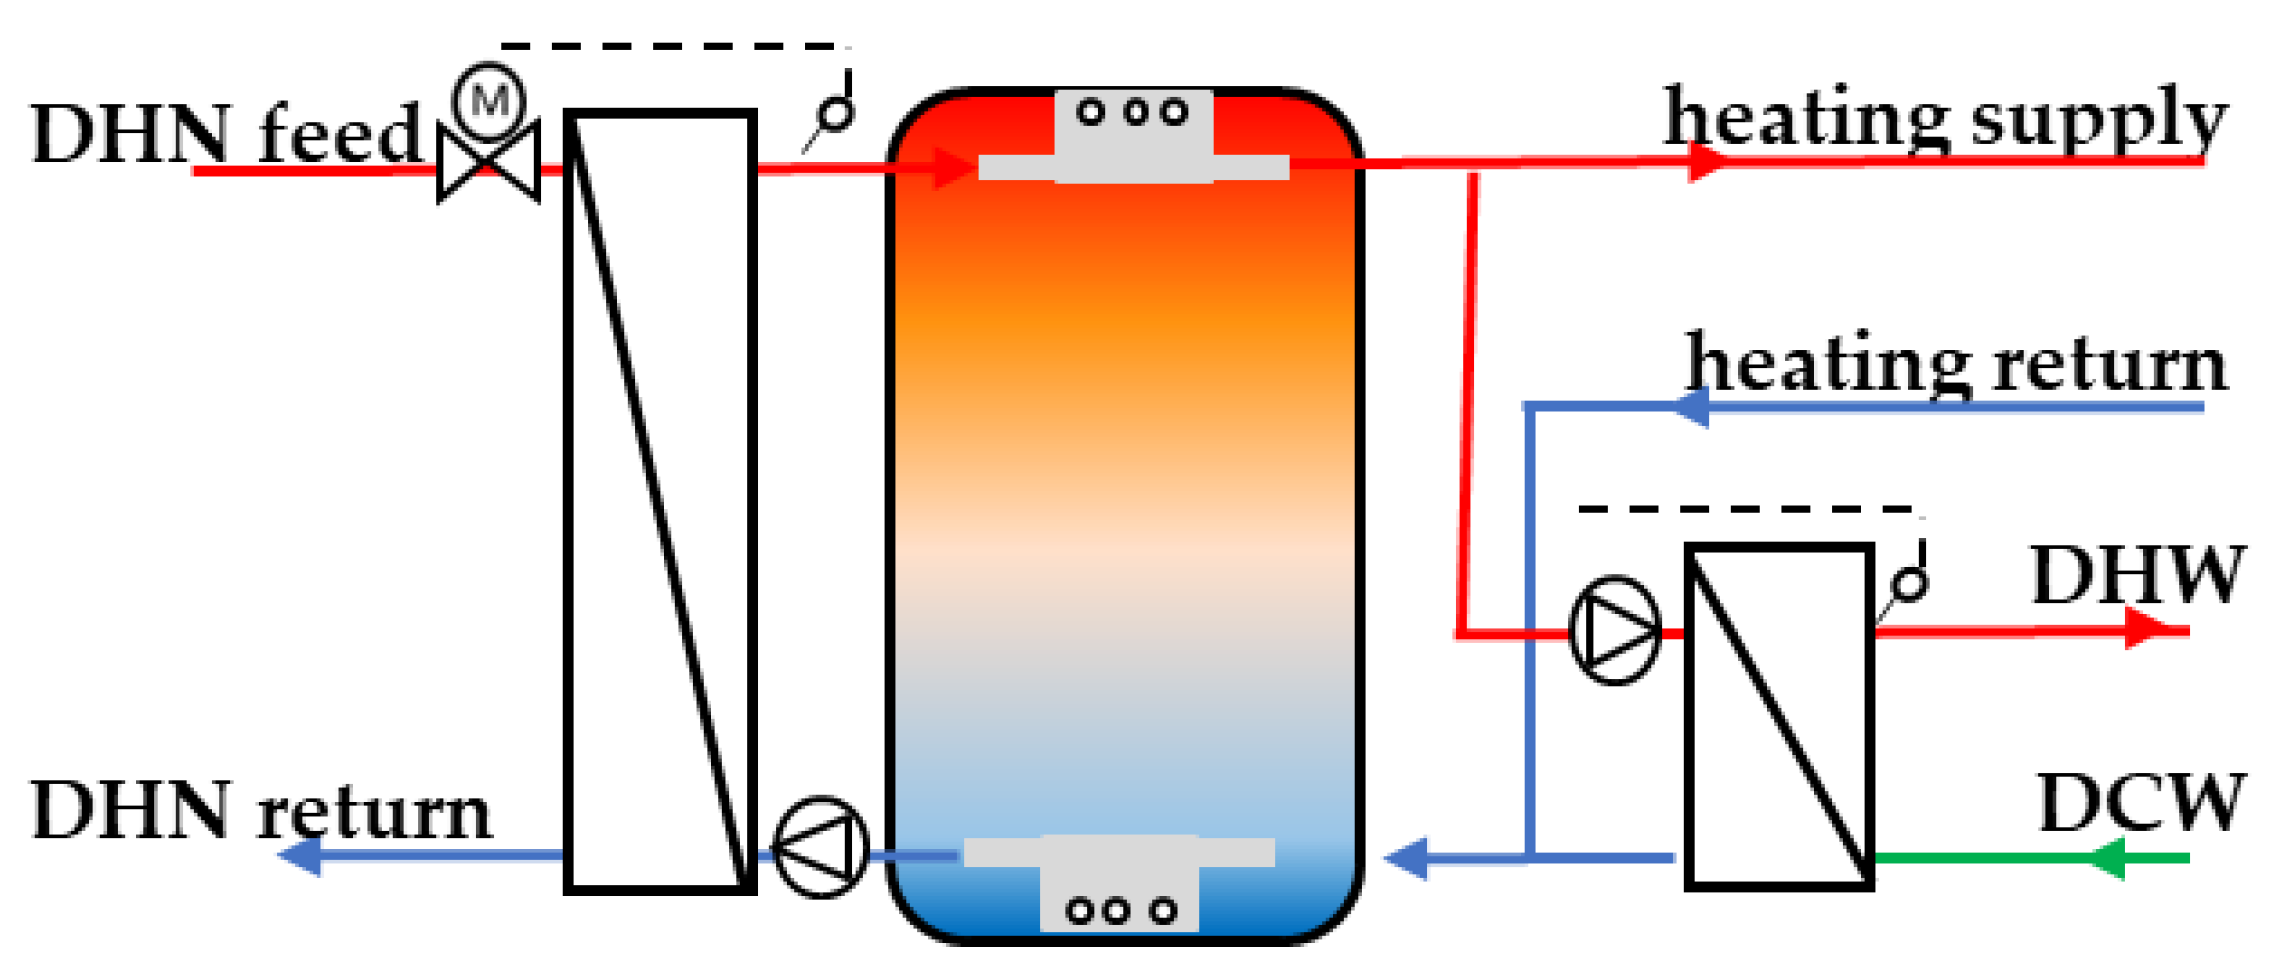
This study investigates a newer concept of a DHS referred to as Storage-DHS (SDHS) (
Figure 2). The SDHS is designed to offer the benefits of load balancing and low return temperatures. It consists of a thermal storage with a capacity ranging from 500 to 1000 liters.
Thermal stratification that is optimized within a storage can result in a decrease in the return temperatures. The high storage capacity of DHNs reduces the peak power requirement which subsequently results in a reduced volumetric flow rate and pressure drop within the DHN. Furthermore, this leads to a decrease in the electric energy consumption of the central circulation pump when compared to CFSs. Heating of DHW is achieved hygienically via an external plate heat exchanger, referred to as a ‘fresh-water module’. SDHSs exhibit increased thermal losses in comparison to CFSs due to the stored heat. An SDHS can be configured with a constant low volumetric flow rate, which has the benefits mentioned above for the DHN. Other charging strategies can also be implemented, depending on the type of DHN and consumer, such as the schedule-based charging discussed in [
11,
12]. Ref. [
13] examines the effects of an SDHS on a local DHN with a simulation model. Laboratory testing, as employed in the study presented here, provides the capability to measure natural thermal mixing within the storage. Additionally, it enables the investigation of realistic DHW withdrawal processes. Recent years have seen an increase in the use of the HiL method to analyze hydraulic heating systems (
Table 1). This approach integrates simulation-based and metrological analyses to facilitate the optimal development of novel components or systems. El-Baz et al. [
14] conducted an energy and dynamic analysis to investigate the potential benefit of HiL and the requirement for dynamic analyses. DHSs were tested by Al Koussa et al. [
15]. They constructed a test rig to evaluate and enhance the performance of existing DHS for use in 4th generation DHN. The results indicated that improvements are necessary for DHW production at lower DH supply temperatures.
In order to ascertain the efficacy of SDHSs and CFSs for non-retrofitted buildings, both systems are subjected to identical hydraulic and thermal tests. The results are being compared based on the same load profiles, with a particular emphasis on the return temperatures to the DHN and the requested load peaks. To summarize, the choice of DHS system depends highly on the operation strategy of the DHN, taking into account the size of the network, the heat sources, and the load characteristics.
2. Materials and Methods
2.1. Description of the Thermal Test Rig
A thermal test rig has been designed and built for the measurement and optimization of DHS as well as heat pumps and thermal storages. The test setup allows the measurement of the whole system under reproducible conditions. This is considered as a major benefit compared with on-site-measurements, where measurements are heavily affected by external effects (e.g., weather conditions). Another advantage of testing the systems under laboratory conditions is that typical dynamic conditions could be reached. The systems can also be measured outside of their specified conditions. In addition, the measuring times for the two systems can be reduced, especially in comparison to time-intensive on-site measurements of permanently installed systems. The data obtained can analyzed only for prototype optimization, or they can also be used to validate simulation models. In further research, the reaction of the load side, especially the return temperatures of the heating systems, should also be included. Therefore, the test rig is designed with HiL option and can be coupled to a simulation environment [
25].
The laboratory measurements conducted for this investigation required the construction of a thermal test rig (
Figure 3). The test rig includes five hydraulic loops: two for heating, two for cooling, and one for the tap water drawing.
Table 2 shows the maximum test values of each loop.
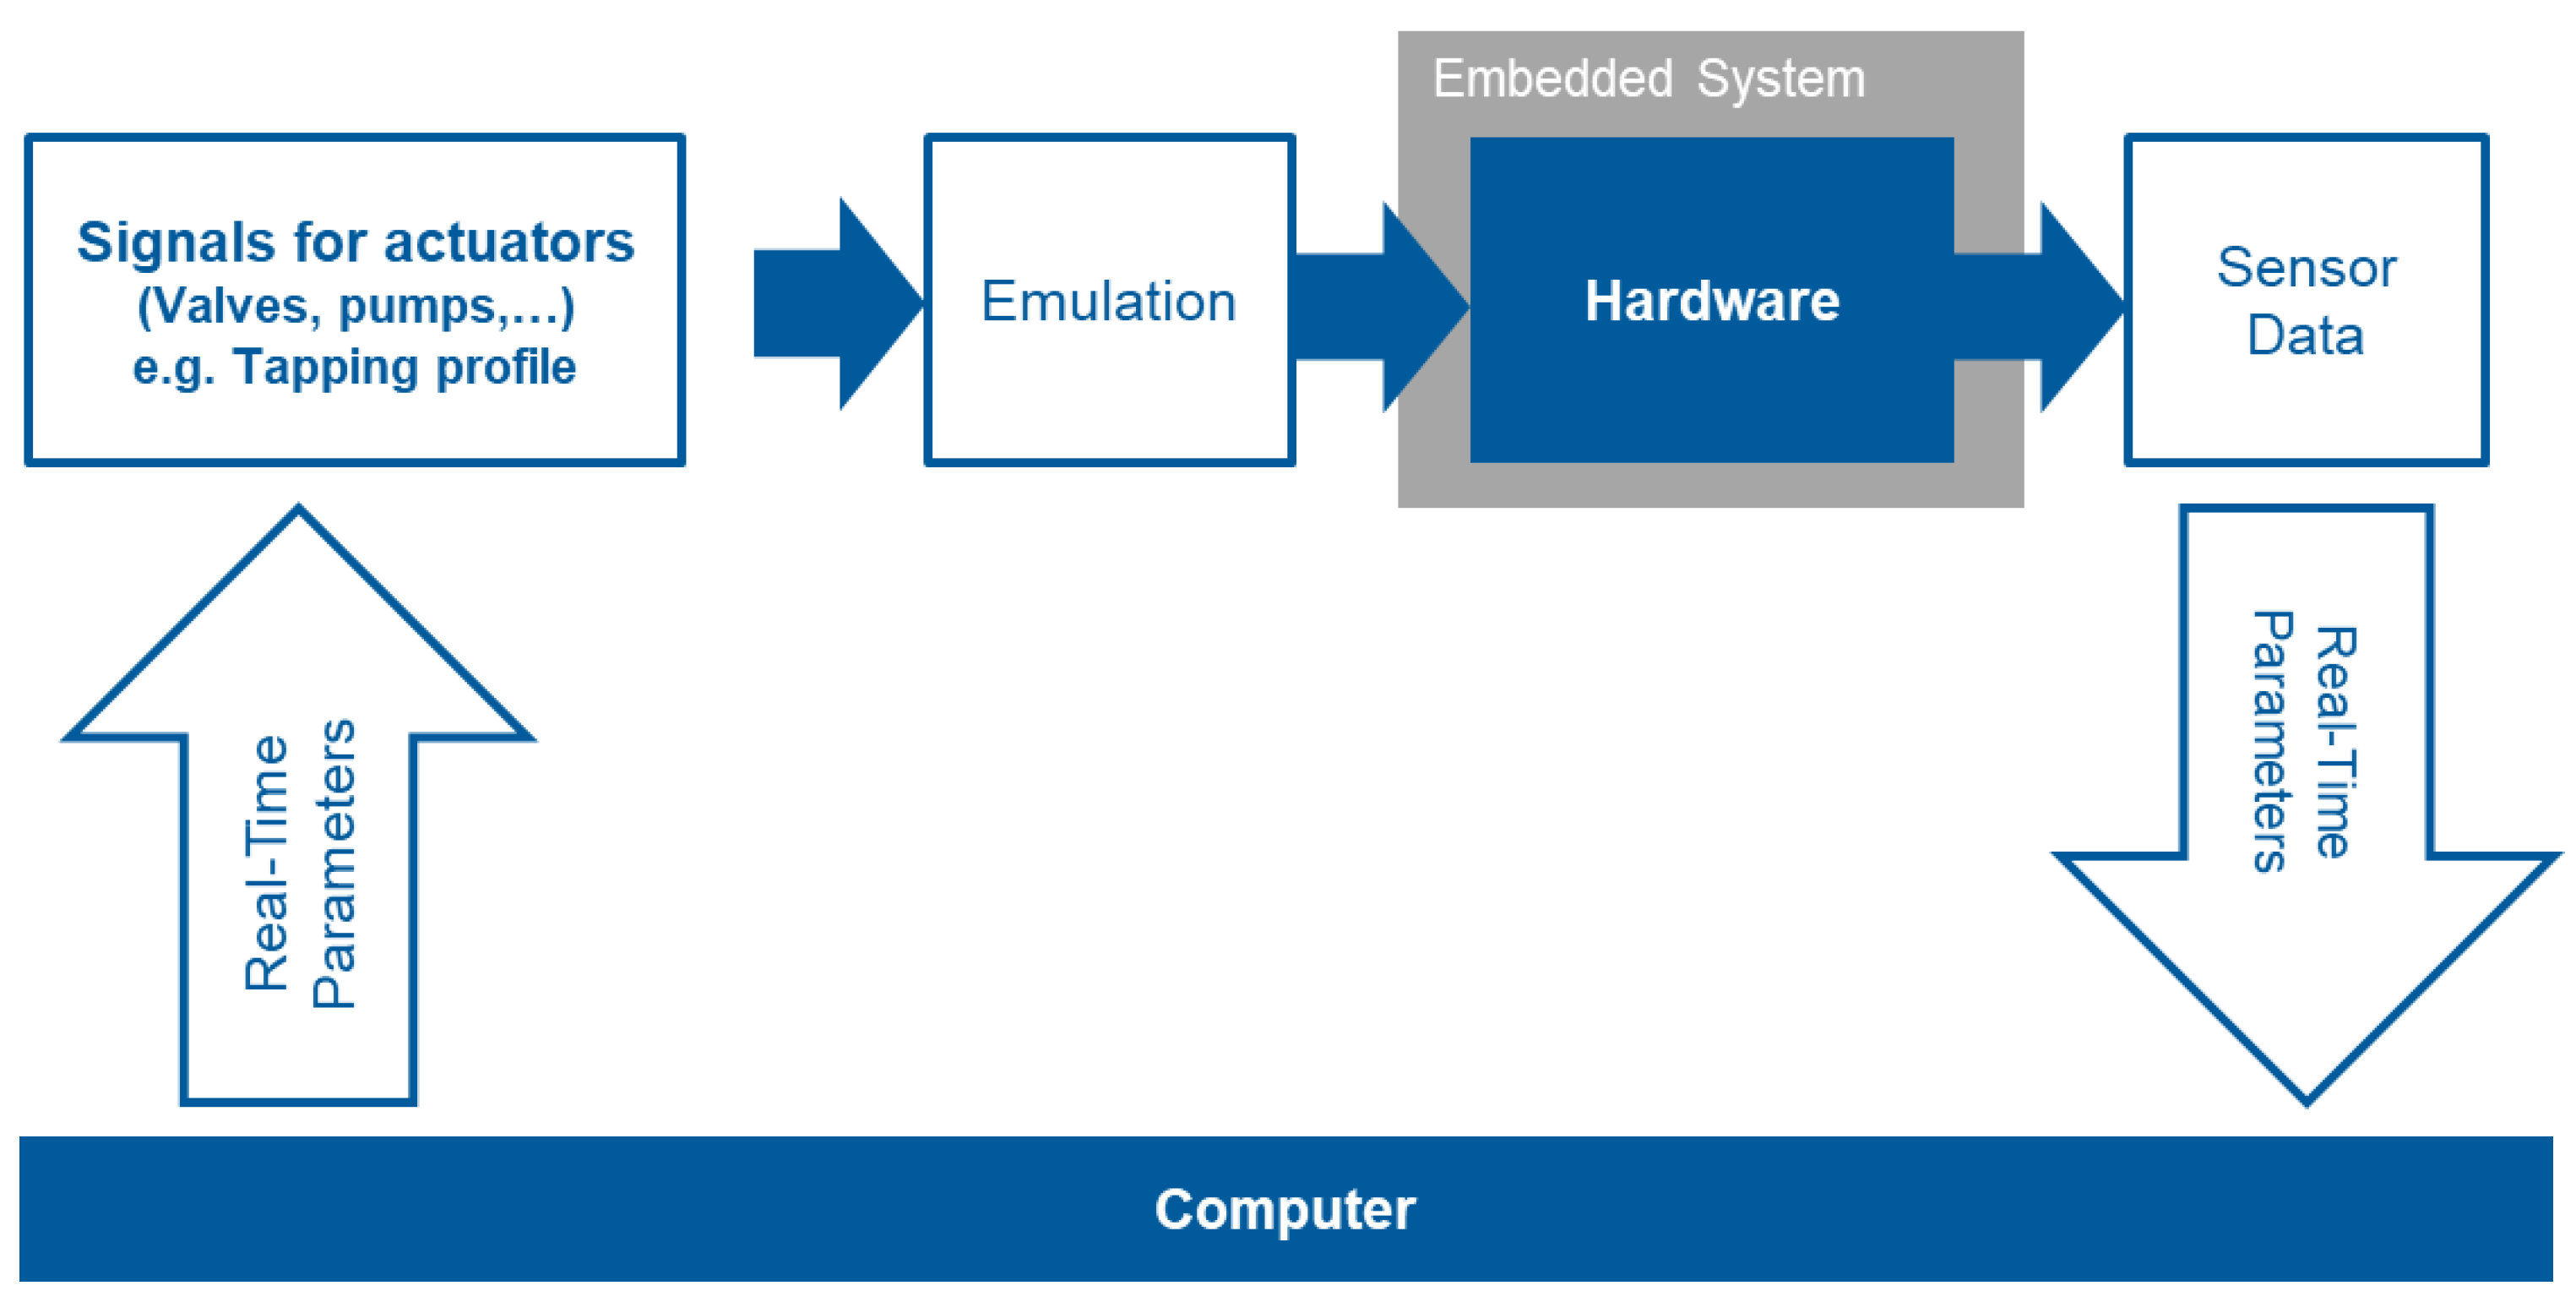
Software is utilized to control actuators and measure sensors, while data acquisition devices are used to connect the software and the hydraulic loops (
Figure 4). These devices relay the values to the actuators and record them from the sensors. A DHN feed temperature is regulated using an injection loop with a three-way valve. The sink emulation loop utilizes a three-way mixing valve to adjust the temperature and a throttle valve to modulate the flow rate to meet the necessary heating requirements. The DHW tapping was carried out in accordance with applicable standards [
26]. A pre-tempering of 10 °C +/−1 K of the incoming cold water is required, and the DCW connection pressure can reach up to 0.6 MPa. In the test rig described herein, the DCW is pre-conditioned to the desired temperature and then connected to the pressure boosting system. The final pressure is the sum of the inlet pressure and the delivery pressure of the pressure booster system, which is regulated by a 2-liter membrane pressure container. An actuator is used to control a magnetic valve in the service water withdrawal line, allowing the desired volume flow to be withdrawn. Both DHS systems include a controller for the DHW temperature; if this were not included, a three-way mixing valve would be installed in the test rig to control the DHW temperature.
The measurement equipment installed within the test rig records all measurement data for later comparison. Furthermore, the test systems are equipped with additional sensors to monitor and record internal system states, such as storage stratification and differential pressure. This modularly expandable measurement technology concept enables rapid system testing.
Table 3 shows the measured quantity and the accuracy of each sensor. The total measurement uncertainty of the volumetric flow sensor can be calculated by combining the uncertainty of the device and the uncertainty of the flow velocity. The uncertainty of the flow velocity is inserted into the formula for the device uncertainty to account for the combined effect (
Table 3, line 2). The tests of the two DHS showed comparable temperatures, flow speeds, and powers, leading to errors within a similar range. This indicates that the data of the two systems are comparable.
2.2. Measurement and Comparison of District Heating Substation Systems
The aim of this experimental study is to compare the return temperatures of the two systems. The mass flow rate-weighted return temperature is calculated as described in Equation (1). As discussed in the Introduction section, the power needed to be supplied by the DHN varies based on the type of DHS. This has implications for the design of the piping, and hence, the power required by each system to meet the same demand is also examined.
where the following are defined:
: weighted return temperature;
: measured return temperature at time stamp i;
: measured mass flow rate at time stamp i.
Intending to compare and evaluate the DHN on the same basis, the maximum volumetric flow rate required to meet the peak load was determined for a DHN feed temperature of 80 °C, which is a typical temperature for local DHNs as reported in [
12]. The hydraulic setup (
Figure 4) was utilized to emulate both the DHN and the consumer. The heating demand profile for a non-retrofitted SFH corresponds to a standard profile as described in [
30]. The DHW requirement was determined using a real tap process [
31].
Table 4 presents a summary of the data used to inform the demand profile. The resolution of the heating profile emulation was set to 10 min, and the resolution of the DHW profile was set to 10 s in order to ensure the controller dynamics were accurately simulated, as suggested in [
1]. The heating demand profile was determined using an annual specific energy demand of 130 kWh/m
2 and a living area of 200 m
2, which is a representative value for SFH in rural areas. The DHW demand was determined for a household of four people. Both DHS systems were measured and compared for a morning on a winter day.
In a storage system, hysteresis is utilized to operate the feed system. This is achieved by using two temperature sensors, one located, e.g., at the upper quarter of the storage’s height and one in the lower three quarters. When T
off (at the bottom) reaches a predetermined temperature, charging of the storage tank ceases. If the temperature of T
on (at the top) falls below a predetermined threshold, the storage tank is reloaded.
Table 5 shows the values used for the comparative test of the two DHSs. According to [
32], the DHW temperature should fall within the range of 50–55 °C. However, [
33] recommends a withdrawal temperature of 45 °C, which was adopted for the current study.
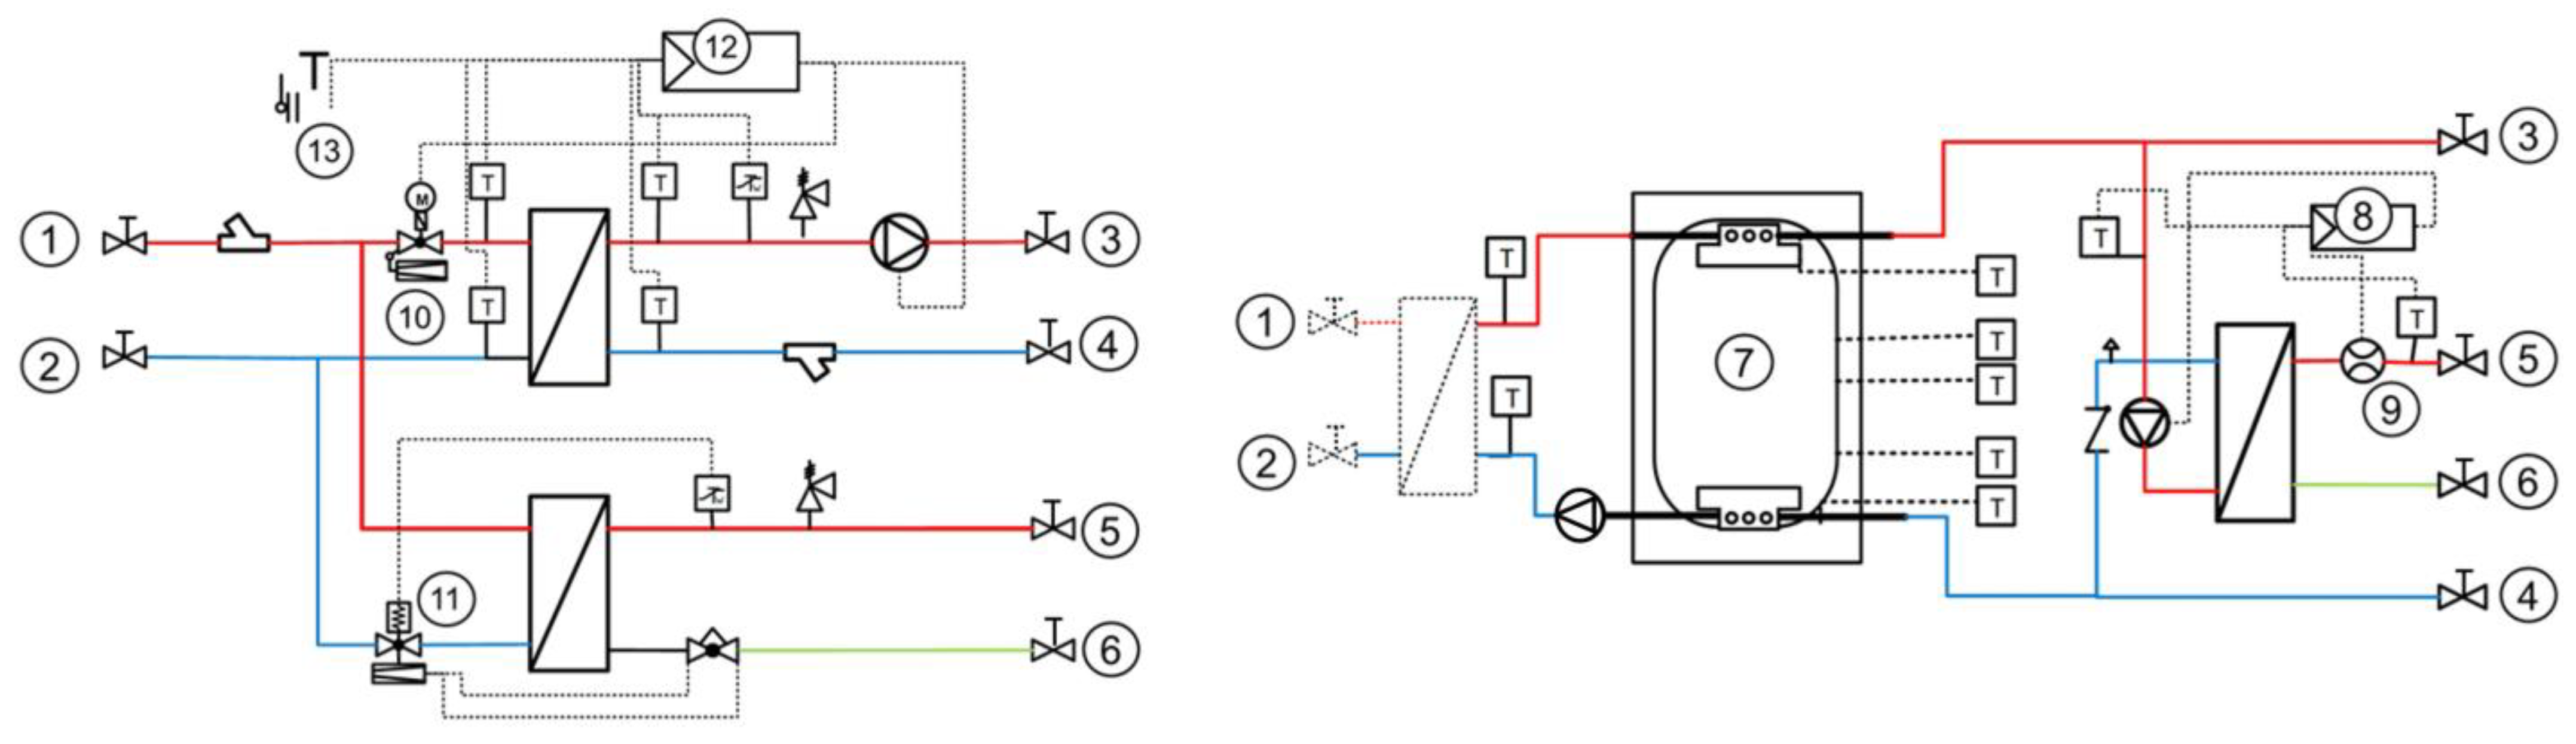
The hydraulic setup of the two tested DHS is represented in
Figure 5, and the connection to the emulator is made directly to the ball valves (1–6). At every interconnection point, in- and outlet temperatures as well as volume flow are measured to determine the corresponding thermal power. Both DHSs are designed with indirect connection between the DHN and the domestic system by means of a heat exchanger.
The DHN feed temperature in the case of the CFS is controlled by a motor-driven flow regulating valve (10). This valve controls the flow in the primary part of the heat exchanger shown above, which is used for space heating. (
Figure 5, right). The heating system temperature is determined according to a heating curve based on the ambient temperature (13). DHW control is regulated mechanically by a thermostatic regulating valve, which is controlled according to the flow rate and temperature on the secondary side of heat exchanger (11). The ambient temperature was experimentally set to 1 °C in order to simulate a winter day.
A 900 L storage tank was filled to a temperature of 50 °C (i.e., the return temperature of the heating system). It was assumed that the bottom layer of the storage tank was primarily composed of 50 °C warm water that returned from the heating system in the winter. This created a realistic starting point for measuring the daily section. In this study, the DHN with storage tanks operates on a strategy of continuous charging, with the lowest possible volumetric flow rate set to ensure that the storage tank is neither charged nor discharged, on average. Sensors installed externally to the storage (7) are utilized to observe stratification within the system. The SDHS requires two additional pumps compared to the CFS, as illustrated in
Figure 5 (left). The pump on fresh water system of SDHS is being controlled depending on the withdrawn DHW (temperature und volume flow) and the hot water temperature coming from the storage. An additional mixing circuit for the heating system is necessary (not displayed).
3. Results
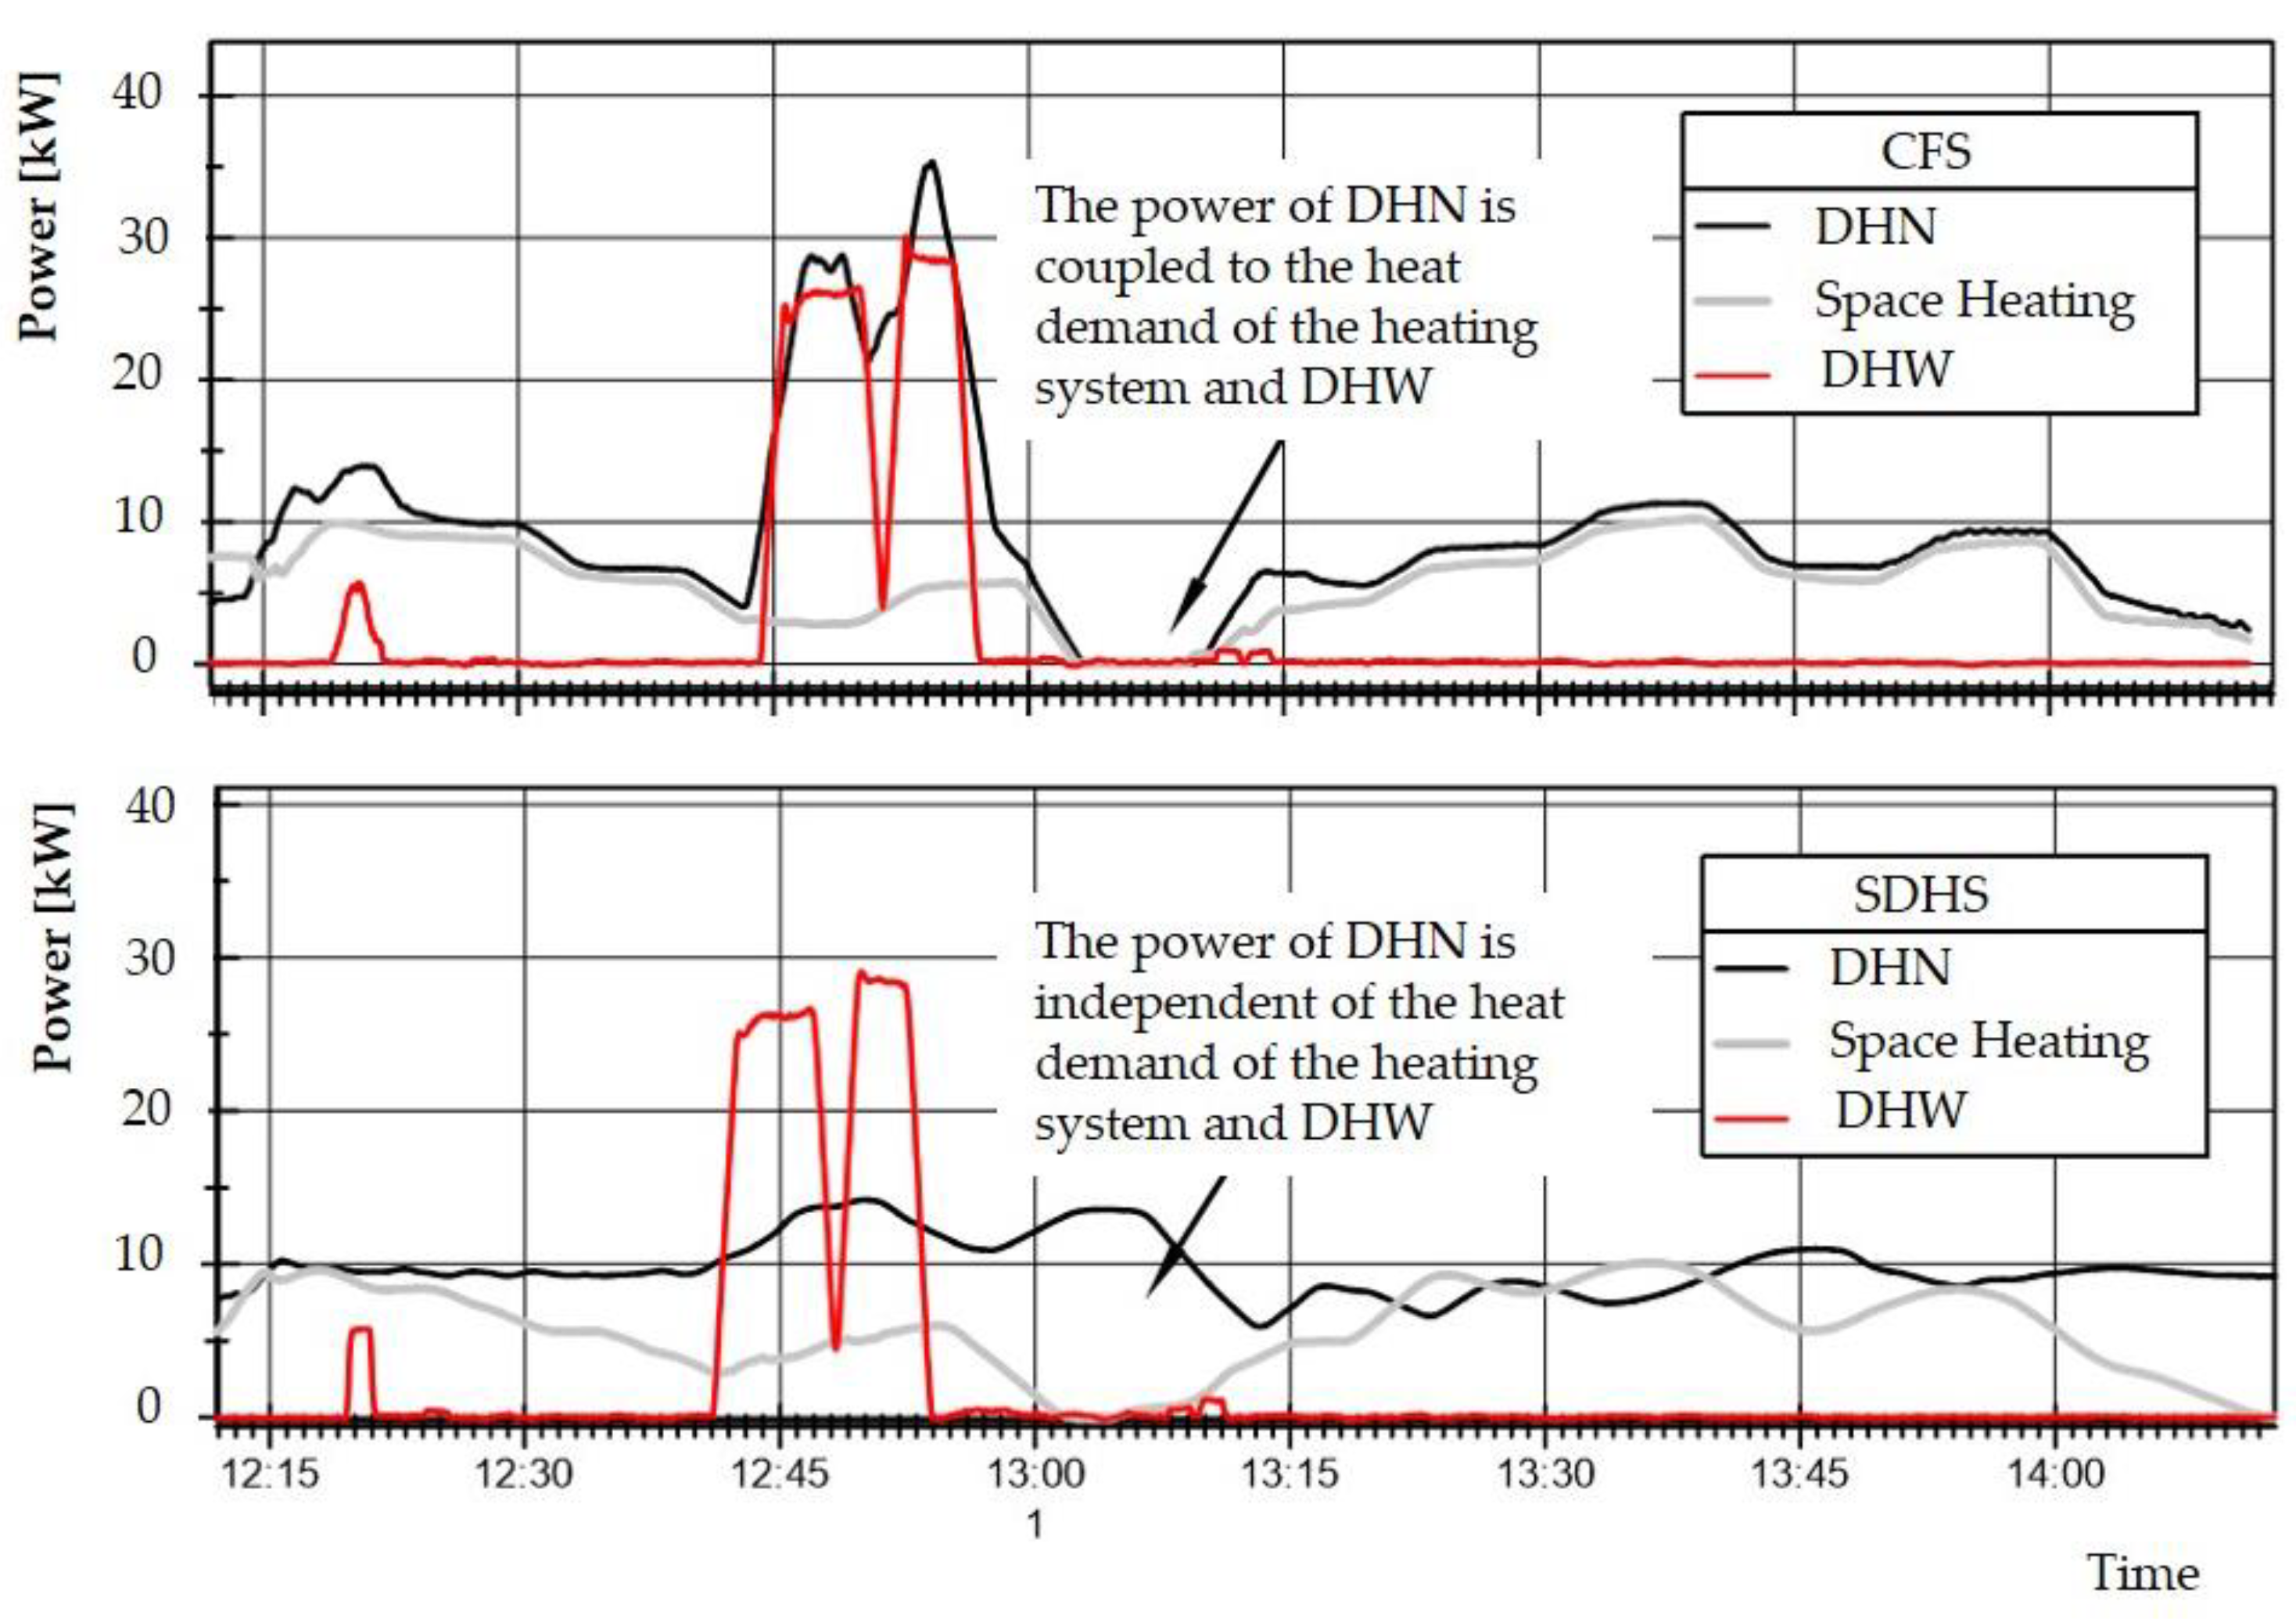
In this section, the results of testing thermal power and temperature of the two systems during measurement are described and compared. The two systems were measured with a typical load profile for DHW and heating, characterized by a high DHW demand in the first half and a dominant heating demand in the second half (
Figure 6).
The thermal power demand of the DHN, as seen in the upper diagram of
Figure 6, coincides with the demand for DHW and heating, since the two sinks (radiator system and DHW) are separated from the DHN only by heat exchangers. As outlined in
Section 2.2, the demand in the heating loop is regulated by a primary-side motorized control valve, and the demand in the DHW loop is regulated by a thermostatic valve. The effectiveness of these controllers determines how quickly the demand profile for the DHW and radiator heating system is responded to with the load profile from the DHN.
In contrast, with the SDHS the power drawn from the DHN is nearly constant. The storage system’s ability to accommodate fluctuations in demand permits no changes to be observed in the DHN reference profile. A greater DHW extraction causes only slight changes in the need for thermal power from the DHN (
Figure 6, lower diagram). The capacity of the thermal storage system can lead to a load profile exceeding the delivered power (
Figure 6, around 13:30).
The load profiles of the required DHN output show the characteristic difference between the two DHS systems. The CFS requires more than double the thermal power of the SDHS when withdrawing DHW. It was anticipated that, due to the absence of a storage tank, the requisite power must be supplied directly from the DHN. However, when mostly heating power is withdrawn, the withdrawal rates of both systems are similar on average. In summary, the demand power range of the CFS is 0–35 kW, whereas the substation with storage has a demand power range of 7–15 kW. Due to the high power demand that DHW requires, the CFS is not recommended for households with a large DHW load.
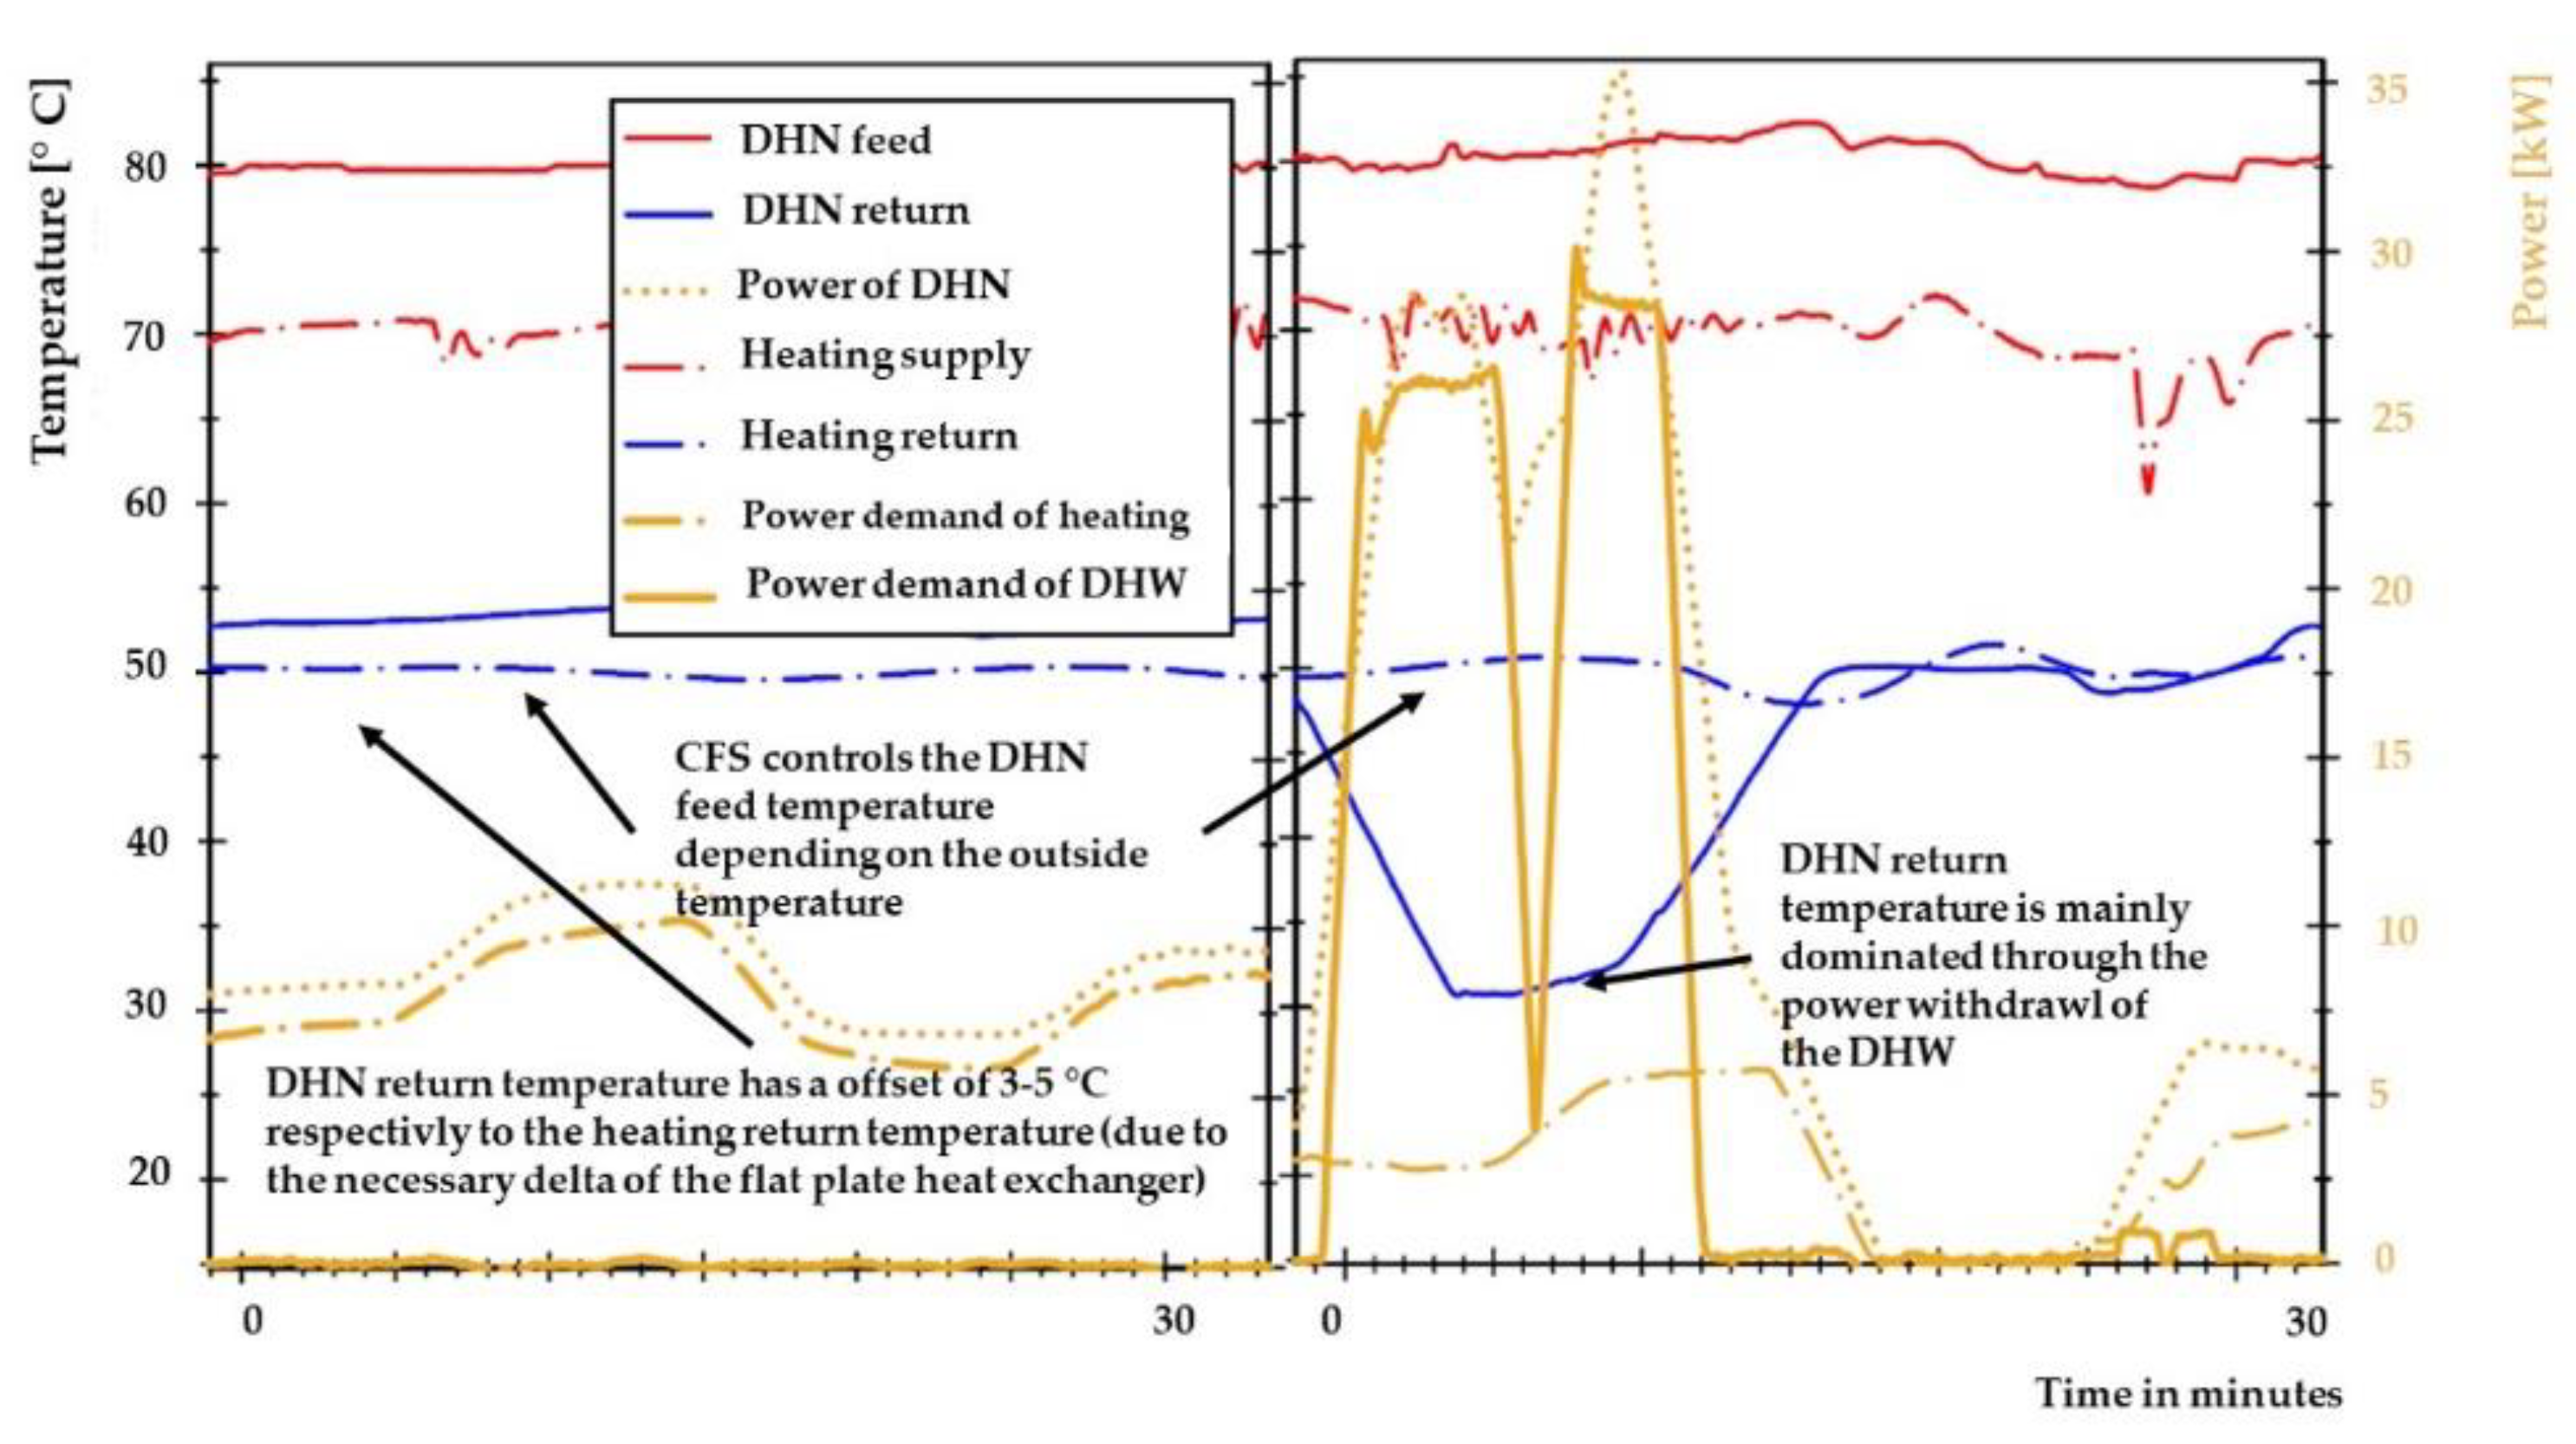
In the following step, the temperature profiles of both systems are assessed. Initially, those of the CFS are evaluated. When DHW is tapped from the secondary side of the heat exchanger, the temperature of the 10 °C cold water is heated up to approximately 45 °C, resulting in a decrease of approximately 20 °C in the return temperature of the DHN. When not drawing DHW, the return temperature generally remains around 52–55 °C (
Figure 7). However, if the use of heating dominates, a return temperature can be observed which is approximately 3–5 K higher than that of the heating water flowing back (approx. 50 °C). This demonstrates the effectiveness of the heat exchanger.
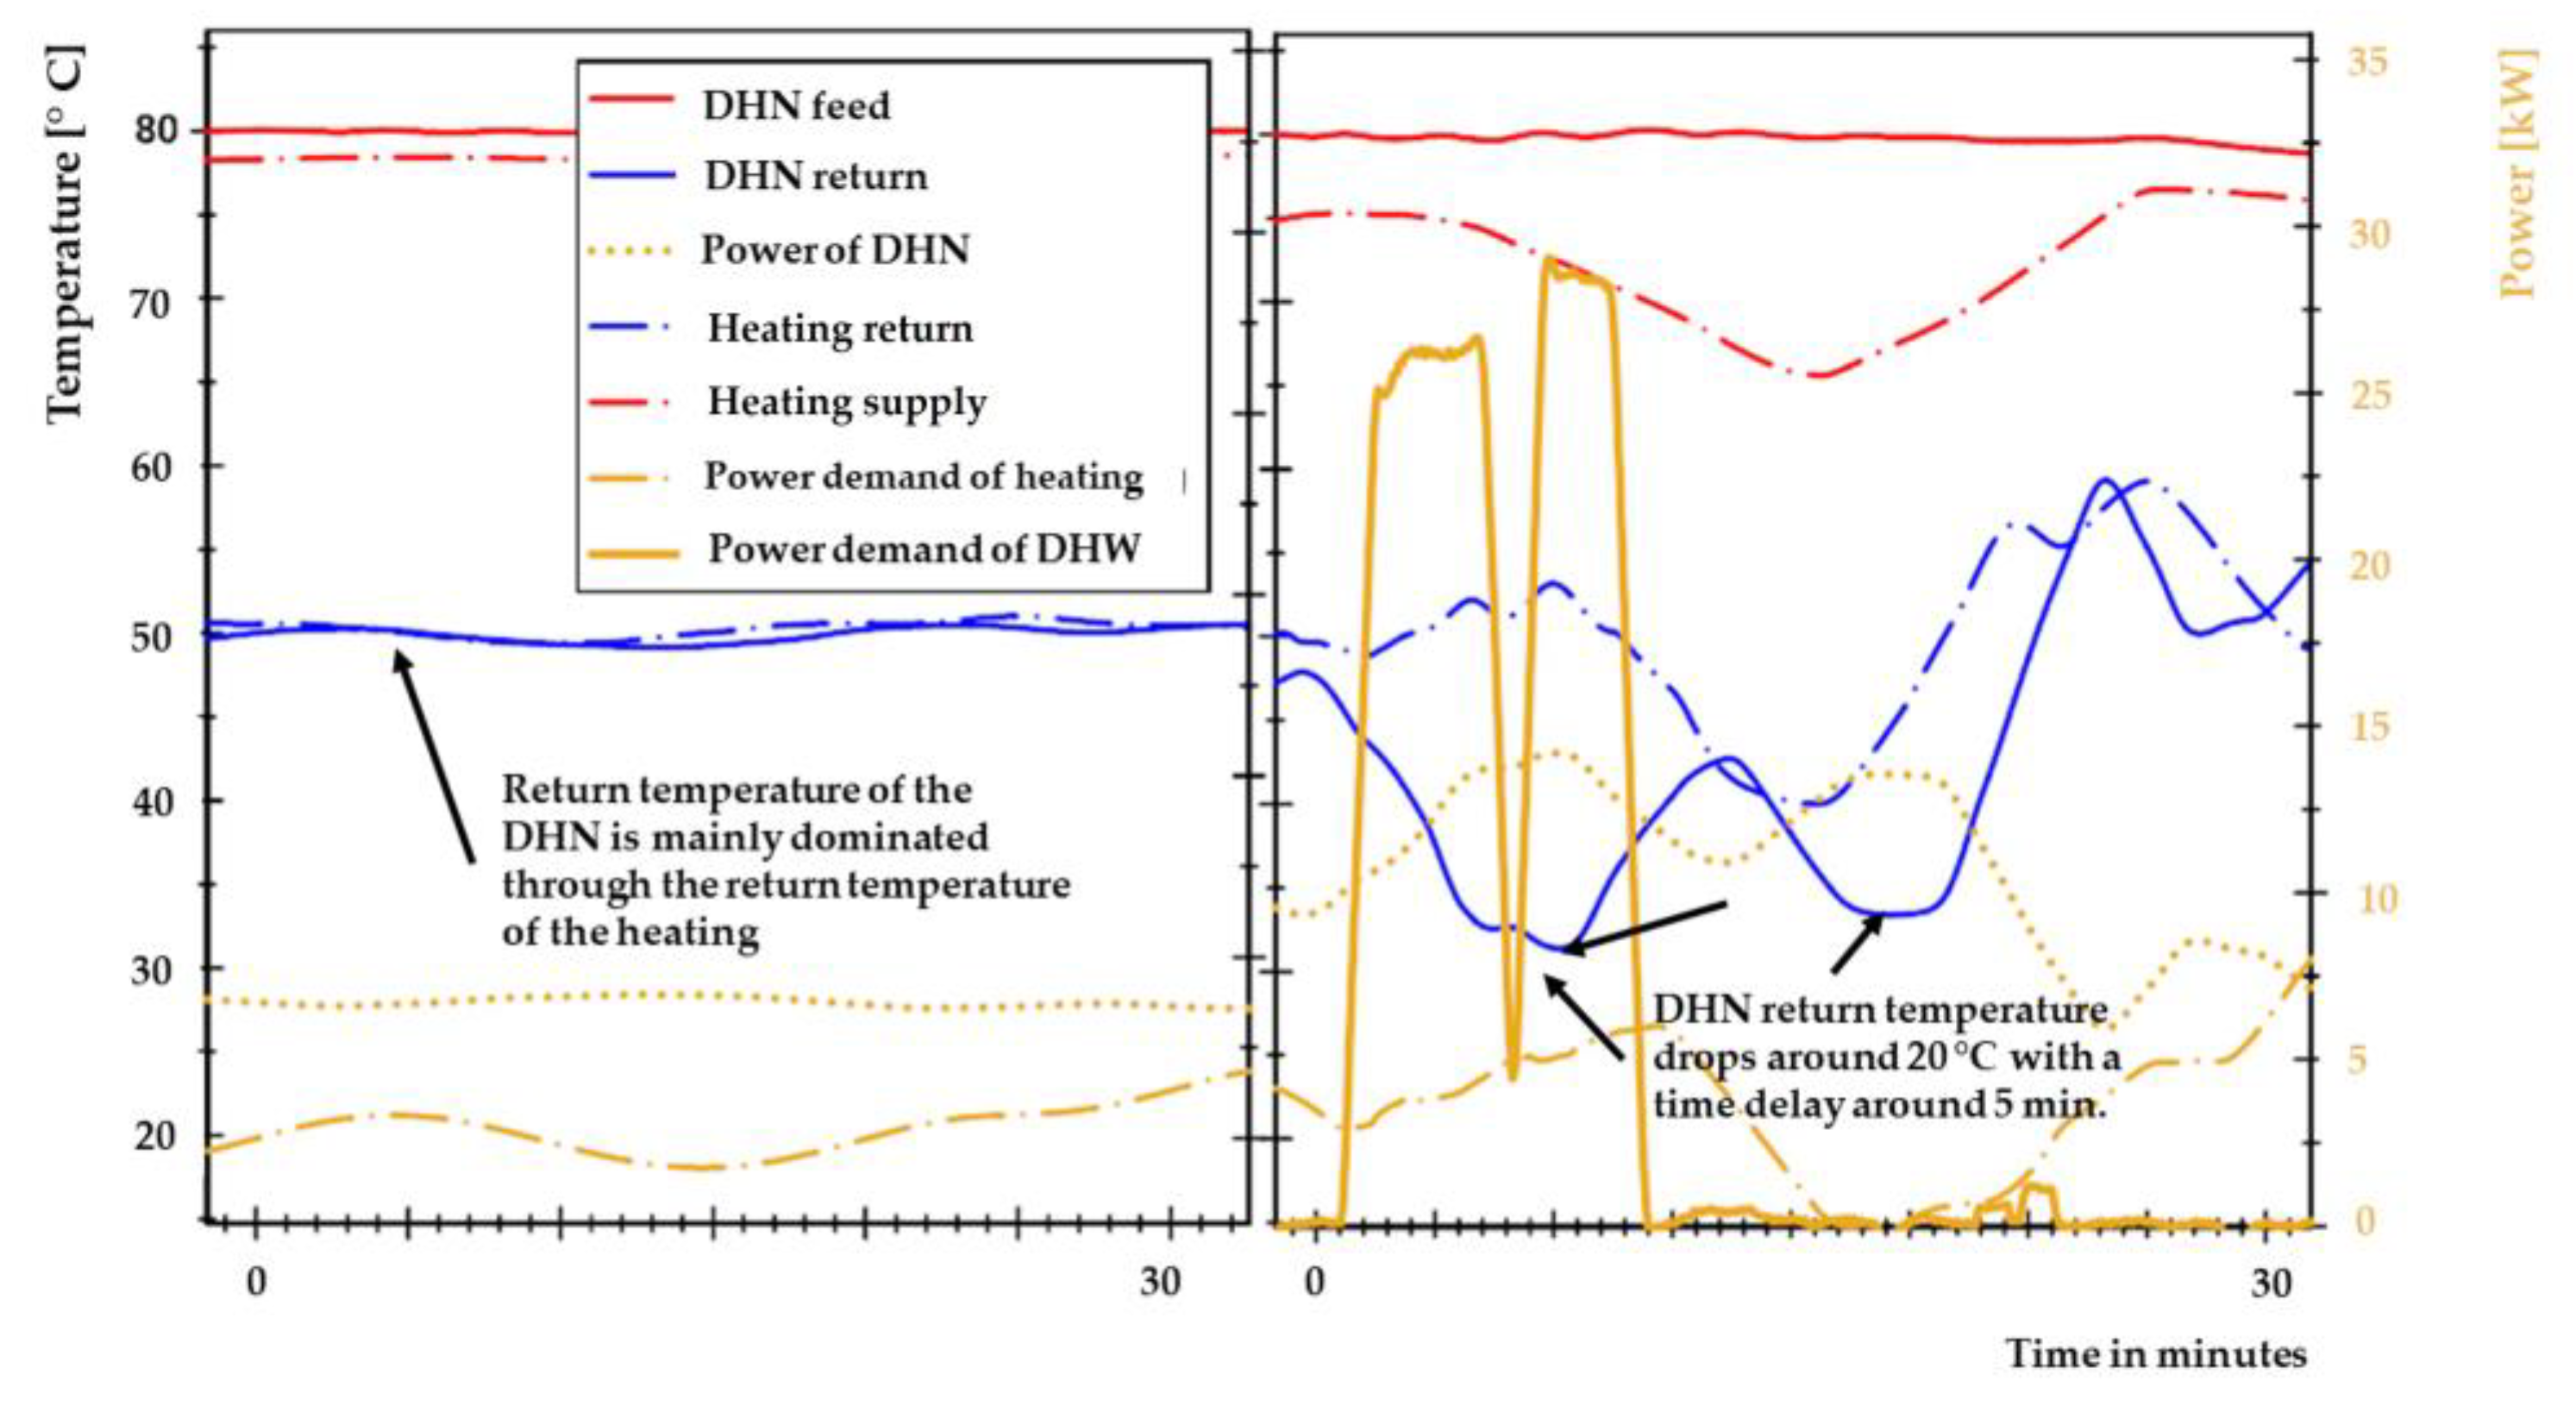
The DHN return temperature in the SDHS corresponds almost exactly to the heating return temperature (
Figure 8, left). If the DHW is then withdrawn, the return temperature drops by approximately 17 K, similarly to that of the CFS. A large amount of cold water is added to the storage tank, resulting in a significant drop in temperature of the lower layers of the tank. This can also be seen in the return temperature of the DHN, which remains cooler until the storage tank is recharged and the return temperature from the radiator heating system dominates.
The average weighted return temperatures of both systems are about 50 °C, as calculated with Equation (1).
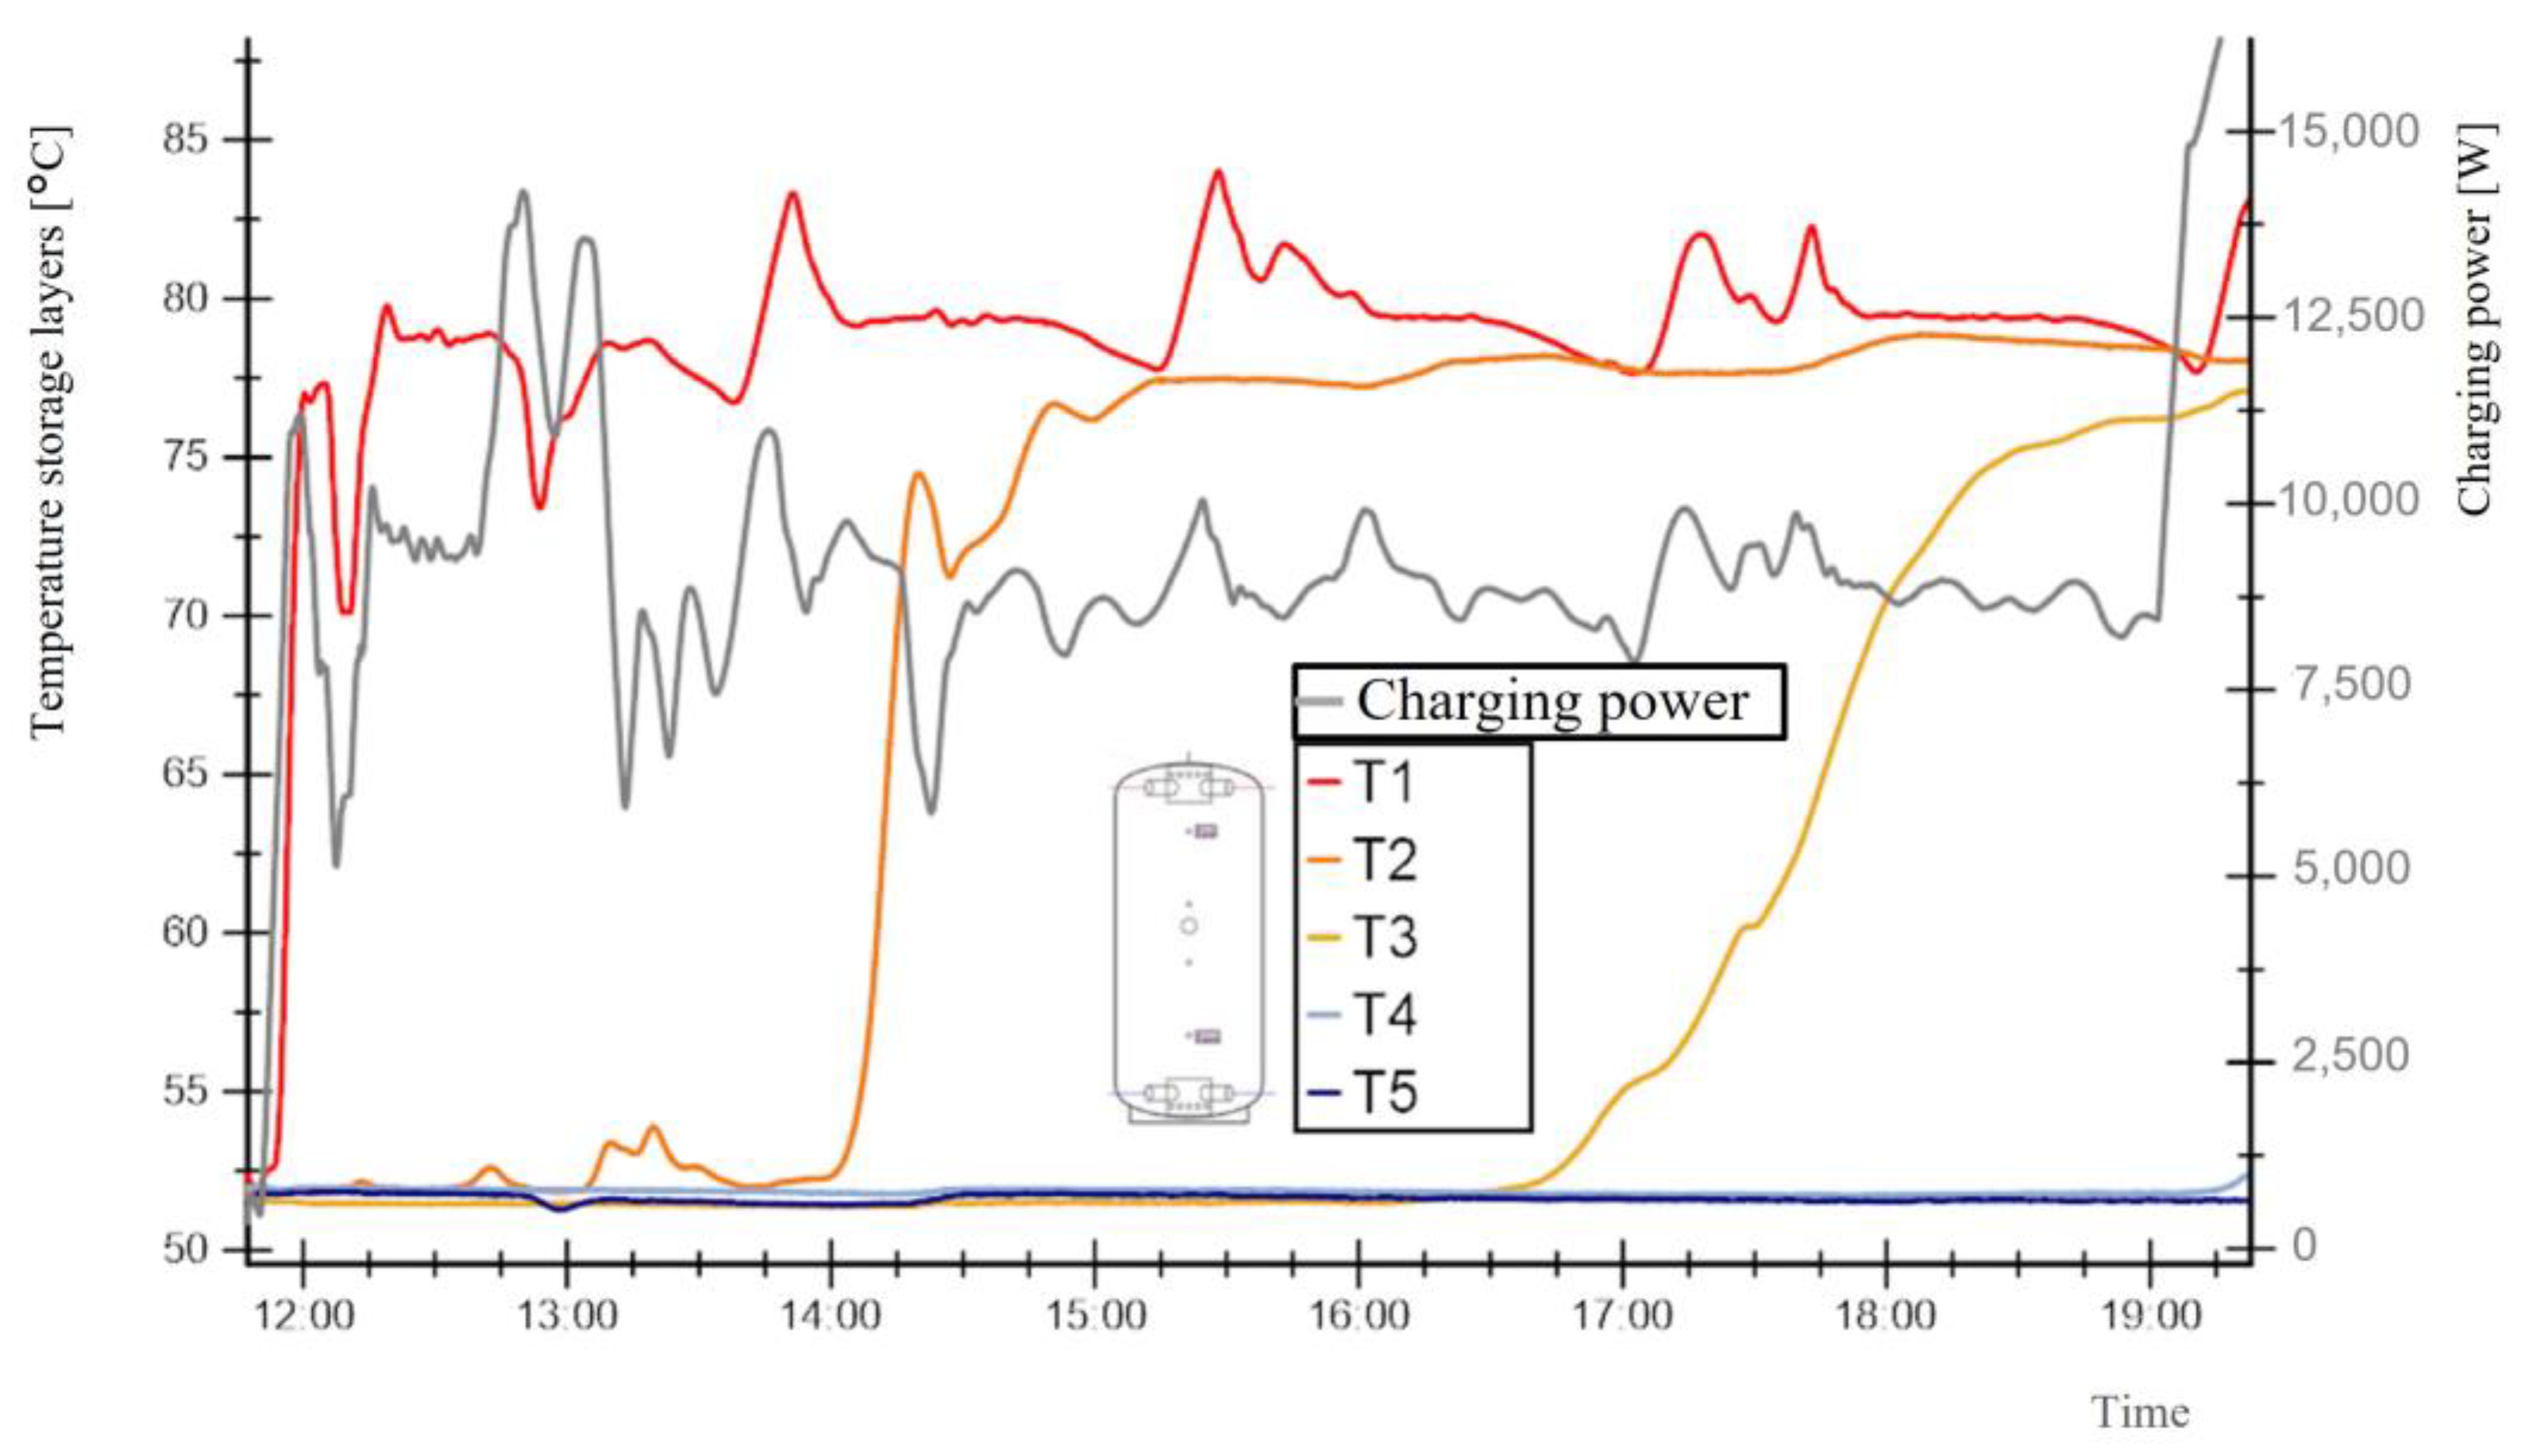
Figure 9 shows the charging process of the storage tank after cooling by a DHW withdrawal. The layers gradually become warmer, with the bottom two layers remaining at 50 °C due to the radiator heating return temperature.
4. Discussion
The discussion section initially evaluates the comparative advantages and disadvantages of the two DHSs (cf.
Table 6) and then examines their effects on a DHN.
The performance of the SDHS has been tested with one charging strategy of the storage, and it was found that the weighted return temperature is the same for both DHS systems. Further evaluation of the SDHS could be conducted through an extended period of measurement to assess the stability of stratification under various seasonal load profiles. Running the DHN intermittently can further illustrate the advantages of the SDHS, as the DHN can be deactivated some days when using the storage tank for DHW demand in summer.
In contrast to the return temperatures, the analysis showed a significant advantage for the SDHS in terms of the maximum necessary peak load. Additionally, there were no phases with zero demand in winter, leading to the mains pump operating close to the design point and thus more efficiently. It is to be expected that due to the higher peak loads, the electrical demand for the circulation pump will be higher in DHNs with CFS systems. However, with the SDHS, more pumping energy is required for the intermediate loops. In addition, there are also thermal losses due to the storage tanks. These effects have to be weighed against each other.
The following aspects are worthy in a comparative study of SDHS and SS. As mentioned above, the SDHS requires electrical energy for the intermediate loop pumps and has higher decentralized storage losses. The DHW storage tanks of the SS require more frequent loading, which results in increased DHN return temperatures and requires more electrical energy for the central circulation pump, occurring once or twice daily.
A distinct difference must be drawn between the house connection pipe and the primary pipe of the DHN. In the case of a CFS, the diameter of the individual house connection pipe should be larger than in the case of the SDHS. Whether this is also applicable to the main line depends on load peaks and the simultaneity factor in the DHN. This should be calculated on a case-by-case basis, as it is affected by the type of consumers and the number of consumers connected to the DHN [
35].
5. Conclusions
The results of this article indicate that the type of DHS must be considered when planning a DHN in order to ensure efficient energy and economic usage. If the planner is unaware of the effect of the type of DHS, the piping, heat source, and circulation pump may be inadequately designed, resulting in either overly large piping or insufficient supply of energy to consumers. It should be noted that the simultaneity factor of the DHS with storage system differs from that of CFS. When a DHN primarily serves large consumers such as industrial and service sectors, the choice of whether to use SDHS or CFS with regard to the higher peak power is irrelevant. The thermal capacity of a large DHN is sufficient to meet the peak demands of the CFS for the SFH.
With the HiL approach, more complex investigations can be carried out. If a building model of an SFH is simulated, the load profile can be easily adjusted for the embedded system. For instance, by changing the insulation standard or the heating system, the effects on the simulated DHN can be examined immediately.
Author Contributions
Conceptualization, A.V., J.B. and T.S.; methodology, A.V., J.B. and T.S.; formal analysis, A.V. and J.B.; investigation, A.V. and J.B.; data curation, A.V. and J.B.; writing—original draft preparation, A.V. and J.B.; writing—review and editing, A.V., J.B., M.E. and T.S.; visualization, A.V., J.B. and M.E.; supervision, M.E. and T.S.; project administration, A.V., J.B., M.E. and T.S.; funding acquisition, A.V., J.B., M.E. and T.S. All authors have read and agreed to the published version of the manuscript.
Funding
This research was funded by European Regional Development Fund, grant number: EU-1605-0003 and the German Federal Ministry for Economic Affairs and Climate Protection/Projektträger Jülich (PtJ), grant number FKZ: 03EN3005A. We acknowledge support by the German Research Foundation and the Open Access Publication Fund of Technische Hochschule Ingolstadt.
Institutional Review Board Statement
Not applicable.
Informed Consent Statement
Not applicable.
Data Availability Statement
Not applicable.
Acknowledgments
The authors gratefully acknowledge the European Regional Development Fund for financially supporting the project Wärme&Wohnen grant number: EU-1605-0003 and the German Federal Ministry for Economic Affairs and Climate Protection and the project management organization Projektträger Jülich (PtJ) for financially supporting the project OREWA (‘‘Optimierung und Restrukturierung von Wärmenetzen einschließlich der Bewertung von Übertragbarkeit, Ökologie und Ökonomie”); grant number: 03EN3005A. The authors want to express their gratitude towards the companies Hoval and Solarbayer GmbH for providing the test objects.
Conflicts of Interest
The authors declare no conflict of interest.
Nomenclature
| District heating network | DHN |
| District heating substation | DHS |
| Hardware-in-the-loop | HiL |
| Single- and two-family-houses | SFH, TFH |
| Continuous-flow system substation | CFS |
| Storage system substation | SS |
| Storage district heating substation | SDHS |
| Domestic hot water, domestic cold water | DHW, DCW |
References
- Henke, S.; Kröper, T.; Spannig, J. EnEff: Wärme—LowEx-Systeme: Breitenanwendung von Niedertemperatur-Systemen für Eine Nachhaltige Wärmeversorgung: Abschlussbericht; AGFW: Frankfurt am Main, Germany, 2015; ISBN 3899990544. [Google Scholar]
- Gustafsson, J.; Delsing, J.; van Deventer, J. Improved district heating substation efficiency with a new control strategy. Appl. Energy 2010, 87, 1996–2004. [Google Scholar] [CrossRef]
- van Oevelen, T.; Vanhoudt, D.; Salenbien, R. Evaluation of the return temperature reduction potential of optimized substation control. Energy Procedia 2018, 149, 206–215. [Google Scholar] [CrossRef]
- Siuta-Olcha, A.; Cholewa, T.; Gomółka, M.; Kołodziej, P.; Skaarup Østergaard, D.; Svendsen, S. On the influence of decommissioning an area thermal substation in a district heating system on heat consumption and costs in buildings—Long term field research. Sustain. Energy Technol. Assess. 2022, 50, 101870. [Google Scholar] [CrossRef]
- Tahiri, A.; Smith, K.M.; Thorsen, J.E.; Hviid, C.A.; Svendsen, S. Staged control of domestic hot water storage tanks to support district heating efficiency. Energy 2023, 263, 125493. [Google Scholar] [CrossRef]
- Vannahme, A.; Ehrenwirth, M.; Schrag, T. Enhancement of a District Heating Substation as Part of a Low-Invest Optimization Strategy for District Heating Systems. Resources 2021, 10, 53. [Google Scholar] [CrossRef]
- Verein Deutscher Ingenieure. Gebäudetechnische Anlagen mit Fernwärme; Beuth Verlag GmbH: Berlin, Germany, 2009; (2036). [Google Scholar]
- Euroheat & Power. Guidelines for District Heating Substations. 2008. Available online: https://www.scribd.com/document/314009484/EUROHEAT-POWER-Guidelines-for-District-Heating-Substations (accessed on 30 May 2020).
- Johansson, P.-O.; Lauenburg, P.; Wollerstrand, J. Improved Cooling of District Heating Water in Substatons by Using Alternative Connection Schemes. In Proceedings of the 22nd International Conference on Efficiency, Cost, Optimization, Simulation and Environmental Impact of Energy Systems, Parana, Brazil, 30 August–3 September 2009. [Google Scholar]
- Dötsch, C.; Taschenberger, J.; Schönberg, I. Leitfaden Nahwärme; Fraunhofer-IRB-Verlag: Stuttgart, Germany, 1998. [Google Scholar]
- Euring, M. Smarte Wärmeverteilung in Neubaugebieten reduziert Wärmeverluste. EuroHeatPower/Fernwärme Int. 2017, 46, 34–36. [Google Scholar]
- Leoni, P. Projekt Heat_Portfolio (FFG-Nr. 848849) Deliverables D4.1 und D7.1. Machbarkeitsanalyse der Abwärmeeinspeisung; Bericht zur Simulation der Integration dezentraler Abwärmequellen in die Fallbeispiele. Austrian Institute of Technology. 2018. Available online: https://energieforschung.at/projekt/technische-https://energieforschung.at/wp-content/uploads/sites/11/2020/12/heat-portfolio-D4.1-7.1.pdf (accessed on 30 May 2020).
- Gaderer, M. Wärmeversorgung mit Fester Biomasse bei Kleiner Leistung. Ph.D. Thesis, Technische Universität, München, Germany, 2007. [Google Scholar]
- El-Baz, W.; Mayerhofer, L.; Tzscheutschler, P.; Wagner, U. Hardware in the Loop Real-Time Simulation for Heating Systems: Model Validation and Dynamics Analysis. Energies 2018, 11, 3159. [Google Scholar] [CrossRef] [Green Version]
- Al Koussa, J.; Baeten, R.; Robeyn, N.; Salenbien, R. A multipurpose test rig for district heating substations: Domestic hot water preparation and keep-warm function comparison. E3S Web Conf. 2019, 111, 6012. [Google Scholar] [CrossRef]
- Schneider, G.F.; Oppermann, J.; Constantin, A.; Streblow, R.; Müller, D. Hardware-in-the-Loop-Simulation of a Building Energy and Control System to Investigate Circulating Pump Control Using Modelica. In Proceedings of the 11th International Modelica Conference, Versailles, France, 21–23 September 2015; pp. 225–233. [Google Scholar]
- La Tejeda De Cruz, A.; Riviere, P.; Marchio, D.; Cauret, O.; Milu, A. Hardware in the loop test bench using Modelica: A platform to test and improve the control of heating systems. Appl. Energy 2017, 188, 107–120. [Google Scholar] [CrossRef]
- Ceglia, F.; Marrasso, E.; Roselli, C.; Sasso, M.; Tzscheutschler, P. Exergetic and exergoeconomic analysis of an experimental ground source heat pump system coupled with a thermal storage based on Hardware in Loop. Appl. Therm. Eng. 2022, 212, 118559. [Google Scholar] [CrossRef]
- Dongellini, M.; Ballerini, V.; Morini, G.L.; Naldi, C.; Pulvirenti, B.; Di Rossi Schio, E.; Valdiserri, P. A new climate chamber for air-source and ground-source heat pump testing based on the Hardware-in-the Loop approach: Design and cross validation. J. Build. Eng. 2023, 64, 105661. [Google Scholar] [CrossRef]
- Mehrfeld, P.; Nürenberg, M.; Harb, H.; Huchtemann, K.; Müller, D. Dynamic testing of heat pump systems with predictive energy management systems using Hardware-in-the-Loop methodology. In Proceedings of the 12th IEA Heat Pump Conference, Rotterdam, The Netherlands, 15–18 May 2017. [Google Scholar]
- Nürenberger, M.; Mehrfeld, P.; Huchtemann, K.; Müller, D. Hardware-in-the-Loop test bench setup and its application to determine seasonal performance of heat pump systems. In Proceedings of the 12th IEA Heat Pump Conference, Rotterdam, The Netherlands, 15–18 May 2017. [Google Scholar]
- Haberl, R.; Reber, A.; Bamberger, E.; Haller, M. Hardware-in-the-Loop Tests on Complete Systems with Heat Pumps and PV for the Supply of Heat and Electrictiy. In EuroSun 2018 Conference Proceedings; International Solar Energy Society: Freiburg, Germany, 2018. [Google Scholar]
- Haller, M.Y.; Haberl, R.; Reber, A. Stratification efficiency of thermal energy storage systems—A new KPI based on dynamic hardware in the loop testing—Part II: Test results. Energy Build. 2019, 202, 109366. [Google Scholar] [CrossRef]
- Haller, M.Y.; Haberl, R.; Persdorf, P.; Reber, A. Stratification Efficiency of Thermal Energy Storage Systems—A new KPI based on Dynamic Hardware in the Loop Testing—Part I: Test Procedure. Energy Procedia 2018, 155, 188–208. [Google Scholar] [CrossRef]
- Busch, J.; Schrag, T. Planning and implementation of a thermodynamic hydraulic Hardware-in-Loop testing rig for heat-pumps and heat transfer stations. Planning process and first steps of implementation. In Proceedings of the Applied Research Conference ARC, Munich, Germany, 7 July 2017; pp. 268–295. [Google Scholar]
- DIN EN 16147:2017-08; Wärmepumpen mit Elektrisch Angetriebenen Verdichtern_-Prüfungen, Leistungsbemessung und Anforderungen an die Kennzeichnung von Geräten zum Erwärmen von Brauchwarmwasser/Heat Pumps with Electrically Driven Compressors—Testing and Requirements for Marking of Domestic Hot Water Units. Deutsche Fassung EN_16147:2017_+AC:2017; Beuth Verlag GmbH: Berlin, Germany, 2017.
- DIN EN 60751:2009-05; Industrielle Platin-Widerstandsthermometer und Platin-Temperatursensoren (IEC_60751:2008). Deutsche Fassung EN_60751:2008; Beuth Verlag GmbH: Berlin, Germany, 2008.
- Siemens A/S; Flow Instruments Auslagung für MAG1100 Ceramic DN 25/1 Aufnehmer. Siemens: Hanover, Germany, 2007.
- Siemens AG; Systeminformattion SITRANS F M magnetisch-induktive Durchflussmessgeräte. Siemens: Hanover, Germany, 2016.
- VDI 4655; Referenzlastprofile von Ein- und Mehrfamilienhäusern für den Einsatz von KWK-Anlagen, Mai 2008. Beuth: Berlin, Germany, 2008.
- Lange, M.; Zobel, M. Schlussbericht zum Vorhaben: Erstellung neuer Referenzlastprofile zur Auslegung, Dimensionierung und Wirtschaftlichkeitsberechnung von Hausenergieversorgungssystemen mit dem Akronym NOVAREF: Im Rahmen der Fördermaßnahme: Transfer von Forschungs- und Entwicklungsergebnissen (FuE) durch Normung und Standardisierung; Technische Informationsbibliothek (TIB); NEXT ENERGY-EWE-Forschungszentrum Für Energietechnologie; TIB-Technische Informationsbibliothek Universitätsbibliothek: Hannover, Germany, 2017. [Google Scholar]
- Skagestad, B.; Mildenstein, P. District Heating and Cooling Connection Handbook; Netherlands Agency for Energy and the Environment: Sittard, The Netherlands, 2002; ISBN 9057480263. [Google Scholar]
- Deutsche Norm. DIN EN 806-2: Technische Regeln für Trinkwasser-Installationen/Specifications for Installations Inside Buildings Conveying Water for Human Consumptio; Beuth: Berlin, Germany, 2005. [Google Scholar]
- AGFW. Merkblatt AGFW FW 530: Maßnahmen zur Erreichung Niedriger Rücklauftemperaturen; AGFW, der Energieeffizienzverband für Wärme, Kälte und KWK e.V.: Frankfurt am Main, Germany, 2016. [Google Scholar]
- Rehau. Gleichzeitigkeit-der unterschätzte Faktor: Effiziente Planung von Nahwärmenetzen. In BWK: Das Energiemagazin, Sonderdruck; Springer-VDI-Verlag GmbH & Co KG: Düsseldorf, Germany, 2012. [Google Scholar]
| Disclaimer/Publisher’s Note: The statements, opinions and data contained in all publications are solely those of the individual author(s) and contributor(s) and not of MDPI and/or the editor(s). MDPI and/or the editor(s) disclaim responsibility for any injury to people or property resulting from any ideas, methods, instructions or products referred to in the content. |
© 2023 by the authors. Licensee MDPI, Basel, Switzerland. This article is an open access article distributed under the terms and conditions of the Creative Commons Attribution (CC BY) license (https://creativecommons.org/licenses/by/4.0/).


