Article

A Quantitative Sustainability Assessment for Mine Closure and Repurposing Alternatives in Colorado, USA

by
Cansu Perdeli Demirkan
*,
Nicole M. Smith
* and
Sebnem Duzgun
Mining Engineering Department, Colorado School of Mines, Golden, CO 80401, USA
*
Authors to whom correspondence should be addressed.
Resources 2022, 11(7), 66; https://doi.org/10.3390/resources11070066
Submission received: 29 June 2022 / Revised: 7 July 2022 / Accepted: 12 July 2022 / Published: 14 July 2022
(This article belongs to the Special Issue Minerals and Land-Use Planning: Sustainable Narratives and Practices)

Abstract

:
Responsible mine closure and repurposing are key to contributing to sustainable development by ensuring successful environmental rehabilitation and reducing socioeconomic risks. However, mine closure has primarily focused on remediation and rehabilitation of mined lands with limited consideration of stakeholder perspectives and the broader social, economic, and cultural impacts of closure. In this paper, we use stakeholder input to evaluate and compare three different repurposing alternatives for the tailings dam area of a mine in the state of Colorado, USA, which is expected to close in the next twenty years. By using multi-attribute utility theory (MAUT), we determine which alternative better reflects stakeholder preferences and results in the most economically, environmentally, and socially sustainable outcome. Our results show that although stakeholder groups have different ideas about what constitutes sustainable development in the context of mine closure and repurposing, it is possible to identify to what extent different scenarios can address these perspectives. We argue that integrating stakeholder views into mine closure design and repurposing can lead to more responsible and sustainable mine closure that is unique to a particular setting and stakeholder needs, and we provide a methodology that mining companies may use to understand stakeholder priorities and preferences.

1. Introduction

Although mining is a heavy industry that causes environmental degradation and disrupts communities [1,2], it can also lead to positive socio-economic outcomes. When a mine begins operation, it may bring welfare by generating jobs, building skills and infrastructure, and enhancing the local economy (i.e., “boom”) [3,4]. However, mineral resources are not renewable, and the operational stage comes to an end when the ore has been depleted or when mining is no longer economically or socially feasible. In many cases, the departure of a mining company may have adverse impacts on local economies through employment losses, declines in local cash flow and tax revenues, an inability to maintain infrastructure, and a decline in services (i.e., “bust”) [3,5]. A poorly managed closure may worsen these impacts, and stakeholders increasingly expect mining companies to proactively manage the impacts of closure [6].
Mine closure must be planned so that the value of the impacted area is equal to or better than its original value, and the welfare created by the company is sustained and improved. To better manage the boom-and-bust cycle and obtain a broader acceptance of closure outcomes, a more comprehensive and stakeholder-inclusive approach to closure planning is needed [7,8]. Reconceptualizing mine closure is vital for enhancing mining’s contribution to sustainable development by ensuring successful rehabilitation of disturbed land, mitigating negative socio-economic impacts brought by the company’s departure, and building capacity in local communities [9,10,11,12].
Although the name connotes “end-of-mine”, closure planning should start from the earliest stages of mine planning and should be guided by sustainable development principles [13]. Defining a closure vision early, integrating it into planning, and regularly updating the plan may result in more closure options and the ability to evaluate the feasibility of alternatives. Moreover, community participation and input in closure planning may lead to better post-closure outcomes for communities, the company, and other stakeholders [10,14,15]. Historically, however, this has not always been the case, and delaying closure planning to later in the project cycle and even to ‘when the mine is about to close’ has been a common practice [16,17] with relatively little input from communities and other stakeholders [6,18]. This has limited repurposing options and stood as a barrier to environmental, social, and economic sustainability after the life of the mine [8,14].
In this paper, we use stakeholder input to investigate the potential contributions that post-closure scenarios could make to sustainable development. We do this by evaluating and comparing three different repurposing alternatives for the tailings dam area of a mine in the state of Colorado, USA, which is expected to close in the next twenty years. We evaluate these alternatives with a decision support tool that considers stakeholder perspectives and priorities. This tool is derived from a quantitative, multi-attribute decision analysis (MADA) approach, namely, multi-attribute utility theory (MAUT), and we populated the MAUT by creating an indicator-based sustainability survey to solicit the preferences and priorities of different stakeholders in terms of environmental, social, and economic aspects of repurposing. Our results show that stakeholder groups have different ideas about what constitutes sustainable development in the context of mine closure and repurposing and that even within the same stakeholder group, there are divergent perspectives. Although this variation is a major challenge, we argue that integrating stakeholder views into mine closure design and repurposing can lead to more responsible and sustainable mine closure that is unique to the particular settings and needs of various stakeholders, and we provide a methodology that mining companies may consider using to understand stakeholder priorities and preferences.

Case Study Background

The Henderson Mine is a large underground molybdenum mine located in Clear Creek County, Colorado, USA (Figure 1). The orebody was discovered in 1964, and shaft sinking began in 1968. The mine has been in operation since 1976 and is expected to close in the next 20 years. It is the largest primary producer of molybdenum in the world, with a yearly production capacity of 8.2 million kilograms. The mine delivers ore via a 15.3 km-long conveyor tunnel and a 7.9 km-long overland conveyor to the mill, where processing takes place. The mill is in Grand County, Colorado, along the Williams Fork River, between approximately 2682 and 2805 m above sea level. The Henderson operation currently provides more than 350 jobs and contributed approximately USD 22.5 million in 2017 and USD 18.3 million in 2018 to the local tax base. This is expected to decrease to USD 3–8 million per year over the next seven years, which will be a significant change and could be potentially devastating for local communities. The Henderson Mine was grandfathered into current reclamation rules and regulations that stipulate the preparation of detailed reclamation plans that establish post-mining land uses [19,20], and mine closure guidelines that specify that closure planning should start from the earliest phases of exploration and feasibility [8,10,21,22,23], and hence, it has only recently begun to consider repurposing alternatives. There are other mines in the US that are in a similar situation, so this paper attempts to provide an example of how to better manage the process.
The mining company has been establishing challenges for students at the Colorado School of Mines to solicit ideas for repurposing the site. The first Henderson Sustainable Development and Entrepreneurial Challenge was launched in 2018, and student teams were tasked with developing a concept for repurposing the mine’s surface facilities and land holdings. The second and most recent challenge took place in 2019. Student teams were asked to develop a concept for sustainable repurposing of the mill site, which is where the mineral processing occurs, and the tailings are deposited. Approximately 567 hectares are covered by tailings at the mill site. Several student teams competed, and a panel of judges chose three winners based on the potential impact of the concept, its creativity, and the groups’ presentations. These three scenarios, in the actual order of awarded place in the challenge, were glass manufacturing of tailings (“tailings”), organic shrimp farming (“shrimp”), and CBD and hemp production (“hemp”). In this paper, we focus on these three winning projects and examine to what extent they contribute to sustainable development according to stakeholder priorities and preferences.

2. Mine Closure Planning and Sustainable Development

The mining industry has the potential to significantly contribute to sustainable development and has been making efforts to engage in more responsible practices [4,24]. Mine closure is rated among mining’s top operating risks [25], and its importance has been increasingly acknowledged in best-practice guidelines and more stringent mine closure regulations that have been put in place since the 1990s [5]. Mine closure can cause negative impacts, including losses of employment, tax revenues, infrastructure, and services, as well as a decrease in the demand for local goods and services [5,26]. The development opportunities that mines can offer to the local community during operation must continue after closure [27]. If managed properly, the transition at mine closure may offer significant opportunities that can be aligned with the Sustainable Development Goals (SDGs), such as repurposing the land and infrastructure for innovative uses that support the transition to a low-carbon future and creating alternative economies for local communities [25,26].
To achieve these goals, early definition of the closure vision (i.e., “closure planning”) is crucial [5,28,29]. According to the recent guide by the International Council for Mining and Metals (ICMM) on integrated mine closure, a closure vision should be informed by the mine’s area of influence, the socioeconomic and environmental context, stakeholder input, country-specific requirements, and the SDGs [10]. The primary objective of closure planning should be to ensure successful decommissioning and reclamation of a site [29,30,31] and maximize sustainable development in the area [5,8,10,14,21,27,30,31].
Closure planning should start from the earliest phases of exploration and feasibility [8,10,12,14,21,22,23,26,29,32], and can help minimize the negative impacts and financial burden of closure and maximize the post-mining benefits [12,21]. If closure planning starts too late in the mine life cycle, the closure may fail in terms of ensuring environmental and socioeconomic sustainability [8,14].
Legislative requirements define the process of closure and the release of responsibilities and ownership rights after closure. Countries vary considerably in terms of these requirements. Some countries have well-established and detailed mine closure regulations, while others have limited or no valid legislation [8,10,33]. In general, mine closure regulations mainly focus on the environmental and physical aspects of mine closure, specifically reclamation and rehabilitation and pay limited attention to the social aspects [5,25,33]. Only a few countries and individual provinces or states have enacted and executed actual mine closure laws or regulations (e.g., the United Kingdom, Chile, Peru, Manitoba and Ontario—Canada—and the state of Nevada, United States), and most countries cover mine closure requirements either within the mining law or within broader environmental legislation that is applicable to mining [23,25,33]. The modern approach to closure is to adhere to the legislative requirements as a minimum and exceed these whenever possible [21].
In recent years, international best-practice guidelines have encouraged mining companies to commit to principles of sustainable development in planning closure [29]. Industry bodies and international development organizations have established guidelines and standards around mine closure. Some key themes in these guidelines and standards include integrated closure planning that considers the environmental, financial, physical, and socio-economic contexts of a particular site, incorporates stakeholder perspectives including community objectives and aspects of social well-being, and includes best practice based environmental management and protection, and uses for land and infrastructure [6,8,10].
Several studies have emphasized the importance and positive consequences of incorporating stakeholders in decision making for post-mining lands [34,35,36,37]. These include reaching a broader consensus about future land use options, identifying priorities and decision-making factors for land use [34], and greater community acceptance and reduced conflict regarding the outcomes [36]. However, stakeholder input only being solicited as part of the official public comment period after developing a closure plan is not uncommon [8]. There is a need for more stakeholder involvement in closure planning [8], but the variation in stakeholder groups’ post-mining interests, values, and expectations is a major challenge [6,12,34,38,39,40,41,42,43,44]. “Sustainability” has different meanings to different people and must be defined according to the needs and values of the affected stakeholders [45,46]. Similarly, stakeholder theory recognizes that value is created when the interests of different stakeholders are considered and addressed [41,47]. This may be accomplished through effective stakeholder engagement for a realistic and transparent sustainability assessment and decision-making process [13,26]. Fortunately, the importance of stakeholder involvement in mining project lifecycle management has been increasingly recognized in the last two decades [48,49]. In addition, the environmental, social, and governance (ESG) goals are commonly being included into resource assessment and analysis tools, leading to investors’ increased commitment to projects that meet these goals [50,51]. These developments might help make societal aspects more mainstream in mine closure planning.
Post-mining planning has often been limited to landscape restoration [38], but repurposing entails finding a new use for the site that utilizes the existing mine site elements and infrastructure to deliver a productive economic activity or other beneficial land use after closure [9,10]. Historically, repurposing of closed mine sites has been rare, but there is increasing pressure for the mining industry to go beyond rehabilitation, and repurposing mines is now starting to become more common [9,10]. Some novel and successful repurposing projects have included tourism attractions, educational and sport facilities, and industrial uses [34]. Though not possible for all sites, the ICMM suggests identifying and assessing repurposing options by using a Multi Criteria Decision Making (MCDM) approach, which is incorporated into the mine closure plan after engaging with stakeholders [10]. Such an approach is more likely to enable positive post-mining land use transitions [9,28].

Previous Studies and Gaps

Previous studies on mine closure and post-mining land use have primarily focused on remediation and rehabilitation of mined lands with limited consideration of stakeholder perspectives and the broader social, economic, and cultural impacts of closure [29,52,53,54,55,56,57,58,59,60,61,62,63,64,65,66,67,68]. Research on sustainable development and mine closure has focused on risks [69,70,71,72] and costs [73,74] associated with mine closure, as well as policies related to closure [75,76]. A couple studies have focused on community wellbeing in the context of mine closure. For example, Odell et al. (2011) developed a framework of socio-environmental indicators by interviewing nearby communities to assess and improve social wellbeing and sustainability through mine closure [77]. In another study, post-mining scenarios were presented to communities three years before the anticipated closure of a gold mine, and through this exercise, it was determined that closure would impact family life, food security, and health [44].
Several studies have used MCDM techniques to evaluate different options in mining, including alternatives for current and future mining developments [13,78], community investments [79], locations for mine waste storage [80], mining methods [81,82], and mining equipment [83,84,85]. Only a few studies have focused on identifying and ranking post mining land uses. Amirshenava and Osanloo (2018) assessed mine closure risks by following a MCDM approach for an iron ore mine in Iran and ranked the post mining land use alternatives based on the opinions of an expert team and not stakeholders [69]. Bangian et al. (2012) used fuzzy multi-attribute decision making (MADM) to estimate the closure and reclamation costs of 17 post mining land use alternatives for the pit area of a copper mine in Iran but did not incorporate real stakeholders in the decision-making process [86]. Soltanmohammadi et al. (2008–2010) used three different MADM techniques in separate studies to rank potential post mining land uses of a hypothetical mined land to demonstrate to what extent the MADM method influenced the selection of optimal land use [87,88,89]. Eshun et al. (2018) used an MADM technique to determine the optimum mine closure alternative for a mine in Ghana based on the opinions of five experts and with respect to 40 criteria attributes [39]. Masoumi et al. (2014) focused on selecting the optimal post mining land use alternative using fuzzy MADM for a surface coal mine using 28 attributes based on three experts’ judgments [90].
Most existing mine closure plans do not align with the closure guidelines by ICMM, The Mining Association of Canada (MAC), and others that encourage early engagement with stakeholders [5]. Managing the socio-economic impacts of mine closure is a noted gap in research, policy, and practice [8,14,15,27,31,38], which hinders sustainable post-mining land use opportunities [9]. Mine closure and post-closure land use involve more than decommissioning and rehabilitation [5,6]. Long-term development is possible with an integrated mine closure approach and innovative repurposing solutions. However, participatory scenario analyses or case studies that support decision-making for repurposing have been insufficiently explored. Mert (2019) examined the benefits of repurposing a former sand quarry in Turkey as a solar power plant and interviewed engineers, residents, and local government officials to understand their satisfaction with the power plant. They found that all stakeholders were satisfied with the transformation [40]. However, this study examined stakeholder perspectives after the repurposing took place, interviewed few stakeholder groups, and did not provide or compare any repurposing alternatives.
Our analysis addresses a gap in the literature regarding participatory scenario analyses that support a priori decision making for repurposing. We focus on the ways in which different repurposing alternatives may contribute to sustainable development by using multi-attribute utility theory (MAUT) to determine which repurposing scenario would better reflect stakeholder preferences and result in the most economically, environmentally, and socially sustainable outcome. We also demonstrate the robustness of our sustainability assessment method through sensitivity and scenario analyses.

3. Methodology

Our methodology consisted of five major steps which we outline in the sections below (Figure 2).

3.1. Identification of Relevant Indicators

To determine the indicators used in this study, we drew from a comprehensive indicator set that was established as part of a larger study on sustainability assessment frameworks as decision support tools for the mining sector [46]. From this set, we identified an initial set of 31 indicators (9 social, 14 environmental, and 8 economic) that were most suitable for the repurposing phase of the mining life cycle and this case study. We categorized the indicators according to the three dimensions of sustainability (environmental, economic, and social), as recommended in the literature for sustainability assessment [91,92,93,94,95]. Because of the availability and quality of data, it was necessary to eliminate some of the indicators and add some new indicators that were relevant for this case. The elimination of some indicators was also required to decrease the cognitive load of the survey participants and to optimize the time they spent on completing the survey. This was a necessary step to ensure that our indicator set reduces complexity, is easily understandable, and resonates with the survey participants [49]. After refining the indicator set, the final set included 17 indicators (attributes) in total, broken down into five economic, five social, and seven environmental indicators (Table 1). The verbiage of indicators was modified to simplify the survey. The indicators were coded in the order of their appearance in the survey questions.
We understand and acknowledge the links between some of the indicators. For example, while investments in public services (Ec2) falls under economic aspects in our categorization, it is also a key component of social aspects of sustainable development. We grouped the indicators into categories based on how they are commonly classified in the literature.

3.2. Data Collection

We performed data collection in two parts: (i) collection of data about the current mine and proposed student projects, and (ii) examination of stakeholder preferences to obtain weights to be used in Multi-Attribute Decision Analysis (MADA). In the first part, data related to the current mine operation, its footprint, and its impacts on the community and the environment were collected through publicly available data (e.g., company reports, company website, and government documents). These data allowed us to understand and define the “baseline” in the tailings dam area before considering the post-closure period. Then, we collected data related to the proposed repurposing scenarios from the student reports. Almost all the indicators in our final set could be informed by the data in the student reports. Only one indicator, emissions (En6), was estimated based on similar industries’ public data.
Following the “contribution to sustainability” model [45,46], and stakeholder theory [41,47], which recognize the different needs and values of affected stakeholders, we also considered what aspects of “sustainability” were the most important to various stakeholders. The second part of data collection examined the preferences of stakeholder groups with the goal of integrating them into the sustainability assessment of repurposing alternatives. To achieve this, we first identified the stakeholders that were relevant and interested in the repurposing of the tailings dam area through a brainstorming activity based on our knowledge of the region. We then mapped the identified stakeholder groups based on their power over and interest in the repurposing projects, and we prioritized them for involvement in the decision-making process. After obtaining our final stakeholder list, we utilized an online survey method where the stakeholders were asked to perform pairwise comparisons among all sub-goals (level 2), criteria (level 3), and attributes (level 4) by using the Saaty Scale [96]. This examination of stakeholder preferences was necessary to obtain the weights to be used in the multi-attribute utility function. We continued our survey to the point where we achieved relatively equal representation from all the stakeholder groups. In the end, we collected responses from 41 individuals from seven different stakeholder groups (Figure 3). We used the term, “government agencies” to refer to state and federal agency representatives and “local governments” to refer to mayors, city councils, and county commissioners. Industry advisors included industry professionals who provided guidance to the students during the challenge. Similarly, a group of faculty members served as mentors to the student groups during the challenge.
The survey included 27 questions, divided into (i) four questions related to demographic information; (ii) five questions about financial contributions and economic performance; (iii) five questions about community impacts and employment; (iv) ten questions about waste, emissions, resource consumption, and land use; and (v) three questions about general aspects of sustainability (see Table A1 for the complete survey).

3.3. Multi-Attribute Decision Analysis (MADA)

We performed the sustainability assessment for the three repurposing scenarios by using MADA, which is subdiscipline of multi-criteria decision making (MCDM) for making preference decisions, such as prioritization, evaluation, and selection over different alternatives [97]. We achieved MADA based on the multi-attribute utility theory (MAUT), which is a technique in the broader field of MCDM [98]. MAUT is an analytical approach for making logical decisions and for converging toward a preferred solution where there are multiple objectives or attributes [7,99]. It is frequently used in decision-making processes involving sustainability issues, since these issues are more complex and require more than a cost/profit assessment [28,36,39,86,91,93,100,101,102]. Furthermore, optimizing project selection through balancing economic, environmental, and social goals creates an opportunity for developing decision-support tools for mining companies, and MAUT is a well-suited technique to support prioritization of conflicting goals [43].
MAUT has three basic steps:
  • Construction of a goals hierarchy to define the attributes by which the decision objectives will be measured;
  • Formulation of single-measure utility functions for each attribute to normalize the measurement or scale of all attributes across all alternatives;
  • Weighting of the preferences between attributes [100].
As the first step in decision analysis, we constructed a goals hierarchy (Figure 4) comprising four levels. From the bottom to the top, the levels represent the following:
  • Level 4 consists of the attributes, in other words, the sustainability indicators selected for this assessment (refer to Table 1 to see which indicators the codes stand for);
  • Level 3 represents criteria that classify the attributes based on broader issue areas;
  • Level 2 includes the economic, social, and environmental sub-goals that form the overall goal;
  • Level 1 is the overall goal of “sustainable repurposing” of the tailings dam area.
In the second step of MADA, we formulated single-measure utility functions for 17 different attributes (U1(a1), U2(a2), …, U17(a17) for 17 different attributes from a1 to a17) to mathematically transform monetary or other values into utility values on a standardized scale, in this case, from 0 to 1. The Logical Decisions Software was used to formulate the utility functions [103]. Although single-measure utility functions can be in any shape (i.e., linear and non-linear), utility functions of all attributes were assumed to be linear in this study for practical reasons and because it is widely stated in the literature that attribute weights [104] and ranking of alternatives [105,106] do not really depend on the shape of the value function. In addition, in most sustainability evaluation studies [107,108], experimental studies, and in practical applications, the utility functions are often assumed to be linear [104,109]. Lastly, construction of non-linear utility functions is time-consuming and complex as it requires long interviews with decision makers with comprehensive knowledge of the problem area [110], which was unfeasible for our study, especially with the prevalence of the COVID-19 pandemic at the time of study.
In the last step of MADA, we used the analytical hierarchy process (AHP) method to calculate the relative importance weight of each sub-goal, criteria, and attribute. We selected AHP as it is a well-established, reliable, and popular technique for decision making [13,108,111,112], especially for handling multiple decision makers [113]. It is also considered to be easier for stakeholders to perform when compared to other weighting methods [93]. Following the AHP approach, we used the stakeholder responses in the online survey, checked for consistency, and calculated the weights assigned to each sub-goal, criteria, and attribute by each respondent. As AHP examines the relative importance of parameters, the parameter with the higher weight is deemed to be given higher importance than the other parameters in the same comparison set [13].
We aggregated preferences at the stakeholder group level as well as the combined group level (i.e., the combined decision of all 41 participants). We obtained the weights assigned by each individual stakeholder group by using the aggregation of individual judgments (AIJ) technique, and the weights assigned by the combined group decision was obtained by using the aggregation of individual priorities (AIP). We decided to use both techniques as they were complementary to each other in our case study. AIJ is used when individuals act in concert and pool their judgments in such a way that the group becomes a new ‘individual’ and behaves like one (i.e., if the group is a synergistic unit) [112,114,115,116]. In our case, we first considered the stakeholder groups as synergistic units with members that may have similar ways of thinking about sustainability aspects. AIP, on the other hand, is used when individuals express different value systems [112,114,115,116]. It is suggested for groups larger than five people and shows great potential to support decisions with diverging or conflicting goals [115], which fit our case study. Hence, we used AIP to achieve the weights that reflect the whole group’s decision.
We calculated both the geometric average of the judgments (AIJ) and the arithmetic average of priorities (AIP) with Equations (1) and (2), respectively, by assuming that the individual respondents were of equal importance, which is the most common assumption [112,117].
J g   k , l =   i = 1 n J i k , l w i
where
Jg (k, l) is the group’s judgment for the relative importance of parameters k and l,
Ji (k, l) is the individual respondent i’s judgment for the relative importance of parameters k and l,
wi is the importance of individual respondent i; i = 1 n w i = 1, and n is the number of responders.
P g   A j = i = 1 n w i P i   ( A j )
where,
Pg (Aj) is the group’s priority weight for the parameter j,
Pi (Aj) is the individual respondent i’s priority weight for the parameter j,
wi is the importance of individual responder i; i = 1 n w i = 1, and n is the number of responders.

3.4. Ranking of Alternatives and Their Evaluation

After all steps of the MADA were completed, we calculated the utility scores of each repurposing scenario by utilizing the Logical Decisions Software, obtained the ranking of alternatives, and interpreted the results. To calculate the utility scores of alternatives, we input the obtained weights to the Logical Decisions Software to be used in the multi-attribute utility functions in the form shown in Equation (3) [100,103].
U g X = w 1 U 1 X + w 2 U 2 X + + w n U n X
where
Ug(X) is the utility of alternative X for the overall goal/sub-goal/criterion “g”,
Un(X) is the utility of alternative X for the nth member of g (a member is either a sub-goal, a criterion or an attribute that is included under its upper level in the goals hierarchy), and
wn is the weight assigned to the nth member of g, and the sum of the w’s = 1.
We obtained the ranking of alternatives based on the utility scores of alternatives for the overall goal (i.e., sustainable repurposing). The results achieved the following:
  • Revealed the preferences of each stakeholder group on what the sustainable repurposing of the area should look like;
  • Explored the variability of views about “sustainability” within and among stakeholder groups;
  • Revealed the strengths and weaknesses of each alternative in terms of the economic, social, and environmental sustainability of the mill area;
  • Determined which repurposing scenario better reflected stakeholder preferences and results in the most economically, environmentally, and socially sustainable outcomes.

3.5. Sensitivity and Scenario Analysis

After the assessment of the results, we conducted a sensitivity analysis to test how sensitive or robust the ranking of alternatives was to changes in the weights assigned to the sub-goals, criteria, and attributes. The sensitivity analysis was performed by running the sensitivity graph function of Logical Decisions, which draws a graph showing the effect of altering the weight of a sub-goal, criteria, or attribute on the utility scores of alternatives.
We also conducted two different “what-if scenarios” to understand the effects of smaller representation of stakeholder groups on the final group decision.
Scenario 1: Removing the Outliers in Each Stakeholder Group
We determined the general outliers (i.e., diverging members) in each stakeholder group by creating a spider diagram that showed the weights assigned to the sub-goals, criteria, and attributes by all members of that group. After determining the outliers in each stakeholder group, we removed them from the analysis, and recalculated the weights and the utility scores of the alternatives. In total, we ran seven simulations (one simulation for each stakeholder group).
Scenario 2: Randomly Removing (a) Respondents and (b) Each Stakeholder Group
We first randomly removed one respondent at a time from the analysis following the jackknife method. We ran 41 simulations in total, for each of which we calculated the weights assigned and the resulting utility scores of the repurposing alternatives. We calculated the weights for each simulation using MATLAB, and then we inserted those weights in Logical Decisions to obtain each alternative’s utility score. We then followed the same steps for removing one stakeholder group and ran seven more simulations.

3.6. Study Limitation

The three repurposing alternatives presented in this study were selected by a jury in the student challenge, including stakeholders from the mining company, community members, and faculty. Many repurposing alternatives were developed by student groups composed of multidisciplinary graduate and undergraduate students. The student groups, advised by two stakeholder groups (industry advisors and faculty members), collected views of community members, and evaluated the environmental and social aspects of their proposed repurposing alternatives. There were more than ten alternatives presented to the jury, and three of them were selected as the best alternatives based on the jury’s evaluation. Still, a larger stakeholder engagement would be ideal and is highly recommended for future studies. In practice, repurposing options should be developed in collaboration with stakeholders for a more participatory and deliberative decision-making process.
Moreover, in the student challenge, the main problem statement proposed by the mining company was economically focused and referred to the community losing significant amount of tax every year after closure. No other important social aspects were mentioned, such as cultural disruption or quality of life. In line with the problem statement, student projects also lacked such social aspects. Since the availability of data from the student projects drove our indicator selection process, our final indicator set lacked social indicators related to cultural disruption or quality of life. Although a focus on economic transition is critical for post-closure sustainability, there are several other social aspects of mine closure that should be considered [6]. We believe that these social aspects should also be assessed when considering the potential impacts of proposed repurposing projects.

4. Results and Discussion

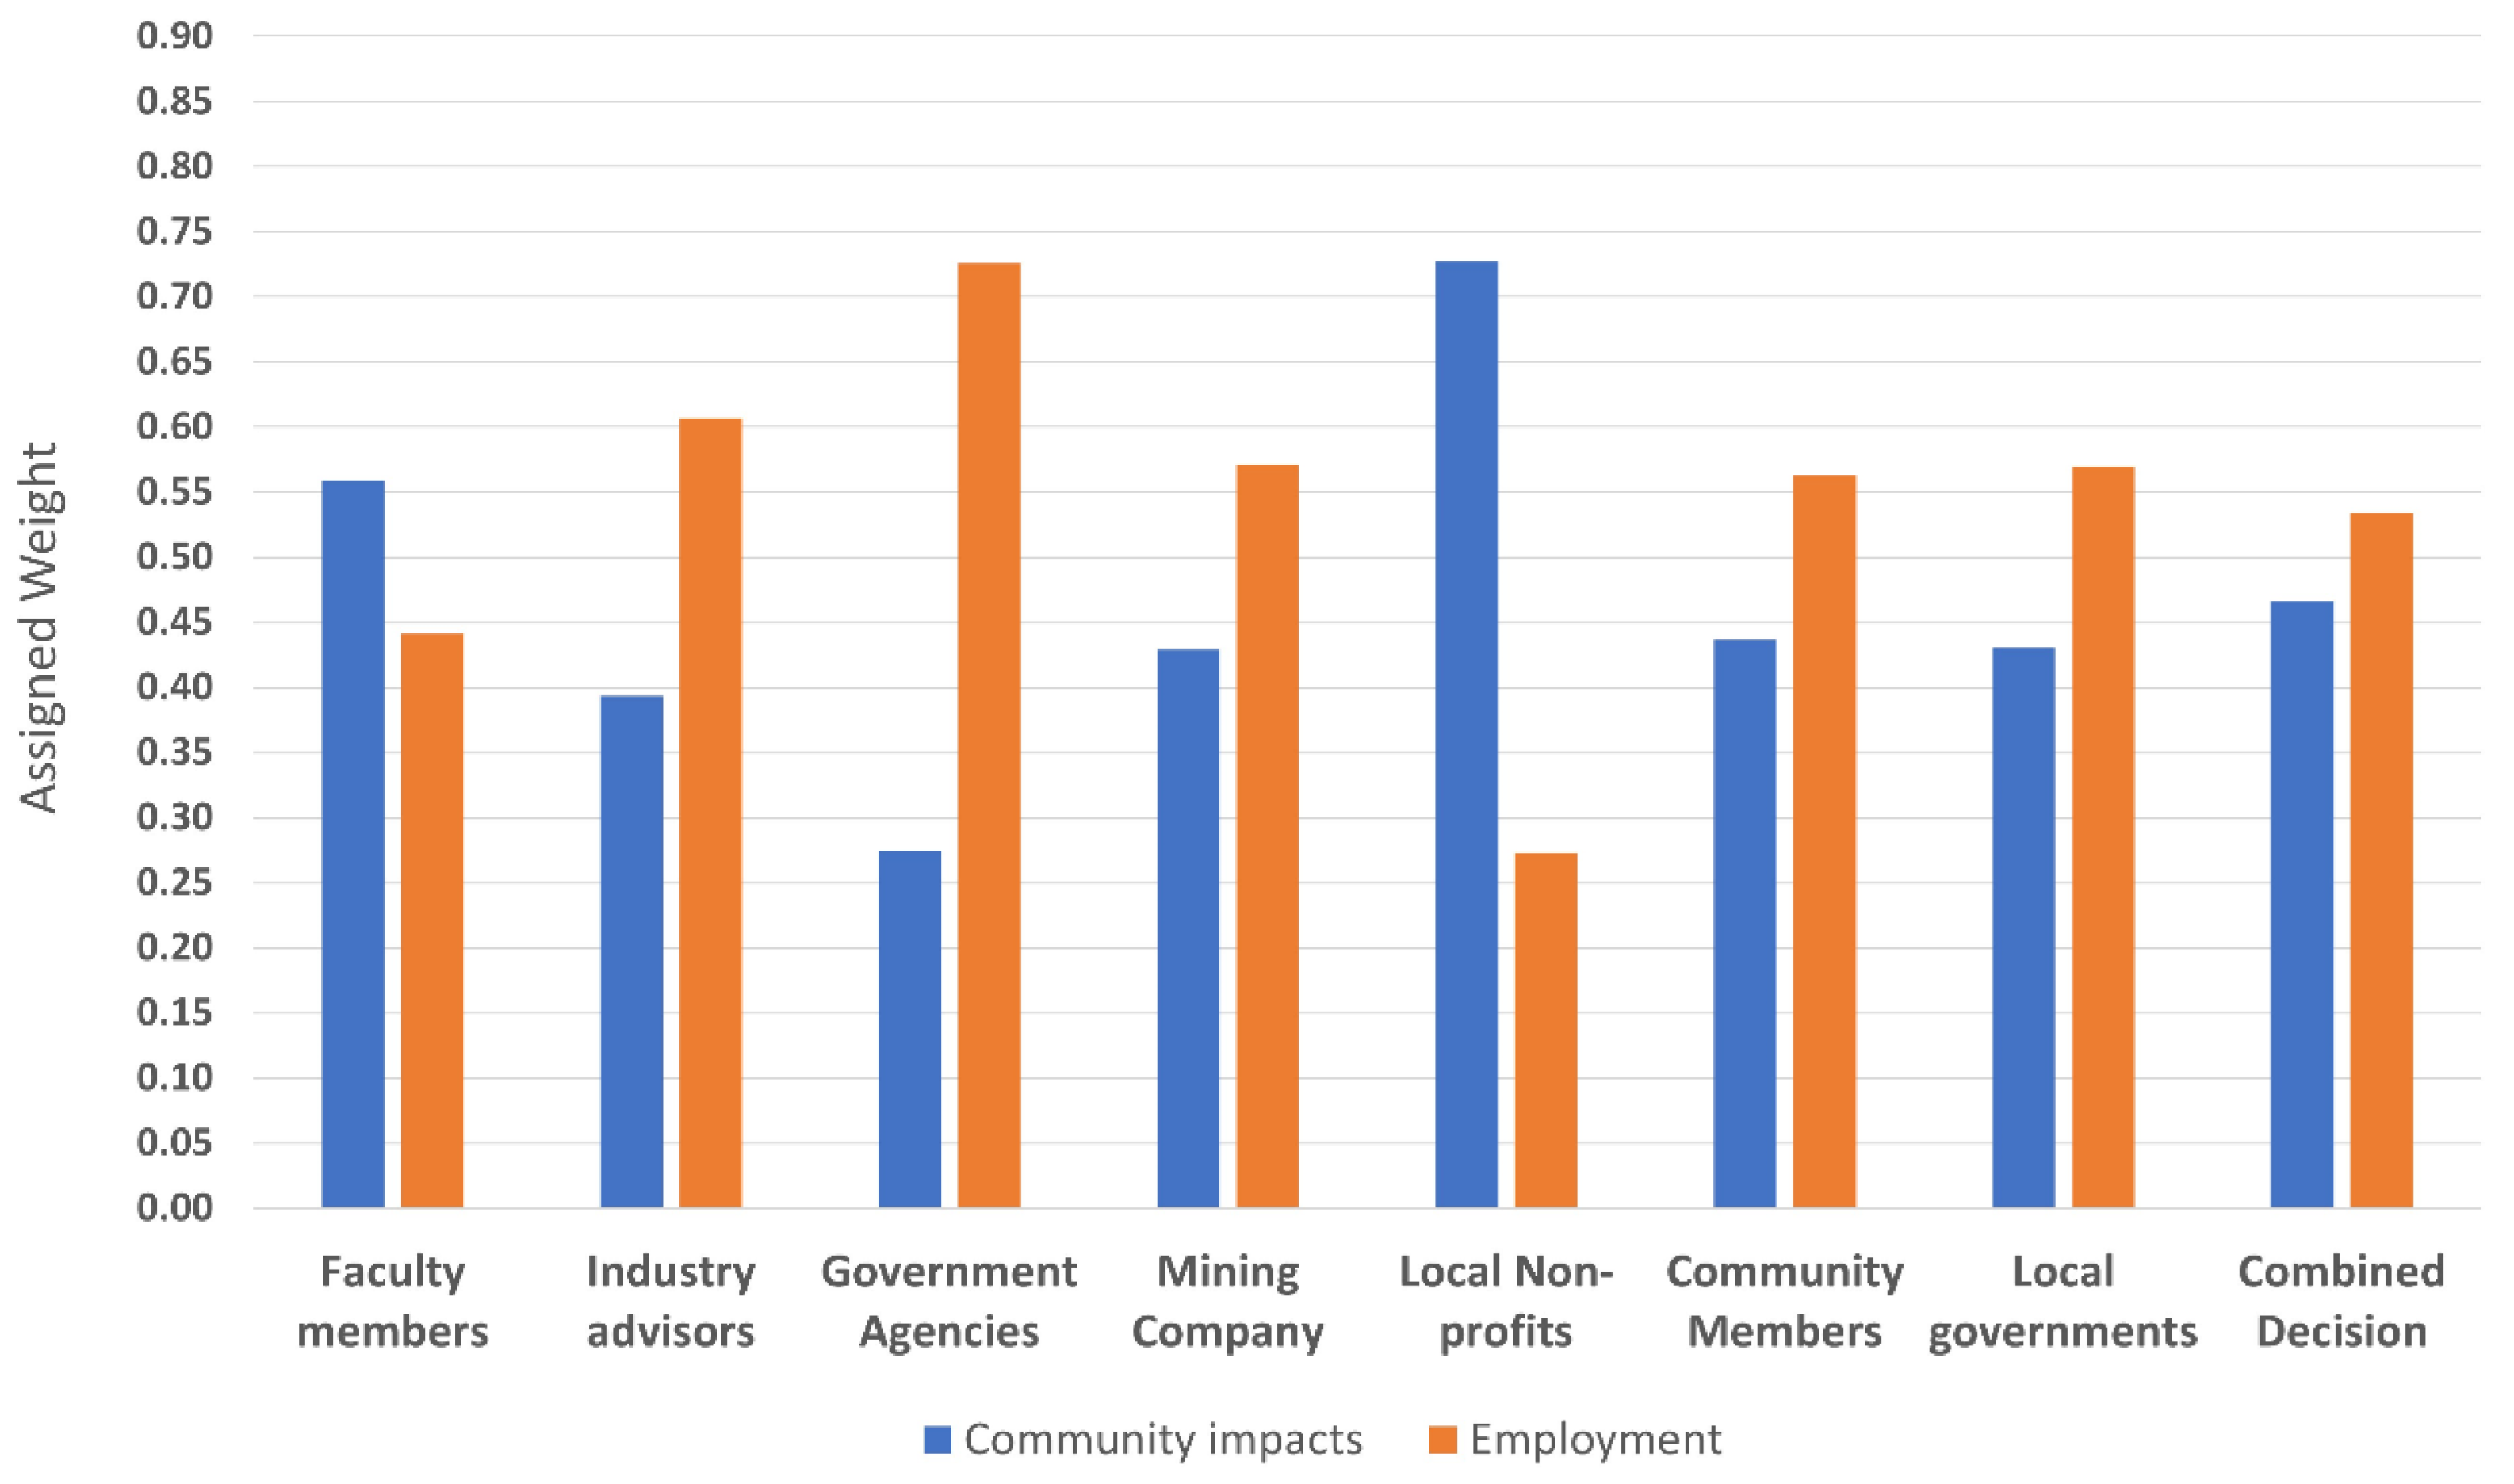
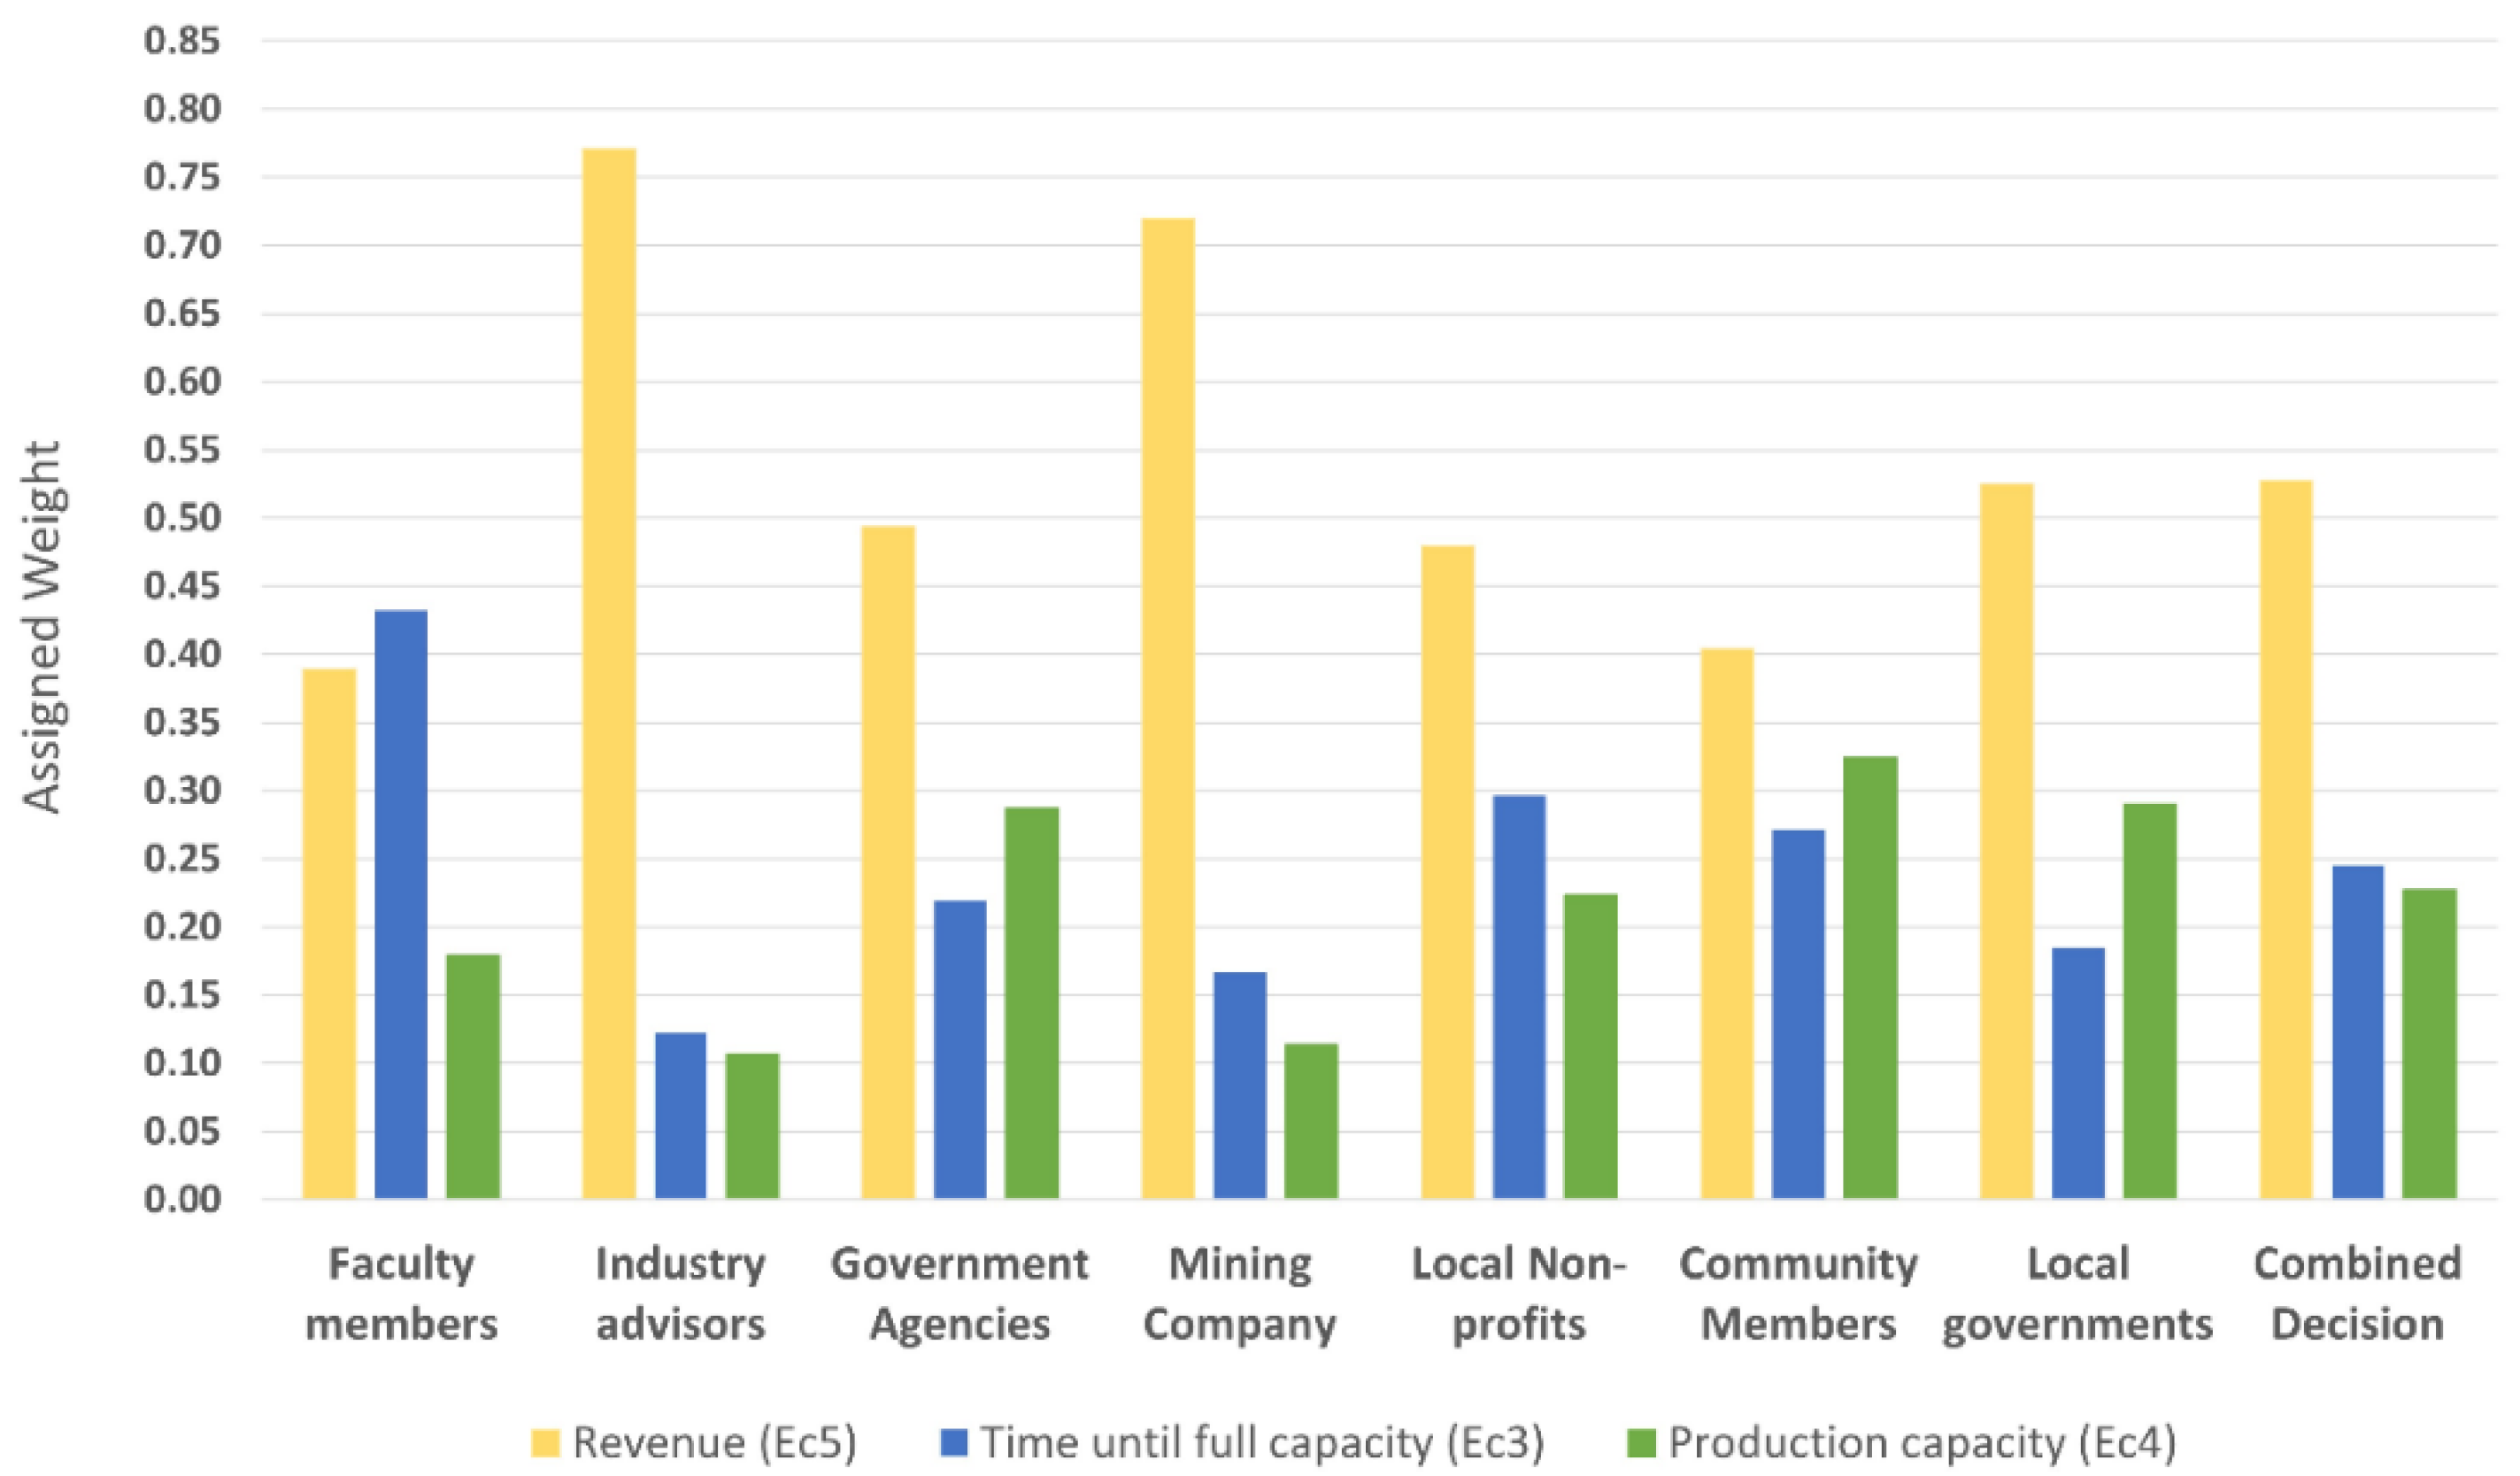
4.1. Stakeholder Priorities

As may be expected, the priorities of the different stakeholder groups were both similar and different depending on the issue area. In general, community members’ responses aligned with faculty members, and they shared the closest views on the importance of economic criteria (Level 3), contribution to society attributes (Level 4), and community impacts attributes (Level 4). Similarly, industry advisors and local governments, as well as government agencies and local governments were generally in agreement with each other. Industry advisors shared the closest views with local governments on the importance of the three sub-goals of sustainable repurposing (Level 2), social criteria (Level 3), and economic performance attributes (Level 4). Government agencies and local governments shared the closest views on economic performance attributes (Level 4). However, in general, local non-profits’ views often diverged from the other groups, and local governments’ views contrasted those of the mining company and faculty members. This may indicate that the mining company should pay more attention to local governments’ perspectives to better align mine closure with local sustainability criteria, development plans, and priorities and to better contribute to sustainable development at the local level. We also observed that community members’ views were generally in line with the combined group decision, which demonstrates the heterogeneity of communities.
At Level 2, the combined group valued the economic aspects of repurposing the most (0.430), followed by environmental (0.340), and finally social (0.230) (Figure 5). Industry advisors, government agencies, community members, and local governments followed this pattern, although the weights they assigned to each attribute differed. Faculty members, the mining company, and local non-profits valued environmental aspects the most. Although social aspects were valued the least in general, the mining company placed the highest importance on them (0.306) compared to the other stakeholder groups. Community members’ preferences were the closest to the combined decision at this level.
At Level 3—economic criteria—the combined group decision valued (Figure 6) contribution to society slightly higher (0.540) than the economic performance of the new facility (0.460). However, industry advisors, government agencies, and local governments shared similar views at this level and valued economic performance more. Faculty members’ and community members’ preferences were also aligned, with similar weights on contribution to society (0.685 and 0.627, respectively). Among all groups, contribution to society was most important to local non-profits (0.838), and economic performance was most important to industry advisors (0.656). The mining company’s preferences were the closest to the combined decision at this level.
At Level 3—social criteria—the combined group decision valued (Figure 7) employment slightly higher (0.534) than the community impacts of the new facility (0.466), although faculty members and local non-profits valued community impacts more than employment. Among all groups, employment was most important to government agencies (0.726), and community impacts were most important to local non-profits (0.727).
At Level 3—environmental criteria—the order of importance for the combined group decision was air pollution (0.376), waste (0.266), resource consumption (0.214), and land use (0.144), with all stakeholder groups placing air pollution as the top priority (Figure 8). The mining company and local non-profits diverged from the combined group decision, with the mining company placing waste as the next highest priority followed by land use and resource consumption, and the local non-profits placing more emphasis on land use followed by resource consumption and then waste. Faculty members’ and industry advisors’ preferences were particularly close to each other, and community members’ preferences were the closest to the combined decision at this level.
At Level 4, under contribution to society, the combined group decision valued investments in public services more (0.608) than income tax payments by the new facility (0.392) (Figure 9). The prioritization of investments in public services was prevalent among local non-profits (0.873), faculty members (0.778), community members (0.756), the mining company (0.656), and government agencies (0.553). Income tax payments were more of a concern to local governments (0.627) and industry advisors (0.602). The faculty members’ and community members’ preferences were similar at this level, while industry advisors and local governments shared similar values.
At Level 4, under economic performance, the group valued the revenue of the new facility the most (0.528), followed by the time until full capacity (0.245), and production capacity (0.227) (Figure 10). At this level, all stakeholder groups except faculty members valued revenue more than the other two attributes; faculty members were the only group who valued time until full capacity (0.432) more than revenue (0.389). Government bodies’ preferences were similar at this level, while industry advisors and the mining company shared similar values.
At Level 4, under community impacts, the group placed more importance on nuisance (0.622) than traffic (0.378); however, governmental bodies prioritized traffic more than nuisance (Figure 11). Faculty members’ and community members’ preferences were similar, as well as to the combined decision at this level. Industry advisors and the mining company also shared similar values.
At Level 4, under employment, the group prioritized the annual salary provided by the new facility (0.400) over the number of employees (0.388) and number of job types (0.212) (Figure 12). Government agencies, the mining company, and local non-profits mirrored this order of importance. The mining company valued annual salary considerably higher (0.678) than the other groups while local governments did the same for number of job types (0.357). Industry advisors’ and community members’ preferences were similar at this level, while government agencies’ views were the closest to the combined decision.
At Level 4, under resource consumption (Figure 13), the group prioritized the new facility’s energy use (0.431) over the energy supplied by renewables (0.351) and recycled input materials (0.218) (Figure 13). Industry advisors, government agencies, the mining company, and local non-profits mirrored this order of importance, while faculty members, communities, and local governments valued energy supplied by renewables more than the other resource consumption attributes.
At Level 4, under waste (Figure 14), all stakeholder groups, except local non-profits, valued the new facility’s waste production (0.640) more than untreated tailings (0.360), with waste production emerging as a significant concern to community members (0.802) (Figure 14). Local non-profits placed equal weights to both attributes. Faculty members’, industry advisors’, and local governments’ preferences were similar to each other, as well as to the combined decision at this level. Government agencies and the mining company also shared similar views.
These results show that different stakeholder groups have different opinions about what constitutes sustainable development. Understanding different stakeholder views on sustainable repurposing is essential as a feedback loop for decision makers and may impact the design of repurposing alternatives. No matter which repurposing alternative is selected, it might be beneficial to modify the project design or plan in some way to specifically address the higher importance placed on some parameters of sustainable repurposing. This would lead to a more transparent and representative closure planning that addresses stakeholder concerns.

Convergent and Divergent Views within Stakeholder Groups

To understand the level of variability of views within stakeholder groups, we assessed the ranges in weights (i.e., the difference between the maximum and the minimum weights) assigned by stakeholder groups to each sustainable repurposing parameter (Table 2).
Overall, differing perspectives within each stakeholder group increased from Level 2 (sub-goals) to Level 4 (attributes), demonstrating more heterogeneity within groups as the parameters became more specific. At Level 2, there was greater alignment within each group on the importance of the social sub-goals, and at Level 3, there was greater alignment on the importance of the environmental criteria. At Level 4, the respondents within each stakeholder group were most aligned in their prioritization of specific economic attributes.
At Level 2, there was greater disagreement within all stakeholder groups except community members, on the importance of economic aspects. Within most groups, there was more heterogeneity in perspectives on the value of economic and social criteria at Level 3 and environmental attributes at Level 4. In general, economic parameters generated the most diversified views among community members and the most aligned views among local non-profits. Economic attributes, income tax payments and investment in public services were in large part not aligned within most stakeholder groups except local non-profit members who were almost in perfect agreement with each other (0.067 range). The group with the closest views on the importance of attributes under economic performance (i.e., time until full capacity, production capacity, and revenue) was industry advisors, while there was much less alignment in these parameters within the remaining stakeholder groups. In general, social parameters generated the most diversified views among local governments and the closest views among local non-profits. Faculty members held the closest perspectives on the importance of the social attributes under employment (i.e., annual salary, number of employees, and number of job types), and government agencies and the mining company representatives also shared relatively close internal views on these topics. In general, industry advisors and government bodies held the most diverse perspectives on environmental parameters, while faculty members’ views were the most closely aligned. The environmental criteria at Level 3 created an area of general agreement within all responding groups. The importance of the environmental attributes under waste (i.e., untreated tailings, and waste production) created considerable heterogeneity within all stakeholder groups except the community members.
Overall, local non-profits and the mining company had the closest views among their members while local governments and community members had the greatest diversity among their groups. This is to be expected since non-profits and mining companies operate under particular and shared charters across their organizations. The higher heterogeneity among the community members is consistent with our findings in the previous section where community members’ views were generally in line with the combined group decision, and it reinforces the literature on the heterogeneity of communities and mineral developments [118,119,120,121,122].
The more responses are collected, the more representative the assessment will be of the wider public’s view. Furthermore, we suggest that the more heterogenous the views are in a stakeholder group, the more members of those groups should be involved in the evaluation to mitigate subjectivity in decision-making methods such as MADA. Since community members are a larger and more heterogeneous group than the other groups, instead of considering community members as one stakeholder group, it would be useful to breakdown the community members into smaller groups (e.g., women, vulnerable groups, lions clubs, and other groups that emerge within the community) identified before and during the assessment. Another approach could be to breakdown the community based on demographic and socio-economic attributes (e.g., education, job type, age, income).
For the mining company, areas where there are more divergent perspectives, could signal topics to focus on during future stakeholder engagements. This could help shape more sustainable post-mining land uses.

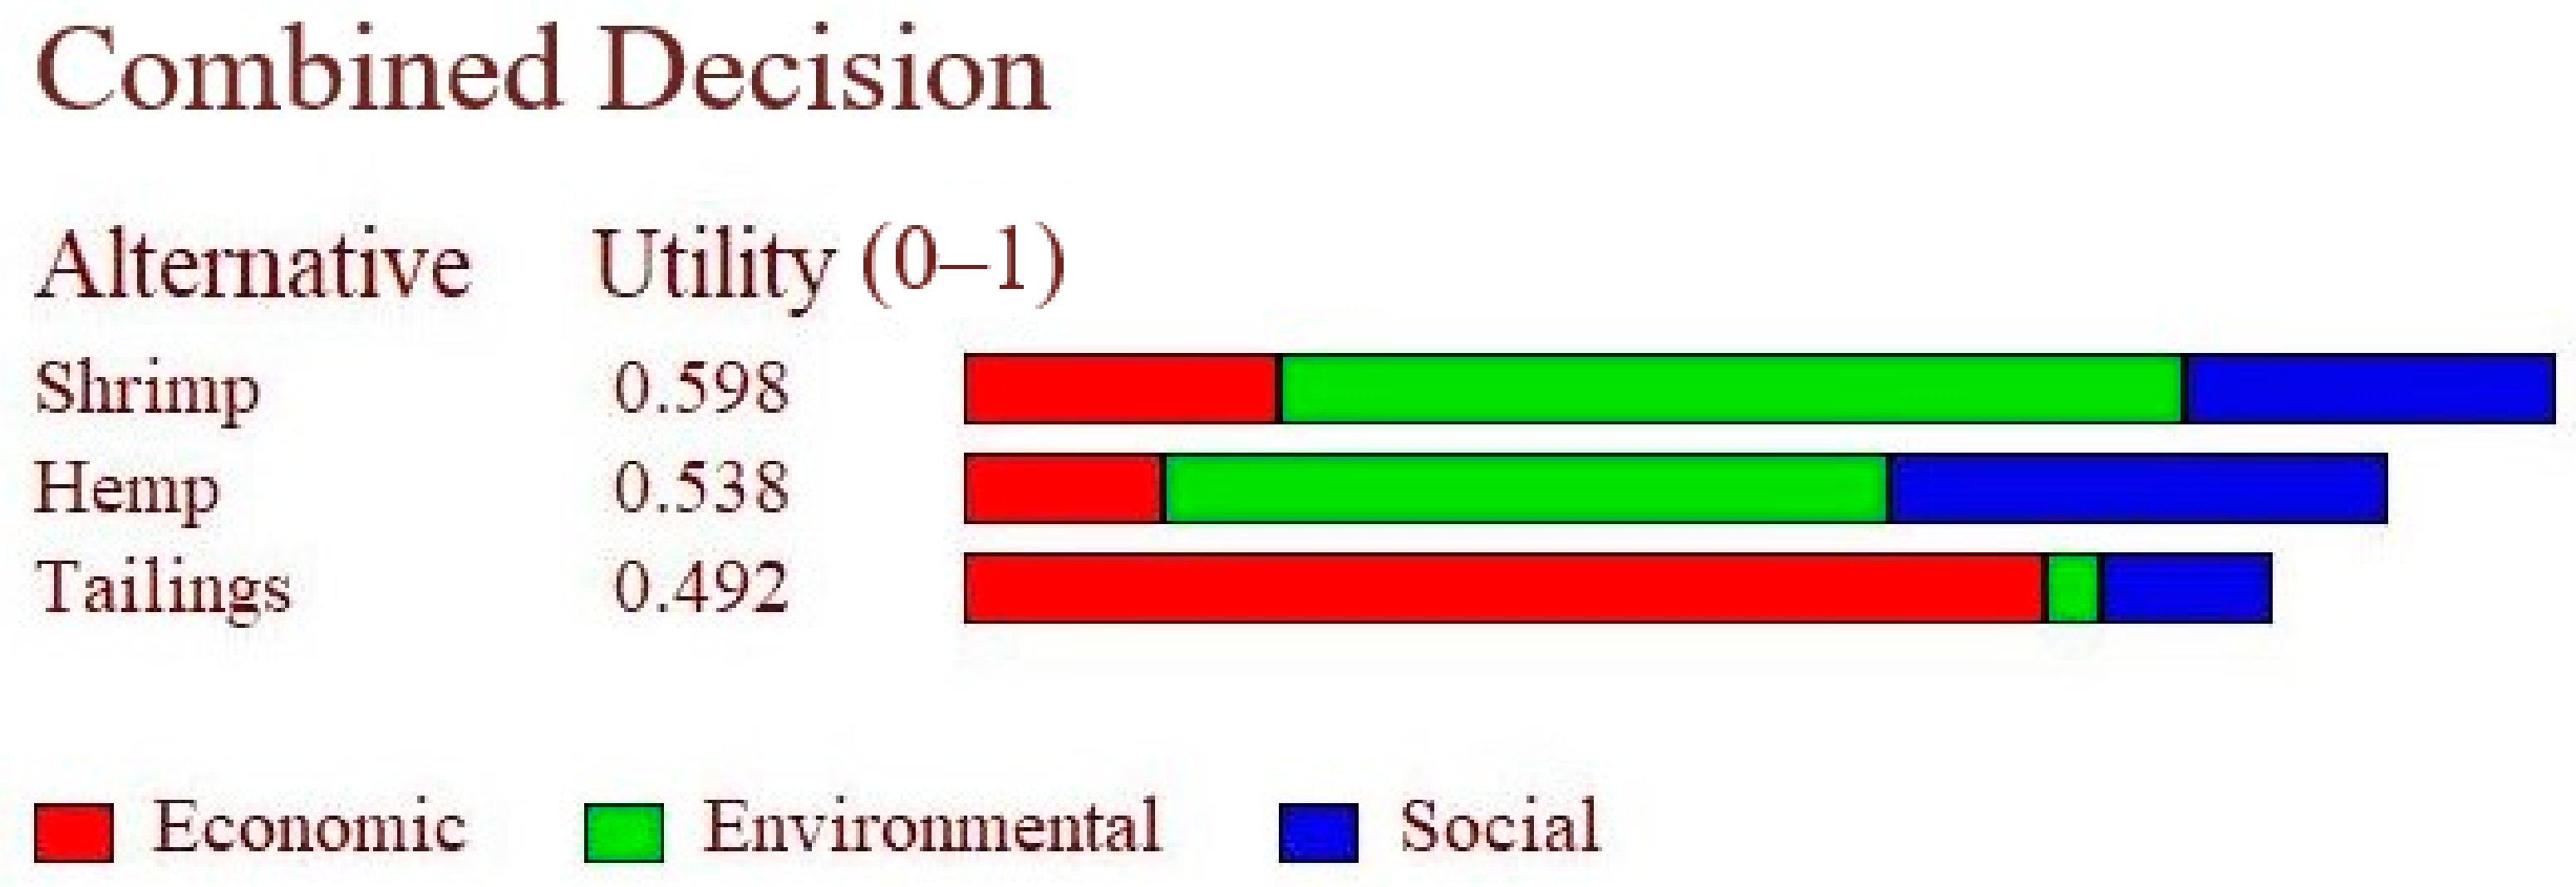
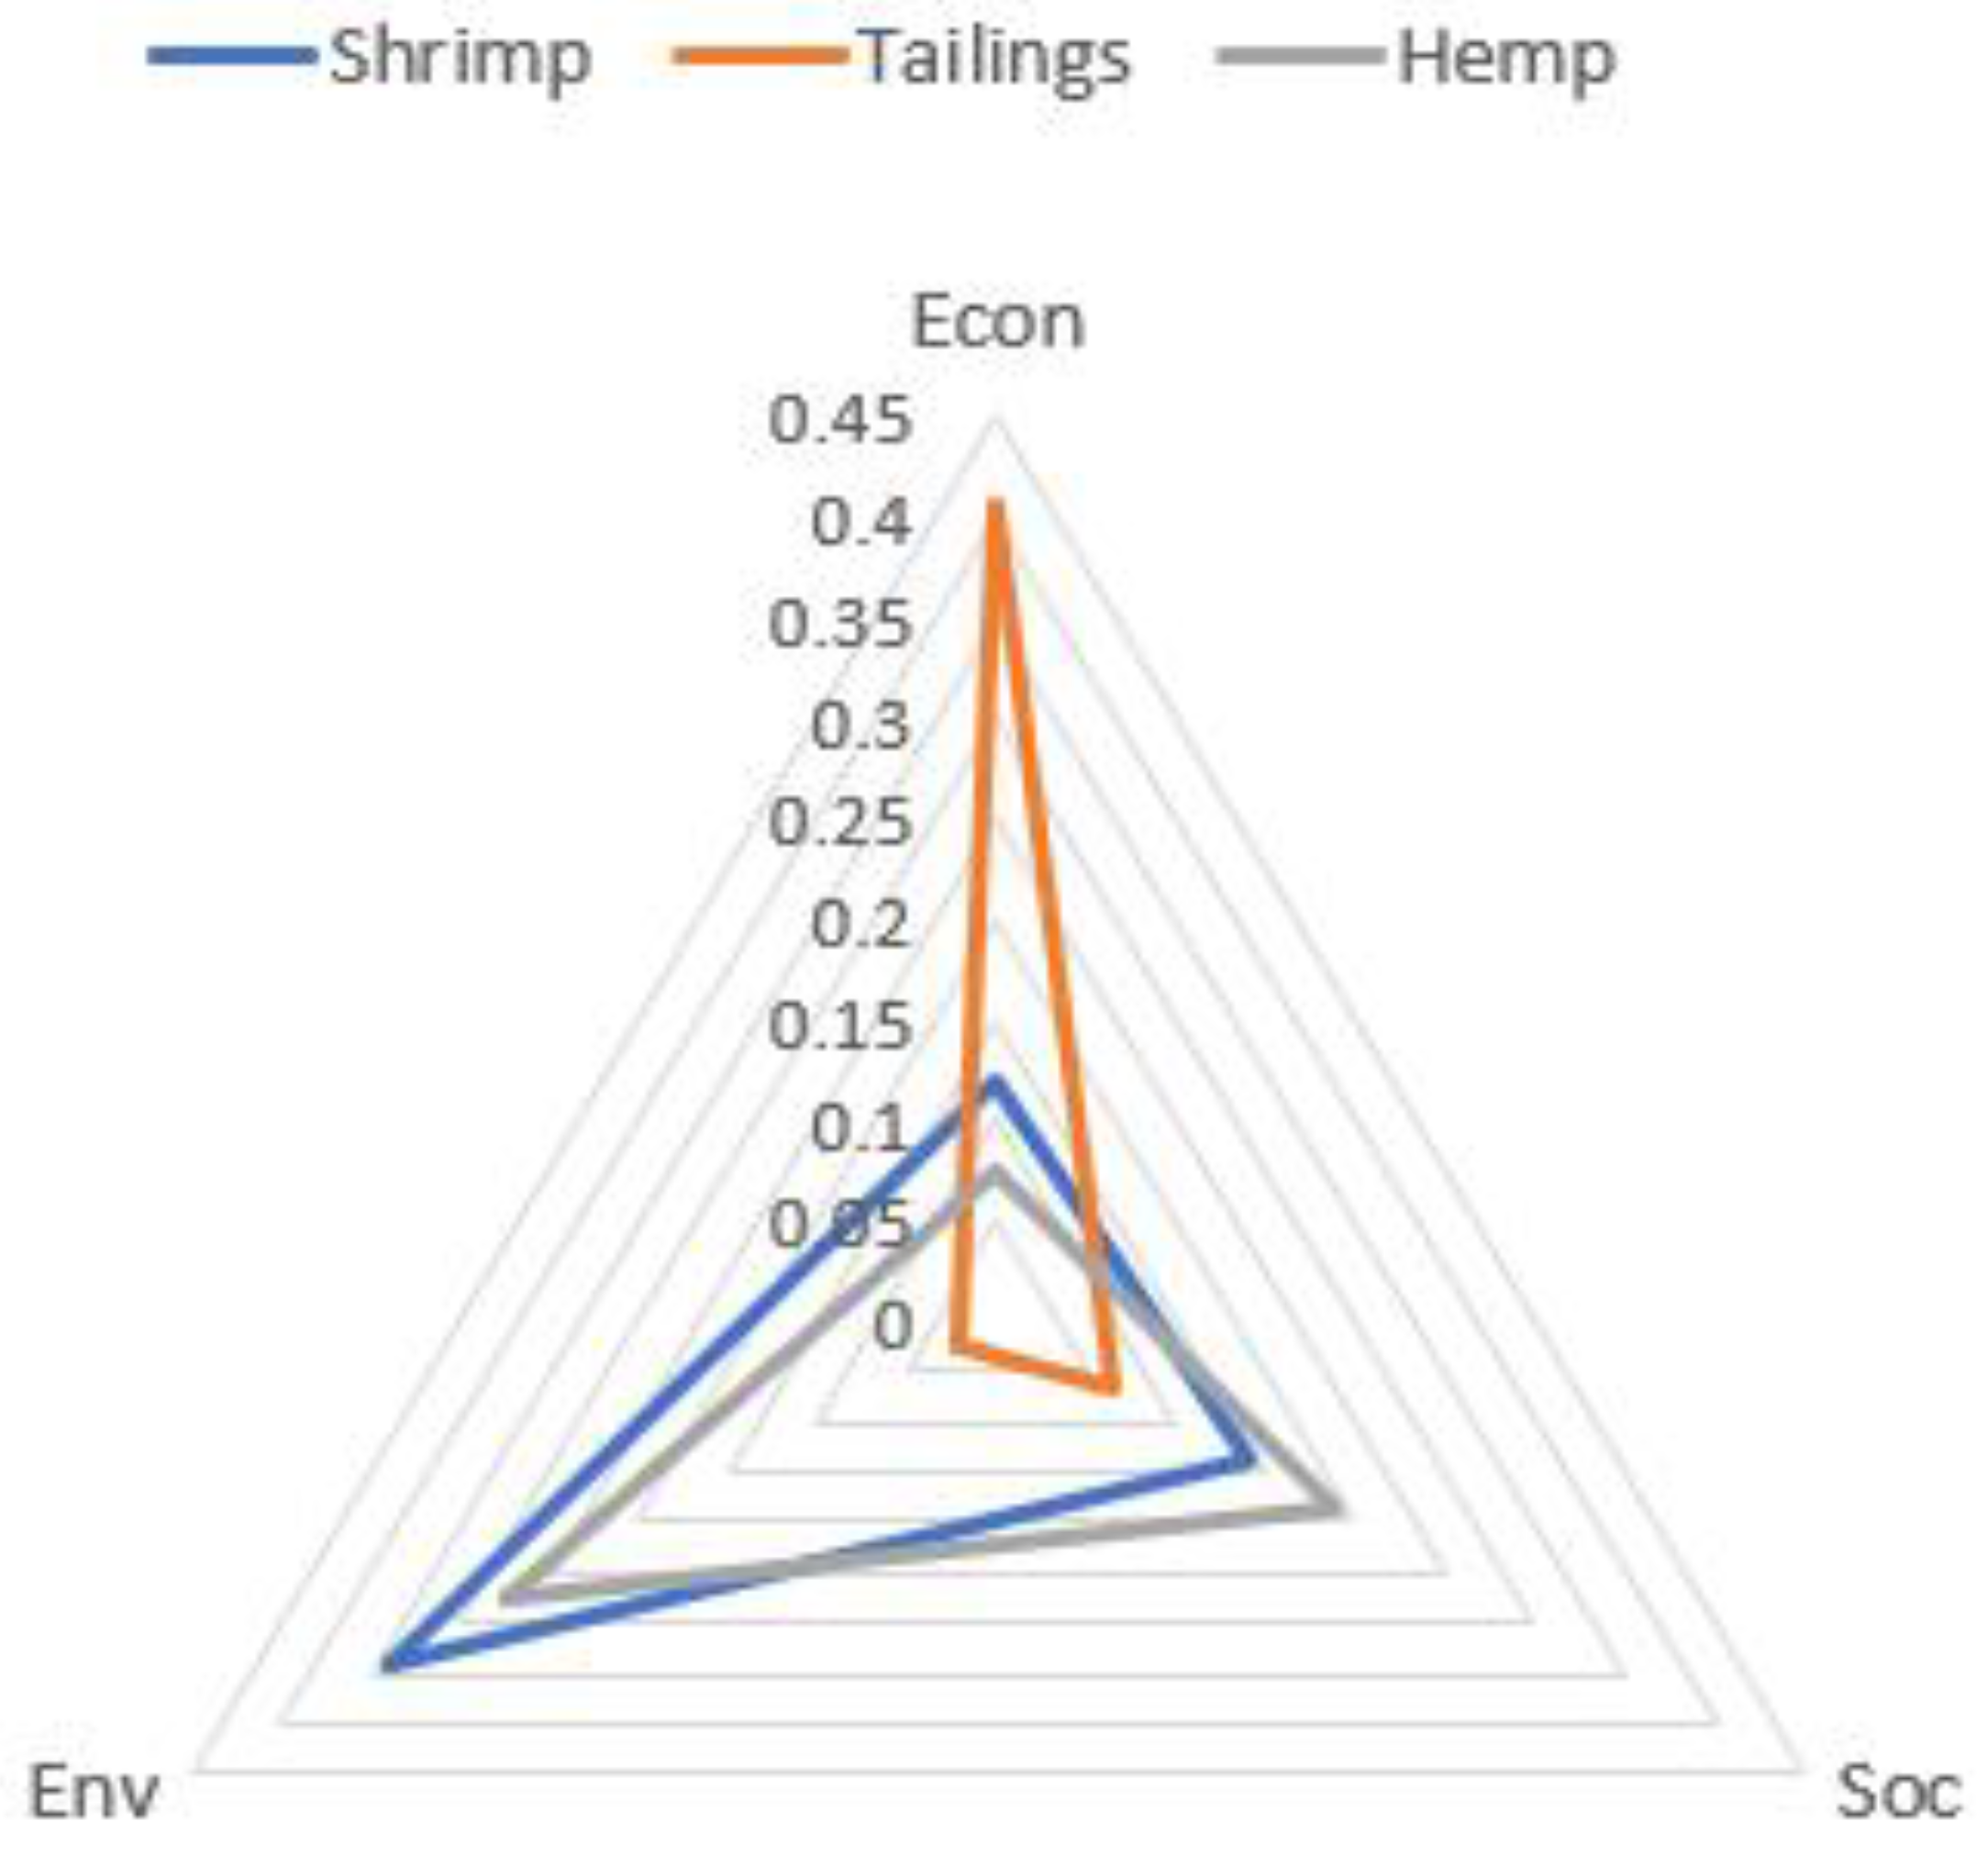
4.2. Overall Ranking of the Repurposing Alternatives

The combined decision of all stakeholders showed that shrimp provided the highest utility in terms of sustainable repurposing followed by hemp and then tailings (Figure 15). However, each repurposing alternative had different strengths and weaknesses. For example, tailings was particularly strong in terms of economic utility, but weak in environmental and social utility (Figure 16). Additionally, both shrimp and hemp were strongest in environmental utility and less so in social and economic utility. Interestingly, a different repurposing scenario was the strongest alternative for each dimension. Shrimp would provide the highest environmental utility, tailings would provide the highest economic utility, and hemp would provide the highest social utility among all scenarios.

Different Rankings for Different Stakeholder Groups

As a result of the different weights assigned to the sub-goals, criteria, and attributes by different stakeholder groups, the ranking of repurposing alternatives also varied for each stakeholder group (Figure 17). The rankings of community members, the mining company, local non-profits, and faculty members were in line with each other and with the combined decision of all stakeholders ranking shrimp first, hemp second, and tailings third. Industry advisors and local governments ranked tailings first, hemp second, and shrimp third, and government agencies ranked tailings first, shrimp second, and hemp third.
Ranking of the alternatives changed depending on the analysis of the decision makers’ preferences and values. Even though some stakeholder groups shared the same ranking, the utility scores of the alternatives differed based on the importance given to certain sustainability aspects. Industry advisors and government bodies all ranked tailings first, which may have been expected considering they all prioritized the economic aspects, whereas one may not have expected the mining company to prioritize environmental aspects more and that shrimp and hemp would be their top two choices. These data point to the complicated task of determining what sustainability means to different people. It raises important questions, such as how to reconcile different perceptions of sustainability and how to create what is often referred to as “shared value” for productive and sustainable post-mining land use [5,8,10,14,21,27,30,31]. The results also show the impact and importance of soliciting feedback from a variety of groups and actors within those groups.

4.3. Sensitivity of the Results

4.3.1. Sensitivity to the Weights

Figure 18 summarizes a sample of the sensitivity analysis that demonstrates the effect of changing the weights assigned to the economic, environmental, and social sub-goals at Level 2 (refer to the goals hierarchy—Figure 4). The results suggested that shrimp’s score was sensitive to the changes in the weights of economic and environmental aspects of sustainability repurposing but was more robust to the changes in the weight of social aspects. The hemp and tailings scores were sensitive to the changes in the weights assigned to all sub-goals.
The results indicated that decreasing the weight assigned to the economic sub-goal would not change the rank ordering of alternatives. Increasing the weight on the economic sub-goal by 5% (i.e., increasing it to 0.452 from 0.430) would also not change the ranking. However, increasing it by 10% would make tailings the second- and hemp the third-ranked alternatives. Increasing the weight by 15% would make tailings the second and hemp the third. Finally, increasing the weight by 20% (0.516) would make tailings the first, shrimp the second, and hemp the third, and the rank ordering would not change beyond this point.
Increasing the weight allocated to the environmental sub-goal would not change the ranking. Decreasing it by 5% (i.e., decreasing it to 0.323) or by 10% would also not change the ranking. However, decreasing it by 15% would make tailings the second and hemp the third, and decreasing by 20% (0.272) would maintain this rank ordering. Finally, decreasing its weight by 25% (0.255) would make tailings the first, shrimp the second, and hemp the third, and the rank ordering would not change unless the weight allocated to the environmental sub-goal drops to 0.0425, which is highly unlikely.
Increasing the weight allocated to the social sub-goal would not change the ranking unless it is increased by 74% (i.e., increasing it to 0.400 from 0.230), which would make hemp the first and shrimp the second. Decreasing its weight would also not change the ranking unless it is decreased by 30% (i.e., decreasing it to 0.159), which would make tailings the second and hemp the third, and the rank ordering would not change beyond this point.
Overall, these results show that the ranking of repurposing alternatives was the most sensitive to the changes in the importance attached to the economic aspects while it was much more robust to the changes in the weight of social aspects of sustainable repurposing. Additionally, shrimp had the most robust ranking while the rankings of hemp and tailings were more prone to changing. The sensitivity analysis could also be performed for the lower levels of the goals hierarchy, but since the changes in ranking were not dramatic at Level 2, we did not analyze the lower levels.

4.3.2. Sensitivity to the Stakeholder Groups’ Composition

We conducted two different “what-if scenarios” to understand the impacts of the smaller sample size of individuals within each stakeholder group on the final group decision, as well as the smaller number of stakeholder groups compared. The results showed how robust the scores and rankings of alternatives were to the changes in our respondent sample. For the first scenario, we identified two faculty members, two industry advisors, two government agencies, two mining company representatives, two local non-profits, four community members, and three local government members as the outliers, whose perspectives diverged from other group members. We removed these outliers and calculated the utility score, the mean, and the range (i.e., how much the utility score varied) for each alternative (Table 3). The original ranking obtained for the combined group decision did not change for any of the simulations, although shrimp’s utility score varied the most, while hemp’s score varied the least.
The results for removing one respondent at a time (Table 4) and removing one stakeholder group at a time (Table 5) showed that the original ranking obtained for the combined group decision remained for all 48 simulations. However, the removal of particular stakeholder groups showed some rather predictable patterns. For example, the removal of industry advisors, government agencies, and local governments increased shrimp’s utility score the most, and decreased tailings’ score the most (Table 5). This was consistent with the preference ranking of these two groups. Similarly, the removal of faculty members and local non-profits decreased shrimp’s score the most, as they were the two groups that assigned the highest scores to shrimp. The removal of local governments changed the scores the most, which might suggest that they were the group whose views differed the most from the combined group decision. On the other hand, the removal of community members changed the scores the least, which reinforces this group’s heterogeneity and best reflects the combined group decision. This suggests that larger numbers of community members must be more engaged in decision making about post mining land uses [118,123,124].
The fact that the rankings of the different alternatives did not change with any of the simulations shows that this sustainability assessment was relatively robust with this group of people. Although hemp had the most robust utility score according to the what-if scenarios and shrimp had the least, shrimp always ranked first, showing its strength in terms of stakeholder perspectives on sustainability. The results also demonstrate that the challenge itself produced some innovative repurposing ideas that could contribute to sustainable development.
In general, MCDM and MADA have been criticized for being subjective in terms of their implementation, and being prone to manipulation, as they are dependent on the judgments of decision makers [125,126,127,128]. On the other hand, the proponents of MCDM claim that it provides a systematic, transparent approach that improves objectivity and generates reproducible results [125,128,129]. Although MADA might be subjective in terms of how it is implemented, our analyses attempted to eliminate subjectivity by systematically selecting the indicator set, including sufficient representation from each stakeholder group in our sample, and conducting the sensitivity analysis. A strong post mining land use alternative should always rank first regardless of the responder combination, which happened with shrimp in this case.

5. Conclusions

We provided and utilized a decision support method to evaluate the sustainability of three different repurposing scenarios for the tailings dam area of a mine that is approaching closure. We evaluated how different repurposing scenarios can contribute to sustainable development, identified the strengths and weaknesses of each scenario, and determined which scenario better reflected the preferences of stakeholders and would result in the most economically, environmentally, and socially sustainable outcomes. Through the application of our method, we also provided potentially useful information for the decision-making process, such as different stakeholder perceptions of aspects of sustainability, as well as areas of agreement and disagreement. For example, stakeholder perspectives were more closely aligned for social aspects on a high level (at Level 2), but this alignment shifted to environmental (Level 3) and economic aspects (Level 4) for more detailed issues. Additionally, we found that the repurposing phase of the mining life cycle was not considered as much as other phases in the literature for developing sustainability indicators because only a small set of indicators were relevant and could be selected for this study out of our large sustainability indicator set. This is in line with the findings of Pimentel et al. (2016), and it shows how sustainability indicators generally have not considered closure and post-closure impacts in forward-looking projections [43].
Our results show that stakeholders have different ideas about what constitutes sustainable development and different views may arise even within the same stakeholder group. Hence, ranking of the alternatives change depending on the decision maker’s preferences and values. At this point and time and with our sample size, shrimp was ranked as the first in the actual survey results, as well as in every simulation we ran. This shows our assessment’s robustness with this group of people and shows shrimp’s strength in terms of supporting sustainability. The results reflect the “consensus” of stakeholders, and they point to which repurposing alternative better addresses the stakeholders’ values and needs [34]. We recognize that our study reached a limited number of respondents, and if this were to be a real-life exercise, achieving a larger sample size would be beneficial for a more thorough sustainability assessment. The more responses are collected, the more accurate and representative will be the assessment of the general public’s view. In selecting the sample of respondents, considering the variability of views within stakeholder groups would be beneficial to ensure more involvement of stakeholder groups with higher variability.
Ernst & Young recently named “environmental and social” as the number one business risk for the mining industry, specifically pointing to the need to progressively plan for mine closure to respond to intensifying stakeholder pressure [130]. We believe that efforts to achieve more responsible and sustainable mine closure and repurposing could help address these risks and increase mining’s contributions to the Sustainable Development Goals (SDGs) beyond the life-of-mine. For instance, to avoid the negative impacts of the boom-and-bust cycle on mining communities, mining companies could support non-mining livelihood opportunities and microfinance initiatives, which might help mining contribute to SDG 1 (no poverty) [131]. Considering and assessing post-closure land use or repurposing alternatives in closure planning, by involving stakeholders in decision making, might serve mining better in contributing to SDG 11 (sustainable cities and communities). Transparent and representative closure planning that involves the discussion of repurposing alternatives and responds to stakeholder concerns might also lead to good community relations and prevent potential company–community conflicts, strengthening mining’s contribution to SDG 16 (peace, justice, and strong institutions) [132].
The mining industry has been criticized for being slower than other sectors in incorporating innovation in their operations and practices [4,24,133], and this constitutes an important business risk for the mining industry [24]. Our results demonstrated that out of the three winners of the student challenge, shrimp farming provided the most sustainable and innovative repurposing.
We showed that with adequate representation from a variety of stakeholders, a robust assessment, and innovative repurposing alternatives, it is possible to identify projects that meet the most important stakeholder concerns and expectations while also providing the most sustainable outcomes. We conclude that responsible and sustainable mine closure and repurposing should be unique to settings and needs of various stakeholders, incorporate stakeholder preferences, and adopt a holistic approach that addresses environmental, social, and economic issues.

Author Contributions

Conceptualization, C.P.D., N.M.S. and S.D.; methodology, C.P.D., N.M.S. and S.D.; formal analysis, C.P.D.; investigation, C.P.D.; data curation, C.P.D.; writing—original draft preparation, C.P.D.; writing—review and editing, N.M.S. and S.D.; visualization, C.P.D.; supervision, N.M.S. and S.D. All authors have read and agreed to the published version of the manuscript.

Funding

This research received no external funding.

Institutional Review Board Statement

The study was approved (exempt) by the Institutional Review Board of Colorado School of Mines (date of exemption approval: 20 November 2017).

Informed Consent Statement

Informed consent was obtained from all subjects involved in the study.

Data Availability Statement

The data presented in this study are available on request from the corresponding author.

Acknowledgments

The authors acknowledge the contributions of survey participants in this study.

Conflicts of Interest

The authors declare no conflict of interest.

Appendix A

Table A1. Survey Questions.
QUESTIONSANSWER CHOICES
Demographic Information
What is your age?Under 18
18–24
25–34
35–44
45–55
Over 55
Prefer not to answer
To which gender identity do you most identify?Female
Male
Transgender Female
Transgender Male
Gender Variant/Non-conforming
Not listed [with a space if they want to specify]
Prefer not to answer
What is the highest degree or level of school that you have completed? (If you are currently enrolled in school, please indicate the highest degree you have received)Less than a high school diploma
High school diploma or equivalent
Bachelor’s degree (e.g., BA, BS)
Master’s degree (e.g., MA, MS, MEd)
Doctorate (e.g., PhD, EdD)
Other (please specify)
Prefer not to answer
Which stakeholder group do you identify with the most?Local community member
Faculty member
Industry advisor for the challenge
Government agency
Non-governmental organization
Other (please specify)
Prefer not to answer
ECONOMIC—Financial Contributions and Economic Performance
Q1.
Option A: The new facility’s income tax payments
Option B: New facility’s investments in public services for the community (e.g., road maintenance, housing assistance)
Q2.
Option A: The time it will take for the new facility to reach its maximum production amount
Option B: The maximum number of products that the new facility can produce
Q3.
Option A: The time it will take for the new facility to reach its maximum production amount
Option B: The amount of money the new facility makes from the sales of their goods and services
Q4.
Option A: The maximum number of products that the new facility can produce
Option B: The amount of money the new facility makes from the sales of their goods and services
Q5.
Option A: Contributions to Society (i.e., taxes and public services)
Option B: Economic Performance
(The answers below apply to all remaining questions)
Preference Direction (Dropdown menu):
A is more important than B
B is more important than A
Both are EQUALLY important
Prefer not to answer
Intensity of Importance (Dropdown menu):
SLIGHTLY more important
MODERATELY more important
STRONGLY more important
EXTREMELY more important
Does not apply
Prefer not to answer
SOCIAL—Community Impacts and Employment
Q6.
Option A: Nuisances (e.g., odor) or hazards (e.g., fire) that may arise from the new facility and could impact the nearby communities
Option B: The potential traffic volume around the project site
Q7.
Option A: Annual salary offered for employees by the new facility
Option B: Number of employees that can work in the new facility
Q8.
Option A: Annual salary offered for employees by the new facility
Option B: Number of different job types offered by the new facility
Q9.
Option A: Number of employees that can work in the new facility
Option B: Number of different job types offered by the new facility
Q10.
Option A: Negative community impacts (i.e., nuisances, hazards)
Option B: Employment
(Same as above)
ENVIRONMENT—Waste, Emissions, Resource Consumption, and Land Use
Q11.
Option A: The new facility’s energy use
Option B: The amount of energy that the new facility obtains from renewable energy resources such as solar roof panels
Q12.
Option A: The new facility’s energy use
Option B: The amount of recycled materials used by the new facility to produce their products
Q13.
Option A: The amount of energy that the new facility obtains from renewable energy resources such as solar roof panels
Option B: The amount of recycled materials used by the new facility to produce their products
Q14.
Option A: The amount of unremoved mine waste remaining in the new project area after 15 years
Option B: The amount of waste to be produced by the new facility
Q15.
Option A: Air Pollution (The amount of gases released to the air by the new facility)
Option B: Total land area used by the new facility
Q16.
Option A: Air Pollution (The amount of gases released to the air by the new facility)
Option B: Resource Consumption
Q17.
Option A: Air Pollution (The amount of gases released to the air by the new facility)
Option B: Amount of waste produced by the new facility
Q18.
Option A: Total land area used by the new facility
Option B: Resource Consumption
Q19.
Option A: Total land area used by the new facility
Option B: Amount of waste produced by the new facility
Q20.
Option A: Resource Consumption
Option B: Amount of waste produced by the new facility
(Same as above)
General Aspects of Sustainability (Sub-goals)
Q21.
Option A: Economic Aspects
Option B: Environmental Aspects
Q22.
Option A: Economic Aspects
Option B: Social Aspects
Q23.
Option A: Environmental Aspects
Option B: Social Aspects
(Same as above)

References

  1. Muller, S.; Lai, F.; Beylot, A.; Boitier, B.; Villeneuve, J. No Mining Activities, No Environmental Impacts? Assessing the Carbon Footprint of Metal Requirements Induced by the Consumption of a Country with Almost No Mines. Sustain. Prod. Consum. 2020, 22, 24–33. [Google Scholar] [CrossRef] [Green Version]
  2. Hilson, G. An Overview of Land Use Conflicts in Mining Communities. Land Use Policy 2002, 19, 65–73. [Google Scholar] [CrossRef]
  3. Boerchers, M.; Sinclair, A.J.; Gibson, R.B.; Halden, N.M. “Sustainability Is Finding the next Mine”: The Complicated Relationships among Legacies, Sustainability, and EA. Environ. Impact Assess. Rev. 2018, 71, 84–93. [Google Scholar] [CrossRef]
  4. Marimuthu, R.; Sankaranarayanan, B.; Ali, S.M.; de Sousa Jabbour, A.B.L.; Karuppiah, K. Assessment of Key Socio-Economic and Environmental Challenges in the Mining Industry: Implications for Resource Policies in Emerging Economies. Sustain. Prod. Consum. 2021, 27, 814–830. [Google Scholar] [CrossRef]
  5. Monosky, M.; Keeling, A. Planning for Social and Community-Engaged Closure: A Comparison of Mine Closure Plans from Canada’s Territorial and Provincial North. J. Environ. Manag. 2021, 277, 111324. [Google Scholar] [CrossRef]
  6. Bainton, N.; Holcombe, S. A Critical Review of the Social Aspects of Mine Closure. Resour. Policy 2018, 59, 468–478. [Google Scholar] [CrossRef]
  7. Erzurumlu, S.S.; Erzurumlu, Y.O. Sustainable Mining Development with Community Using Design Thinking and Multi-Criteria Decision Analysis. Resour. Policy 2015, 46, 6–14. [Google Scholar] [CrossRef]
  8. International Institute for Environment and Development (IIED). Minerals and Sustainable Development Mining for the Future Appendix B: Mine Closure Working Paper; WBCSD: Geneva, Switzerland, 2002; Available online: https://pubs.iied.org/sites/default/files/pdfs/migrate/G00884.pdf (accessed on 3 July 2022).
  9. Holcombe, S.; Keenan, J. Mining as a Temporary Land Use Scoping Project: Transitions and Repurposing; The University of Queensland: Brisbane, Australia, 2020. [Google Scholar]
  10. International Council on Mining and Metals (ICMM). Integrated Mine Closure, Good Practice Guide, 2nd ed.; International Council on Mining and Metals: London, UK, 2019. [Google Scholar]
  11. Keenan, J.; Holcombe, S. Mining as a Temporary Land Use: A Global Stocktake of Post-Mining Transitions and Repurposing. Extr. Ind. Soc. 2021, 8, 100924. [Google Scholar] [CrossRef]
  12. Stacey, J.; Naude, A.; Hermanus, M.; Frankel, P. The Socio-Economic Aspects of Mine Closure and Sustainable Development: Literature Overview and Lessons for the Socio-Economic Aspects of Closure—Report 1. J. S. Afr. Inst. Min. Metall. 2010, 110, 379–394. [Google Scholar]
  13. Yaylacı, E.D.; Düzgün, H.Ş. Evaluating the Mine Plan Alternatives with Respect to Bottom-up and Top-down Sustainability Criteria. J. Clean. Prod. 2017, 167, 837–849. [Google Scholar] [CrossRef]
  14. Finucane, S. Thinking about the End before You Start—Integrating Mine Closure Planning into Feasibility Studies and Environmental and Social Impact Assessment. In Proceedings of the Third International Seminar on Mine Closure; Australian Centre for Geomechanics: Perth, Australia, 2008; pp. 171–182. [Google Scholar]
  15. Hattingh, R.; Williams, D.J.; Corder, G. Applying a Regional Land Use Approach to Mine Closure: Opportunities for Restoring and Regenerating Mine-Disturbed Regional Landscapes. In Proceedings of the International Conference on Mine Closure, Perth, Australia, 3–5 September 2019; Australian Centre for Geomechanics: Perth, Australia, 2019; Volume One, pp. 951–967. [Google Scholar]
  16. Lamb, K.; Coakes, S. Effective Social Planning for Mine Closure. In Proceedings of the Mine Closure 2012: Seventh International Conference on Mine Closure, Brisbane, Australia, 25–27 September 2012; pp. 627–639. [Google Scholar] [CrossRef] [Green Version]
  17. McCullough, C. Key Mine Closure Lessons Still to Be Learned. In Proceedings of the 11th International Conference on Mine Closure, Perth, Australia, 15–17 March 2016; Australian Centre for Geomechanics: Perth, Australia, 2016; pp. 325–338. [Google Scholar]
  18. McAllister, M.L.; Fitzpatrick, P.; Fonseca, A. Challenges of Space and Place for Corporate ‘Citizens’ and Healthy Mining Communities: The Case of Logan Lake, BC and Highland Valley Copper. Extr. Ind. Soc. 2014, 1, 312–320. [Google Scholar] [CrossRef] [Green Version]
  19. Colorado Division of Reclamation, Mining and Safety. Rules and Regulations. Available online: https://drms.colorado.gov/rules-and-regulations (accessed on 3 July 2022).
  20. Colorado Division of Reclamation, Mining and Safety. Reclamation Colorado. Available online: https://reclamation.colorado.gov/mine-life/reclamation (accessed on 3 July 2022).
  21. Australian and New Zealand Marketing Academy (ANZMEC); Minerals Council of Australia (MCA). Strategic Framework for Mine Closure; Australian and New Zealand Minerals and Energy Council: Perth, Australia, 2000. [Google Scholar]
  22. Government of Western Australia. Guidelines for Preparing Mine Closure Plans; Government of Western Australia: Perth, Australia, 2015. [Google Scholar]
  23. International Institute for Environment and Development (IIED); World Business Council for Sustainable Development (WBCSD). Research on Mine Closure Policy; Mining, Minerals and Sustainable Development: London, UK, 2002. [Google Scholar]
  24. Perdeli Demirkan, C.; Smith, N.M.; Duzgun, H.S.; Waclawski, A. A Data-Driven Approach to Evaluation of Sustainability Reporting Practices in Extractive Industries. Sustainability 2021, 13, 8716. [Google Scholar] [CrossRef]
  25. Vivoda, V.; Kemp, D.; Owen, J. Regulating the Social Aspects of Mine Closure in Three Australian States. J. Energy Nat. Resour. Law 2019, 37, 405–424. [Google Scholar] [CrossRef]
  26. Everingham, J.-A.; Mackenzie, S.; Svobodova, K.; Witt, K. Participatory Processes, Mine Closure and Social Transitions; Centre for Social Responsibility in Mining, University of Queensland: Brisbane, Australia, 2020. [Google Scholar]
  27. Limpitlaw, D. Mine Closure as a Framework for Sustainable Development. In Sustainable Development Practices on Mine Sites—Tools and Techniques; University of the Witwatersrand: Johannesburg, South Africa, 2004. [Google Scholar]
  28. Morteza, O.; Mahdi, R. Mine Design Selection Considering Sustainable Development. In Proceedings of the Mine Planning and Equipment Selection; Drebenstedt, C., Singhal, R., Eds.; Springer International Publishing: Dresden, Germany, 2014; pp. 151–163. [Google Scholar]
  29. Asr, E.T.; Kakaie, R.; Ataei, M.; Tavakoli Mohammadi, M.R. A Review of Studies on Sustainable Development in Mining Life Cycle. J. Clean. Prod. 2019, 229, 213–231. [Google Scholar] [CrossRef]
  30. Australian Government MINE CLOSURE. Leading Practice Sustainable Development Program for the Mining Industry; Australian Government: Canberra, Australia, 2016. [Google Scholar]
  31. Kabir, Z.S.; Rabbi, F.; Chowdhury, M.B.; Akbar, D. A Review of Mine Closure Planning and Practice in Canada and Australia. World Rev. Bus. Res. 2015, 5, 140–159. [Google Scholar]
  32. The Mining Association of Canada. Towards Sustainable Mining Mine Closure Framework; The Mining Association of Canada: Ottawa, ON, Canada, 2008. [Google Scholar]
  33. Clark, A.L.; Clark, J.C. VIII. An International Overview of Legal Frameworks for Mine Closure; Environmental Law Alliance Worldwide: Eugene, OR, USA, 2005. [Google Scholar]
  34. Akbar, D.; Rolfe, J.; Lechner, A.M.; Everingham, J.A.; Kinnear, S. Workshop Processes to Generate Stakeholder Consensus about Post-Mining Land Uses: An Australian Case Study. J. Environ. Plan. Manag. 2020, 64, 334–358. [Google Scholar] [CrossRef]
  35. Doley, D.; Audet, P. Adopting Novel Ecosystems as Suitable Rehabilitation Alternatives for Former Mine Sites. Ecol. Process. 2013, 2, 22. [Google Scholar] [CrossRef] [Green Version]
  36. Lechner, A.M.; McIntyre, N.; Witt, K.; Raymond, C.M.; Arnold, S.; Scott, M.; Rifkin, W. Challenges of Integrated Modelling in Mining Regions to Address Social, Environmental and Economic Impacts. Environ. Model. Softw. 2017, 93, 268–281. [Google Scholar] [CrossRef]
  37. Worrall, R.; Neil, D.; Brereton, D.; Mulligan, D. Towards a Sustainability Criteria and Indicators Framework for Legacy Mine Land. J. Clean. Prod. 2009, 17, 1426–1434. [Google Scholar] [CrossRef]
  38. Antwi, E.K.; Owusu-Banahene, W.; Boakye-Danquah, J.; Mensah, R.; Tetteh, J.D.; Nagao, M.; Takeuchi, K. Sustainability Assessment of Mine-Affected Communities in Ghana: Towards Ecosystems and Livelihood Restoration. Sustain. Sci. 2017, 12, 747–767. [Google Scholar] [CrossRef]
  39. Eshun, P.A.; Davies-Ocloo, E.A.; Amegbey, N. Multi-Criteria Decision Analysis Approach to Mine Closure Planning—A Case Study. Environ. Nat. Resour. Res. 2018, 8, 100. [Google Scholar] [CrossRef] [Green Version]
  40. Mert, Y. Contribution to Sustainable Development: Re-Development of Post-Mining Brownfields. J. Clean. Prod. 2019, 240, 118212. [Google Scholar] [CrossRef]
  41. Nell, T. Community Perceptions of Sustainable Development: Implications for an Approach to Closure Mining. Ph.D. Thesis, North-West University, Potchefstroom, South Africa, 2015. [Google Scholar]
  42. Owen, J.R.; Kemp, D. Social Licence and Mining: A Critical Perspective. Resour. Policy 2013, 38, 29–35. [Google Scholar] [CrossRef]
  43. Pimentel, B.S.; Gonzalez, E.S.; Barbosa, G.N.O. Decision-Support Models for Sustainable Mining Networks: Fundamentals and Challenges. J. Clean. Prod. 2016, 112, 2145–2157. [Google Scholar] [CrossRef]
  44. Rixen, A.; Blangy, S. Life after Meadowbank: Exploring Gold Mine Closure Scenarios with the Residents of Qamini’tuaq (Baker Lake), Nunavut. Extr. Ind. Soc. 2016, 3, 297–312. [Google Scholar] [CrossRef]
  45. Morrison-Saunders, A.; Pope, J.; Bond, A.; Retief, F. Towards Sustainability Assessment Follow-Up. Environ. Impact Assess. Rev. 2014, 45, 38–45. [Google Scholar] [CrossRef] [Green Version]
  46. Yaylaci, E.D. A Sustainability Assessment Framework for Evaluation of Coal Mining Sector Plans in Afşin-Elbistan Coal Basin with a Special Emphasis on Land Disturbance. Ph.D. Thesis, Middle East Tecnhical University, Ankara, Turkey, 2015. [Google Scholar]
  47. Parmar, B.L.; Freeman, R.E.; Harrison, J.S.; Wicks, A.C.; Purnell, L.; de Colle, S. Stakeholder Theory: The State of the Art. Acad. Manag. Ann. 2010, 4, 403–445. [Google Scholar] [CrossRef]
  48. International Atomic Energy Agency (IAEA). Management of Long Term Radiological Liabilities: Stewardship Challenges; International Atomic Energy Agency: Vienna, Austria, 2006. [Google Scholar]
  49. Falck, W.E.; Spangenberg, J.H. Selection of Social Demand-Based Indicators: EO-Based Indicators for Mining. J. Clean. Prod. 2014, 84, 193–203. [Google Scholar] [CrossRef]
  50. What Are the Principles for Responsible Investment? PRI Web Page PRI. Available online: https://www.unpri.org/about-us/what-are-the-principles-for-responsible-investment (accessed on 4 July 2022).
  51. Home—Sustainalytics. Available online: https://www.sustainalytics.com/ (accessed on 4 July 2022).
  52. McHaina, D.M. Environmental Planning Considerations for the Decommissioning, Closure and Reclamation of a Mine Site. Int. J. Surf. Min. Reclam. Environ. 2001, 15, 163–176. [Google Scholar] [CrossRef]
  53. Cooke, J.A.; Johnson, M.S. Ecological Restoration of Land with Particular Reference to the Mining of Metals and Industrial Minerals: A Review of Theory and Practice. Environ. Rev. 2002, 10, 41–71. [Google Scholar] [CrossRef] [Green Version]
  54. Lei, K.; Pan, H.; Lin, C. A Landscape Approach towards Ecological Restoration and Sustainable Development of Mining Areas. Ecol. Eng. 2016, 90, 320–325. [Google Scholar] [CrossRef]
  55. Srivastava, N.K.; Ram, L.C.; Masto, R.E. Reclamation of Overburden and Lowland in Coal Mining Area with Fly Ash and Selective Plantation: A Sustainable Ecological Approach. Ecol. Eng. 2014, 71, 479–489. [Google Scholar] [CrossRef]
  56. Bielecka, M.; Król-Korczak, J. Hybrid Expert System Aiding Design of Post-Mining Regions Restoration. Ecol. Eng. 2010, 36, 1232–1241. [Google Scholar] [CrossRef]
  57. Smith, C.M.S.; Bowie, M.H.; Hahner, J.L.; Boyer, S.; Kim, Y.N.; Zhong, H.T.; Abbott, M.; Rhodes, S.; Sharp, D.; Dickinson, N. Punakaiki Coastal Restoration Project: A Case Study for a Consultative and Multidisciplinary Approach in Selecting Indicators of Restoration Success for a Sand Mining Closure Site, West Coast, New Zealand. CATENA 2016, 136, 91–103. [Google Scholar] [CrossRef]
  58. Bascetin, A. A Decision Support System Using Analytical Hierarchy Process (AHP) for the Optimal Environmental Reclamation of an Open-Pit Mine. Environ. Geol. 2007, 52, 663–672. [Google Scholar] [CrossRef]
  59. Pavloudakis, F.; Galetakis, M.; Roumpos, C. A Spatial Decision Support System for the Optimal Environmental Reclamation of Open-Pit Coal Mines in Greece. Int. J. Min. Reclam. Environ. 2009, 23, 291–303. [Google Scholar] [CrossRef]
  60. Wang, S.D.; Liu, C.H.; Zhang, H.B. Suitability Evaluation for Land Reclamation in Mining Area: A Case Study of Gaoqiao Bauxite Mine. Trans. Nonferrous Met. Soc. China (Engl. Ed.) 2011, 21, s506–s515. [Google Scholar] [CrossRef]
  61. Cao, X. Regulating Mine Land Reclamation in Developing Countries: The Case of China. Land Use Policy 2007, 24, 472–483. [Google Scholar] [CrossRef]
  62. Mukhopadhyay, S.; Maiti, S.K.; Masto, R.E. Development of Mine Soil Quality Index (MSQI) for Evaluation of Reclamation Success: A Chronosequence Study. Ecol. Eng. 2014, 71, 10–20. [Google Scholar] [CrossRef]
  63. Wu, X.Q.; Zuo, X.Q.; Fang, Y.M. Evaluation of Reclamation Land Productivity in Mining Districts. Trans. Nonferr. Met. Soc. China 2011, 21, s717–s722. [Google Scholar] [CrossRef]
  64. Kuter, N. Reclamation of Degraded Landscapes Due to Opencast Mining. In Advances in Landscape Architecture; IntechOpen: London, UK, 2013. [Google Scholar]
  65. Neri, A.C.; Sánchez, L.E. A Procedure to Evaluate Environmental Rehabilitation in Limestone Quarries. J. Environ. Manag. 2010, 91, 2225–2237. [Google Scholar] [CrossRef]
  66. Sklenicka, P.; Prikryl, I.; Svoboda, I.; Lhota, T. Non-Productive Principles of Landscape Rehabilitation after Long-Term Opencast Mining in North-West Bohemia. J. S. Afr. Inst. Min. Metall. 2004, 104, 83–88. [Google Scholar]
  67. Vickers, H.; Gillespie, M.; Gravina, A. Assessing the Development of Rehabilitated Grasslands on Post-Mined Landforms in North West Queensland, Australia. Agric. Ecosyst. Environ. 2012, 163, 72–84. [Google Scholar] [CrossRef]
  68. Unger, C.J.; Lechner, A.M.; Kenway, J.; Glenn, V.; Walton, A. A Jurisdictional Maturity Model for Risk Management, Accountability and Continual Improvement of Abandoned Mine Remediation Programs. Resour. Policy 2015, 43, 1–10. [Google Scholar] [CrossRef]
  69. Amirshenava, S.; Osanloo, M. Mine Closure Risk Management: An Integration of 3D Risk Model and MCDM Techniques. J. Clean. Prod. 2018, 184, 389–401. [Google Scholar] [CrossRef]
  70. Krzemień, A.; Suárez Sánchez, A.; Riesgo Fernández, P.; Zimmermann, K.; González Coto, F. Towards Sustainability in Underground Coal Mine Closure Contexts: A Methodology Proposal for Environmental Risk Management. J. Clean. Prod. 2016, 139, 1044–1056. [Google Scholar] [CrossRef] [Green Version]
  71. Laurence, D. Establishing a Sustainable Mining Operation: An Overview. J. Clean. Prod. 2011, 19, 278–284. [Google Scholar] [CrossRef]
  72. Laurence, D. Optimisation of the Mine Closure Process. J. Clean. Prod. 2006, 14, 285–298. [Google Scholar] [CrossRef]
  73. Hutchison, I.; Dettore, R. Statistical and Probabilistic Closure Cost Estimating. In Proceedings of the Tailings and Mine Waste 2011, Vancouver, BC, Canada, 6–9 November 2011. [Google Scholar]
  74. Paricheh, M.; Osanloo, M. A Simulation-Based Framework for Estimating Probable Open-Pit Mine Closure Time and Cost. J. Clean. Prod. 2017, 167, 337–345. [Google Scholar] [CrossRef]
  75. Cao, X. Policy and Regulatory Responses to Coalmine Closure and Coal Resources Consolidation for Sustainability in Shanxi, China. J. Clean. Prod. 2017, 145, 199–208. [Google Scholar] [CrossRef]
  76. Srikanth, R.; Nathan, H.S.K. Towards Sustainable Development: Planning Surface Coal Mine Closures in India. J. Acad. Soc. Sci. 2017, 13, 30–43. [Google Scholar] [CrossRef]
  77. Odell, C.J.; Scoble, M.; Bullard, J.R. Improving Socio-Environmental Outcomes at Andean Mines. Int. J. Min. Reclam. Environ. 2011, 25, 133–151. [Google Scholar] [CrossRef]
  78. Mihai, A.; Marincea, A.; Ekenberg, L. A MCDM Analysis of the Roşia Montană Gold Mining Project. Sustainability 2015, 7, 7261–7288. [Google Scholar] [CrossRef] [Green Version]
  79. Esteves, A.M. Evaluating Community Investments in the Mining Sector Using Multi-Criteria Decision Analysis to Integrate SIA with Business Planning. Environ. Impact Assess. Rev. 2008, 28, 338–348. [Google Scholar] [CrossRef]
  80. Straka, M.; Bindzár, P.; Kaduková, A. Utilization of the Multicriteria Decision-Making Methods for the Needs of Mining Industry. Acta Montan. Slovaca Ročník 2014, 19, 199–206. [Google Scholar]
  81. Gelvez, J.I.R.; Aldana, F.A.C. Mining Method Selection Methodology by Multiple Criteria Decision Analysis—Case Study in Colombian Coal Mining. Int. J. Anal. Hierarchy Process 2014, 1–5. [Google Scholar] [CrossRef]
  82. Gupta, S.; Kumar, U. An Analytical Hierarchy Process (AHP)-Guided Decision Model for Underground Mining Method Selection. Int. J. Min. Reclam. Environ. 2012, 26, 324–336. [Google Scholar] [CrossRef]
  83. Bascetin, A. Technical Note: An Application of the Analytic Hierarchy Process in Equipment Selection at Orhaneli Open Pit Coal Mine. Min. Technol. 2013, 113, 192–199. [Google Scholar] [CrossRef]
  84. Bascetin, A.; Oztas, O.; Kanli, A.I. EQS: A Computer Software Using Fuzzy Logic for Equipment Selection in Mining. J. S. Afr. Inst. Min. Metall. 2006, 106, 63–70. [Google Scholar]
  85. Kursunoglu, N.; Onder, M. Selection of an Appropriate Fan for an Underground Coal Mine Using the Analytic Hierarchy Process. Tunn. Undergr. Space Technol. 2015, 48, 101–109. [Google Scholar] [CrossRef]
  86. Bangian, A.H.; Ataei, M.; Sayadi, A.; Gholinejad, A. Optimizing Post-Mining Land Use for Pit Area in Open-Pit Mining Using Fuzzy Decision Making Method. Int. J. Environ. Sci. Technol. 2012, 9, 613–628. [Google Scholar] [CrossRef] [Green Version]
  87. Soltanmohammadi, H.; Osanloo, M.; Rezaei, B.; Aghajani Bazzazi, A. Achieving to Some Outranking Relationships between Post Mining Land Uses through Mined Land Suitability Analysis. Int. J. Environ. Sci. Technol. 2008, 5, 535–546. [Google Scholar] [CrossRef] [Green Version]
  88. Soltanmohammadi, H.; Osanloo, M.; Aghajani Bazzazi, A. An Analytical Approach with a Reliable Logic and a Ranking Policy for Post-Mining Land-Use Determination. Land Use Policy 2010, 27, 364–372. [Google Scholar] [CrossRef]
  89. Soltanmohammadi, H.; Osanloo, M.; Bazzazi, A.A. Deriving Preference Order of Post-Mining Land-Uses through MLSA Framework: Application of an Outranking Technique. Environ. Geol. 2009, 58, 877–888. [Google Scholar] [CrossRef]
  90. Masoumi, I.; Naraghi, S.; Rashidi-Nejad, F.; Masoumi, S. Application of Fuzzy Multi-Attribute Decision-Making to Select and to Rank the Post-Mining Land-Use. Environ. Earth Sci. 2014, 72, 221–231. [Google Scholar] [CrossRef]
  91. Iacovidou, E.; Voulvoulis, N. A Multi-Criteria Sustainability Assessment Framework: Development and Application in Comparing Two Food Waste Management Options Using a UK Region as a Case Study. Environ. Sci. Pollut. Res. 2018, 25, 35821–35834. [Google Scholar] [CrossRef] [Green Version]
  92. Kumar, V.; Gunasekaran, A.; Singh, K.; Papadopoulos, T.; Dubey, R. Cross Sector Comparison of Sustainability Reports of Indian Companies: A Stakeholder Perspective. Sustain. Prod. Consum. 2015, 4, 62–71. [Google Scholar] [CrossRef]
  93. Lindfors, A. Assessing Sustainability with Multi-Criteria Methods: A Methodologically Focused Literature Review. Environ. Sustain. Indic. 2021, 12, 100149. [Google Scholar] [CrossRef]
  94. Matthews, N.E.; Stamford, L.; Shapira, P. Aligning Sustainability Assessment with Responsible Research and Innovation: Towards a Framework for Constructive Sustainability Assessment. Sustain. Prod. Consum. 2019, 20, 58–73. [Google Scholar] [CrossRef]
  95. Nicoletti Junior, A.; de Oliveira, M.C.; Helleno, A.L. Sustainability Evaluation Model for Manufacturing Systems Based on the Correlation between Triple Bottom Line Dimensions and Balanced Scorecard Perspectives. J. Clean. Prod. 2018, 190, 84–93. [Google Scholar] [CrossRef]
  96. Saaty, T.L. A Scaling Method for Priorities in Hierarchical Structures. J. Math. Psychol. 1977, 15, 234–281. [Google Scholar] [CrossRef]
  97. Karunathilake, H.; Bakhtavar, E.; Chhipi-Shrestha, G.; Mian, H.R.; Hewage, K.; Sadiq, R. Decision Making for Risk Management: A Multi-Criteria Perspective. In Methods in Chemical Process Safety; Elsevier Science: Amsterdam, The Netherlands, 2020; pp. 239–287. [Google Scholar]
  98. Shanmuganathan, M.; Kajendran, K.; Sasikumar, A.N.; Mahendran, M. Faculty Multi Attribute Utility Theory—An over View. Int. J. Sci. Eng. Res. 2018, 9, 698–706. [Google Scholar]
  99. Merkhofer, M.W.; Anderson, R.G. Multiattribute Utility Analysis as a Framework for Public Participation in Siting a Hazardous Waste Management Facility. Environ. Manag. 1997, 21, 831–839. [Google Scholar] [CrossRef]
  100. Hahn, W.J.; Seaman, S.L.; Bikel, R. Making Decisions with Multiple Attributes: A Case in Sustainability Planning Making Decisions with Multiple Attributes: A Case in Sustainability Planning; Graziadio Business Report; Graziadio Business Review: Malibu, CA, USA, 2012. [Google Scholar]
  101. Narrei, S.; Osanloo, M. Post-Mining Land-Use Methods Optimum Ranking, Using Multi Attribute Decision Techniques with Regard to Sustainable Resources Management. OIDA Int. J. Sustain. Dev. 2011, 2, 65–76. [Google Scholar]
  102. Padur, K.; Purre, A.H. Optimizing Post-Mining Land-Use Decision Making in Cooperation with Stakeholders. Environ. Dev. Sustain. 2021, 24, 4875–4900. [Google Scholar] [CrossRef]
  103. Smith, G. Logical Decisions, Software version number: v8.0; Gary Smith: Fairfax, VA, USA, 1991.
  104. Pöyhönen, M.; Hamalainen, R.P. On the Convergence of Multiattribute Weighting Methods. Eur. J. Oper. Res. 2001, 129, 569–585. [Google Scholar] [CrossRef] [Green Version]
  105. Chelst, K.; Canbolat, Y.B. Value-Added Decision Making for Managers; CRC Press: Boca Raton, FL, USA, 2011. [Google Scholar]
  106. Mateo, J.R.S.C. Multi-Attribute Utility Theory. In Multi-Criteria Analysis in the Renewable Energy Industry; Springer: London, UK, 2012; ISBN 9781447123460. [Google Scholar]
  107. Gomez-Limon, J.A.; Arriaza, M.; Riesgo, L. An MCDM Analysis of Agricultural Risk Aversion. Eur. J. Oper. Res. 2003, 151, 569–585. [Google Scholar] [CrossRef]
  108. Karatas, A.; El-Rayes, K. Evaluating the Performance of Sustainable Development in Urban Neighborhoods Based on the Feedback of Multiple Stakeholders. Sustain. Cities Soc. 2014, 14, 374–382. [Google Scholar] [CrossRef]
  109. Zietsman, J.; Rilett, L.R.; Kim, S. Transportation Corridor Decision-Making with Multi-Attribute Utility Theory. Int. J. Manag. Decis. Mak. 2006, 7, 254–266. [Google Scholar] [CrossRef]
  110. Keeney, R.L. The Art of Assessing Multiattribute Utility Functions. Organ. Behav. Hum. Perform. 1977, 19, 267–310. [Google Scholar] [CrossRef]
  111. Brunelli, M. A Survey of Inconsistency Indices for Pairwise Comparisons. Int. J. Gen. Syst. 2018, 47, 751–771. [Google Scholar] [CrossRef]
  112. Forman, E.; Peniwati, K. Theory and Methodology Aggregating Individual Judgments and Priorities with the Analytic Hierarchy Process. Eur. J. Oper. Res. 1998, 108, 165–169. [Google Scholar] [CrossRef]
  113. Rao, R.V. Introduction to Multiple Attribute Decision-Making (MADM) Methods. In Decision Making in the Manufacturing Environment; Springer: London, UK, 2007; pp. 27–41. [Google Scholar]
  114. Abel, E.; Mikhailov, L.; Keane, J. Group Aggregation of Pairwise Comparisons Using Multi-Objective Optimization. Inf. Sci. 2015, 322, 257–275. [Google Scholar] [CrossRef]
  115. Ossadnik, W.; Schinke, S.; Kaspar, R.H. Group Aggregation Techniques for Analytic Hierarchy Process and Analytic Network Process: A Comparative Analysis. Group Decis. Negot. 2016, 25, 421–457. [Google Scholar] [CrossRef] [Green Version]
  116. Schmidt, K.; Babac, A.; Pauer, F.; Damm, K.; von der Schulenburg, J.M. Measuring Patients’ Priorities Using the Analytic Hierarchy Process in Comparison with Best-Worst-Scaling and Rating Cards: Methodological Aspects and Ranking Tasks. Health Econ. Rev. 2016, 6, 50. [Google Scholar] [CrossRef] [PubMed] [Green Version]
  117. Adamcsek, E. The Analytic Hierarchy Process and Its Generalizations. 2008. Available online: https://web.cs.elte.hu/blobs/diplomamunkak/alkmat/2008/adamcsek_edit.pdf (accessed on 19 December 2021).
  118. Boon, W.; Edler, J. Demand, Challenges, and Innovation. Making Sense of New Trends in Innovation Policy. Sci. Public Policy 2018, 45, 435–447. [Google Scholar] [CrossRef] [Green Version]
  119. McGaurr, L.; Lester, L. Environmental Groups Treading the Discursive Tightrope of Social License: Australian and Canadian Cases Compared. Int. J. Commun. 2017, 11, 3476–3496. [Google Scholar]
  120. Parsons, R.; Lacey, J.; Moffat, K. Maintaining Legitimacy of a Contested Practice: How the Minerals Industry Understands Its ‘Social Licence to Operate’. Resour. Policy 2014, 41, 83–90. [Google Scholar] [CrossRef]
  121. Prno, J. An Analysis of Factors Leading to the Establishment of a Social Licence to Operate in the Mining Industry. Resour. Policy 2013, 38, 577–590. [Google Scholar] [CrossRef]
  122. Prno, J.; Slocombe, D.S. A Systems-Based Conceptual Framework for Assessing the Determinants of a Social License to Operate in the Mining Industry. Environ. Manag. 2014, 53, 672–689. [Google Scholar] [CrossRef]
  123. Briassoulis, H. Sustainable Tourism and the Question of the Commons. Ann. Tour. Res. 2002, 29, 1065–1085. [Google Scholar] [CrossRef]
  124. Smith, N.C. Corporate Social Responsibility: Whether or How? SAGE J. 2003, 45, 52–76. [Google Scholar] [CrossRef]
  125. Janssen, R. On the Use of Multi-Criteria Analysis in Environmental Impact Assessment in The Netherlands. J. Multi-Criteria Decis. Anal. 2001, 10, 101–109. [Google Scholar] [CrossRef]
  126. Korucu, M.K.; Erdagi, B. A Criticism of Applications with Multi-Criteria Decision Analysis That Are Used for the Site Selection for the Disposal of Municipal Solid Wastes. Waste Manag. 2012, 32, 2315–2323. [Google Scholar] [CrossRef]
  127. Munda, G. Social Multi-Criteria Evaluation: Methodological Foundations and Operational Consequences. Eur. J. Oper. Res. 2004, 158, 662–677. [Google Scholar] [CrossRef]
  128. Zardari, N.H.; Ahmed, K.; Shirazi, S.M.; Yusop, Z. Bin Literature Review. In Weighting Methods and Their Effects on Multi-Criteria Decision Making Model Outcomes in Water Resources Management; Springer: Cham, Switzerland, 2015; pp. 7–67. [Google Scholar]
  129. Macharis, C.; Verbeke, A.; de Brucker, K. The Strategic Evaluation of New Technologies through Multicriteria Analysis: The Advisors Case. Res. Transp. Econ. 2004, 8, 443–462. [Google Scholar] [CrossRef]
  130. Mitchell, P. Top 10 Business Risks and Opportunities for Mining and Metals in 2022 EY—Global. Available online: https://www.ey.com/en_gl/mining-metals/top-10-business-risks-and-opportunities-for-mining-and-metals-in-2022 (accessed on 19 December 2021).
  131. Vivoda, V.; Kemp, D. How Do National Mining Industry Associations Compare on Sustainable Development? Extr. Ind. Soc. 2019, 6, 22–28. [Google Scholar] [CrossRef]
  132. United Nations Development Programme (UNDP). Mapping Mining to the Sustaninable Development Goals: An Atlas; United Nations Development Programme: New York, NY, USA, 2016. [Google Scholar]
  133. Ediriweera, A.; Wiewiora, A. Barriers and Enablers of Technology Adoption in the Mining Industry. Resour. Policy 2021, 73, 102188. [Google Scholar] [CrossRef]
Figure 1. The locations of the Henderson Mill and Mine. The total land footprint of the mine and mill is 5180 hectares. Source: Google Earth.
Resources 11 00066 g001
Figure 2. Research methodology flowchart.
Resources 11 00066 g002
Figure 3. Number of respondents by stakeholder group.
Resources 11 00066 g003
Figure 4. The goals hierarchy constructed for MADA.
Resources 11 00066 g004
Figure 5. Weight assigned by stakeholder group at Level 2—sustainable repurposing sub-goals.
Resources 11 00066 g005
Figure 6. Weight assigned by stakeholder group at Level 3—economic criteria.
Resources 11 00066 g006
Figure 7. Weight assigned by stakeholder group at Level 3—social criteria.
Resources 11 00066 g007
Figure 8. Weight assigned by stakeholder group at Level 3—environmental criteria.
Resources 11 00066 g008
Figure 9. Weight assigned by stakeholder group at Level 4—attributes: contribution to society.
Resources 11 00066 g009
Figure 10. Weight assigned by stakeholder group at Level 4—attributes: economic performance.
Resources 11 00066 g010
Figure 11. Weight assigned by stakeholder group at Level 4—attributes: community impacts.
Resources 11 00066 g011
Figure 12. Weight assigned by stakeholder group at Level 4—attributes: employment.
Resources 11 00066 g012
Figure 13. Weight assigned by stakeholder group at Level 4—attributes: resource consumption.
Resources 11 00066 g013
Figure 14. Weight assigned by stakeholder group at Level 4—attributes: waste.
Resources 11 00066 g014
Figure 15. The overall ranking result reflecting the combined decision of all stakeholders.
Resources 11 00066 g015
Figure 16. Utility scores of repurposing alternatives for economic, social, and environmental aspects.
Resources 11 00066 g016
Figure 17. Ranking of repurposing scenarios by stakeholder groups.
Resources 11 00066 g017aResources 11 00066 g017b
Figure 18. Sample sensitivity analysis results that show the effects of changes in weights assigned to sub-goals (figures adapted from Logical Decisions software, v8.0, Gary Smith, Fairfax, VA, USA).
Resources 11 00066 g018aResources 11 00066 g018b
Table 1. Indicator set used in this study.
CodeIndicatorVerbiage Used in the Survey
ECONOMIC INDICATORS
Ec1Corporate income taxes and royalties paid at full capacityThe new facility’s income tax payments
Ec2Extent of community and infrastructure investmentsNew facility’s investments in public services for the community (e.g., road maintenance, housing assistance)
Ec3Number of years it will take to reach the full capacity from the day the production beginsThe time it will take for the new facility to reach its maximum production amount
Ec4Annual production capacity at full capacityThe maximum number of products that the new facility can produce
Ec5Annual revenue at full capacityThe amount of money the new facility makes from the sales of their goods and services
SOCIAL INDICATORS
S1Potential nuisance and more significant risks that may affect local communities.Nuisances (e.g., odor) or hazards (e.g., fire) that may arise from the new facility and could impact the nearby communities
S2Road use and traffic load compared to the baselineThe potential traffic volume around the project site
S3Average annual salary of full-time workersAnnual salary offered for employees by the new facility
S4Number of full-time and hourly based employees at full capacityNumber of employees that can work in the new facility
S5Number of different job types offered on siteNumber of different job types offered by the new facility
ENVIRONMENTAL INDICATORS
En1Expense of anticipated energy consumptionThe new facility’s energy use
En2Proportion of heating energy that the new facility can potentially supply by renewables on-siteThe amount of energy that the new facility obtains from renewable energy resources such as solar roof panels
En3Potential percentage of recycled input materialsThe amount of recycled materials used by the new facility to produce their products
En4Total amount of untreated tailings in 15 yearsThe amount of unremoved mine waste remaining in the new project area after 15 years
En5Waste production potentialThe amount of waste to be produced by the new facility
En6Estimated total air emissionsAir Pollution (The amount of gases released to the air by the new facility)
En7Area used for productionTotal land area used by the new facility
Table 2. Convergent and divergent views within stakeholder groups: higher ranges (shown in orange and red) indicated more divergent views/disagreement among the respondents within each stakeholder group on the importance of a particular parameter, and lower ranges (shown in green and yellow) indicated closer alignment.
Level (L)AspectParameterRange in Assigned Weights within Stakeholder Groups
Faculty MembersIndustry AdvisorsGovernment AgenciesMining CompanyLocal Non-ProfitsCommunity MembersLocal GovernmentsAll Respondents
L2EconEconomic Aspects0.4960.3690.4430.2840.5970.6340.7200.731
L2SocSocial Aspects0.3470.3490.1410.1080.2620.3760.4060.431
L2EnvEnvironmental Aspects0.3720.3530.3610.2050.4810.6810.4590.681
L3EconContribution to Society0.3750.8000.3330.6250.4000.7750.7080.800
L3EconEconomic Performance0.3750.8000.3330.6250.4000.7750.7080.800
L3SocCommunity Impacts0.7080.7500.3750.7080.4000.7750.7750.800
L3SocEmployment0.7080.7500.3750.7080.4000.7750.7750.800
L3EnvAir pollution0.3490.4190.4560.0670.1980.3370.3770.575
L3EnvLand use0.0990.3020.4430.2250.4880.3100.1040.513
L3EnvResource Consumption0.1860.4770.2380.1700.2200.3860.4350.513
L3EnvWaste0.3440.2960.0630.1600.2550.3320.3290.423
L4EconIncome tax payments (Ec1)0.3750.7080.6250.3330.0670.6250.7330.800
L4EconInvestment in public services (Ec2)0.3750.7080.6250.3330.0670.6250.7330.800
L4EconTime until full capacity (Ec3)0.5540.1980.2150.3760.5930.3210.2520.638
L4EconProduction capacity (Ec4)0.2610.2000.6250.1950.2050.5640.5480.659
L4EconRevenue (Ec5)0.4830.1220.5150.2910.6620.6580.4060.710
L4SocNuisance (S1)0.7750.4000.6250.3750.0670.7500.5830.775
L4SocTraffic (S2)0.7750.4000.6250.3750.0670.7500.5830.775
L4SocAnnual salary (S3)0.3750.6250.2410.3370.7050.5610.5930.729
L4SocNumber of employees (S4)0.3940.5800.4230.2140.5990.3460.5340.664
L4SocNumber of job types (S5)0.0490.4350.2150.3640.2730.3890.6280.665
L4EnvEnergy Use (En1)0.5560.7170.6890.5110.7120.6910.6840.743
L4EnvEnergy supplied by renewables (En2)0.4340.5980.5630.6850.5120.6400.6040.685
L4EnvRecycled input materials (En3)0.4000.2780.3760.3800.3630.2620.5490.632
L4EnvUntreated tailings (En4)0.5830.7750.7750.7750.5000.4000.6660.775
L4EnvWaste production (En5)0.5830.7750.7750.7750.5000.4000.6660.775
Table 3. Results of What-if Scenario 1.
Alternative, Original Ranking, Original Utility ScoreUtility Scores for What-If Scenario 1: Removing the Outliers in Each Stakeholder Group
Faculty MembersIndustry AdvisorsGovernment AgenciesMining CompanyLocal Non-ProfitsCommunity MembersLocal GovernmentsMeanRange
(Max–Min)
Shrimp, 1st, 0.598 0.5870.6010.6050.5970.5810.5900.6040.5950.024
(0.605–0.581)
Hemp, 2nd, 0.5380.5260.5410.5410.5340.5310.5350.5420.5360.016
(0.542–0.526)
Tailings, 3rd, 0.4920.5070.4880.4870.4940.5060.5020.4860.4960.021
(0.507–0.486)
Table 4. Results of What-if Scenario 2-a.
Alternative, Original Ranking, Original Utility ScoreUtility Scores for What-If Scenario 2-a: Removing Each Respondent
Maximum ScoreMinimum ScoreMeanRange
(Max–Min)
Shrimp, 1st, 0.598 0.6060.5870.5970.019
Hemp, 2nd, 0.5380.5440.5310.5370.013
Tailings, 3rd, 0.4920.5020.4860.4940.016
Table 5. Results of What-if Scenario 2-b.
Alternative, Original Ranking, Original Utility ScoreUtility Scores for What-If Scenario 2-b: Removing One Stakeholder Group at a Time
Faculty MembersIndustry AdvisorsGovernment AgenciesMining CompanyLocal Non-ProfitsCommunity MembersLocal GovernmentsMeanRange
(Max–Min)
Shrimp, 1st, 0.598 0.5810.6220.6130.5870.5750.5890.6170.5980.047
(0.622–0.575)
Hemp, 2nd, 0.5380.5320.5390.5460.5210.5320.5410.5530.5380.032
(0.553–0.521)
Tailings, 3rd, 0.4920.5070.4770.4810.5100.5080.4970.4740.4930.036
(0.510–0.474)
Publisher’s Note: MDPI stays neutral with regard to jurisdictional claims in published maps and institutional affiliations.

