Article

Groundwater Characteristics and Quality in the Cascades Region of Burkina Faso

by
Moussa Diagne Faye
1,*,
Moussa Bruno Kafando
1,
Boukary Sawadogo
1,
Romeal Panga
1,
Souleymane Ouédraogo
2 and
Hamma Yacouba
1
1
Laboratoire Eaux Hydro-Systèmes et Agriculture (LEHSA), Institut International d’Ingénierie de l’Eau et de l’Environnement (Institut 2iE), 1 Rue de la Science, Ouagadougou 01 BP 594, Burkina Faso
2
Direction Régionale de l’Eau et de l’Assainissement de la Région des Cascades (DREA-Cas), Banfora BP 39, Burkina Faso
*
Author to whom correspondence should be addressed.
Resources 2022, 11(7), 61; https://doi.org/10.3390/resources11070061
Submission received: 29 May 2022 / Revised: 17 June 2022 / Accepted: 21 June 2022 / Published: 28 June 2022

Abstract

:
In the context of low rainfall, groundwater abstraction is the main source of water, especially in rural areas. For better water management, a good knowledge of water resources is necessary. The Cascades region depends, like most regions, on the use of groundwater, especially in rural areas. However, this region has been subject to a strong anthropogenic impact in recent years, in association with mineralization. This study aims to establish the status of groundwater quality in order to strengthen the knowledge of groundwater resources, for better planning of preservation strategies and sustainability of actions. Fifty-eight borehole water samples were collected using techniques and methods for assessing groundwater properties. The results indicate that the electrical conductivity (EC) values of the water show slight mineralization. The waters are aggressive, with severe-to-significant corrosion, and with calcite saturation in relation to the geological facies. Principal component analysis allowed us to conclude that residence time and leaching due to anthropogenic activities have an impact on quality. The chemical and bacteriological quality of the groundwater systems is of great concern, as some parameters exceed the Burkina Faso guidelines.

1. Introduction

Access to water for people around the world is a concern for governments. In particular, water resources are under threat from increasing withdrawal, the effects of climate change, and increasing pollution [1]. This is a concern of the United Nations and other major global organizations, which have initiated major international conferences in recent years on access to water, knowledge of aquifers, and pollution control [2]. The scarcity of rainfall, the drying-up of rivers and other water reservoirs, and the strong anthropogenic pressure on these surface-water bodies leading to increased pollution have reinforced interest in groundwater in Africa for the supply of populations, especially in rural areas [3,4,5].
In Burkina Faso, water is involved in all daily activities, which makes it a sensitive element, exposed to all kinds of pollution [6,7]. In rural areas, the pollution phenomenon contributes considerably to the limitation of drinking-water resources. The role of groundwater flows is all the more serious, as they generally govern the only source of drinking-water supply and are, therefore, essential for its evolution [8,9]. Today, the state of knowledge on groundwater quality is very limited, and the demands placed on aquifers are becoming increasingly intense [10].
The Cascades region has one of the highest levels of cumulative rainfall in Burkina Faso, reaching 1200 mm/year [11]. In recent years, this region has experienced a significant change in its surface conditions due to an increase in industrial and artisanal mining activities and agriculture that is increasingly focused on the use of phytosanitary products for soil amendment and vector control. This raises the question: how do we understand the origin and mechanisms of the different types of pollution identified to assess their evolution? Determining the uncertainty of substances in mineralized aquifers is an important factor for a long-term water-quality monitoring program [4].
This need for knowledge of the qualitative state of groundwater resources is all the more crucial in the Cascades region, which is faced with strong demographic growth of 4.7% [12], the intensification of sugar cane, cotton, cashew nut crops, and the emergence of numerous industrial and artisanal gold mining sites [13]. The objective of this study is to assess the potability of groundwater for domestic use in the Cascades region through a geochemical and microbiological approach. In addition, an attempt was made to explain the factors controlling mineralization through a multivariate approach.

2. Materials and Methods
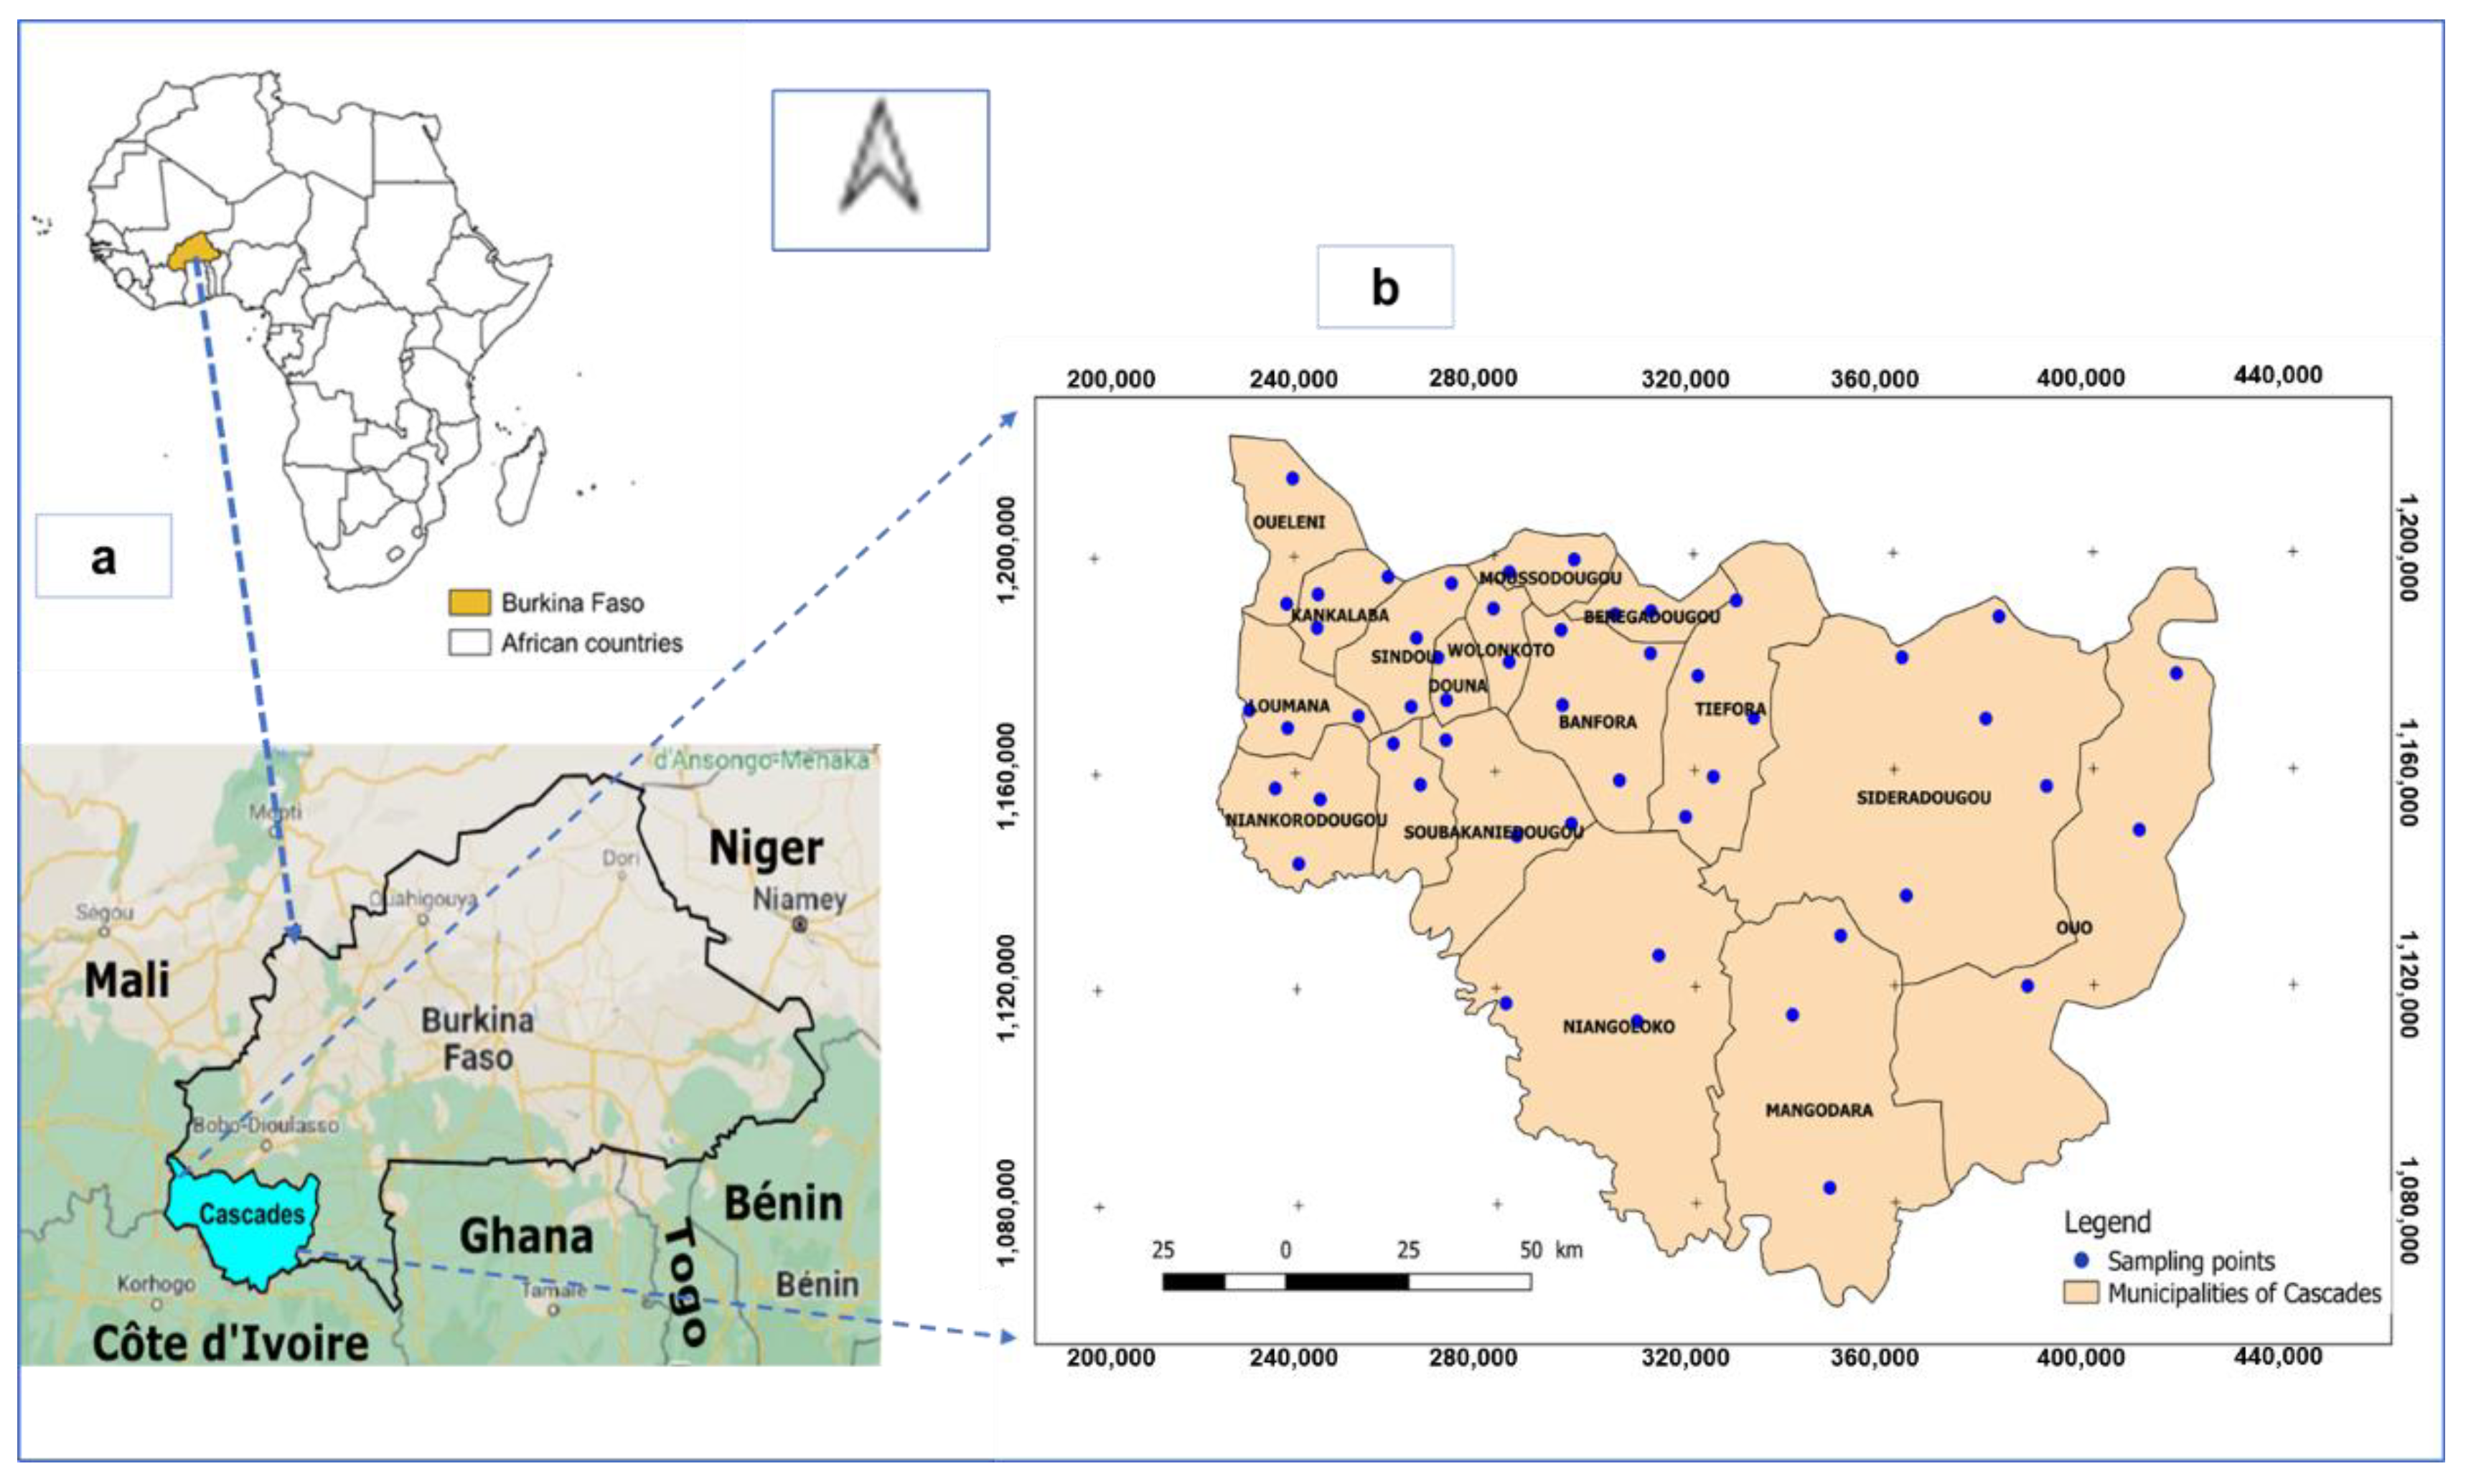
2.1. Study Area

The Cascades region is located in the extreme southwest of the country, bordered to the north by the Hauts-Bassins region, to the south by the Republic of Ivory Coast, to the east by the South-West region, and to the west by the Republic of Mali. The region covers an area of 18,917 km2, or 6.7% of the national territory (Figure 1). The capital of the region is the town of Banfora.
The population of the region is estimated at 812,466 inhabitants according to [12]. The region’s climate is Sudanian with two main seasons. From April to October, a wet season occurs, with an average annual rainfall that varies from 800 to 1200 mm recorded at the Banfora Rainfall Station (code: 1200001600; longitude: −4.7667; latitude: 10.6333) located at an altitude of 284 m. On the other hand, the dry season occurs from November to March. The average annual temperatures range from 17 °C to 36 °C, with a thermal amplitude of 19 °C. The high rainfall in the region has favored the establishment of very diversified vegetation cover. The vegetation is made up of wooded savannahs and clear forests 15 to 20 m high, interspersed with forest galleries. The following vegetation formations can be distinguished: wooded savannahs and trees, clear forests and galleries, and the grassy carpet. The region has 14 classified forests covering an area of over 284,200 ha, or about 16% of the regional area [14].
Two major geological formations structure the geology of the Cascades region (Figure 2). These are the crystalline formations, which are largely predominant, consisting of rocks that are predominantly granite–gneissic or migmatic, schist–sandstone, or volcano-sedimentary. They are located in the central and southern parts of the region. The sedimentary formations regroupe the dolerite veins. They constitute the western edge of the region, in which part of the Taoudéni basin is found [13].
The Cascades region has one of the steepest reliefs in the country. The relief is composed mainly of plateaus and plains. The average altitude of the plateaus is 450 m, and there are hills that overhang them by more than 250 m in the west of the region (Figure 3). Ténakourou Mount, located in the region, reaches an altitude of 747 m and is the highest peak in Burkina Faso. The plains are located in the center of the region. The slope is generally directed towards the south.
Hydrographically, the region is drained by two major perennial rivers: the Comoé and the Léraba (Figure 3). The Comoé is a permanent watercourse on which several dams have been built. It originates in the outlying communes in the west of the region and flows southward where it meets the Léraba, with which it forms a natural border between the Comoé province and Côte d’Ivoire [13].
The economic activities carried out in the region are mainly industrial agriculture for the production of sugarcane (4000 ha); family rainfed agriculture for the production of cotton, maize, sorghum, yam, and sweet potato; and off-season agriculture for market gardening. Arboriculture is highly developed in this region. It is the largest production center, particularly for mango and cashew nuts. There is also strong industrial and artisanal gold mining activity. It is also a production area for market garden products, with off-season agriculture practiced outside the rainy season using surface-water reserves.

2.2. Sampling and Analysis Method

Many countries have developed their methods, adapted to local conditions, and are possibly inspired by one or more of the existing methods [6,7,15,16,17,18,19]. The sampling involved 58 points spread throughout the region. These points were boreholes equipped with human-powered pumps in localities, to obtain a territorial grid of the entire region, all provinces, and all communes (see Figure 1). The samples were taken following the recommendations for the analysis of physico-chemical and microbiological parameters, according to the standard methods [20,21]. The distribution of sampling points in the region is presented in Figure 4. For each sampling point, 30 parameters were measured, including 27 physico-chemical and 3 microbiological parameters. Physical parameters such as temperature, pH, and electrical conductivity (EC) were obtained using a HANNA HI 9828 multi-parameter. Ions including nitrate (NO3), sulphate (SO42−), nitrite (NO2), orthophosphate (PO43−), iron (Fe2+), ammonium (NH4+), and fluoride (F) were obtained via molecular absorption spectrophotometry (Hach DR 3800). Sodium (Na+) and potassium (K+) ions were determined via flame atomic-emission photometry. Total cyanide (CN) was analyzed using the spectrophotometric method after hot mineralization. Trace metal elements and metals including arsenic (As), lead (Pb), and zinc (Zn) were analyzed via microwave-generated plasma atomic emission spectrometry (MP-AES 4210 Agilent). Carbonate (CO32−), bicarbonate (HCO3), and chloride (Cl) ions were determined via a volumetric method using sulfuric acid and silver nitrate, respectively.
The microbiological analyses allowed the detection of total coliforms, fecal coliforms, and fecal streptococci. These germs were detected using the membrane filtration method. The following media were used: KF agar (selective medium used for the isolation and enumeration of enterococci in food products using the classical Petri dish method) for fecal streptococci, and ID Coli (culture medium for the identification of Escherichia coli) for total coliforms [22,23,24,25]. Petri dishes were then incubated for 24 h and 48 h. The objective of the analysis of physico-chemical parameters is twofold: it will allow a comparison with the potability indicators in force in Burkina, and appreciation of the analysis of pollution sources through mapping.

2.3. Rectification and Counting Method

This methodology consisted of rectifying the coordinates of the structures concerned in the study. In this case, it was a question of examining the administrative division insofar as in certain cases, the coordinates of the localities were attributed to the structures concerned.
Then, the method of filling in the data was carried out using the rectified data. This involved performing a linear adjustment for the region to see any correlation between two variables that satisfied the condition, where R was the correlation coefficient between the two variables [16]. Subsequently, the equation of the linear regression line linking the two variables was obtained, which led to an adjustment of the failing data of one variable to the data of the other variable.
Finally, the ion balance procedure was used to evaluate the quality of the collected data in order to make the necessary corrections. The reconciliation of anions (A−) and cations (C+) agreed, to limit the prototypes that deviated excessively from the bisector. The acceptable ion balance error (IBE) is set at +/−5% by some authors [6,19], while others set it at +/−10% [15,17]. The +/−5% range was considered for the present study to minimize the variances and strengthen the analyses. The ion balance was translated into Equation (1) by holding the major ions, and the error of the balance was obtained by applying Equation (2).
[Cl] + [SO42−] + [NO3] + [HCO3] = [Ca2+] + [Mg2+] + [Na+] + [K+]
The percentage error is given by:
  I B E =   c a t i o n s a n i o n s c a t i o n s + a n i o n s   *   100  

2.4. Multivariate Analysis

Principal component analysis (PCA) was performed using the statistical software SPSS 18 (SPSS Inc.) for WINDOWS, to process the data for the 26 variables. It was a question of synthesizing the old variables that we will call canonical variables. These variances were decomposed in order to synthesize new variables, which captured as much of the information contained in the initial variables as possible. For the determination of the reliability of the values, the KMO index and Bartlett’s Sphericity Test were applied to check if the observed correlation matrix deviated significantly from the identity matrix. The statistical methods were extensively corroded to decipher the groundwater samples and physico-chemical variables. Interpretation, according to [18,26], is as follows: a high relationship test (close to +/−1) announces two positively or negatively related variables, a value of zero designates no relationship between them, a relationship >0.7 coincides with strongly related data, and a relationship between 0.5 and 0.7 coincides with fairly correlated data. This analysis allows us to summarize and classify a large number of data in order to extract the main factors that are at the origin of the simultaneous evolution of the variables, and their reciprocal relationships. Furthermore, this study will determine the different hydrogeochemical facies, the origin of mineralization, and the chemical facies of the waters.

2.5. Determination of Hydrofacies in the Piper Diagram

This is conditioned by the chemical change in the groundwater. To understand the hydrochemical system, the factorial quantities are projected in the Piper mineralization diagram. It has three parts, including the triangle of cations, the triangle of anions and a rhombus, which is responsible for the hydrofacies. The study of the behavior of water will be considered in each part of the diagram [27].

2.6. Domination and Evolution of Groundwater Mineralization

The aggressiveness of groundwater can be obtained from the composition of major chemicals. It is possible to test the stability of the water concerning primary or neoformed organics. This allows us to test certain properties and behaviors of the water, in particular, the corrosive or scaling character. In this case, the saturation index (SI) of groundwater was applied to instruct distinct configurations of mineral periods—such as precipitation [15], dissolution, and adsorbed phases, and the Ryznar index or Ryznar equilibrium index (RSI)—to determine the aggressive or scaling disposition of the water [19,28]. The saturation and Ryznar indices are defined by Equations (3) and (4), respectively:
SI = log(IAP) − log(T)
RSI = 2pHs − pH
where SI is the saturation index, RSI—Ryznard equilibrium index, IAP—Ionic Activity Product, T—temperature (°C), pHs—saturation hydrogen potential, and pH—hydrogen potential.

3. Results and Discussion

3.1. Rectification and Counting

The boreholes in the region were inventoried by a reconnaissance campaign to correct and arbitrate said positioning, while verifying their operational status. Many substances were missing at the time of data entry. Then, the statistical analysis of the contents, as a principle, had to perceive the data which corresponded and which were the most similar to the data located at a distance. The correlation matrix gives us an idea of the correlation between two variables. Finally, the ionic balance was checked and shows that the maximum limit is less than 5% and that only four samples exceed it due to a high ionic charge, which is closer to that of the results of [19] in the same base medium. In the first step, after counting all the analyses that have a balance higher than 5%, the data of all samples were processed without considering their origin. In the second step, processing was conducted after separating different groups according to the origin of the water and the depth in each of the water families.
Subsequently, all the results of the sample analyses were examined using this exercise, based on the contributions of the nature of the water. Table 1 gives the results of the physico-chemical analyses, while Table 2 shows the correlation matrix between the different ions and the physico-chemical parameters.

3.2. Physico-Chemical Characterization and Origin

3.2.1. Physical Parameters

In the Cascades region, the temperature varies greatly from one borehole to another and from one geological zone to another. In the fractured basement zone, the temperature varies from 25.1 °C to 33.1 °C, with an average of 29 °C. In the sedimentary formations, the temperature is relatively stable and relatively higher than the temperature recorded in the fractured basement boreholes. The temperature of the sedimentary zone boreholes varies between 29.8 °C and 31.6 °C, with an average of 30.8 °C. However, within the same geological zone, there is no variation in temperature between geological formations. This can be justified by the fact that the pressure of the insolation is intense, and this accumulates during the year, resulting in heat with an air temperature close to 25 °C, on average. It would be more interesting to monitor this temperature, because several authors state that its variation is an indicator of exchange between the different groundwater bodies and surface water, with respect to pollution [29,30,31].
Concerning the pH in the basement zone of the Cascades region, it varies from 6.3 to 7.4, with an average of 6.8. Borehole waters in the sedimentary zone are relatively more acidic, with pH values ranging from 5.5 to 7.1 and with an average of 6.1. The pH values of the analyzed waters are quite homogeneous, with more than 71% being slightly neutral and the rest slightly acidic in some boreholes; this could be explained by the underground exchange of these waters. The acidity is even more important in the wells of the villages of Sele, Wolonkoto, Tourney, Bougoula, Kaniagara, and Tena. In these villages located in sandstone formations, the relatively low pH of the borehole water is close to the pH of rainwater, with values less than 6 [32]. This proximity of the pH of the borehole water in these villages to that of rainwater suggests that these aquifers are preferential recharge areas. The low pH values in the basement zone may also be related to the low carbonate minerals contained in the weathered layer.
Electrical conductivity obtained from basement borehole water ranged from 22 μS/cm to 514.0 μS/cm with an average of 205.2 μS/cm. The highest conductivities were obtained in the borehole waters of Berégadougou (314 μS/cm), Gouandougou (514 μS/cm), Balgogo (386 μS/cm), Norkama (320 μS/cm), and Deregoue 1 (351 μS/cm). However, these values remain low compared to the authorized limit for drinking water in Burkina Faso. Water from boreholes in the sedimentary zone have relatively low electrical conductivity values ranging from 10 μS/cm to 314 μS/cm, with an average of 50.10 μS/cm.
In general, conductivity and pH values are relatively lower in the sedimentary zone. The low values of their parameters could reflect the existence of preferential recharge zones [15,32]. The northwestern part of the study area has the highest altitudes, at more than 400 m above sea level. In a regional context, these areas appear to be recharge areas, with water sources supplying the Comoé River in the dry season, thus ensuring its perennial existence. This hypothesis of potential recharge areas is reinforced by the low electrical conductivity values in the area (mostly sedimentary). In the absence of a piezometric map of the area, it can be assumed that the direction of groundwater flow follows that of the hydrographic network. Thus, the groundwater is recharged in the highest areas of the north and flows towards the southern part where it is loaded with minerals. This assertion can be corroborated by the monitoring of bicarbonates (Figure 5), which shows a strong correlation with electrical conductivity (R2 = 0.96). HCO3- concentrations are low in the north, while they are relatively higher in the southeast.

3.2.2. Cations

The order of dominance of the major cations found in the waters analyzed (Figure 6) is: Ca2+ > Na+ > Mg2+ > K+ for the fractured basement zone and Ca2+ > Mg2+ > K+ > Na+ in the sedimentary zone.
The sodium content does not exceed the 200 mg/L, the recommendation of Burkina Faso. Insofar as the content of sodium ions is higher than that of potassium ions, their existence in the waters indicates that they are derived from the disintegration of feldspars, but also from the alteration of micas. Their non-correlations (R2 = 0.27) indicate that the abundance of sodium ions is due to the elective ingestion of clays, while potassium, with a high atomic mass, is therefore less abundant [33]. Sodium and potassium ions could come from the decomposition of minerals (feldspars, pyroxenes, micas, and amphiboles), or ionic exchanges with clay minerals. Therefore, the hydrolysis of these rocks could explain its abundance in these groundwaters according to the following reactions:
Si3AlO8Na + 4.5H2O + H+ ↔ 0.5 (Si2Al2O5(OH)4) + 2H4SiO4 + Na+
Si3AlO8Na + 7H2O + H+ ↔ Al(OH)3 + 3H4SiO4 + Na+
For calcium, no value exceeds the norm. The high interval contents of the borehole water are the result of the dominant mineral load, hence the leaching of the soil profile rich in calcium minerals [34].
Si2Al2O8Ca + H2O + 2H+ ↔ Si2Al2O5(OH)4 + Ca2+
The magnesium ion contents obtained are low, with average values of 12.1 mg/L and 3.6 mg/L observed, respectively, in the basement and sedimentary zones. However, the relatively high contents noted can be explained by the degradation of the ferromagnesian minerals of biotites or amphiboles. This hypothesis can be supported by the fact that the Mg2+/Ca2+ ratios remain below 1 in all the water points. The abundance of Ca2+, Mg2+, and Na+ ions in the basement formations, in the eastern and southeastern parts of Figure 4, reflects a long contact time between water and granitic rocks.
For potassium, there are two boreholes with concentrations above the limit value of 10 mg/L [35]. The water from the first borehole, located in the municipality of Bérégadougou, an industrial sugarcane-growing area in the north–central part of the region, contains potassium ions with a concentration of 15.3 mg/L. The second borehole, whose water contains potassium concentrations equal to 10 mg/L, is located in the southeastern part of the municipality of Loumana, in the village of Kinkinkan, a cotton-growing area. The fact that this recommendation is distant translates to a constraint or contribution of the outside where anthropogenic activity occurs. This hypothesis is all the more serious when one examines the relative abundance of potassium in the boreholes of the sedimentary zone, where the probability of an external contribution of potassium with rainwater is very high. Depending on the abundance of the contradiction in the region, it can be assumed that it is derived from absorption by plants.

3.2.3. Anions

The characterization of the waters revealed major anions (Figure 5) whose abundances are distributed in the following order: HCO3 > SO42− > NO3 > Cl in the fractured basement zone and HCO3 > SO42− > Cl- > NO3 in the borehole waters of the sedimentary zone. Most of the mineralization is attributed to bicarbonate ions which dominate the other anions. Values are interpreted to range from 13.40 mg/L to 321.27 mg/L, with an average of 123.27 mg/L. The high values suggest the presence of carbon dioxide (CO2). Indeed, the presence of organic matter in groundwater favors the production of CO2, which is a product of mineralization, which explains the correlation. It can also be attributed to the percolation of rainwater, which leads to the leaching of aquifers. However, according to [19], the weathering of feldspars releases ions that, when stored, transmit bicarbonate to the extent that carbonate minerals are present. The low contents in the samples are attributed to the low pH values, because the delivery of bicarbonates is helped when the pH of the space increases. The predominance of bicarbonate ions in the groundwater of the study area is in agreement with the results obtained by several authors in West Africa who have worked in similar formations [36] on the Ivory Coast and [29] in Burkina Faso.
2NaAlSi3O8 + 2CO2 + 11H2O ↔ Al2Si2O5(OH)4 + 2Na+ + 2HCO3 + 4H4SiO4
CaCO3 + CO2 + H2O ↔ 2HCO3− + 2Ca2+
Chlorides and sulfates average 1.51 mg/L and 2.91 mg/L, respectively. Their low concentrations suggest that granites are the source. We also note no correlation between the two ions in relation to other ions, contrary to other studies wherein correlations between Ca, Mg, and K have been highlighted [7] in Burkina [37] in Yaoundé. This could be explained by leaching. Indeed, during the percolation towards the fissured zones, the water undergoes cleaning in the alterites, and hence, a decrease in concentration. If this percolation was not assumed, we would observe a piling-up of important contents at the level of the clay cover. The low values do not mean that there is no exchange between container and content, insofar as we have rocks rich in sulfide minerals such as gypsum [38,39,40].
Nitrate (NO3) levels are all below the 50 mg/L limit set in the Burkina recommendation. The non-relationship between sulfate ions (SO42+) and chloride ions (Cl), and the correlation between potassium ions (K+) and nitrite (NO2), suggest that there is an anthropogenic point input, such as the presence of nitrogen from fertilizers, oxidation, animal husbandry, and industry. The contribution of nitrates with rainwater could reflect the relative abundance of nitrates in the sedimentary zone (Figure 5). The low presence of calcareous rocks in the sedimentary formations would justify the low abundance of these bicarbonates in the waters of the sedimentary zone. On the other hand, the boreholes of the granitoid zone show a relative abundance of bicarbonates because of the ability of the granitic rocks to release these ions. Chloride and sulfate ions are predominant not only in part of the sedimentary zone (northeast), but also in part of the fractured basement zone (the center of the region). The common characteristic of these different areas is the practice of industrial agriculture of sugarcane and cotton. The relative abundance of these ions in these areas would depend on the use of fertilizers and pesticides.

3.2.4. Minor Ions

Two samples showed fluoride ion levels (Figure 6) of 1.6 mg/L and 21.6 mg/L, thus exceeding the Burkina Faso recommendation of 1.5 mg/L. These high values are located in cultivated areas and can be explained by the fact that the aquifers are mainly composed of granitic intrusion, and by the dissolution of minerals such as fluorite (CaF2), cryolite (Na3AlF6), and fluo-apatite (Ca5F(PO43)) [41].
The waters are rich in iron (Figure 6), with levels varying between 0.10 mg/L and 4.20 mg/L, for a standard of 0.3 mg/L in Burkina Faso. Nevertheless, five samples exceeded this standard because the iron content of the armor was five times higher than that of the rocks. The low values indicate that during percolation, the iron trapped in the laterite is not mobilized [4].

3.2.5. Concerning Heavy Metals and Metalloids in Water

Heavy metals are difficult to degrade biologically or chemically, depending on the type of contaminant. Manganese levels vary from 0.001 mg/L to 1.13 mg/L, with two samples exceeding the Burkina Faso standard of 0.5 mg/L. It is noted that these contents are accompanied by high values of iron; these produce a metallic taste with a reddish color that is attributable to the deoxygenation of water [42,43], and hence, a natural presence; however, Ref. [44] imputes it to the geological formation of the region. Ref. [45] states that this presence may be due to a contribution from the surface in the percolation of industrial pollutants. However, this hypothesis can be dismissed insofar as there is no presence of industry in this part of the basin.
Apart from manganese, no heavy metals exceed the Burkina Faso standard. Arsenic is part of the composition of rocks (pyrite, arsenopyrite, etc.) throughout Burkina Faso. Arsenic levels in groundwater vary from 0.00 µg/L to 5.2 µg/L, with an average of 0.09 µg/L. It should be noted that none of the values exceed the Burkina Faso standard. This lack of arsenic in the area suggests that there is no gold panning site, or no ore formation containing arsenopyrite. Cyanide levels are also almost non-existent and are often accompanied by arsenic values. Chromium is also not present in any samples, and it is supposed that the high contents can be only from an industrial source.

3.3. Correlation between the Different Physico-Chemical and Chemical Variables

The very strong correlation observed between electrical conductivity and calcium (R2 = 0.84), magnesium (R2 = 0.84), and bicarbonates (R2 = 0.96) reveals that the mineralization of waters in the Cascades region is mainly controlled by these three ions.
Table 2, which shows the relationship between the variables, expresses the subsistence taken two-by-two. We note a very significant correlation of HCO3 with EC (R2 = 0.96), Na (R2 = 0.84), Ca2+ (R2 = 0.84), and Mg2+ (R2 = 0.86); a moderate correlation with fluor (R2 = 0.52). We also note a moderately significant relationship between K and NO3 (R2 = 0.6) and NO2 (R2 = 0.55).
The relationships between cations and HCO3 concentrations show that silicate degradation increases cation, silica, and bicarbonate compositions. It is shown in Section 3.2.3 that the leaching of rocks via percolation favors CO2 input. With the aquifer system being open through the borehole, the biogenic CO2 diffuses very easily into the aquifer. Indeed, the elements that are impossible to dissolve remain and regenerate with the free ions in minerals of neoformation, i.e., clays. The bodies can intervene at any time during this change, hence the abundance of calcium. This is the consequence of strong anthropogenic pressure following the best correlation of magnesium with other minerals.
The relationships between the contents of cations, anions, and chlorides show no correlation. The cations show that if the chloride ion content increases, the cation content decreases and vice versa. This proves that chloride ions are naturally present in the waters with the inclusion of biotites [46,47].
The fact that anions follow the non-correlation with Cl, P and NO3 ions suggests that they do not come from silicates, so their presence refers to a contribution from the surface.

3.4. Groundwater Characterization Using Principal Component Analysis

The correlation matrix in this study supports the PCA, and the SPSS 18 determinant is d = 1.8 × 10⁻²⁶.
The KMO index and Bartlett’s Test of Sphericity (Table 3) test the adequacy of sampling where a partial correlation is used to measure the relationship between two variables by excluding the effects of other variables. A high KMO index (typically >0.5) indicates that the PCA is relevant. By applying Bartlett’s test of sphericity, a Chi-square value of 2756.237 was obtained (for a degree of freedom of 325 and a significance level of 0.00), confirming that the variables are significantly correlated to allow dimension reduction. In the second step, the measure of the adequacy of the sampling with the feasibility of the PCA was carried out using the Kaiser–Meyer–Olkin method (KMO index). The value obtained (0.642), tending towards 1, confirms this satisfactory adequacy.
For the total variance explained, we obtained eight principal components that hold 80% of the information, and Table 4 shows the coefficient contribution of the components based on the correlations. The variance of the first factor is 8.043, and the percentage of the first component captures 30.933% of the variance information contained in the initial database. The variance of the second factor is 2.925, it captures 11.250% of the information contained in the initial database, etc. This is very remarkable, because we started with a database containing 26 variables. The principal component analysis synthesized 26 new variables, but the first 8 synthetic variables alone capture about 80% of all the information in the initial database. We programmed the software to retain only the components whose eigenvalues are >1.
The collapse plot confirms the variance. Indeed, on the y-axis, we have the eigenvalues (the variance of the factors) and on the x-axis, we have the indices of the principal components (Figure 7). From the 8th component onwards, we observe that the decreases are no longer significant. The collapse plot allows us to make a judgment on the number of factors to retain. We expect our problem to retain eight components, which is an informed decision. The collapse plot supports this judgment.
The results of the factorial designs (Figure 8) also reveal an indication of a scattering of sources of variation in the chemical combination of groundwater. This submits the idea that water mineralization is directly related to residence time, given the abundance of HCO3 following silicate dissolution or leaching [3,45,46].
Thus, for component 1—defined by EC, K+, Na2+, SO42−, NO3−, Mg2+, Ca2+, and T°—this axis can be assimilated to the geological inputs, the main sources of the mineralization of waters from the residence time on which the parameters depend, via water–rock contact. Component 1 refers to the requirements for the acquisition of water chemistry. The factorial map allows us to find the following components: component 1 (electrical conductivity, potassium, sodium, sulphate, nitrate, magnesium, calcium, and temperature), component 3 (Turbidity and iron), component 4 (sulphate and zinc), and component 5 (chloride and temperature).
Component 2 is defined by P, PO43−, NH4+, and Fe2+; expresses the contribution of ions via leaching; translates transfer coming from the soil; and shows strong participation in anthropogenic activities. The factorial map allows us to find the following components: component 2 (orthophosphate and phosphorus), component 6 (nitrates and potassium), component 7 (total coliforms and fecal streptococci), and component 8 (nitrites).

3.5. Hydrogeochemical Facies of Groundwater

From a hydrogeochemical point of view, the Piper diagram (Figure 9) shows the different facies of the groundwater in the area. These waters are divided into single facies—calcic bicarbonate and magnesian facies—confirmed by the presence of granodiorites and lateritic crusts. In terms of cations, there is a slight calcic dominance which progresses towards the Na + K pole, confirmed by the presence of these two ions in the alterites at the level of the boreholes. Conversely, at the level of anions, we study the dominance of the bicarbonate pole towards the Cl + NO3 pole which, according to [8], explains certain contact coming from the outside. This is confirmed by the correlation between K and NO2. This bicarbonate predominance can be justified by the high bicarbonate levels recorded in the waters of this aquifer.

3.6. Aggressiveness of Groundwater

The stability management of waters is known, regarding minerals, to bring corrosive or scaling properties. The Ryznar index values obtained in this study range from 13.4 to 7.60, with an average of 9.70. It can, therefore, be concluded that the borehole waters sampled represent a severe-to-important corrosive character. It follows that their aggressiveness is related to the geological facies.
The saturation index (Table 4) indicates the different forms of mineral phases; for example, the reactions between water and a minerals and the reflex stability value would embody the result of ionic movement. The deviation from equilibrium is defined by the saturation index (SI). The presence of saturation is due to calcites. Due to the interaction of container and content, this tendency tends to increase the pH while leaning towards equilibrium; in other words, it would generate the deportation of minerals to the water table [4,7]. Gypsum tends to attain equilibrium near dissolution. The SI does not accept the interpretation of the geochemical demineralization mechanism from the precipitation of carbonate minerals (calcite) generally absent in granitic basement rocks.

3.7. Bacteriological Characterization

The results of the various analyses show a high level of contamination of borehole water by total coliforms, fecal coliforms, and fecal streptococci in groundwater in certain localities (Figure 10). This makes the water unfit for human consumption, as Burkina Faso standards require that drinking water be completely free of fecal contamination.
In rural areas, localities exploit groundwater through wells, boreholes, and springs. As access to sanitation and drinking-water services is non-existent, most excreta disposal is carried out through traditional latrines with a pit made by makeshift well-diggers that can reach the water table; this constitutes a risk of microbiological contamination of groundwater [48,49,50,51]. In addition to this, the presence of bacteria could also be due to animal husbandry. According to [50,52], livestock farming is one of the biggest sources of groundwater pollutants through animal excreta (urine and feces).
Water from the localities of Zebeneka, Voumale-Morouvogo, Traorela/FNI1, Sokoura/FOU1, Sele/FOU1, Clano/FOU2, and Mossikin have a very high bacterial load. The concentrations of total coliforms identified are all >100 CFU/100 mL. The concentrations of fecal coliforms vary from 4 to 21 CFU/100 mL, mainly in the Zebeneka and Mossikin districts. Fecal streptococci are less abundant only in the village of Sokoura, with a concentration of 100 CFU/100 mL. The high microbial load in the borehole water analyzed could be justified by several factors inherent to the agropastoral activities around the boreholes, a lack of development of these boreholes, the proximity of sources of pollution such as household waste, latrines, and the failure of users to respect basic hygiene rules [52].
After taking into account the chemical and microbiological parameters of the sampled groundwater, the potability map in Figure 11 is proposed. About ten boreholes produce water unsuitable for human consumption, and half of these boreholes are concentrated in the western part of the region. Most of these wells are more affected by micro-organism contamination.

4. Conclusions

The data collected during this study allowed us to draw up a picture of the physico-chemical and bacteriological quality of the borehole water in the Cascades region. The groundwater has an acidic pH, and electrical conductivity indicating strong mineralization, resulting in the independence of water pockets from each other. It should be noted that the high levels of potassium, iron, manganese, bicarbonates, and fluoride recorded in some boreholes do not comply with the guide values and make these waters unfit for consumption. The anion and cation contents increase according to the path of infiltration. Bicarbonates provide necessary mineralization of the water and impose upon the other anions. The waters are aggressive, with severe-to-significant corrosion, and with calcite saturation. The PCA indicates that mineralization is governed by soil leaching, anthropogenic activities, and acid hydrolysis of rock minerals.
Similarly, in terms of bacteriology, 12% of the well water analyzed is contaminated with fecal contamination germs and should not be consumed without prior treatment. This pollution is most likely due to the poor sanitation and hygiene conditions in the environment.

Author Contributions

Conceptualization, M.D.F. and M.B.K.; methodology, M.D.F., M.B.K. and B.S.; software, R.P.; validation, M.D.F., M.B.K. and B.S.; formal analysis, M.D.F. and M.B.K.; investigation, R.P.; resources, M.D.F. and M.B.K.; data curation, M.D.F. and R.P.; writing—original draft preparation, M.D.F.; writing—review and editing, M.B.K., B.S. and H.Y.; visualization, B.S. and S.O.; supervision, M.D.F.; project administration, M.D.F.; funding acquisition, S.O. and M.B.K. All authors have read and agreed to the published version of the manuscript.

Funding

This research received no external funding.

Institutional Review Board Statement

Not applicable.

Informed Consent Statement

Not applicable.

Data Availability Statement

Not applicable.

Acknowledgments

The authors would like to express their gratitude to the Ministry of Water and Sanitation of Burkina Faso, which, through its decentralized structure in the Cascades (DREA-Cas), helped us to collect and obtain data.

Conflicts of Interest

The authors declare no conflict of interest.

References

  1. Lasserre, F.; Brun, A. Le Partage de L’eau: Une Réflexion Géopolitique; Odile Jacob: Paris, France, 2018. [Google Scholar]
  2. Unies, N. Rapport sur la Troisième Session du Forum Urbain Mondial; UN-HABITAT: Vancouver, CB, Canada, 2006. [Google Scholar]
  3. Kafando, M.B.; Koïta, M.; Le Coz, M.; Yonaba, O.R.; Fowe, T.; Zouré, C.O.; Faye, M.D.; Leye, B. Use of Multidisciplinary Approaches for Groundwater Recharge Mechanism Characterization in Basement Aquifers: Case of Sanon Experimental Catchment in Burkina Faso. Water 2021, 13, 3216. [Google Scholar] [CrossRef]
  4. Bamba, O.; Pelede, S.; Sako, A.; Kagambega, N.; Miningou, M.Y. Impact de l’artisanat minier sur les sols d’un environnement agricole aménagé au Burkina Faso. J. Des Sci. 2013, 13, 1–11. [Google Scholar]
  5. Carter, R.C.; Parker, A. Climate Change, Population Trends and Groundwater in Africa. Hydrol. Sci. J. 2009, 54, 676–689. [Google Scholar] [CrossRef] [Green Version]
  6. Mahamane, A.A.; Guel, B. Caractérisations physico-chimiques des eaux souterraines de la localité de Yamtenga (Burkina Faso. Int. J. Biol. Chem. Sci. 2015, 9, 517–533. [Google Scholar] [CrossRef] [Green Version]
  7. Sako, A.; Bamba, O.; Gordio, A. Hydrogeochemical Processes Controlling Groundwater Quality around Bomboré Gold Mineralized Zone, Central Burkina Faso. J. Geochem. Explor. 2016, 170, 58–71. [Google Scholar] [CrossRef]
  8. Ouandaogo-Yameogo, S.; Blavoux, B.; Nikiema, J.; Savadogo, A.N. Caractérisation du fonctionnement des aquifères de socle dans la région de Ouagadougou à partir d’une étude de la qualité chimique des eaux. Rev. Des Sci. de L’eau 2013, 26, 173–191. [Google Scholar] [CrossRef] [Green Version]
  9. Smedley, P.L.; Knudsen, J.; Maiga, D. Arsenic in Groundwater from Mineralized Proterozoic Basement Rocks of Burkina Faso. Appl. Geochem. 2007, 22, 1074–1092. [Google Scholar] [CrossRef] [Green Version]
  10. Courtois, N.; Lachassagne, P.; Wyns, R.; Blanchin, R.; Bougaïré, F.D.; Somé, S.; Tapsoba, A. Large-Scale Mapping of Hard-Rock Aquifer Properties Applied to Burkina Faso. Groundwater 2010, 48, 269–283. [Google Scholar] [CrossRef]
  11. ANAM. Zones Climatiques du Burkina Faso de 1991 à 2020; ANAM: Ouagadougou, Burkina Faso, 2021. [Google Scholar]
  12. INSD. Cinquième Recensement Général de la Population et de L’habitation du Burkina Faso; Ministère de l’Economie, des Finances et Du Développement: Ouagadougou, Burkina Faso, 2022. [Google Scholar]
  13. MCA. Schéma Directeur D’aménagement et de Gestion de L’eau du Bassin de la Comoé Version N°3; MCA-BF: Ouagadougou, Burkina Faso, 2014. [Google Scholar]
  14. CRP. Rapport Bilan Annuel de L’exécution du Programme National D’Approvisionnement en eau Potable et D’Assainissement Dans la Région des Cascades; Ministère de L’Eau et de l’Assainissement: Ouagadougou, Burkina Faso, 2018. [Google Scholar]
  15. Kouanda, B.; Coulibaly, P.; Niang, D.; Fowe, T.; Karambiri, H. Analysis of the Performance of Base Flow Separation Methods Using Chemistry and Statistics in Sudano-Sahelian Watershed, Burkina Faso. Hydrol. Current Res. 2018, 9, 2. [Google Scholar] [CrossRef]
  16. Pagès, J. Analyse Factorielle de Données Mixtes. Rev. de Stat. Appliquée 2004, 52, 93–111. [Google Scholar]
  17. Malik, N.; Shimi, N.S. Etude de la vulnérabilité des eaux souterraines de la ville de Gafsa (Sud-Ouest de la Tunisie): Effets anthropiques et conséquences. Alger. J. Environ. Sci. Technol. 2019, 5, 4. [Google Scholar]
  18. Gournay, A. Analyse Statistique Mutlivariée; Notes de cours. Université de Neuchâtel: Neuchâtel, Switzerland, 2012. [Google Scholar]
  19. Faye, M.D.; Biaou, A.C.; Soro, D.D.; Leye, B.; Koita, M.; Yacouba, H. Understanding Groundwater Pollution of Sissili Catchment Area in BURKINA-FASO. LARHYSS J. P-ISSN 1112-3680/E-ISSN 2521-9782 2020, 42, 121–144. [Google Scholar]
  20. Heriarivony, C.; Razanamparany, B.; Rakotomalala, J.E. Caractères Physico-Chimiques et Bactériologiques de l’eau de Consommation (Puits) de La Commune Rurale d’antanifotsy, Région Vakinankaratra, Madagascar. LARHYSS J. P-ISSN 1112-3680/E-ISSN 2521-9782 2015, 24, 7–17. [Google Scholar]
  21. Merhabi, F.; Amine, H.; Halwani, J. Evaluation de la Qualité des Eaux de Surface de la Rivière Kadicha. J. Sci. Liban. 2019, 20, 10–34. [Google Scholar] [CrossRef]
  22. Bernal-Meléndez, E. Toxicité Neuro-Développementale d’une Exposition Gestationnelle à La Pollution Atmosphérique: Effets à Court et à Long Terme de l’inhalation Répétée de Particules de Fumées de Diesel Chez Le Lapin. Insulter. Ph.D. Thesis, Université Paris-Saclay, Paris, France, 2019. [Google Scholar]
  23. Cotruvo, J. Évolution Des Normes de Potabilité: Le cas des Bromates. Tech. Sci. Méthodes 2010, 12, 63. [Google Scholar] [CrossRef]
  24. Hamdaoui, Q. Éveloppement d’un Dispositif d’exposition Contrôlé Pour l’étude de l’impact Neurotoxique de l’inhalation d’aérosols Modèles de Paraquat et de Nano-Objets de TiO2: Applications Aux Conditions Neurodéveloppementales et Neurodégénératives. Insulter. Ph.D. Thesis, Université de Lyon, Lyon, France, 2021. [Google Scholar]
  25. Tardif-Drolet, M.; Li, M.; Pabst, T.; Zagury, G.; Mermillod-Blodin, R.; Genty, R. TRevue de la Réglementation sur la Valorisation des Résidus Miniers Hors Site Au Québec. Exam. Environ. 2020, 28, 32–44. [Google Scholar]
  26. Saporta, G. Probabilités, Analyse des Données et Statistique; Editions Technip: Paris, France, 2006. [Google Scholar]
  27. Piper, A.M. A Graphic Procedure in the Geochemical Interpretation of Water-Analyses. Eos Trans. Am. Geophys. Union 1944, 25, 914–928. [Google Scholar] [CrossRef]
  28. Kahoul, M.; Touhami, M. Évaluation de la qualité physico-chimique des eaux de consommation de la ville d’Annaba (Algérie). LARHYSS J. P-ISSN 1112-3680/E-ISSN 2521-978 2014, 19. [Google Scholar]
  29. Yameogo, S. Ressources en eau Souterraine du Centre Urbain de Ouagadougou au Burkina Faso, Qualité et Vulnérabilité; Université Avignon et Pays de Vaucluse, Université Ouagadougou: Ouagadougou, Burkina Faso, 2008. [Google Scholar]
  30. Ahoussi, K.; Oga, Y.; Koffi, Y.; Kouassi, A.; Soro, N.; Biemi, J. Caractérisation hydrogéochimique et microbiologique des ressources en eau du site d’un Centre d’Enfouissement Technique (CET) de Côte d’Ivoire: Cas du CET de Kossihouen dans le District d’Abidjan (Côte d’Ivoire. Int. J. Biol. Chem. Sci. 2012, 5, 2524–2542. [Google Scholar] [CrossRef] [Green Version]
  31. Eblin, S. Dégradation des Ecosystèmes Environnementaux Dans la Région D’adiaké (Sud-est Côtier de la Côte d’Ivoire) et Risque de Pollution des Eaux: Apport D’un SiG. Ph.D. Thesis, Thèse de Doctorat Unique de L’université FHB, Abidjan, Côte d’Ivoire, 185. 2014. [Google Scholar]
  32. Dakoure, D. Etude Hydrogéologique et Géochimique de la Bordure Sud-est du Bassin Sédimentaire de Taoudeni (Burkina Faso-Mali): Essai de Modélisation. Ph.D. Thesis, Université Paris 6, Paris, France, 2003. [Google Scholar]
  33. Lghoul, M.; Maqsoud, A.; Hakkou, R.; Kchikach, A. Hydrogeochemical Behavior around the Abandoned Kettara Mine Site, Morocco. J. Geochem. Explor. 2014, 144, 456–467. [Google Scholar] [CrossRef]
  34. Vicat, J.-P.; Mvondoc, H.; Willems, L.; Pouclet, A. Phénomènes karstiques fossiles et actuels au sein des formations métamorphiques silico-alumineuses de la nappe panafricaine de Yaoundé (Sud-Cameroun). C. R. Acad. Sci. 2002, 334, 545–550. [Google Scholar]
  35. WHO. Guidelines for Drinking-Water Quality: Incorporating First Addendum, 3rd ed.; WHO: Geneva, Switzerland; Volume 1, 2006; Available online: https://www.Who.Int/WaterSanitAtionHealth/Dwq/Gdwq0506.Pdf2006 (accessed on 20 March 2022).
  36. Yao, K. Hydrodynamisme dans les aquifères de socle cristallin et Cristallophyllien du sud-Ouest de la Côte d’Ivoire: Cas du Département de soubré: Apports de la télédétection, de La géomorphologie et de l’hydrogéochimie. Ph.D. Thesis, Conservatoire national des arts et metiers-CNAM, Université de Cocody-Côte d’Ivoire, Abidjan, Côte d’Ivoire, 2009. [Google Scholar]
  37. Kuicha Apport de l’hydrochimie et l’isotope de l’environnement à la connaissance des ressources en eaux souterraines de Yaoundé. J. Appl. Biosci. 2013, 67, 5194–5208. [CrossRef] [Green Version]
  38. Abdou Babaye, M.S.; Sandao, I.; Saley, M.B.; Wagani, I.; Ousmane, B. Comportement hydrogéochimique et contamination des eaux des aquifères fissurés du socle précambrien en milieu semi-aride (Sud-Ouest du Niger. Int. J. Biol. Chem. Sci. 2017, 10, 2728. [Google Scholar] [CrossRef] [Green Version]
  39. Aboyeji, O.S.; Eigbokhan, S.F. Evaluations of groundwater contamination by leachates around Olusosun open dumpsite in Lagos metropolis, southwest Nigeria. J. Environ. Manag. 2016, 183, 333–341. [Google Scholar] [CrossRef]
  40. Wu, M.; Li, W.; Dick, W.A.; Ye, X.; Chen, K.; Kost, D.; Chen, L. Bioremediation of Hydrocarbon Degradation in a Petroleum-Contaminated Soil and Microbial Population and Activity Determination. Chemosphere 2017, 169, 124–130. [Google Scholar] [CrossRef]
  41. Matini, L.; Moutou, J.M.; Kongo-Mantono, M.S. Evaluation hydro-chimique des eaux souterraines en milieu urbain au Sud-Ouest de Brazzaville, Congo. Afr. Sci. Rev. Int. des Sci. et Technol. 2009, 5, 1. [Google Scholar] [CrossRef]
  42. Diabagaté, A.; Goula, T.A.; Soro, G.E. Hydrochimie des Eaux Souterraines de la Région du Poro-Côte d’Ivoire. Eur. Sci. J. 2019. [Google Scholar]
  43. Achour, S.; Tibermacine, A.; Chabbi, F. Le Fer et le Manganese Dans les Eaux Naturelles et Procedes D’oxydation Chimique. Cas Des Eaux Algeriennes. Larhyss J. P-ISSN 1112-3680/E-ISSN 2521-978 2017, 4, 139–154. [Google Scholar]
  44. Ahoudi, H.; Gnandi, K.; Tanouayi, G.; Ouro-Sama, K. Caractérisation Physico-Chimique et Etat de pollution par les élements traces métalliques des eaux souterraines de Lomé (Sud Togo): Cas du quartier Agoe Zongo. LARHYSS J. P-ISSN 1112-3680/E-ISSN 2521-978 2015, 41–56. [Google Scholar]
  45. Bougherira, N.; Hani, A.; Toumi, F.; Haied, N.; Djabri, L. Impact des Rejets Urbains et Industriels sur la Qualité des Eaux de La Plaine de La Meboudja (Algérie). Hydrol. Sci. J. 2017, 62, 1290–1300. [Google Scholar] [CrossRef]
  46. Amadou, H.; Laouali, M.S.; Manzola, A. Analyses physico-chimiques et bactériologiques des eaux de trois aquifères de la région de Tillabéry: Application des méthodes d’analyses statistiques multi variées. LARHYSS J. P-ISSN 1112-3680/E-ISSN 2521-978 2014, 20. [Google Scholar]
  47. Bouteraa, O.; Mebarki, A.; Nouaceur, Z.; Laignel, B. Hydrogeochimie, et Variations Spatio-Temporelles de la Qualite des Eaux Souterraines dans le Bassin Versant de Boumerzoug-Nord est ALGERIE; Sciences & Technologie. D, Sciences de la terre: Constatine, Algérie, 2018; pp. 31–41. [Google Scholar]
  48. Jourda, J.P.; Kouamé, K.J.; Saley, M.B.; Kouadio, B.H.; Oga, Y.S.; Deh, S. Contamination of the Abidjan Aquifer by Sewage: An Assessment of Extent and Strategies for Protection. In Groundwater Pollution in Africa; CRC Press: Boca Raton, FL, USA, 2006; pp. 305–314. [Google Scholar]
  49. Mbawala, A.; Abdou, A.; Ngassoum, M.B. Evaluation de la Pollution Physico-Chimique et Microbienne des Eaux de Puits de Dang-Ngaoundéré (Cameroun). Int. J. Biol. Chem. Sci. 2010, 4, 6. [Google Scholar] [CrossRef] [Green Version]
  50. Yapo, O.; Mambo, V.; Seka, A.; Ohou, M.J.A.; Konan, F.; Gouzile, V.; Tidou, A.; Kouame, K.; Houenou, P. Evaluation de La Qualité des Eaux de Puits à Usage Domestique Dans les Quartiers Défavorisés de Quatre Communes d’Abidjan (Côte d’Ivoire): Koumassi, Marcory, Port-Bouet et Treichville. Int. J. Biol. Chem. Sci. 2010, 4, 2. [Google Scholar] [CrossRef] [Green Version]
  51. Youmbi, B.S.; Zékeng, S.; Domngang, S.; Calvayrac, F.; Bulou, A. An Ab Initio Molecular Dynamics Study of Ionic Conductivity in Hexagonal Lithium Lanthanum Titanate Oxide La 0.5 Li 0.5 TiO 3. Ionics 2012, 18, 371–377. [Google Scholar] [CrossRef]
  52. Kanohin, F.; Otchoumou, E.; Yapo, O.B.; Dibi, B.; Bonny, A.C. Caractérisation Physico-Chimique et Bactériologique des Eaux Souterraines de Bingerville. Int. J. Biol. Chem. Sci. 2017, 11, 2495–2509. [Google Scholar] [CrossRef] [Green Version]
Figure 1. Geographic location of Faso (a) and the Cascades region with sampling points (b) (Google Earth, 2022; BNDT, 2012).
Resources 11 00061 g001
Figure 2. Geology of the Cascades region (MCA, 2014).
Resources 11 00061 g002
Figure 3. Relief of the Cascades region (ASTER GDEM, IGB, 2012).
Resources 11 00061 g003
Figure 4. Distribution of major cations in the Cascades region.
Resources 11 00061 g004
Figure 5. Distribution of major anions in the Cascades region.
Resources 11 00061 g005
Figure 6. Distribution of the principal minor ions in the Cascades region.
Resources 11 00061 g006
Figure 7. Plot of the collapse line for the selection of principal components.
Resources 11 00061 g007
Figure 8. Principal component analysis of physico-chemical data. Projection of the point cloud in space.
Resources 11 00061 g008
Figure 9. Piper diagram of groundwater in the Cascades region.
Resources 11 00061 g009
Figure 10. Germs in the water of some boreholes.
Resources 11 00061 g010
Figure 11. Groundwater potability map of the Cascades region.
Resources 11 00061 g011
Table 1. Physico-chemical characteristics of the borehole water studied.
VariableHard-Rock AquifersSedimentary Aquifers
NumberMinMaxMeanSD 1NumberMinMaxMeanSD
Temperature (°C)4525.133.129.02.81329.831.630.80.6
pH456.37.46.80.3135.57.16.10.4
EC at 25 °C (µS/cm)4522.2514.0205.289.41310.7314.050.181.5
Turbidity (NTU)450.289.47.619.0130.48.93.43.2
Ca2+ (mg/L)451.440.620.48.5132.639.18.19.8
Mg2+ (mg/L)453.522.812.14.5131.510.63.63.1
Na+ (mg/L)450.946.913.78.3130.56.21.31.6
K+ (mg/L)450.215.33.22.7130.29.32.93.3
Fe2+ (mg/L)450.04.20.30.8130.00.20.10.1
NH4+ (mg/L)450.00.300.1130.00.100
HCO3 (mg/L)4526.8321.2147.351.51313.4154.940.039.0
Cl (mg/L)450.13.31.31.0131.04.12.40.9
S042− (mg/L)451.012.02.72.213039.03.810.6
PO43- (mg/L)450.22.50.80.5130.21.00.30.2
NO3 (mg/L)450.411.42.52.2130.92.21.50.3
NO2 (mg/L)450.00.10.00.0130.00.00.00.0
P (mg/L)450.10.80.30.2130.10.30.10.1
F (mg/L)450.02.60.30.4130.00.50.20.1
Zn (µg/L)450.02.20.10.4130.01.60.20.4
Mn (mg/L)450.0101.02.315.0130.00.10.00.0
As (µg/L)451.05.21.10.6131.01.01.00.0
1: Standard Deviation.
Table 2. Correlation matrix.
pHECTurbidityCa2+Mg2+Na+K+Fe2+MnNH4+HCO3AsClSO42–PO43−NO3NO2PFT (°C)Zn
T (°C)−0.25−0.270.07−0.26−0.27−0.230.04−0.040.100.40−0.32−0.090.740.10−0.13−0.01−0.18−0.12−0.251.000.13
pH1.000.64−0.010.520.570.63−0.130.020.080.040.670.23−0.19−0.040.20−0.050.060.210.24−0.25−0.09
EC0.641.000.090.840.830.800.000.130.080.160.960.18−0.280.380.15−0.05−0.020.150.56−0.270.19
Turbidity−0.010.091.000.02−0.030.11−0.040.940.040.420.05−0.04−0.080.00−0.18−0.030.00−0.18−0.010.070.24
Ca2+0.520.840.021.000.610.59−0.060.060.110.020.850.12−0.170.400.18−0.12−0.070.190.31−0.260.08
Mg2+0.570.83−0.030.611.000.620.10−0.040.050.050.870.13−0.400.170.200.210.180.200.43−0.270.15
Na+0.630.800.110.590.621.00−0.210.150.06−0.020.850.42−0.160.150.08−0.12−0.150.080.57−0.230.01
K+−0.130.00−0.04−0.060.10−0.211.00−0.05−0.010.21−0.03−0.10−0.160.30−0.100.590.55−0.110.050.040.16
Fe2+0.020.130.940.06−0.040.15−0.051.000.020.330.080.00−0.13−0.02−0.14−0.050.00−0.140.03−0.040.19
Mn0.080.080.040.110.050.06−0.010.021.000.130.09−0.020.19−0.020.02−0.06−0.010.020.030.10−0.04
NH4+0.040.160.420.020.05−0.020.210.330.131.000.01−0.080.170.28−0.130.02−0.01−0.13−0.010.400.39
HCO30.670.960.050.850.870.85−0.030.080.090.011.000.25−0.320.250.170.000.020.170.53−0.320.07
As0.230.18−0.040.120.130.42−0.100.00−0.02−0.080.251.000.02−0.02−0.14−0.06−0.04−0.13−0.05−0.090.00
Cl−0.19−0.28−0.08−0.17−0.40−0.16−0.16−0.130.190.17−0.320.021.000.01−0.18−0.20−0.27−0.18−0.080.74−0.01
SO42–−0.040.380.000.400.170.150.30−0.02−0.020.280.25−0.020.011.00−0.12−0.07−0.09−0.130.300.100.46
PO43−0.200.15−0.180.180.200.08−0.10−0.140.02−0.130.17−0.14−0.18−0.121.00−0.03−0.171.00−0.05−0.13−0.15
NO3−0.05−0.05−0.03−0.120.21−0.120.59−0.05−0.060.020.00−0.06−0.20−0.07−0.031.000.63−0.03−0.07−0.010.03
NO20.06−0.020.00−0.070.18−0.150.550.00−0.01−0.010.02−0.04−0.27−0.09−0.170.631.00−0.17−0.11−0.180.06
P0.210.15−0.180.190.200.08−0.11−0.140.02−0.130.17−0.13−0.18−0.131.00−0.03−0.171.00−0.04−0.12−0.15
F0.240.56−0.010.310.430.570.050.030.03−0.010.53−0.05−0.080.30−0.05−0.07−0.11−0.041.00−0.250.00
Zn−0.090.190.240.080.150.010.160.19−0.040.390.070.00−0.010.46−0.150.030.06−0.150.000.131.00
Table 3. Variances and cumulative eigenvalues of principal component analysis of major ions in groundwater samples.
TotalVariance (%)Cumulative
Variance (%)
Component 18.0430.9330.93
Component 22.9511.2542.18
Component 32.047.850.04
Component 41.897.2957.33
Component 51.867.1664.49
Component 61.435.5170.01
Component 71.244.7974.81
Component 81.144.3279.13
Table 4. Statistical parameters of the saturation indexes (SI).
VariableMinimumMaximumMeanSD
SI Calcite−3.840−0.170−1.5380.953
pHs calcite7.4109.6608.1600.630
SI Aragonite−3.980−0.310−1.6780.953
pHs aragonite7.5509.8008.3000.630
SI Dolomite−8.210−0.830−3.4461.877
pHs dolomite7.5809.7608.3450.615
SI Gypsum−4.960−2.040−3.7120.501
SI Anhydrite−5.160−2.920−3.9480.449
Publisher’s Note: MDPI stays neutral with regard to jurisdictional claims in published maps and institutional affiliations.

