Article

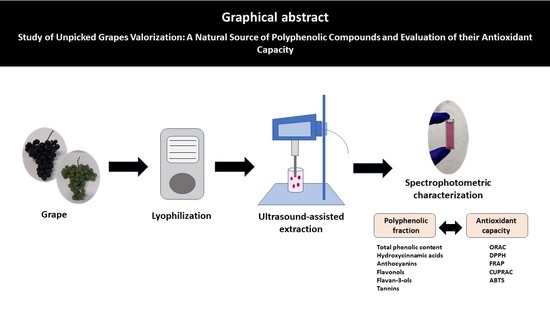
Study of Unpicked Grapes Valorization: A Natural Source of Polyphenolic Compounds and Evaluation of Their Antioxidant Capacity

by
Edurne Elejalde
1,*,
María Carmen Villarán
1,
Iratxe Lopez-de-Armentia
1,
Daniel Ramón
1,
Raquel Murillo
1 and
Rosa María Alonso
2
1
TECNALIA, Basque Research and Technology Alliance (BRTA), Parque Tecnológico de Álava, c/Leonardo Da Vinci 11, 01510 Miñano, Álava, Spain
2
Analytical Chemistry Department, Faculty of Science and Technology, University of the Basque Country (UPV/EHU), P.O. Box 644, 48080 Bilbao, Vizcaya, Spain
*
Author to whom correspondence should be addressed.
Resources 2022, 11(3), 33; https://doi.org/10.3390/resources11030033
Submission received: 26 January 2022 / Revised: 9 March 2022 / Accepted: 16 March 2022 / Published: 21 March 2022
(This article belongs to the Special Issue Food Waste Prevention: Reduction, Reuse and Recycling)

Abstract

:
Every year great amounts of high-quality wine grapes are left on the vine unpicked, and consequently lost, to control the overproduction in wine areas with limited appellation production yield. In the context of circular bioeconomy, the valorization of these grapes as a potential source of natural antioxidants is of great interest. The study carried out is focused on the polyphenolic profile characterization of different unpicked grape varieties using the ultrasound-assisted extraction technique to extract the polyphenolic fractions. Moreover, the evaluation of the antioxidant capacity by several assays was carried out: oxygen radical absorbance capacity (ORAC), stability of 2,2-diphenyl-1-picrylhydrazyl radical (DPPH), ferric reducing antioxidant capacity (FRAP), cupric reducing antioxidant capacity (CUPRAC) and stability of 2,2′-azino-bis(3-ethylbenzothiazoline-6-sulfonic acid) radical (ABTS) assays. The results showed a strong relationship between total phenolic content and hydroxycinnamic acids (R2 = 0.9088) followed by flavan-3-ols (R2 = 0.8792) and tannins (R2 = 0.7705). The antioxidant capacity of the grapes was dependent on the total phenolic content. These results supply new information for a better understanding of the importance of giving an added value to the unpicked grapes due to their high content of polyphenols. These findings help the wine sector to consider the valorization of the unpicked grapes, classified as wastes, as an interesting source of natural antioxidants to be used as food supplements and with potential applications in the pharmaceutical industry.

Graphical Abstract

1. Introduction

Polyphenols are a group of phytochemicals with important roles in the prevention of many chronic noncommunicable diseases [1]. They are widely distributed in the plant kingdom, mainly in fruits and vegetables, and more than 8000 structures have already been identified [2]. Polyphenols are characterized by the presence in their chemical structure of at least one phenolic group capable of reducing reactive oxygen species, some organic substrates and minerals. These redox properties explain the considerable interest of polyphenols in the prevention of several major chronic diseases associated with oxidative stress, such as cardiovascular diseases, cancer, type II diabetes, neurodegenerative diseases or osteoporosis [3,4].
Among foods, grape is one of the most popular fruits in the world and one with the highest polyphenol content [4,5,6,7,8]. Moreover, grape cultivation is one of the most extended agroeconomic activity in the world. In 2020, the total surface of 7.3 million hectares was under vineyards throughout the world with a global grape production of 77.8 million tons: 57% wine grapes, 36% table grapes and 7% dried grapes [9]. Regarding grapes cultivated for wine making, every year great amounts of high-quality grapes of diverse varieties are left on the vine unpicked to control the grape overproduction in different wine areas with limited appellation production yield. Wine sales being down in these last few seasons because of COVID-19 have also contributed to this situation [10]. In the context of circular bioeconomy [11,12,13], the valorization of these grapes generated by the wine sector as food wastes is of great interest. It is necessary to characterize these by-products to evaluate their applicability as natural resources of bioactive compounds such as polyphenols to produce added-value extracts to be used as antioxidants [14].
Grape phenolic compounds are differentially distributed in stalk, skin, pulp and seeds [7]. Many studies are focused on the quantification of polyphenols in different parts of the grapes, but investigations analyzing the different polyphenolic fractions in grapes as a whole are scarce [15]. Considering that the beneficial health effects related to grapes correspond to the whole fruit, the analysis of different polyphenolic fractions that contribute to total polyphenolic content and antioxidant capacity in the total grape is relevant.
The analysis of grape polyphenols needs an initial extraction step. Polyphenol extraction is complicated as polyphenols are confined to the plant vacuoles [16]. An advanced technique for polyphenol extraction with high recovery yields is ultrasound-assisted extraction (UAE) [17]. The breakdown of cell walls produced by cavitation in UAE improves diffusion rates [18]. Furthermore, UAE has high reproducibility, is simple to be manipulated and needs low temperature, low solvent consumption and low energy input [19]. Therefore, UAE represents an excellent green extraction technique to extract functional compounds [20] such as polyphenols.
Precisely, polyphenols are included in the group of bioactive compounds due to their antioxidant capacity. An antioxidant is a substance that reduces the severity of oxidative stress. It forms a less active radical or it quenches the chain reaction produced by free radicals on substrates as proteins, lipids, carbohydrates or DNA [21,22]. These capacities explain the interest of antioxidants in the prevention of major chronic diseases associated with oxidative stress [3,4].
The antioxidant capacity of a natural product has no single “universally accepted” assay to quantitatively evaluate all actions of a putative antioxidant [23]. Therefore, to study the antioxidant capacity of a sample, more than a unique assay should be conducted. Many in vitro methods can be found in the literature to evaluate the effectiveness of antioxidant compounds in different matrices. Two main groups of methods are widely used: (1) hydrogen atom transfer reactions (HAT) and (2) transfer reactions of a single electron (SET) [24]. HAT assays include the oxygen radical absorbance capacity (ORAC), inhibition of lipoperoxidation, crocin bleaching assay and β-carotene bleaching assay. Similarly, SET methods are composed of cupric-ion reducing antioxidant capacity (CUPRAC), ferric reducing ability of plasma (FRAP), Folin–Ciocalteus’ phenol reagent reducing ability, scavenging effects in relation to 1,1-diphenyl-2-picrylhydrazyl (DPPH) and 2,2′-azino-bis (3-ethylbenzothiazoline-6-sulphonic acid (ABTS) among others [25,26]. Nevertheless, the most used methods for antioxidant capacity for polyphenolic extracts obtained from vegetable products are DPPH, FRAP and ABTS.
To date, no research has been focused on the unpicked wine grapes that remain unused and left to rot at the vineyard. The very little research related to grape wastes has been principally focused on unripe grapes derived from cluster thinning [27,28,29,30,31]. Therefore, to address this gap, the characterization of the grapes considered as wastes as they are left on the vine after harvest was carried out in this work. The aim of this study was to give them an added value with a sustainable winery view and to evaluate their potential use as a source of bioactive compounds. Moreover, the study was focused on different grape varieties to evaluate the differences in the polyphenolic profile among varieties.
This investigation included the preliminary evaluation of the polyphenolic profile by simple spectrophotometric methods of different grape varieties from several wine areas, the analysis of the antioxidant capacity by different assays and the study of the relationship of the different polyphenolic fractions with the obtained antioxidant capacity. Furthermore, this work included an easy-to-perform ultrasound-assisted extraction method capable of extracting the most representative polyphenolic fractions from whole red and white grape varieties.

2. Materials and Methods

2.1. Chemicals

Folin–Ciocalteu´s phenol reagent, ethanol, sodium carbonate, hydrochloric acid, ammonium sulphate, methanol, potassium dihydrogen phosphate, di-potassium hydrogen phosphate, sodium acetate and ammonium acetate buffer were analytical grade from Scharlab (Barcelona, Spain). 2,2′-azobis-(2-amidino-propane) dihydrochloride (AAPH), acetic acid, 2,4,6-tris (2-pyridyl)-s-triazine (TPTZ), ferric chloride, cupric chloride, neocuproine (Nc), fluorescein sodium salt, potassium persulfate, 4-(dimethylamino) cinnamaldehyde (DMAC) and methyl cellulose were analytical grade purchased from Merck Life Science (Madrid, Spain). 6-hydroxy-2,5,7,8-tetramethylchroman-2-carboxylic acid (trolox) with 97% purity and 2,2′-azino-bis(3-ethylbenzothiazoline-6-sulphonic acid) radical cation (ABTS•+) with 98% purity were also purchased from Merck Life Science (Madrid, Spain). The standards gallic acid (GA), caffeic acid (CA), quercetin (Q), (+)-catechin (C) and (−)-epicatechin (E) with purities ≥95% were also purchased from Merck Life Science (Madrid, Spain). Caftaric acid with >98% purity was supplied by Phytoplan (Heidelberg, Germany. Finally, 2,2-diphenyl-1-picrylhydrazyl (DPPH) was provided by Fisher Scientific (Madrid, Spain). Aqueous solutions were prepared using purified water.

2.2. Sample Preparation

In total, 13 native red and white grape varieties (Vitis vinifera) cultivated in the north of Spain in 3 different wine appellations were selected for this study. The grapes were collected at season 2020 one week after the harvest time starting established by the winery for each grape variety, considering their optimal grape maturity point. The samples for this study were, therefore, the unharvested grapes left to rot on the vine to obey the limited appellation production yield. All these grapes were at their optimal maturity point and of high quality as they were initially destined for winemaking. A portion of each grape variety was crushed by hand to obtain the must for the physicochemical parameters. The rest of grape bunches were immediately frozen in liquid nitrogen, the stalks were removed, the whole grape berries were ground and lyophilized (Lyobeta 25; Telstar, Terrassa, Barcelona, Spain) until ultrasound-assisted extraction.

2.3. Ultrasound-Assisted Extraction

The conditions for the ultrasound-assisted extraction were established according to the literature [32,33] in a Bioblock Scientific Vibra Cell VCX 750 sonicator (Sonde standard 13 mm, Fisher Scientific, Madrid, Spain) at a frequency of 20 KHz. In total, 2 g of each grape powder together with 100 mL of hydroalcoholic solvent (50% v/v in ethanol) were placed in a beaker and sonicated for 20 min. After treatment the polyphenolic extract was centrifuged (5810R Eppendorf; Merck Life Science, Madrid, Spain) at 4000 g for 5 min, filtered through 0.45 µm filter and stored at 4 °C before analysis. The characterization of this grape polyphenolic extract included the analysis of the different polyphenolic fractions and the evaluation of the antioxidant capacity by several assays.

2.4. Grape Physicochemical Parameters

pH, total soluble solids and titratable acidity were measured as control parameters in the grape musts to determine the grape maturity. The pH was analyzed with a pH-meter (Basic 20; Crison Instruments S.A., Alella, Barcelona, Spain). The total soluble solids were analyzed using a refractometer (ATAGO N-1E; Tokyo, Japan) and the values were expressed as Brix degree. Titratable acidity was estimated according to the official method [34]. The results of titratable acidity were expressed as g/L of tartaric acid.

2.5. Polyphenolic Fractions Analysis

2.5.1. Total Phenolic Content

The total phenolic content (TPC) was tested using Folin–Ciocalteu assay [35]. Briefly, 20 µL of appropriately diluted sample was mixed thoroughly with 100 µL of 10% Folin–Ciocalteu’s phenol reagent in wells of a 96-well microplate and 80 µL sodium carbonate solution of 75 g/L. After 90 min in darkness at room temperature, the absorbance was measured at 750 nm in the microplate photometer (Multiskan™ FC; Fisher Scientific, Madrid, Spain). The concentration was expressed as milligrams of gallic acid equivalents (GAE) per 100 g of dry matter (dm) grape sample based on a standard curve of gallic acid.

2.5.2. Hydroxycinnamic Acid Derivatives and Flavonols

The determination of this polyphenolic fraction was carried out according to Mazza et al., 1999 [36] with minor modifications. Aliquots of 0.5 mL of appropriately diluted samples were mixed with 0.5 mL of an ethanolic solution with hydrochloric acid 0.1% and 9.1 mL of an ethanolic solution with hydrochloric acid 2%. Absorbance was determined after 15 min at 280 nm and 360 nm for hydroxycinnamic acid derivatives and flavonols, respectively. The calibration curves were made of caffeic acid in 10% ethanol solution for hydroxycinnamic acid derivatives and of quercetin in 95% ethanol solution for flavonols. The concentration of hydroxycinnamic acid derivatives were expressed in mg of caffeic acid equivalents (CAE) per gram of dry matter grape sample. The concentration of flavonols derivatives were expressed in mg of quercetin equivalents (QE) per gram of dm grape sample.

2.5.3. Flavan-3-ols

The method used was based on the reaction between flavan-3-ols and 4-(dimethylamino) cinnamaldehyde (DMAC) described in bibliography [37]. A volume of 1.25 mL of DMAC solution at 5.7 mM was added to 0.25 mL diluted sample. Absorbance measurements were recorded at 640 nm after 10 min. The calibration curve was made of (+)-catechin and results were expressed in mg of catechin equivalents (CE) per gram of dm grape sample.

2.5.4. Total Anthocyanins

For total anthocyanin analysis, the grape extract was diluted with a solution of ethanol:water:hydrochloric acid 37% 70:30:1 v/v/v [38] and the absorbance was measured immediately at 540 nm. The final results were expressed as malvidin-3-glucoside equivalents (ME) in mg per gram of dry matter calculated from the following equation: C (mg/L) = A540 nm × 26.6 × d where, A540 nm is the absorbance at 540 nm and d is the dilution [38].

2.5.5. Tannins

The method was based on the tannins precipitation with methyl cellulose [39]. A volume of 1 mL of appropriately diluted sample was mixed with 6 mL of water, 1 mL of methyl cellulose 0.04% and 2 mL of ammonium sulphate. For the blank, the sample aliquot and the methyl cellulose were replaced by water. After 10 min of reaction at room temperature, the samples were centrifuged and the absorbance was determined at 280 nm. The results were expressed in mg of epicatechin equivalents (EE) per gram of dm grape sample.

2.6. Antioxidant Capacity Determination

2.6.1. ORAC Assay

The oxygen radical absorbance capacity value of the different extracts was measured according to the literature [40]. The assay extracts were diluted in ORAC buffer (potassium phosphate buffer, consisting of potassium dihydrogen phosphate and di-potassium hydrogen phosphate at pH 7.4) and a trolox standard curve (0–100 µM) was prepared. At the day of analysis, 175 mM fluorescein and 153 mM trolox equivalents (TE) solutions were prepared in ORAC buffer. A 96-well black microplate was prepared containing 150 µL of fluorescein solution. Then, 25 µL of blank (ORAC buffer) standard or sample was added. The plate was incubated at 37 °C during 30 min. After incubation, 25 µL of freshly prepared AAPH solution was quickly added. Readings of fluorescence were measured every min for 1 h using a DTX 880 multimode detector, Beckman Coulter (Brea, CA, USA) (excitation wavelength of 485 nm and emission wavelength of 530 nm). The results were expressed as µmol trolox equivalents (TE)/g dm.

2.6.2. DPPH Radical Scavenging Activity

The scavenging capacity of the extract was evaluated by DPPH method based on the stability of 2,2-diphenyl-1-picrylhydrazyl radical [41] with some modifications. An aliquot of appropriately diluted 50 µL sample was added to 2.950 mL of a 0.1 mM methanolic (80%) DPPH radical solution, vortex mixed and incubated in dark for 30 min at room temperature. After incubation, the absorbance was measured at 515 nm in a spectrophotometer (Lambda 365 UV/VIS; Perkin Elmer, Madrid, Spain). Trolox was used as the reference compound. The results were expressed in µmol trolox equivalents (TE)/g dm.

2.6.3. FRAP Assay

The ferric reducing antioxidant capacity assay was used according to bibliography [42] with minor modifications. FRAP reagent, consisting of a mixture of sodium acetate-acetic acid buffer (300 mM, pH 3.6), TPTZ (10 mM in 40 mM hydrochloric acid) and ferric chloride solution (20 mM) at a volume ratio of 10:1:1, was freshly prepared and put in a water bath at 37 °C before use. Aliquots of 100 µL appropriately diluted sample were mixed with 3 mL FRAP reagent. After incubation for 4 min, the absorbance of the mixture was determined at 593 nm. The results were expressed in µmol trolox equivalents (TE)/g dm.

2.6.4. CUPRAC Assay

The cupric reducing antioxidant capacity assay was performed using the classical method [43] with small modifications and conducted in a 96-well microplate. Briefly, to each well was sequentially added 50 µL of cupric chloride (10 mM in water), 50 µL of neocuproine at 7.5 mM in 96% ethanol, 50 µL of ammonium acetate buffer (1 mM in water, pH 7.0), 25 µL of appropriately diluted sample and 25 µL of double distilled water. The microplates were then incubated in the dark at room temperature for 30 min and after the values of absorbance were recorded at 450 nm against blank (all reagents except cupric chloride) in the microplate reader detailed before. A calibration curve was made using the commercial compound trolox as standard and the results were expressed in µmol trolox equivalents (TE)/g dm.

2.6.5. ABTS Method

Another method to determine the antioxidant capacity was the ABTS•+ (radical cation) decolorization assay [44] with some modifications. The ABTS•+ stock solution was prepared by mixing ABTS (7 mM) solution and potassium persulfate (2.45 mM) in a volume ratio of 1:1. This solution was incubated in a dark at room temperature for at least 16 h. The working solution was prepared diluting the ABTS stock solution with ethanol to an absorbance of 0.710 ± 0.050 units at 734 nm using the same spectrophotometer as mentioned above. Samples were previously diluted and 100 µL of each sample was mixed with 3.8 mL ABTS working solution at room temperature and the absorbance of the mixture was determined at 734 nm after 6 min. The results were expressed in µmol trolox equivalents (TE)/g dm.

2.7. Statistical Analysis

Results are reported as mean ± standard deviation (SD) values. For each grape variety three independent extracts were performed and three analyses for each parameter were made. Data were analyzed by one-way ANOVA and the Fisher‘s least significant difference (LSD) test to estimate the differences between values for the sample tested, where statistical significance was declared at p value < 0.05. Correlations between the polyphenolic fractions and the antioxidant capacity were determined using linear regression analysis. Differences were considered significant at p value < 0.05. Multivariate analysis principal component analysis (PCA) was also applied to the results. Statgraphics Centurion XVII software was used for statistical analysis.

3. Results and Discussion

3.1. Grape Physicochemical Parameters

In Table 1 the grape physicochemical control parameters are collected.
Although grapes were on the vine unpicked during one week after the harvest time starting, the physicochemical parameters showed common values according to healthy grapes suitable for winemaking and at their optimal maturity point. All the grapes were bunches initially destined for winemaking, and therefore of identical high quality. The results show important inherent but usual differences among all the grape varieties which suggest different polyphenolic profiles and antioxidant capacities. All the samples for this study were at the optimal maturity point established by the wineries.

3.2. Polyphenolic Fractions

The results for all the polyphenolic fractions are presented in Table 2.
The total phenolic content (TPC) ranged from 13.87 ± 0.43 to 24.95 ± 1.07 mg gallic acid equivalents (GAE)/g dm for red grapes and 4.69 ± 0.21 to 24.97 ± 0.26 mg GAE/g dm for white grapes. Among all the grape varieties, a white variety had the highest value in TPC with 24.97 ± 0.26 mg GAE/g dm. These results agree with those previously reported [45,46]. The first study showed TPC values between 92.89 to 100.45 mg GAE/100 g fresh grape for red varieties and a higher total phenolic content in white grape varieties with values between 50.79 to 141.72 mg GAE/100 g for white varieties [45]. In the other study the range for fresh grapes went from 0.294 mg GAE/g fresh weight (fw) for a red grape variety to 1.407 mg GAE/g fw for a white grape variety [46]. In any case, it must be considered that the total phenolic content in different grapes may vary depending on the cultivar, the ripening stage or the environmental conditions [47,48].
Among all the polyphenolic fractions, hydroxycinnamic acids were after the condensed tannins the most abundant polyphenols both in white and red grape varieties. This could be due to the UV-visible method used that can overquantify the total hydroxycinnamic acids. Nevertheless, these are the most extended methods used for grape analysis. Anyway, the data were according to the published data for other grape varieties at maturity state with hydroxycinnamic total amount of 221.7–810 mg/g dried skin [49]. Since grape skin represents 5–10% of the grape berry weight, the results are according to the total amount of hydroxycinnamic acids. In our study, the content in red grapes was between 9.26 ± 0.21 mg caffeic acid equivalents (CAE)/g dm to 20.40 ± 0.16 mg CAE/g dm and 2.74 ± 0.09 mg CAE/g dm to 14.71 ± 0.50 mg CAE/g dm in white grapes.
Regarding anthocyanins, the total amount in red grapes was between 1.06 ± 0.03 mg malvidin equivalents (ME)/g dm to 11.19 ± 0.15 mg ME/g dm. As it can be seen, there were quantitative differences in total anthocyanins for red grapes. The concentrations are according to results for several authors with a range of 0.98 ± 0.11 to 1.31 ± 0.08 mg anthocyanins/g dry whole grape [15], or 1582.59 ± 77.38 to 2271.31 ± 50.33 mg total anthocyanins/kg [50].
The concentration of flavonols ranged from 0.61 ± 0.02 to 1.95 ± 0.02 mg quercetin equivalents (QE)/g dm for red grapes and between 0.49 ± 0.02 to 0.85 ± 0.01 mg QE/g dm for white grapes. These concentrations are according to results found in literature with a range of 191.43 ± 25.68 to 279.64 ± 15.54 mg total flavonols/kg for a red grape variety [50].
With respect to flavan-3-ols, the content in red grapes ranged from 1.47 ± 0.01 to 3.53 ± 0.09 mg catechin equivalents (CE)/g dm and 0.47 ± 0.01 to 4.77 ± 0.16 mg CE/g dm for white grapes. The results were according to the literature [51] with a total amount (skin, flesh and seeds) of flavan-3-ols of 3323 mg/Kg fresh weight (fw) for a white grape variety and 3263 mg/Kg fw for a red variety.
Concerning tannins, the concentration was between 13.95 ± 0.66 and 32.39 ± 0.25 mg epicatechin equivalents (EE)/g dm for red grape varieties and between 4.81 ± 0.06 and 18.37 ± 0.40 mg EE/g dm for white grape varieties.
Regarding the polyphenolic profile, the total polyphenolic content and hydroxycinnamic acids showed a relatively strong relationship (R2 = 0.9088, with a level of significance of 95%). In fact, the hydroxycinnamic acids represent among the polyphenolic groups the one with the highest correlation with TPC. The hydroxycinnamic acids are followed by the flavan-3-ols (R2 = 0.8792) and tannins (R2 = 0.7705) with a moderately strong relationship. Finally, the flavonols (R2 = 0.4968) and anthocyanins (R2 = 0.3100) have a relatively weak relationship.

3.3. Antioxidant Capacities

The antioxidant capacity measured by different assays is presented in Table 3.
When the ORAC assay was used, the ranges were of 254.94 ± 12.06 to 412.90 ± 9.67 µmol trolox equivalents (TE)/g dm for the red grape varieties and 102.28 ± 2.22 to 440.11 ± 39.33 µmol TE/g dm for the white grape varieties. The highest and the lowest result were found in two white grape varieties.
The DPPH values were in the range of 72.95 ± 2.21 to 230.67 ± 11.71 µmol trolox equivalents (TE)/g dm for the red grape varieties and 29.50 ± 1.57 to 206.80 ± 10.45 µmol TE/g dm for the white grape varieties. The highest total antioxidant capacity by the DPPH assay was found in a red grape variety but the lowest antioxidant capacity was obtained in a white grape variety. From this result can be concluded that the specific composition of the grape variety determines the antioxidant capacity value.
For the FRAP assay, the ranges were of 54.43 ± 0.34 to 124.38 ± 2.06 µmol trolox equivalents (TE)/g dm for the red grape varieties and 14.36 ± 0.33 to 114.06 ± 10.44 µmol TE/g dm for the white grape varieties. The grape variety with the lowest value for antioxidant capacity by the FRAP assay also gave the lowest value when measured by the DPPH assay. Additionally, the ranking of the antioxidant capacity value by the FRAP assay for all the grape varieties was very similar to the ranking of the antioxidant capacity measured by the DPPH assay.
Regarding the CUPRAC assay, the results were in the range of 96.24 ± 1.23 and 201.78 ± 8.91 µmol trolox equivalents (TE)/g dm for the red grape varieties and between 45.54 ± 2.63 and 189.49 ± 8.21 µmol TE/g dm for the white grape varieties. No results by other authors have been found for the whole grape. The only results found are the ones obtained in the grape seeds in the range of 1357 and 1707 µmol TE/g fresh weight [52].
The antioxidant capacity by the ABTS assay ranged between 155.79 ± 8.91 to 220.82 ± 4.48 µmol trolox equivalents (TE)/g dm for red grape varieties and between 129.87 ± 13.49 to 288.75 ± 1.26 µmol TE/g dm for the white grape varieties. In this case, and when referred to the white grape varieties, the antioxidant capacity rank was the contrary to the antioxidant capacity measured by DPPH and FRAP. The highest antioxidant capacity by the DPPH or the FRAP assay gave the lowest antioxidant capacity for the ABTS assay. With red grape varieties, the results were similar to the white grape varieties. The lower antioxidant capacity by the DPPH and the FRAP assays, the higher for the ABTS assay. These results are consistent with the literature [53], although they are referred to grape seeds with a range of 185.2 ± 5.9 µmol TE/g and 206.3 ± 7.7 µmol TE/g for two Portuguese red grape varieties. It must be considered that, as detailed before, each antioxidant capacity assay evaluates a specific action.
In any case, both white and red grape varieties displayed different antioxidant capacities regardless of the assay method used for the evaluation. Their capacities are related directly to TPC. These results are according to previous literature reports on other grape varieties [54]. In our work a strong correlation was observed between total polyphenolic content and antioxidant capacity. Nevertheless, the interpretation of results must be carried out with care, as the data result from the combination and synergetic effect of all the constituents of the polyphenolic extracts obtained from grapes. Compounds belonging to other chemical groups may also contribute to these results [55].

3.4. Correlation of Polyphenolic Profiles and Antioxidant Capacity

High correlation coefficients were found between the ORAC vs. TPC (R2 = 0.9119), DPPH vs. TPC (R2 = 0.9124), as well as between FRAP vs. TPC (R2 = 0.9511) with a level of significance of 95% (p < 0.05). High correlation coefficients were also found between CUPRAC vs. TPC (R2 = 0.9333) and ABTS vs. TPC (R2 = 0.9576) with a level of significance of 95% (p < 0.05). Data shown in Figure 1a–e.
The correlation analysis demonstrated that the antioxidant capacity of the grapes, independently the variety, was dependent on the total polyphenolic content. The correlations were higher than the results reported in the literature [46]. In all the antioxidant capacity assays higher correlations were obtained for white grape varieties (R2 = 0.9845 for DPPH vs. TPC, R2 = 0.9864 for FRAP vs. TPC and R2 = 0.9947 for CUPRAC vs. TPC, R2 = 0.9815 for ABTS vs. TPC) in comparison to red grape varieties (R2 = 0.7836, R2 = 0.8752, R2 = 0.7594 and R2 = 0.8542 for DPPH vs. TPC, FRAP vs. TPC, CUPRAC vs. TPC and ABTS vs. TPC, respectively). Nevertheless, these high correlations between TPC and antioxidant capacity in grapes as a whole suggest that it is feasible to use TPC to evaluate the antioxidant capacity in white and red grape varieties. The good correlation between the DPPH, FRAP, CUPRAC and ABTS and TPC can be rationalized considering that these assays rely on similar reaction mechanisms involving electron transfer. These results agree in both red and white grape varieties. The mechanisms by which phenolic compounds are able to scavenge free radicals are not exactly established. Nevertheless, the basic structure of compounds and other structural factors seem to be essential in the scavenging mechanism [56,57].
The different grape varieties showed important quantitative differences in the polyphenolic fraction concentration and the antioxidant capacity at their optimal maturity point. To evaluate these differences, the PCA multivariate analysis was applied (Figure 2a,b) taking into consideration these parameters.
For all the red grape varieties, the cumulative percentage of the total variance explained by the first and second principal component was 90.089%. The red grape varieties were differently grouped according to their phenolic composition as shown in the biplots. For red grape varieties, the antioxidant capacity by CUPRAC, DPPH and FRAP was characterized by TPC, hydroxycinnamic acids and flavan-3-ols while the antioxidant capacity by ORAC was characterized by anthocyanins, tannins and flavonols. Regarding white grape varieties, the cumulative percentage of the total variance explained by the first and second principal component was 99.006%. Except for two of the grape varieties with the lowest phenolic content, the rest of the white grape varieties showed clearly that the phenolic profile mainly based on TPC, hydroxycinnamic acids and flavan-3-ols defines the antioxidant capacity measured by ORAC, CUPRAC, DPPH and FRAP.
This is the first time a correlation of the polyphenolic profile and antioxidant capacity in unpicked grapes by different assays is carried out. This study establishes the first step for a future polyphenolic characterization to evaluate the valorization of the specific grape varieties initially considered as wastes for obtaining natural antioxidants.

4. Conclusions

The results presented in this study underline, for the first time, that grapes left on the vine and initially considered as wastes present an antioxidant capacity due to the presence of bioactive polyphenols that should be considered for their revalorization. The results showed for all the grapes at their optimal maturity point a strong relationship between the total polyphenolic content and hydroxycinnamic acids in both whole white and red grape varieties. Moreover, the antioxidant capacity was dependent on the total polyphenolic content suggesting that it may be feasible to use the total phenolic content in both white and grape varieties to screen the antioxidant capacity. Furthermore, the analysis of the different polyphenolic fractions by easy spectrophotometric methods may explain the antioxidant capacity of the grapes as a whole. Finally, the results presented in this work provide important references that indicate the relevance of including antioxidant capacity as a new parameter for grape quality characterization, giving the unpicked grape initially considered as a food waste derived by the limited appellation production yield an added value and so collaborating to the circular bioeconomy. Our findings contribute to the knowledge of the in vitro antioxidant capacity of the unpicked grapes as a whole, establishing an initial scientific base for future studies on polyphenolic specific analysis and on in vivo systems to consider these grapes, left to rot in the vineyard, as an important natural source for obtaining natural antioxidants, which are used as food ingredients or with potential applications in the pharmaceutical sector.

Author Contributions

Conceptualization, E.E.; methodology, I.L.-d.-A., D.R. and R.M.; validation, E.E., M.C.V. and R.M.A.; formal analysis, I.L.-d.-A., D.R. and R.M.; investigation, E.E., I.L.-d.-A., D.R. and R.M.; resources, M.C.V.; data curation, M.C.V. and R.M.A.; writing—original draft preparation, E.E.; writing—review and editing, M.C.V. and R.M.A.; visualization, I.L.-d.-A.; supervision, M.C.V. and R.M.A.; project administration, M.C.V.; funding acquisition, E.E., M.C.V. and R.M.A. All authors have read and agreed to the published version of the manuscript.

Funding

This research received no external funding.

Institutional Review Board Statement

Not applicable.

Informed Consent Statement

Not applicable.

Data Availability Statement

Not applicable.

Acknowledgments

The authors thank the Spanish wine producers of D.O.Ca. Rioja, Arabako txakolina and Getariako txakolina for the collected grapes.

Conflicts of Interest

The authors declare no conflict of interest.

References

  1. Koch, W. Dietary Polyphenols-Important Non-Nutrients in the Prevention of Chronic Noncommunicable Diseases. A Systematic Review. Nutrients 2019, 11, 1039. [Google Scholar] [CrossRef] [Green Version]
  2. Lourenço Neto, M.; Agra, K.L.; Suassuna Filho, J.; Jorge, F.E. TDDFT calculations and photoacoustic spectroscopy experiments used to identify phenolic acid functional biomolecules in Brazilian tropical fruits in natura. Spectrochim. Acta Part A Mol. Biomol. Spectrosc. 2018, 193, 249–257. [Google Scholar] [CrossRef]
  3. Scalbert, A.; Manach, C.; Morand, C.; Rémésy, C.; Jiménez, L. Dietary polyphenols and the prevention of diseases. Crit. Rev. Food Sci. Nutr. 2005, 45, 287–306. [Google Scholar] [CrossRef] [PubMed]
  4. Pérez-Jiménez, J.; Neveu, V.; Vos, F.; Scalbert, A. Identification of the 100 richest dietary sources of polyphenols: An application of the Phenol-Explorer database. Eur. J. Clin. Nutr. 2010, 64, S112–S120. [Google Scholar] [CrossRef] [PubMed]
  5. Kammerer, D.; Claus, A.; Carle, R.; Schieber, A. Polyphenol screening of pomace from red and white grape varieties (Vitis vinifera L.) by HPLC-DAD-MS/MS. J. Agric. Food Chem. 2004, 52, 4360–4367. [Google Scholar] [CrossRef] [PubMed]
  6. Obreque-Slier, E.; Peña-Neira, Á.; López-Solís, R.; Zamora-Marín, F.; Silva, J.M.R.; Laureano, O. Comparative study of the phenolic composition of seeds and skins from Carménère and Cabernet sauvignon grape varieties (Vitis vinifera L.) during ripening. J. Agric. Food Chem. 2010, 58, 3591–3599. [Google Scholar] [CrossRef] [PubMed]
  7. Garrido, J.; Borges, F. Wine and grape polyphenols—A chemical perspective. Food Res. Int. 2011, 44, 3134–3148. [Google Scholar] [CrossRef] [Green Version]
  8. Di Lecce, G.; Arranz, S.; Jáuregui, O.; Tresserra-Rimbau, A.; Quifer-Rada, P.; Lamuela-Raventós, R.M. Phenolic profiling of the skin, pulp and seeds of Albariño grapes using hybrid quadrupole time-of-flight and triple-quadrupole mass spectrometry. Food Chem. 2014, 145, 874–882. [Google Scholar] [CrossRef]
  9. International Organisation of Vine and Wine (OIV). 2020 Statistical Report on World Vitiviniculture; OIV: Paris, France, 2020. [Google Scholar]
  10. OIV. State of the World Vitivinicultural Sector in 2019. Available online: http://www.oiv.int/public/medias/7298/oiv-state-of-the-vitivinicultural-sector-in-2019.pdf (accessed on 18 March 2022).
  11. Soceanu, A.; Dobrinas, S.; Sirbu, A.; Manea, N.; Popescu, V. Economic aspects of waste recovery in the wine industry. A multidisciplinary approach. Sci. Total Environ. 2021, 759, 143543. [Google Scholar] [CrossRef]
  12. Bharathiraja, B.; Iyyappan, J.; Jayamuthunagai, J.; Kumar, R.P.; Sirohi, R.; Gnansounou, E.; Pandey, A. Critical review on bioconversion of winery wastes into value-added products. Ind. Crop. Prod. 2020, 158, 112954. [Google Scholar] [CrossRef]
  13. Ahmad, B.; Yadav, V.; Yadav, A.; Rahman, M.U.; Yuan, W.Z.; Li, Z.; Wang, X. Integrated biorefinery approach to valorize winery waste: A review from waste to energy perspectives. Sci. Total Environ. 2020, 719, 137315. [Google Scholar] [CrossRef] [PubMed]
  14. Cardullo, N.; Leanza, M.; Muccilli, V.; Tringali, C. Valorization of Agri-Food Waste from Pistachio Hard Shells: Extraction of Polyphenols as Natural Antioxidants. Resources 2021, 10, 45. [Google Scholar] [CrossRef]
  15. Iglesias-Carres, L.; Mas-Capdevila, A.; Sancho-Pardo, L.; Bravo, F.I.; Mulero, M.; Muguerza, B.; Arola-Arnal, A. Optimized Extraction by Response Surface Methodology Used for the Characterization and Quantification of Phenolic Compounds in Whole Red Grapes (Vitis vinifera). Nutrients 2018, 10, 1931. [Google Scholar] [CrossRef] [PubMed] [Green Version]
  16. Barba, F.J.; Galanakis, C.M.; Esteve, M.J.; Frigola, A.; Vorobiev, E. Potential use of pulsed electric technologies and ultrasounds to improve the recovery of high-added value compounds from blackberries. J. Food Eng. 2015, 167, 38–44. [Google Scholar] [CrossRef]
  17. Makris, D.P. Kinetics of Ultrasound-Assisted Flavonoid Extraction from Agri-Food Solid Wastes Using Water/Glycerol Mixtures. Resources 2016, 5, 7. [Google Scholar] [CrossRef] [Green Version]
  18. Chemat, F.; Zille, H.; Khan, M.K. Applications of ultrasound in food technology: Processing, preservation and extraction. Ultrason. Sonochem. 2011, 18, 813–835. [Google Scholar] [CrossRef]
  19. Chemat, F.; Rombaut, N.; Sicaire, A.G.; Meullemiestre, A.; Fabiano-Tixier, A.S.; Abert-Vian, M. Ultrasound assisted extraction of food and natural products. Mechanisms, techniques, combinations, protocols and applications: A review. Ultrason. Sonochem. 2017, 37, 540–560. [Google Scholar] [CrossRef]
  20. Carpentieri, S.; Soltanipour, F.; Ferrari, G.; Pataro, G.; Donsì, F. Emerging Green Techniques for the Extraction of Antioxidants from Agri-Food By-Products as Promising Ingredients for the Food Industry. Antioxidants 2021, 10, 1417. [Google Scholar] [CrossRef]
  21. Finaud, J.; Lac, G.; Filaire, E. Oxidative stress. Sports Med. 2006, 36, 327–358. [Google Scholar] [CrossRef]
  22. Elejalde, E.; Villarán, M.C.; Alonso, R.M. Grape polyphenols supplementation for exercise-induced oxidative stress. J. Int. Soc. Sports Nutr. 2021, 18, 3. [Google Scholar] [CrossRef]
  23. MacDonald-Wicks, L.K.; Wood, L.G.; Garg, M.L. Methodology for the determination of biological antioxidant capacity in vitro: A review. J. Sci. Food Agric. 2006, 86, 2046–2056. [Google Scholar] [CrossRef]
  24. Santos-Sánchez, N.F.; Salas-Coronado, R.; Villanueva-Cañongo, C.; Hernández-Carlos, B. Antioxidant compounds and their antioxidant mechanism. In Antioxidants; Shalaby, E., Ed.; IntechOpen: London, UK, 2016; p. 29. [Google Scholar]
  25. Shahidi, F.; Zhong, Y. Measurement of antioxidant activity. J. Funct. Foods 2015, 18 Pt B, 757–781. [Google Scholar] [CrossRef]
  26. Granato, D.; Shahidi, F.; Wrolstad, R.; Kilmartin, P.; Melton, L.D.; Hidalgo, F.J.; Miyashita, K.; van Camp, J.; Alasalvar, C.; Ismail, A.B.; et al. Antioxidant activity, total phenolics and flavonoids contents: Should we ban in vitro screening methods? Food Chem. 2018, 264, 471–475. [Google Scholar] [CrossRef] [PubMed]
  27. Fia, G.; Bucalossi, G.; Proserpio, C.; Vincenzi, S. Unripe grapes: An overview of the composition, traditional and innovative applications, and extraction methods of a promising waste of viticulture. Aust. J. Grape Wine Res. 2022, 28, 8–26. [Google Scholar] [CrossRef]
  28. Gutiérrez-Gamboa, G.; Wei, M.; Moreno-Simunovic, Y.; Sun, X.; Fang, Y. Potential opportunities of thinned clusters in viticulture: A mini review. J. Sci. Food Agric. 2021, 101, 4435–4443. [Google Scholar] [CrossRef] [PubMed]
  29. Carmona-Jiménez, Y.; Palma, M.; Guillén-Sánchez, D.A.; García-Moreno, M.V. Study of the Cluster Thinning Grape as a Source of Phenolic Compounds and Evaluation of Its Antioxidant Potential. Biomolecules 2021, 11, 227. [Google Scholar] [CrossRef] [PubMed]
  30. Fia, G.; Bucalossi, G.; Gori, C.; Borghini, F.; Zanoni, B. Recovery of Bioactive Compounds from Unripe Red Grapes (cv. Sangiovese) through a Green Extraction. Foods 2020, 9, 566. [Google Scholar] [CrossRef]
  31. Salvador, Â.C.; Simões, M.M.Q.; Silva, A.M.S.; Santos, S.A.O.; Rocha, S.M.; Silvestre, A.J.D. Vine Waste Valorisation: Integrated Approach for the Prospection of Bioactive Lipophilic Phytochemicals. Int. J. Mol. Sci. 2019, 20, 4239. [Google Scholar] [CrossRef] [Green Version]
  32. Figueiredo-González, M.; Martínez-Carballo, E.; Cancho-Grande, B.; Santiago, J.L.; Martínez, M.C.; Simal-Gándara, J. Pattern recognition of three Vitis vinifera L. red grapes varieties based on anthocyanin and flavonol profiles, with correlations between their biosynthesis pathways. Food Chem. 2012, 130, 9–19. [Google Scholar] [CrossRef]
  33. Natolino, A.; Da Porto, C. Kinetic models for conventional and ultrasound assistant extraction of polyphenols from defatted fresh and distilled grape marc and its main components skins and seeds. Chem. Eng. Res. Des. 2020, 156, 1–12. [Google Scholar] [CrossRef]
  34. European Economic Community (EEC). Commission Regulation (EEC) No. 2676/90 of 17 September 1990 Determining Community Methods for the Analysis of Wines; EEC: Brussels, Belgium, 1990. [Google Scholar]
  35. Müller, L.; Gnoyke, S.; Popken, A.M.; Böhm, V. Antioxidant capacity and related parameters of different fruit formulations. LWT—Food Sci. Technol. 2010, 43, 992–999. [Google Scholar] [CrossRef]
  36. Mazza, G.; Fukumoto, L.; Delaquis, P.; Girard, B.; Ewert, B. Anthocyanins, phenolics, and color of Cabernet Franc, Merlot, and Pinot Noir wines from British Columbia. J. Agric. Food Chem. 1999, 47, 4009–4017. [Google Scholar] [CrossRef] [PubMed]
  37. Vivas, N.; Glories, Y.; Laguna, I.; Saucier, C.Y.; Augustín, M. Estimation du degré de polymérisation des procyanidines du raisin et du vin par la méthode au p-diimethylaminocinnamaldéhyde. J. Int. Sci. Vigne Vin 1994, 28, 319–336. [Google Scholar] [CrossRef]
  38. Di Stefano, R.; Cravero, M.C.; Gentilini, N. Metodi per lo studio dei polifenoli dei vini. Enotecnico 1989, 25, 83–89. [Google Scholar]
  39. Sarneckis, C.J.; Dambergs, R.G.; Jones, P.; Mercurio, M.; Herderich, M.J.; Smith, P.A. Quantification of condensed tannins by precipitation with methyl cellulose: Development and validation of an optimised tool for grape and wine analysis. Aust. J. Grape Wine Res. 2006, 12, 39–49. [Google Scholar] [CrossRef]
  40. Prior, R.L.; Wu, X.; Schaich, K. Standardized methods for the determination of antioxidant capacity and phenolics in foods and dietary supplements. J. Agric. Food Chem. 2005, 53, 4290–4302. [Google Scholar] [CrossRef]
  41. Brand-Williams, W.; Cuvelier, M.E.; Berset, C. Use of a free radical method to evaluate antioxidant activity. LWT—Food Sci. Technol. 1995, 28, 25–30. [Google Scholar] [CrossRef]
  42. Benzie, I.F.F.; Strain, J.J. The Ferric Reducing Ability of Plasma (FRAP) as a measure of “antioxidant power”: The FRAP assay. Anal. Biochem. 1996, 239, 70–76. [Google Scholar] [CrossRef] [Green Version]
  43. Apak, R.; Güçlü, K.; Özyürek, M.; Karademir, S.E. Novel total antioxidant capacity index for dietary polyphenols and vitamins C and E, using their cupric ion reducing capability in the presence of neocuproine: CUPRAC method. J. Agric. Food Chem. 2004, 52, 7970–7981. [Google Scholar] [CrossRef]
  44. Re, R.; Pellegrini, N.; Proteggente, A.; Pannala, A.; Yang, M.; Rice-Evans, C. Antioxidant activity applying an improved ABTS radical cation decolorization assay. Free Radic. Biol. Med. 1999, 26, 1231–1237. [Google Scholar] [CrossRef]
  45. Anastasiadi, M.; Pratsinis, H.; Kletsas, D.; Skaltsounis, A.-L.; Haroutounian, S.A. Bioactive non-coloured polyphenols content of grapes, wines and vinification by-products: Evaluation of the antioxidant activities of their extracts. Food Res. Int. 2010, 43, 805–813. [Google Scholar] [CrossRef]
  46. Liu, Q.; Tang, G.-Y.; Zhao, C.-N.; Feng, X.-L.; Xu, X.-Y.; Cao, S.-Y.; Meng, X.; Li, S.; Gan, R.-Y.; Li, H.-B. Comparison of Antioxidant Activities of Different Grape Varieties. Molecules 2018, 23, 2432. [Google Scholar] [CrossRef] [PubMed] [Green Version]
  47. Stockley, C.S.; Hoj, P.B. Better wine for better health: Fact or fiction? Aust. J. Grape Wine Res. 2005, 11, 127–138. [Google Scholar] [CrossRef]
  48. Downey, M.O.; Dokoozlian, N.K.; Krstic, M.P. Cultural practice and environmental impacts on the flavonoid composition of grapes and wine: A review of recent research. Am. J. Enol. Vitic. 2006, 57, 257–268. [Google Scholar]
  49. Perestrelo, R.; Lu, Y.; Santos, S.A.O.; Silvestre, A.J.D.; Neto, C.P.; Câmara, J.S.; Rocha, S.M. Phenolic profile of Sercial and Tinta Negra Vitis vinifera L. grape skins by HPLC-DAD-ESI-MSn: Novel phenolic compounds in Vitis vinifera L. grape. Food Chem. 2012, 135, 94–104. [Google Scholar] [CrossRef] [Green Version]
  50. Martínez-Gil, A.M.; Gutiérrez-Gamboa, G.; Garde-Cerdán, T.; Pérez-Álvarez, E.P.; Moreno-Simunovic, Y. Characterization of phenolic composition in Carignan noir grapes (Vitis vinifera L.) from six wine-growing sites in Maule Valley, Chile. J. Sci. Food Agric. 2018, 98, 274–282. [Google Scholar] [CrossRef]
  51. Gougoulias, N.; Vyrlas, P.; Giurgiulescu, L.; Kalfountzos, D.; Eugenia, F. Evaluation of polyphenols content and antioxidant activity of two table grape varieties under environmental conditions of thessaly. Carpathian J. Food Sci. Technol. 2015, 7, 119–125. [Google Scholar]
  52. Mota, A.; Pinto, J.; Fartouce, I.; Correia, M.J.; Costa, R.; Carvalho, R.; Aires, A.; Oliveira, A.A. Chemical profile and antioxidant potential of four table grape (Vitis Vinifera) cultivars grown in Douro region, Portugal. Ciênc. Téc. Vitiviníc. 2018, 33, 125–135. [Google Scholar] [CrossRef]
  53. Silva, V.; Igrejasb, G.; Falcoe, V.; Santos, T.P.; Torres, C.; Oliveira, A.M.P.; Pereira, J.E.; Amarali, J.S.; Poeta, P. Chemical composition, antioxidant and antimicrobial activity of phenolic compounds extracted from wine industry by-products. Food Control 2018, 92, 516–522. [Google Scholar] [CrossRef] [Green Version]
  54. Yang, J.; Liu, R.H.; Martinson, T.E. Phytochemical profiles and antioxidant activities of wine grapes. Food Chem. 2009, 116, 332–339. [Google Scholar] [CrossRef]
  55. Fernandes, F.; Ramalhosa, E.; Pires, P.; Verdial, J.; Valentão, P.; Andrade, P.; Bento, A.; Pereira, J.A. Vitis vinifera leaves towards bioactivity. Ind. Crop. Prod. 2013, 43, 434–440. [Google Scholar] [CrossRef]
  56. Choi, J.S.; Chung, H.Y.; Kang, S.S.; Jung, M.J.; Kim, J.W.; No, J.K.; Jung, H.A. The structure-activity relationship of flavonoids as scavenger of peroxynitrite. Phyther. Res. 2002, 16, 232–235. [Google Scholar] [CrossRef] [PubMed]
  57. Sadeghipour, M.; Terreux, R.; Phipps, J. Flavonoids and tyrosine nitration: Structure-activity relationship correlation with enthalpy of formation. Toxicol. Vitr. 2005, 19, 155–165. [Google Scholar] [CrossRef] [PubMed]
Figure 1. (a) Correlation between antioxidant capacity measured by ORAC expressed as µmol TE/g dm and total polyphenolic content (TPC) expressed as mg GAE/g dm; (b) Correlation between antioxidant capacity measured by DPPH expressed as µmol TE/g dm and total polyphenolic content (TPC) expressed as mg GAE/g dm; (c) Correlation between antioxidant capacity measured by FRAP expressed as µmol TE/g dm and total polyphenolic content (TPC) expressed as mg GAE/g dm; (d) Correlation between antioxidant capacity measured by CUPRAC expressed as µmol TE/g dm and total polyphenolic content (TPC) expressed as mg GAE/g dm; (e) Correlation between antioxidant capacity measured by ABTS expressed as µmol TE/g dm and total polyphenolic content (TPC) expressed as mg GAE/g dm.
Resources 11 00033 g001
Figure 2. (a) Biplot obtained from PCA illustrating the relationship between polyphenolic profile and antioxidant capacity measured by different assays in red grape varieties; (b) Biplot obtained from PCA illustrating the relationship between polyphenolic profile and antioxidant capacity measured by different assays in white grape varieties.
Resources 11 00033 g002
Table 1. Grape physicochemical parameters in different varieties.
VarietypHBrix DegreeTotal Acidity 1
Red
Tempranillo3.18 ± 0.02 e24.6 ± 0.0 g5.2 ± 0.0 g
Garnacha3.28 ± 0.02 g29.8 ± 0.0 l4.4 ± 0.0 d
Cabernet sauvignon3.47 ±0.01 h25.2 ± 0.0 h4.2 ± 0.0 c
Graciano3.21 ± 0.02 f22.6 ± 0.0 d4.9 ± 0.0 e
Hondarrabi beltza3.17 ± 0.02 e17.8 ± 0.0 a8.3 ± 0.0 j
Maturana tinta3.52 ± 0.03 i26.4 ± 0.0 k4.1 ± 0.0 b
Mazuelo3.11 ± 0.02 d21.6 ± 0.0 c6.4 ± 0.0 h
White
Hondarrabi zuri2.80 ± 0.01 b20.2 ± 0.0 b10.0 ± 0.1 k
Petit courbu2.81 ± 0.03 b20.2 ± 0.0 b10.6 ± 0.0 k
Petit manseng3.04 ± 0.01 c24.4 ± 0.0 f7.5 ± 0.0 i
Gross manseng2.75 ± 0.02 a23.4 ± 0.0 d10.9 ± 0.0 l
Malvasía3.53 ± 0.01 i26.0 ± 0.0 i4.0 ± 0.0 a
Viura3.21 ± 0.01 f26.2 ± 0.0 j5.1 ± 0.0 f
Note: The results are presented as mean ± SD (triplicate). Different letters indicate significant differences (p < 0.05) in each sample type among the thirteen grape varieties. 1 Total acidity is expressed as g tartaric acid/L.
Table 2. Polyphenolic fractions in different grape varieties.
VarietyTotal Phenolic ContentHydroxycinnamic AcidsAnthocyaninsFlavonolsFlavan-3-olsTannins
Red
Tempranillo20.26 ± 0.32 f16.56 ± 0.11 g5.48 ± 0.08 d1.21 ± 0.00 g3.05 ± 0.05 h23.35 ± 0.81 i
Garnacha13.87 ± 0.43 c11.50 ± 0.08 c,d3.40 ± 0.01 c1.14 ± 0.01 f2.31 ± 0.05 d15.88 ± 0.38 d,e
Cabernet sauvignon21.71 ± 0.31 g13.60 ± 1.21 e1.35 ± 0.06 b1.10 ± 0.01 f2.92 ± 0.02 g16.68 ± 0.03 f
Graciano22.33 ± 0.65 g18.20 ± 1.38 h8.12 ± 0.12 e1.36 ± 0.02 h3.53 ± 0.09 i24.68 ± 0.46 j
Hondarrabi beltza17.49 ± 0.30 e11.02 ± 0.06 c,d1.06 ± 0.03 a0.61 ± 0.01 b2.52 ± 0.03 e13.95 ± 0.66 c
Maturana tinta24.95 ± 1.07 h20.40 ± 0.16 i11.19 ± 0.15 g1.95 ± 0.02 j2.72 ± 0.05 f32.39 ± 0.25 k
Mazuelo14.88 ± 0.07 d9.26 ± 0.21 b9.27 ± 0.22 f1.31 ± 0.03 h1.47 ± 0.01 c20.88 ± 0.36 h
White
Hondarrabi zuri24.97 ± 0.26 h14.71 ± 0.50 f-0.85 ± 0.01 e4.77 ± 0.16 k18.37 ± 0.40 g
Petit courbu17.35 ± 0.12 e10.49 ± 0.44 c-0.61 ± 0.02 b3.00 ± 0.02 g,h9.39 ± 0.24 b
Petit manseng22.22 ± 0.46 g13.06 ± 0.22 e-0.73 ± 0.00 d4.21 ± 0.09 j16.36 ± 0.19 e,f
Gross manseng20.88 ± 0.63 f11.74 ± 0.05 d-0.66 ± 0.01 c4.12 ± 0.00 j15.57 ± 0.14 d
Malvasía4.69 ± 0.21 a2.74 ± 0.09 a-0.60 ± 0.05 b0.47 ± 0.01 a4.81 ± 0.06 a
Viura7.34 ± 0.51 b3.04 ± 0.33 a-0.49 ± 0.02 a0.72 ± 0.06 b5.03 ± 0.19 a
Note: The results are presented as mean ± SD (triplicate). The data are expressed as mg/g dried matter. Results are reported as mg GAE/g dm for total phenolic content, mg CAE/g dm for hydroxycinnamic acids, mg ME/g dm for anthocyanins, mg QE/g dm for flavonols, mg CE/g dm for flavan-3-ols and mg EE/g dm for tannins. Different letters indicate significant differences (p < 0.05) in each sample type among the thirteen grape varieties.
Table 3. Antioxidant capacity in different grape varieties by ORAC, DPPH, FRAP, CUPRAC and ABTS assays.
VarietyORACDPPHFRAPCUPRACABTS
Red
Tempranillo335.09 ± 25.52 d230.67 ± 11.71 j113.14 ± 2.86 f201.78 ± 8.91 i159.79 ± 7.10 c,d
Garnacha254.94 ± 12.06 c134.53 ± 3.81 c76.38 ± 2.30 d146.85 ± 0.60 e206.90 ± 0.75 h,i
Cabernet sauvignon371.44 ± 23.64 e,f164.56 ± 14.74 e,f93.27 ± 3.36 e154.82 ± 4.92 e169.87 ± 10.37 d,e
Graciano397.90 ± 6.23 f,g193.29 ± 14.45 g,h110.10 ± 4.16 f174.25 ± 4.77 g155.79 ± 8.91 b,c
Hondarrabi beltza333.26 ± 14.62 d144.54 ± 18.99 c,d67.75 ± 3.34 c122.72 ± 2.67 c196.17 ± 2.03 g,h
Maturana tinta412.90 ± 9.67 g,h220.78 ± 4.23 i,j124.38 ± 2.06 g196.29 ± 10.41 h,i164.35 ± 7.68 c,d
Mazuelo396.31 ± 6.73 f,g72.95 ± 2.21 b54.43 ± 0.34 b96.24 ± 1.23 b220.82 ± 4.48 i
White
Hondarrabi zuri440.11 ± 39.33 h206.80 ± 10.45 h,i114.06 ± 10.44 f189.49 ± 8.21 h129.87 ± 13.49 a
Petit courbu383.04 ± 7.83 e,f148.47 ± 12.85 c,d,e70.18 ± 2.14 c,d136.07 ± 1.12 d191.42 ± 4.09 f,g
Petit manseng421.47 ± 4.24 g,h175.75 ± 15.51 f,g90.82 ± 2.97 e169.62 ± 4.70 f,g142.97 ± 13.98 a,b
Gross manseng365.54 ± 10.19 e155.65 ± 8.26 d,e94.20 ± 6.80 e163.70 ± 4.30 f181.34 ± 2.27 e,f
Malvasía102.28 ± 2.22 a29.50 ± 1.57 a14.36 ± 0.33 a45.54 ± 2.63 a288.75 ± 1.26 j
Viura146.49 ± 6.40 b38.64 ± 2.56 a19.38 ± 1.43 a50.63 ± 2.98 a276.02 ± 6.63 j
Note: The results are presented as mean ± SD (triplicate), expressed as µmol trolox equivalents (TE)/g dm. Different letters indicate significant differences (p < 0.05) in each sample type among the thirteen grape varieties.
Publisher’s Note: MDPI stays neutral with regard to jurisdictional claims in published maps and institutional affiliations.

