

LoRa-Based Wireless Sensors Network for Rockfall and Landslide Monitoring: A Case Study in Pantelleria Island with Portable LoRaWAN Access
 , , ,
, , ,  and
and 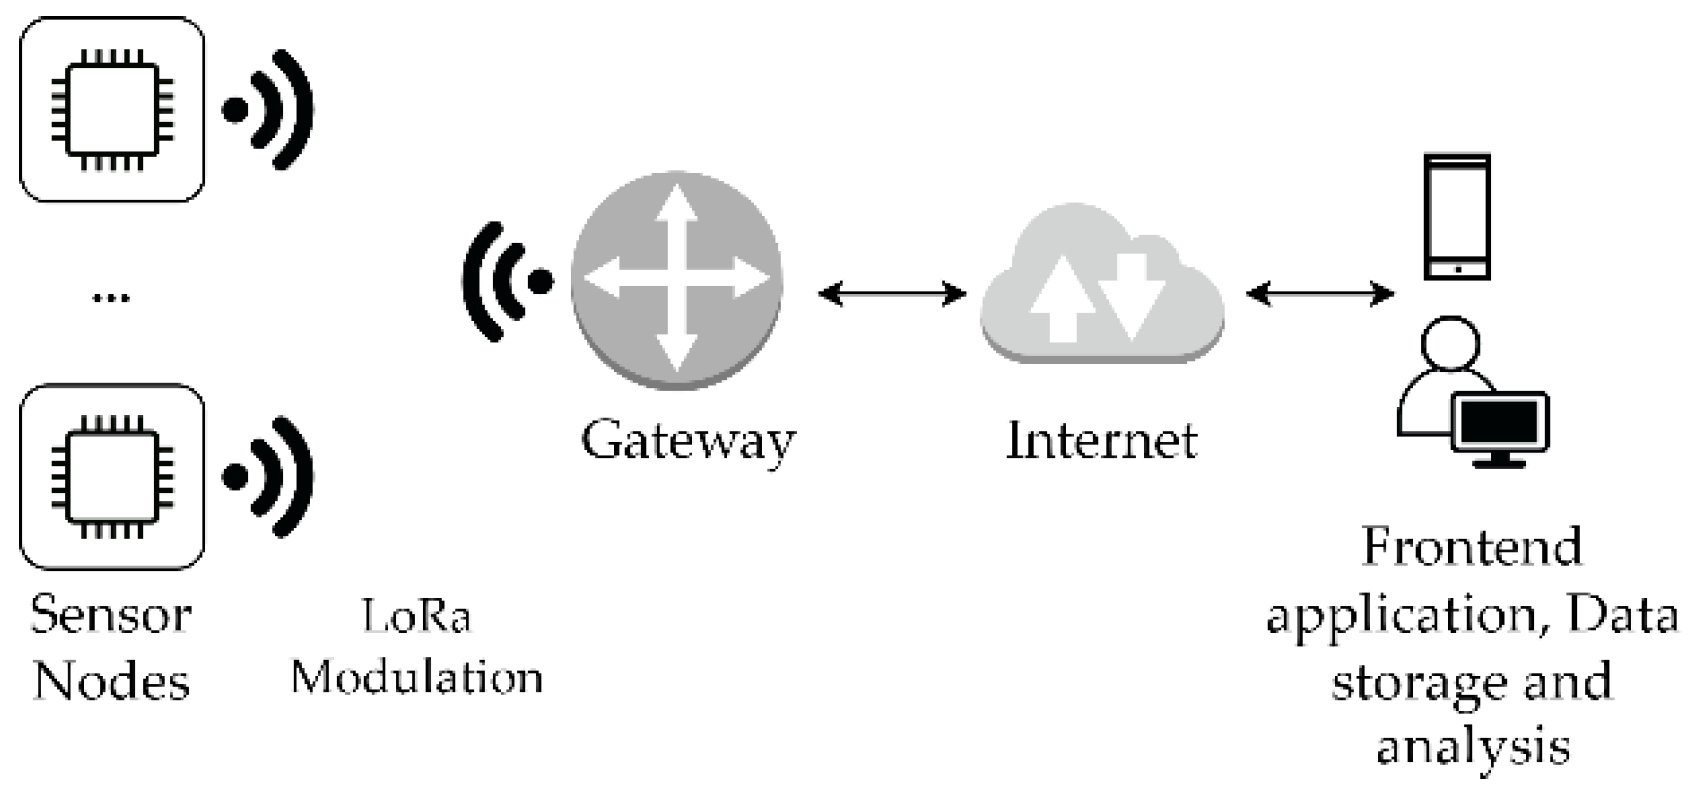
Abstract
:1. Introduction
Overview on State of the Art Rockfall and Landslide Monitoring Systems
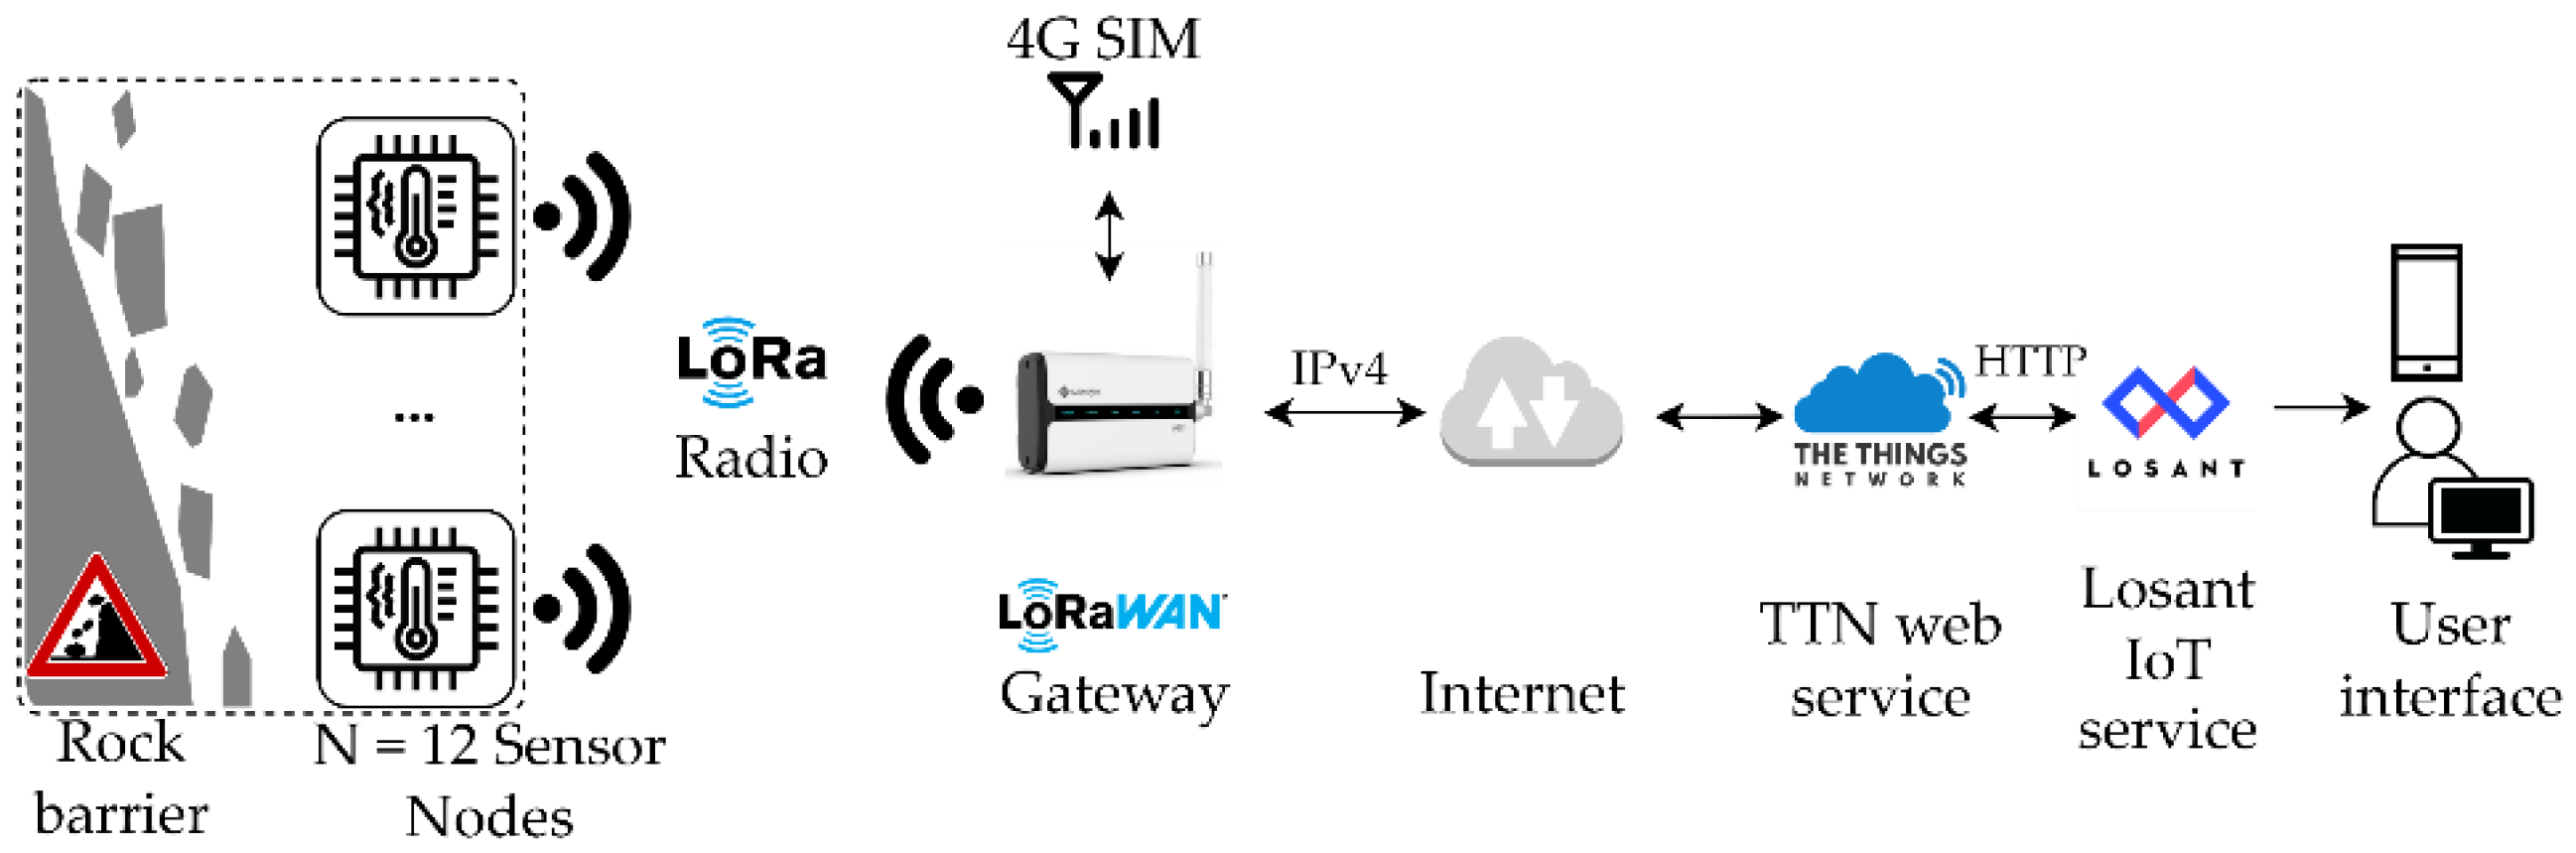
2. System Overview
3. Hardware Structure
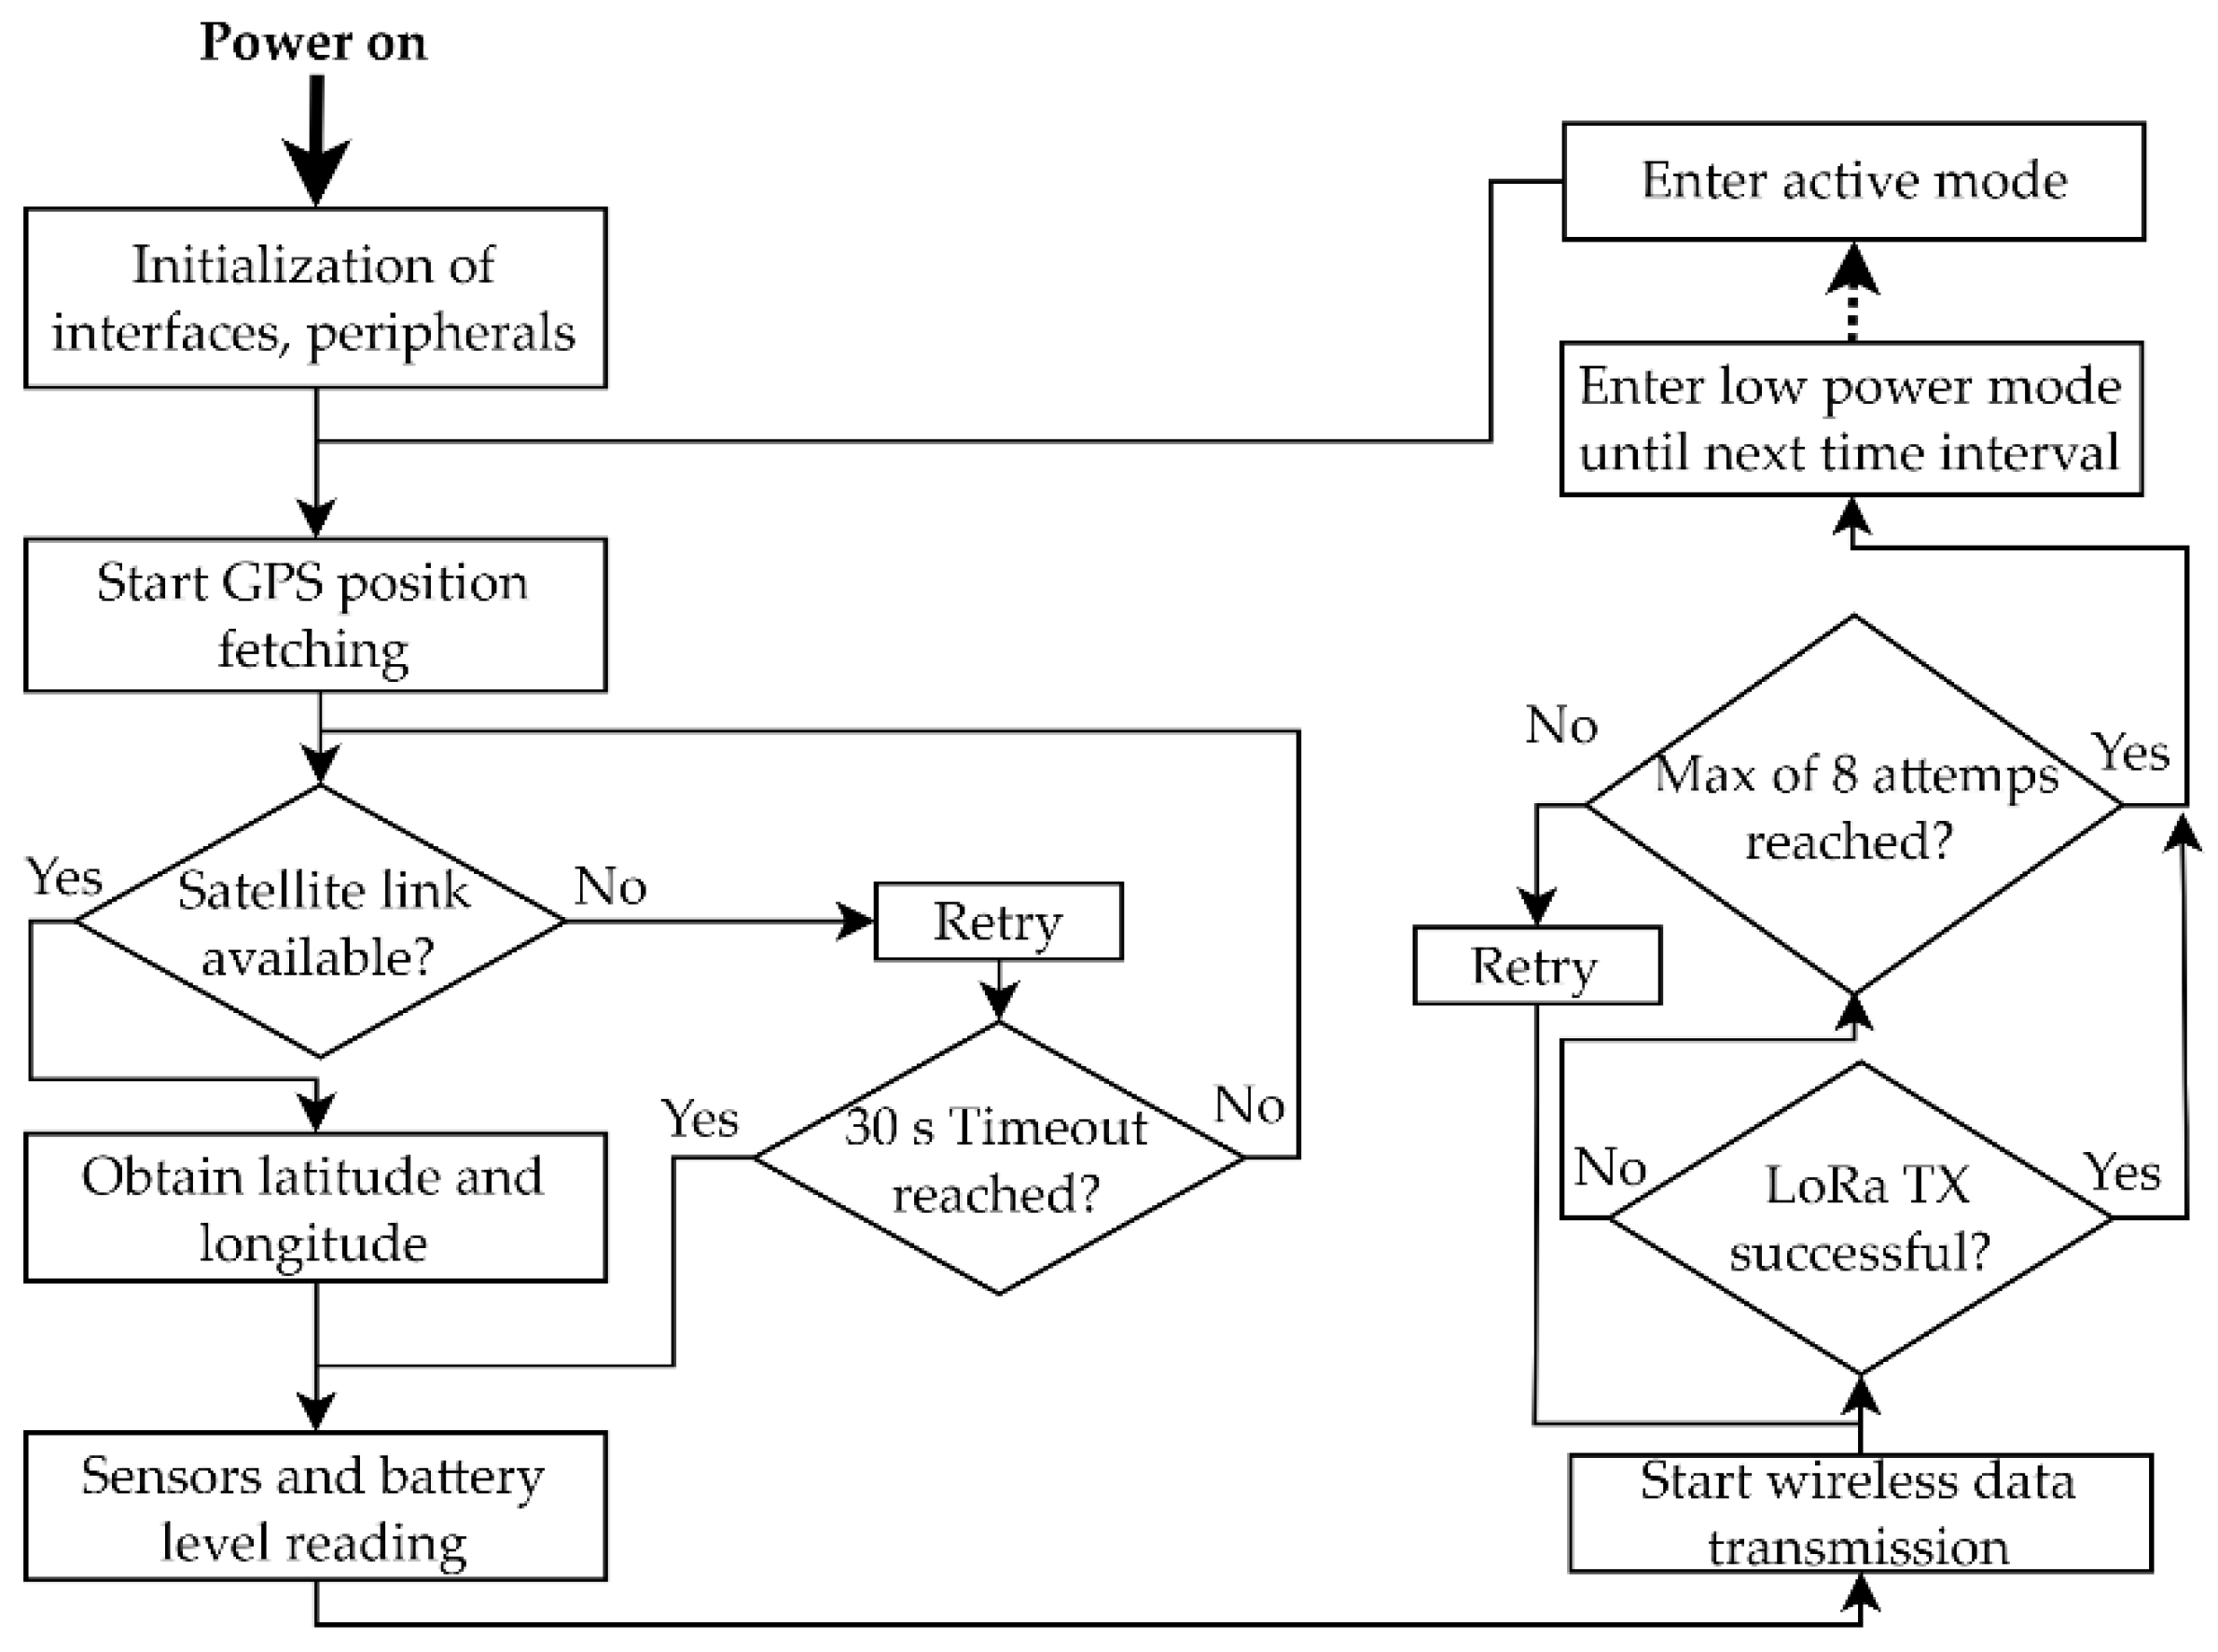
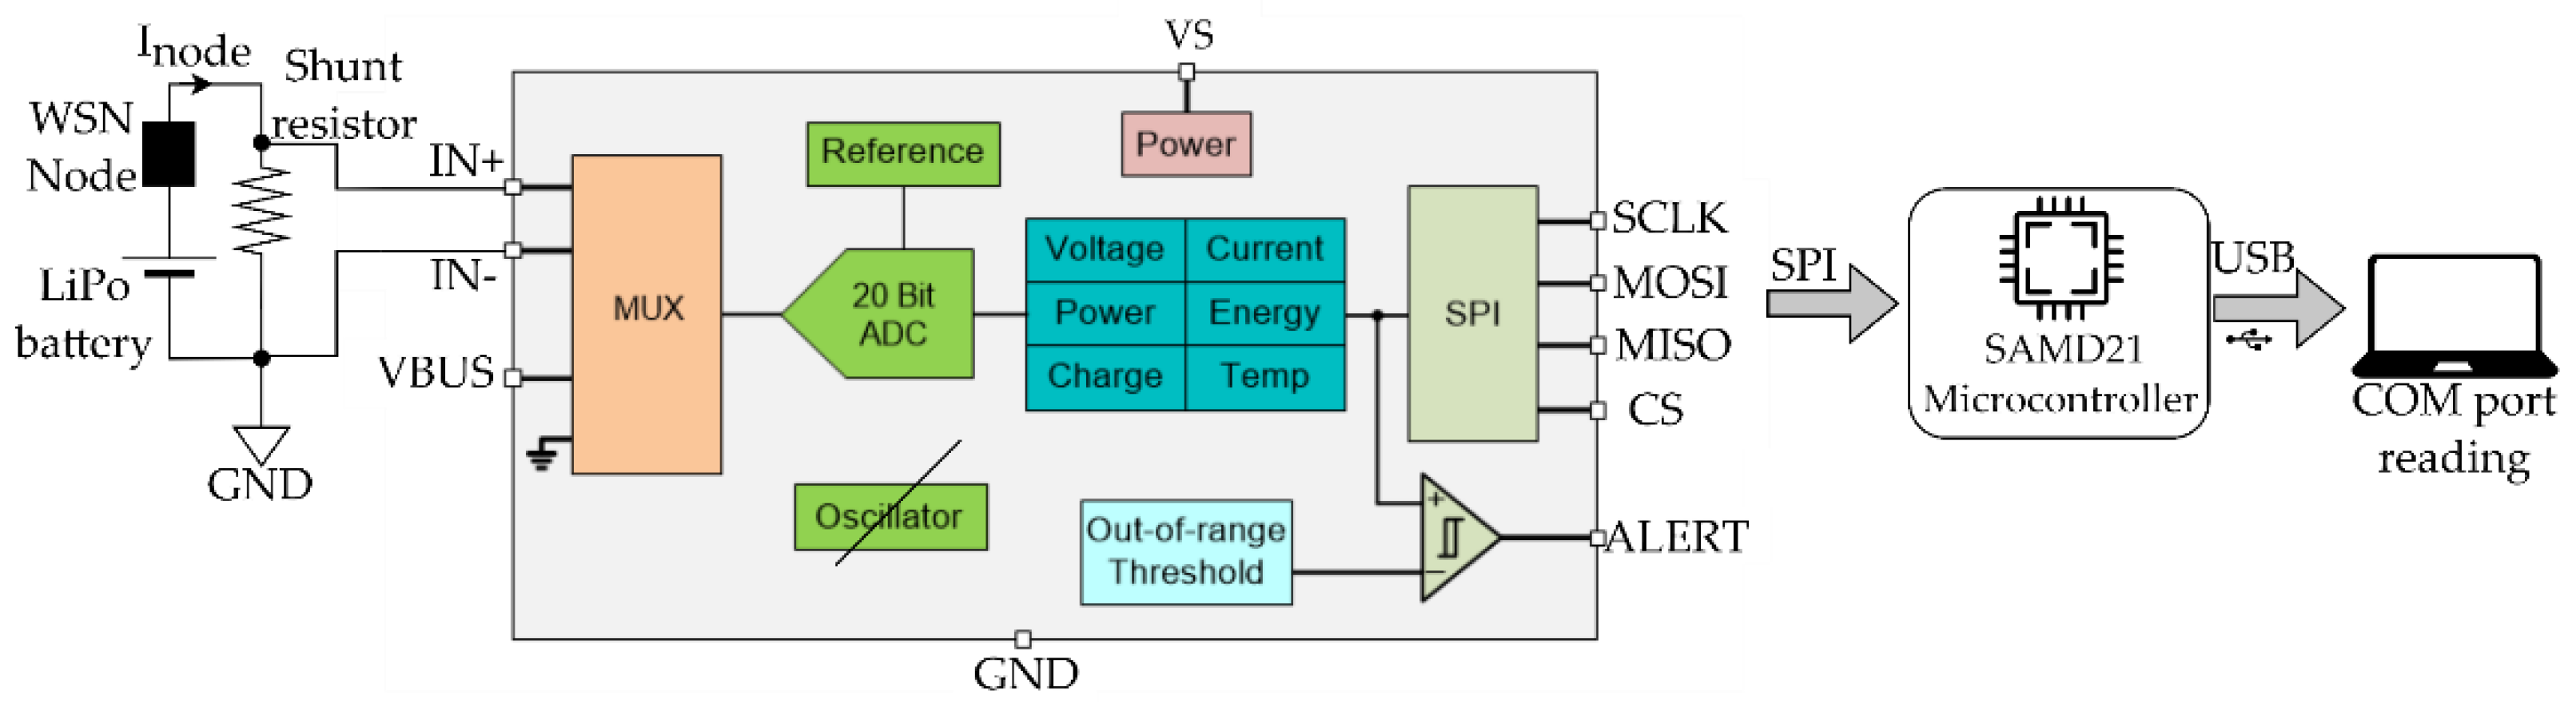
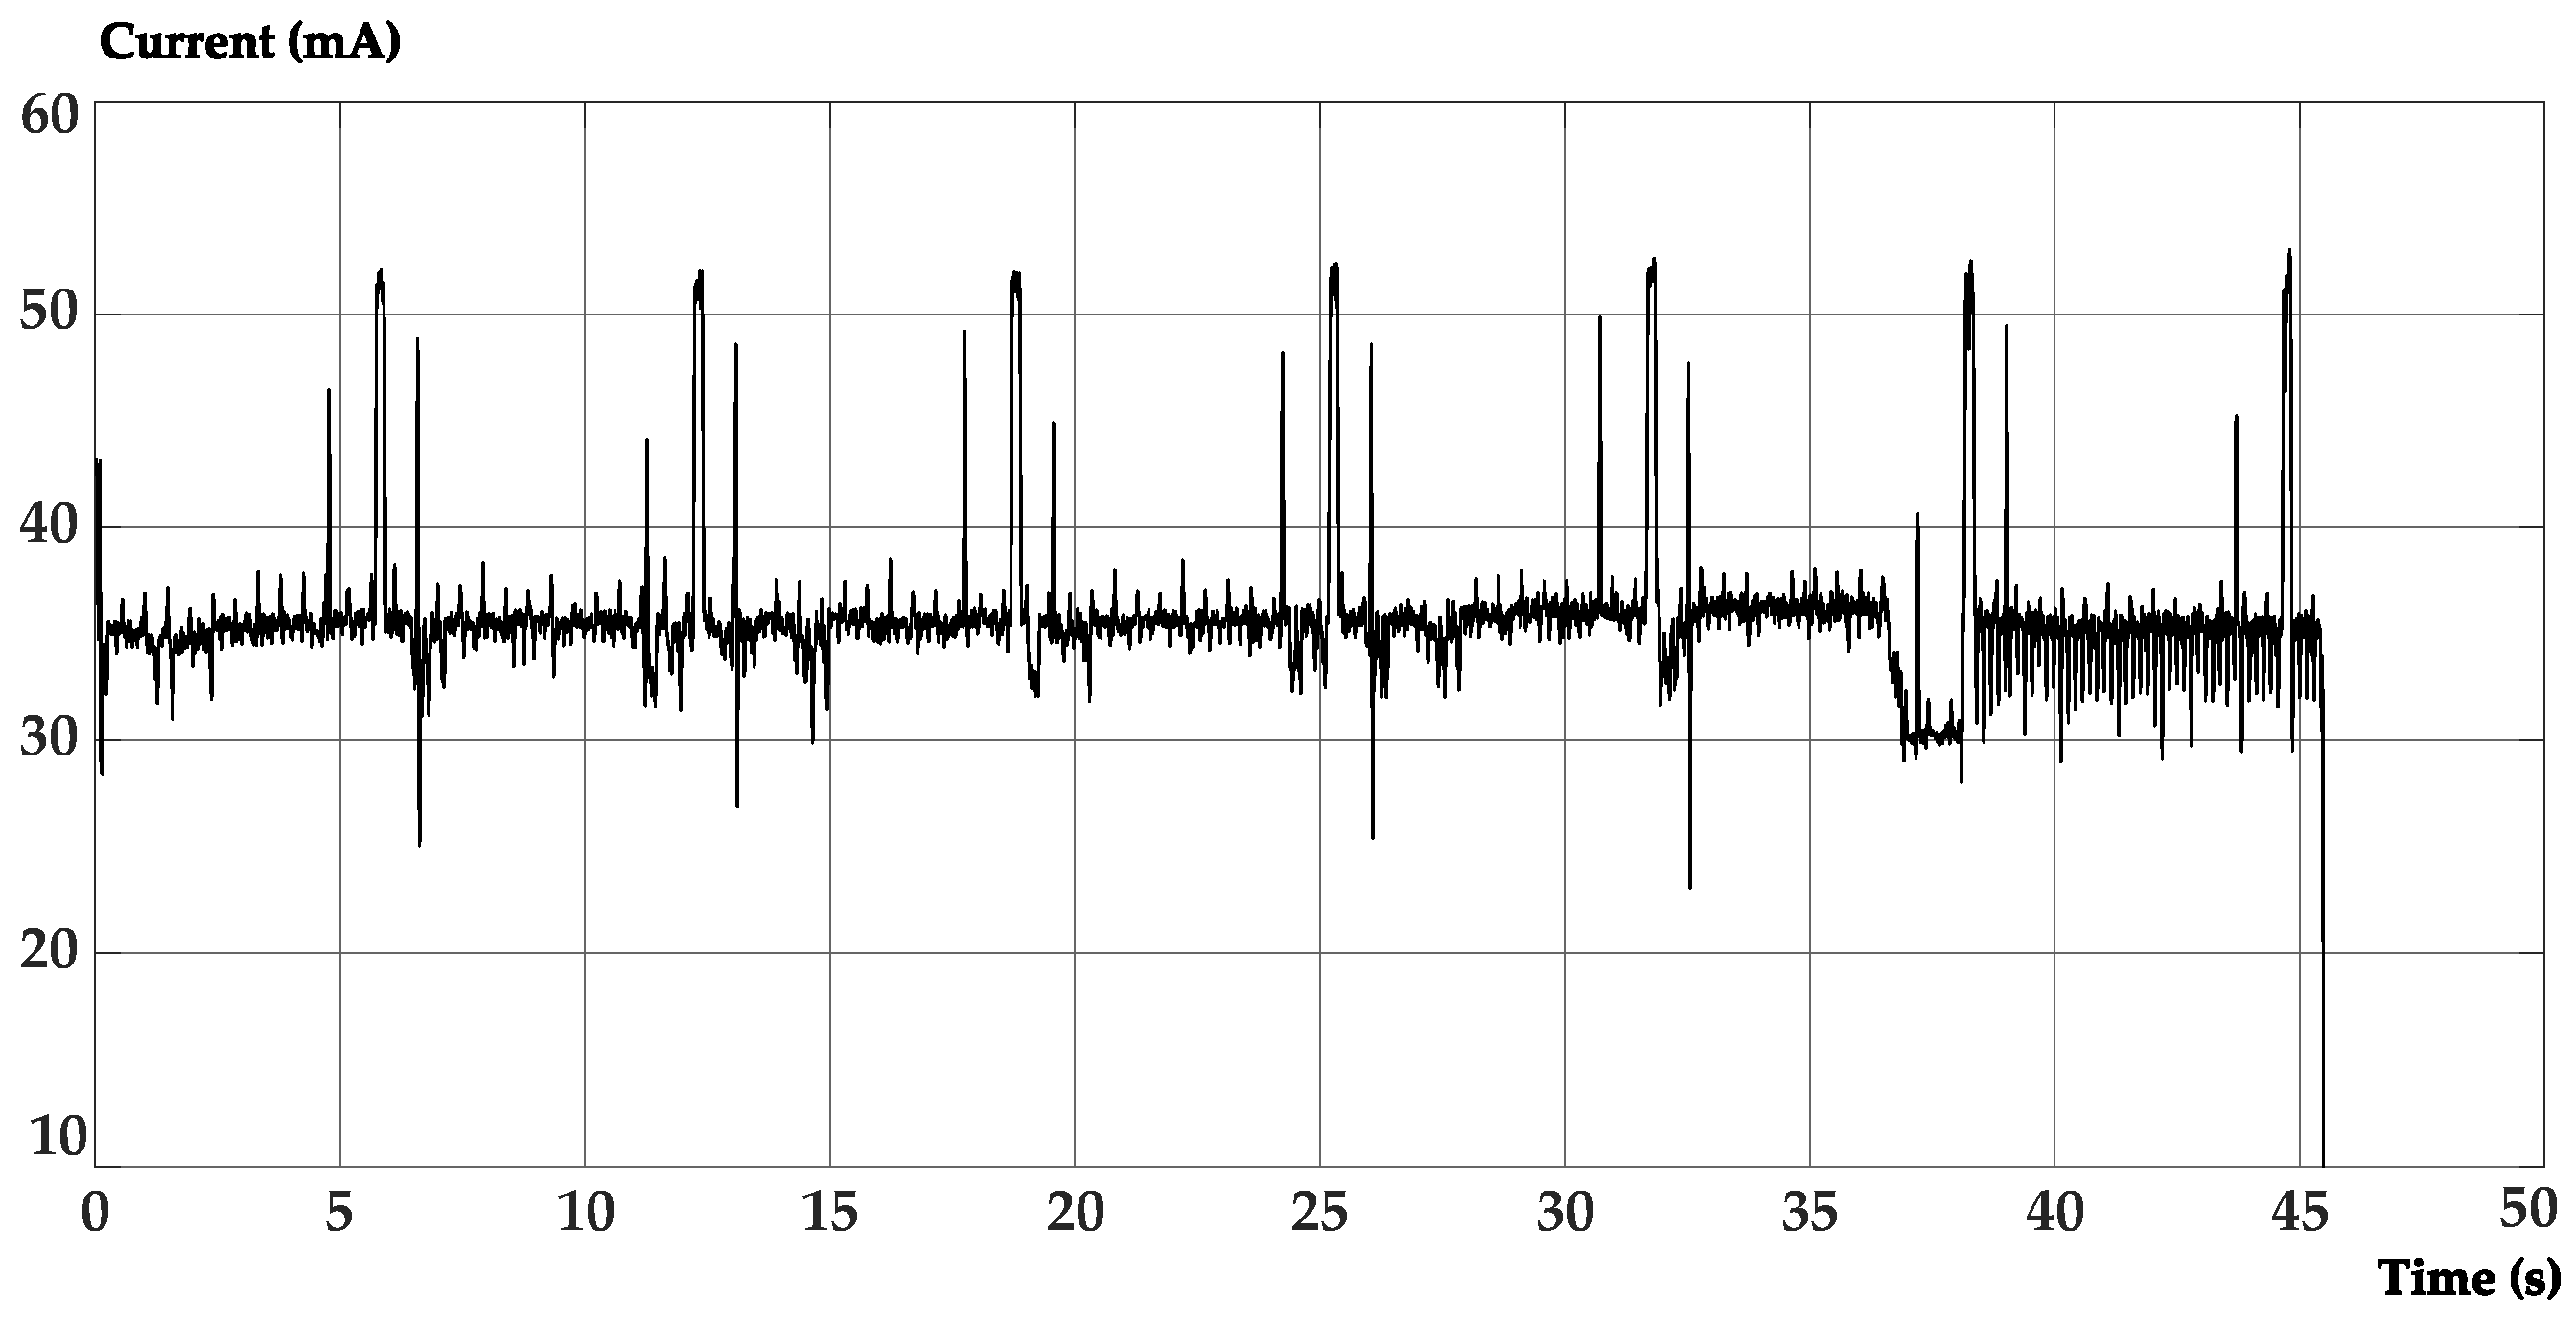
3.1. Sensor Node Structure and Power Analysis
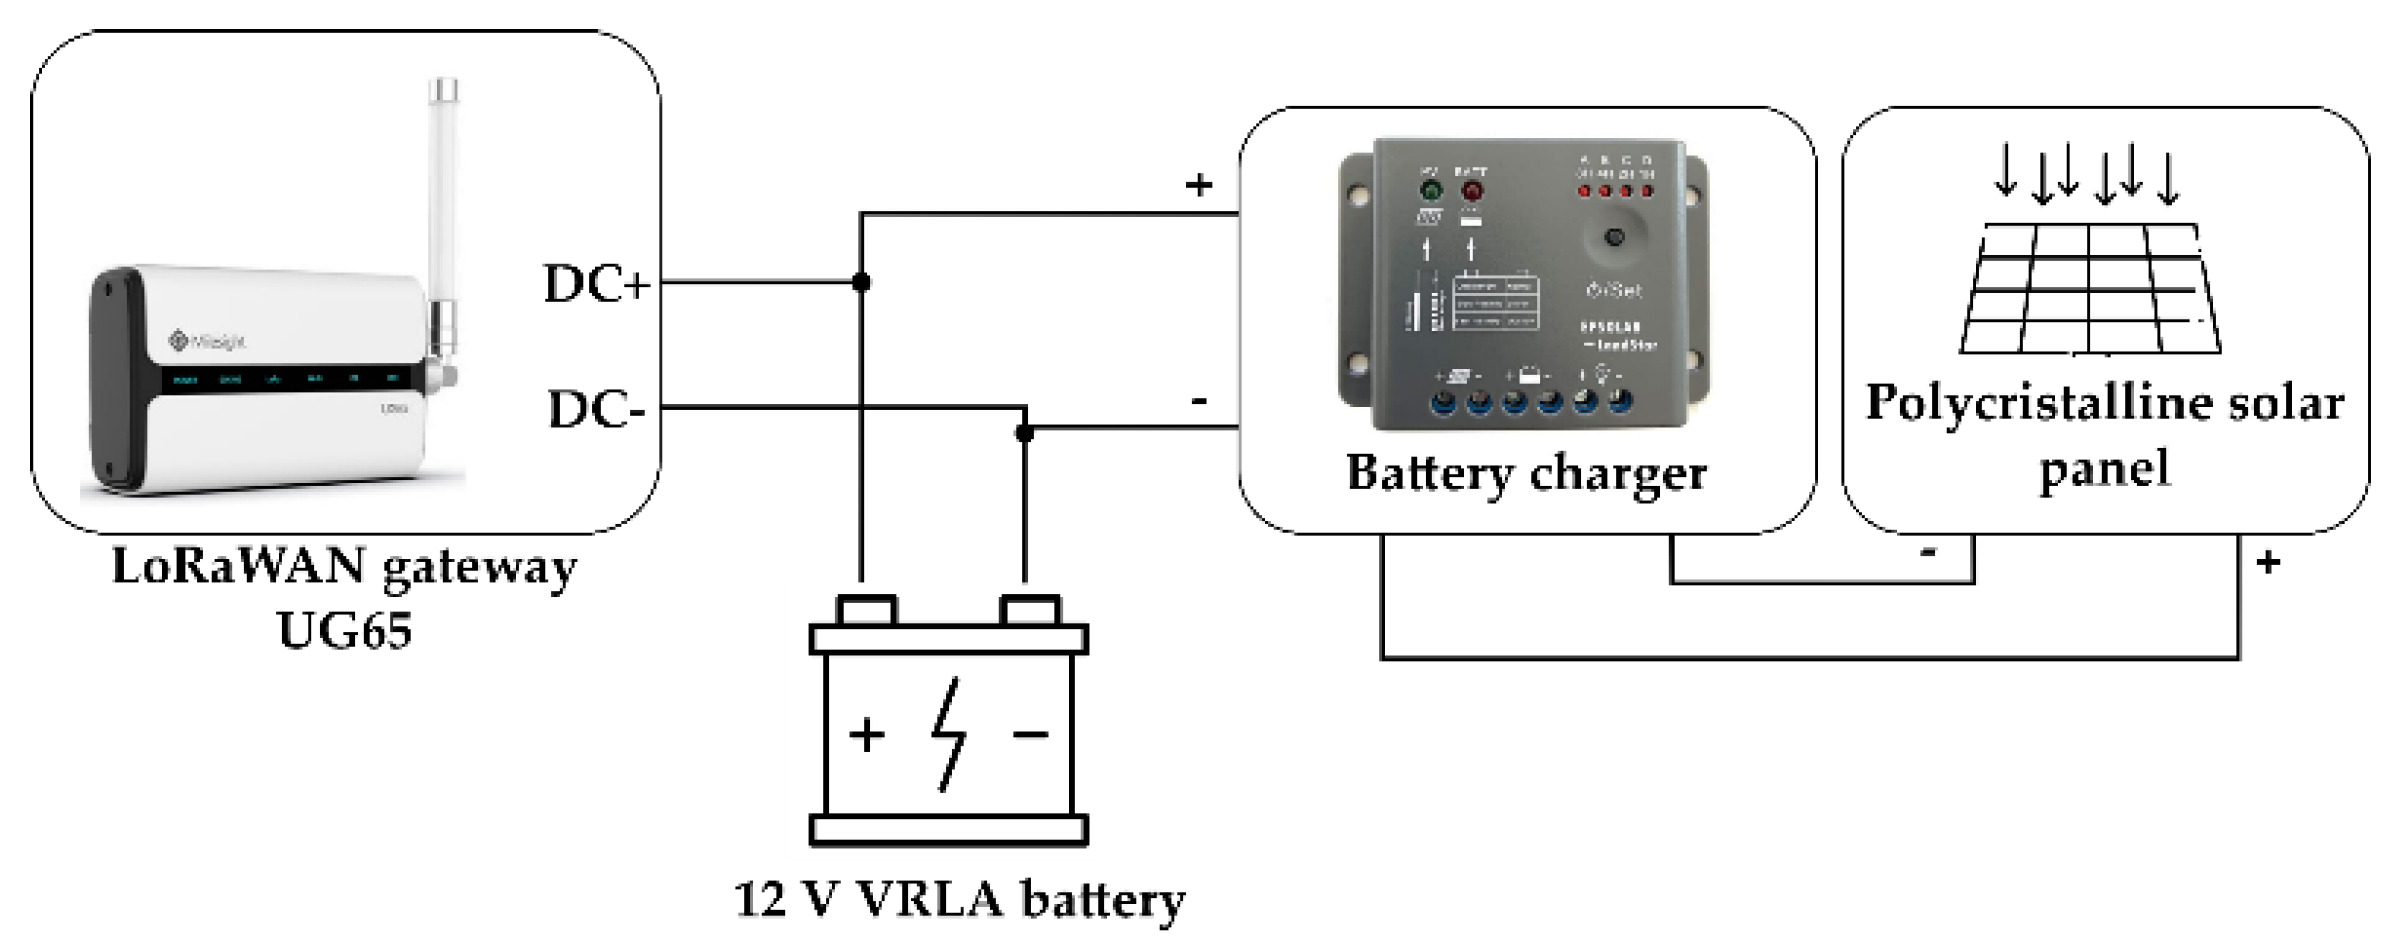
3.2. Gateway Assembly
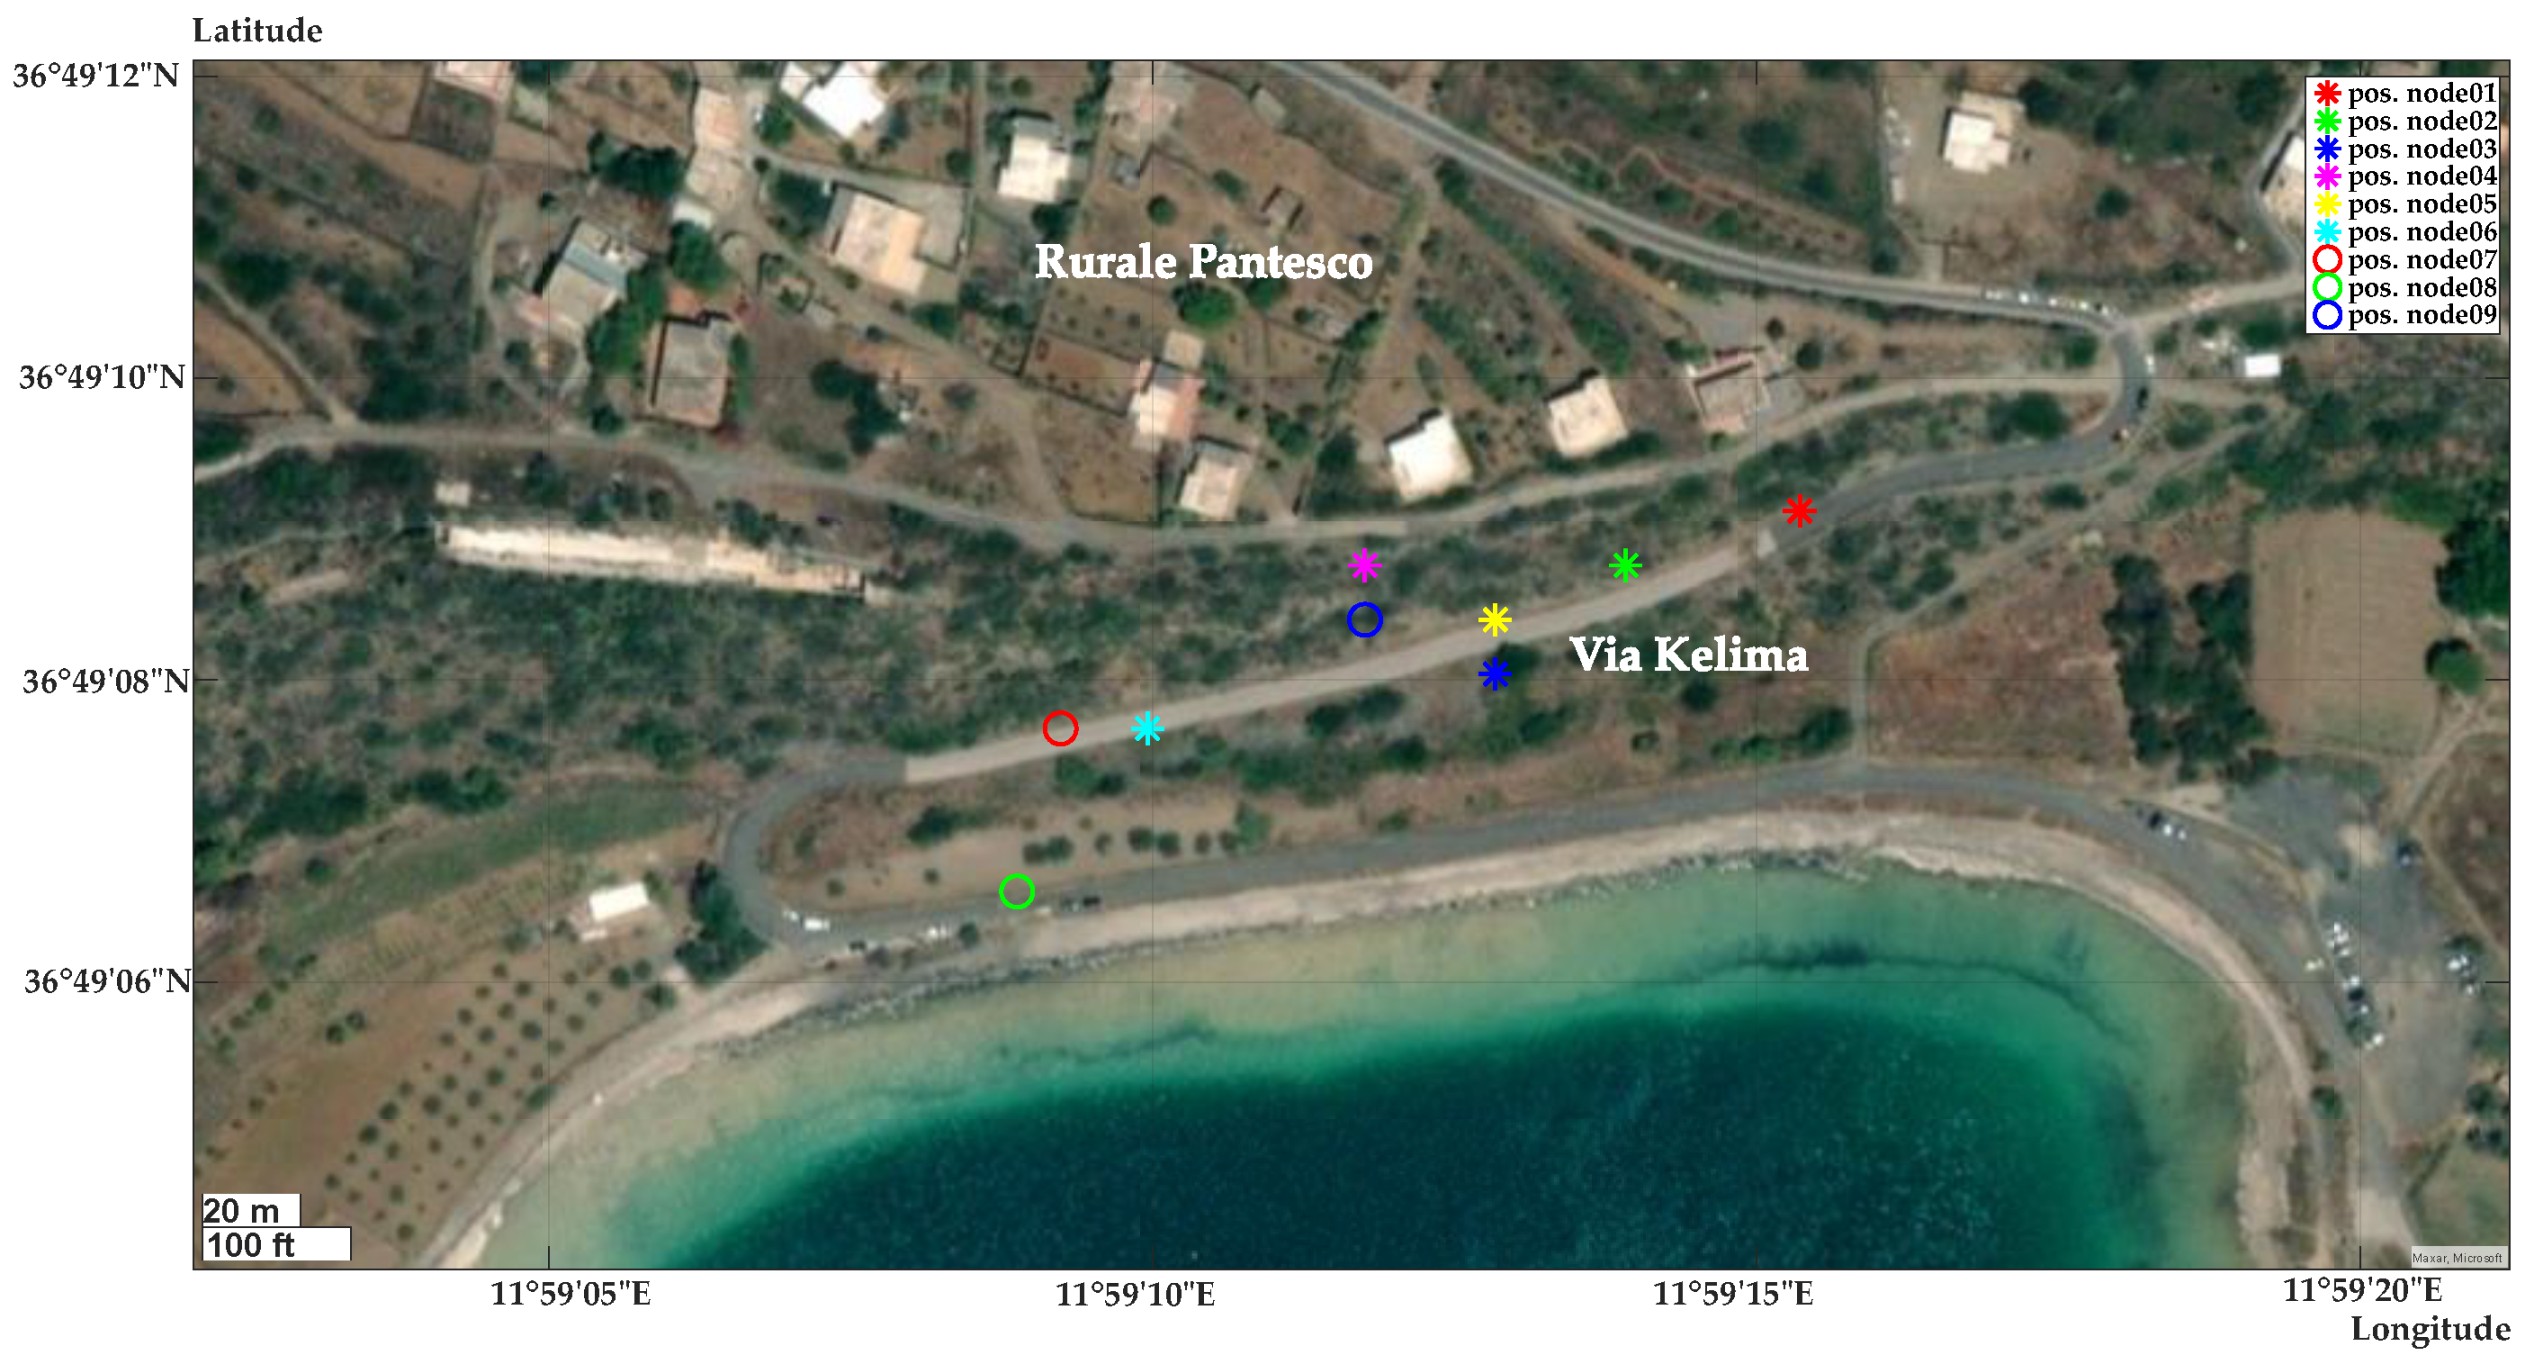
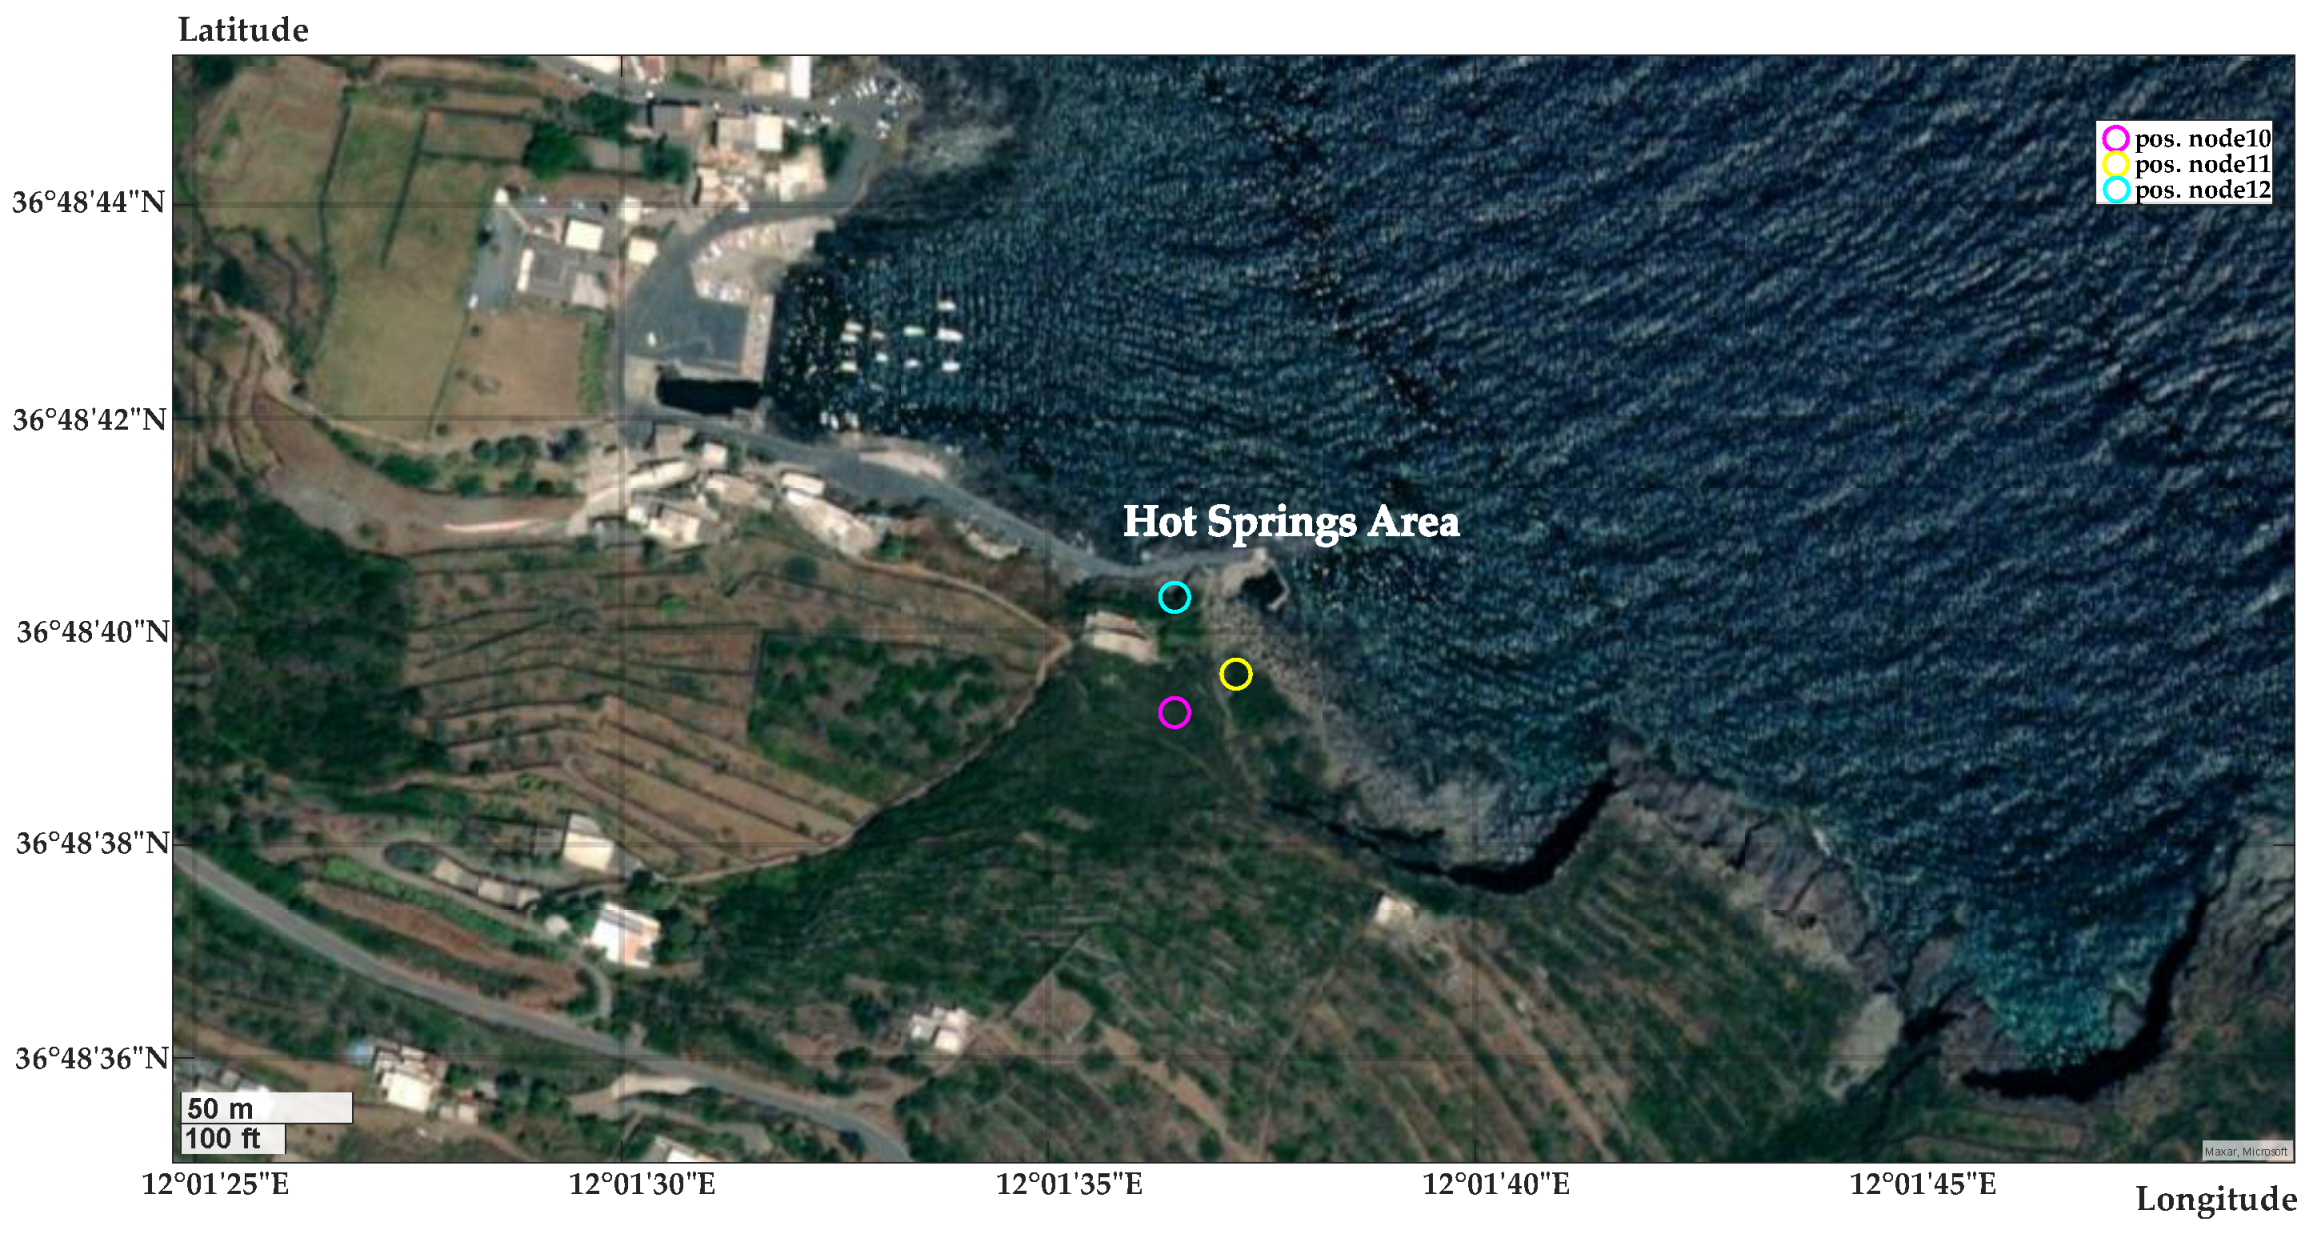
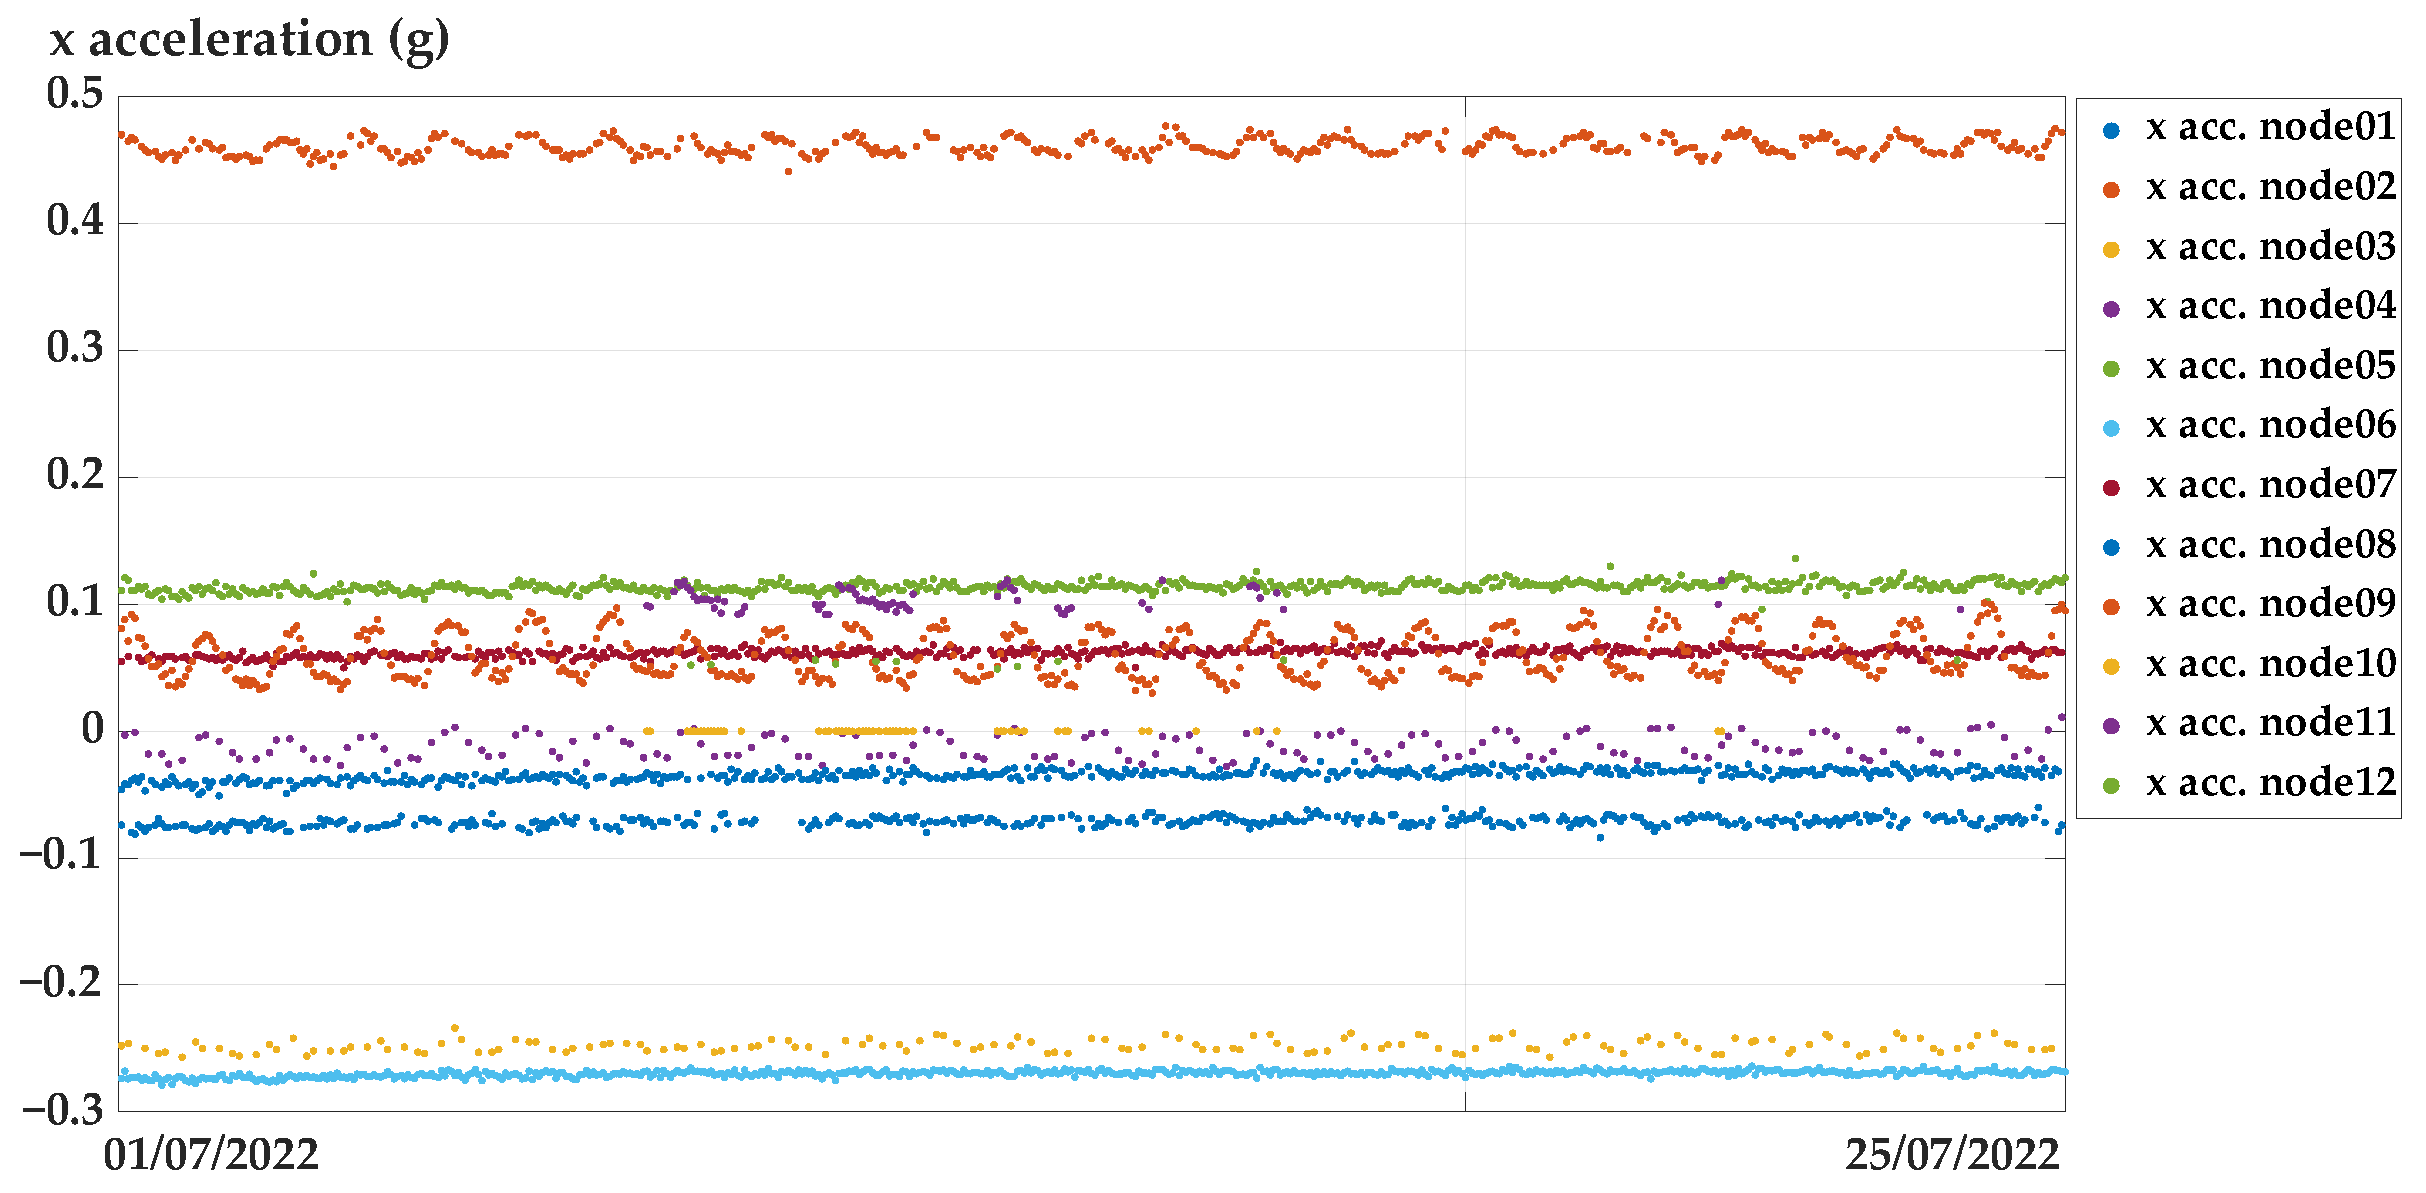
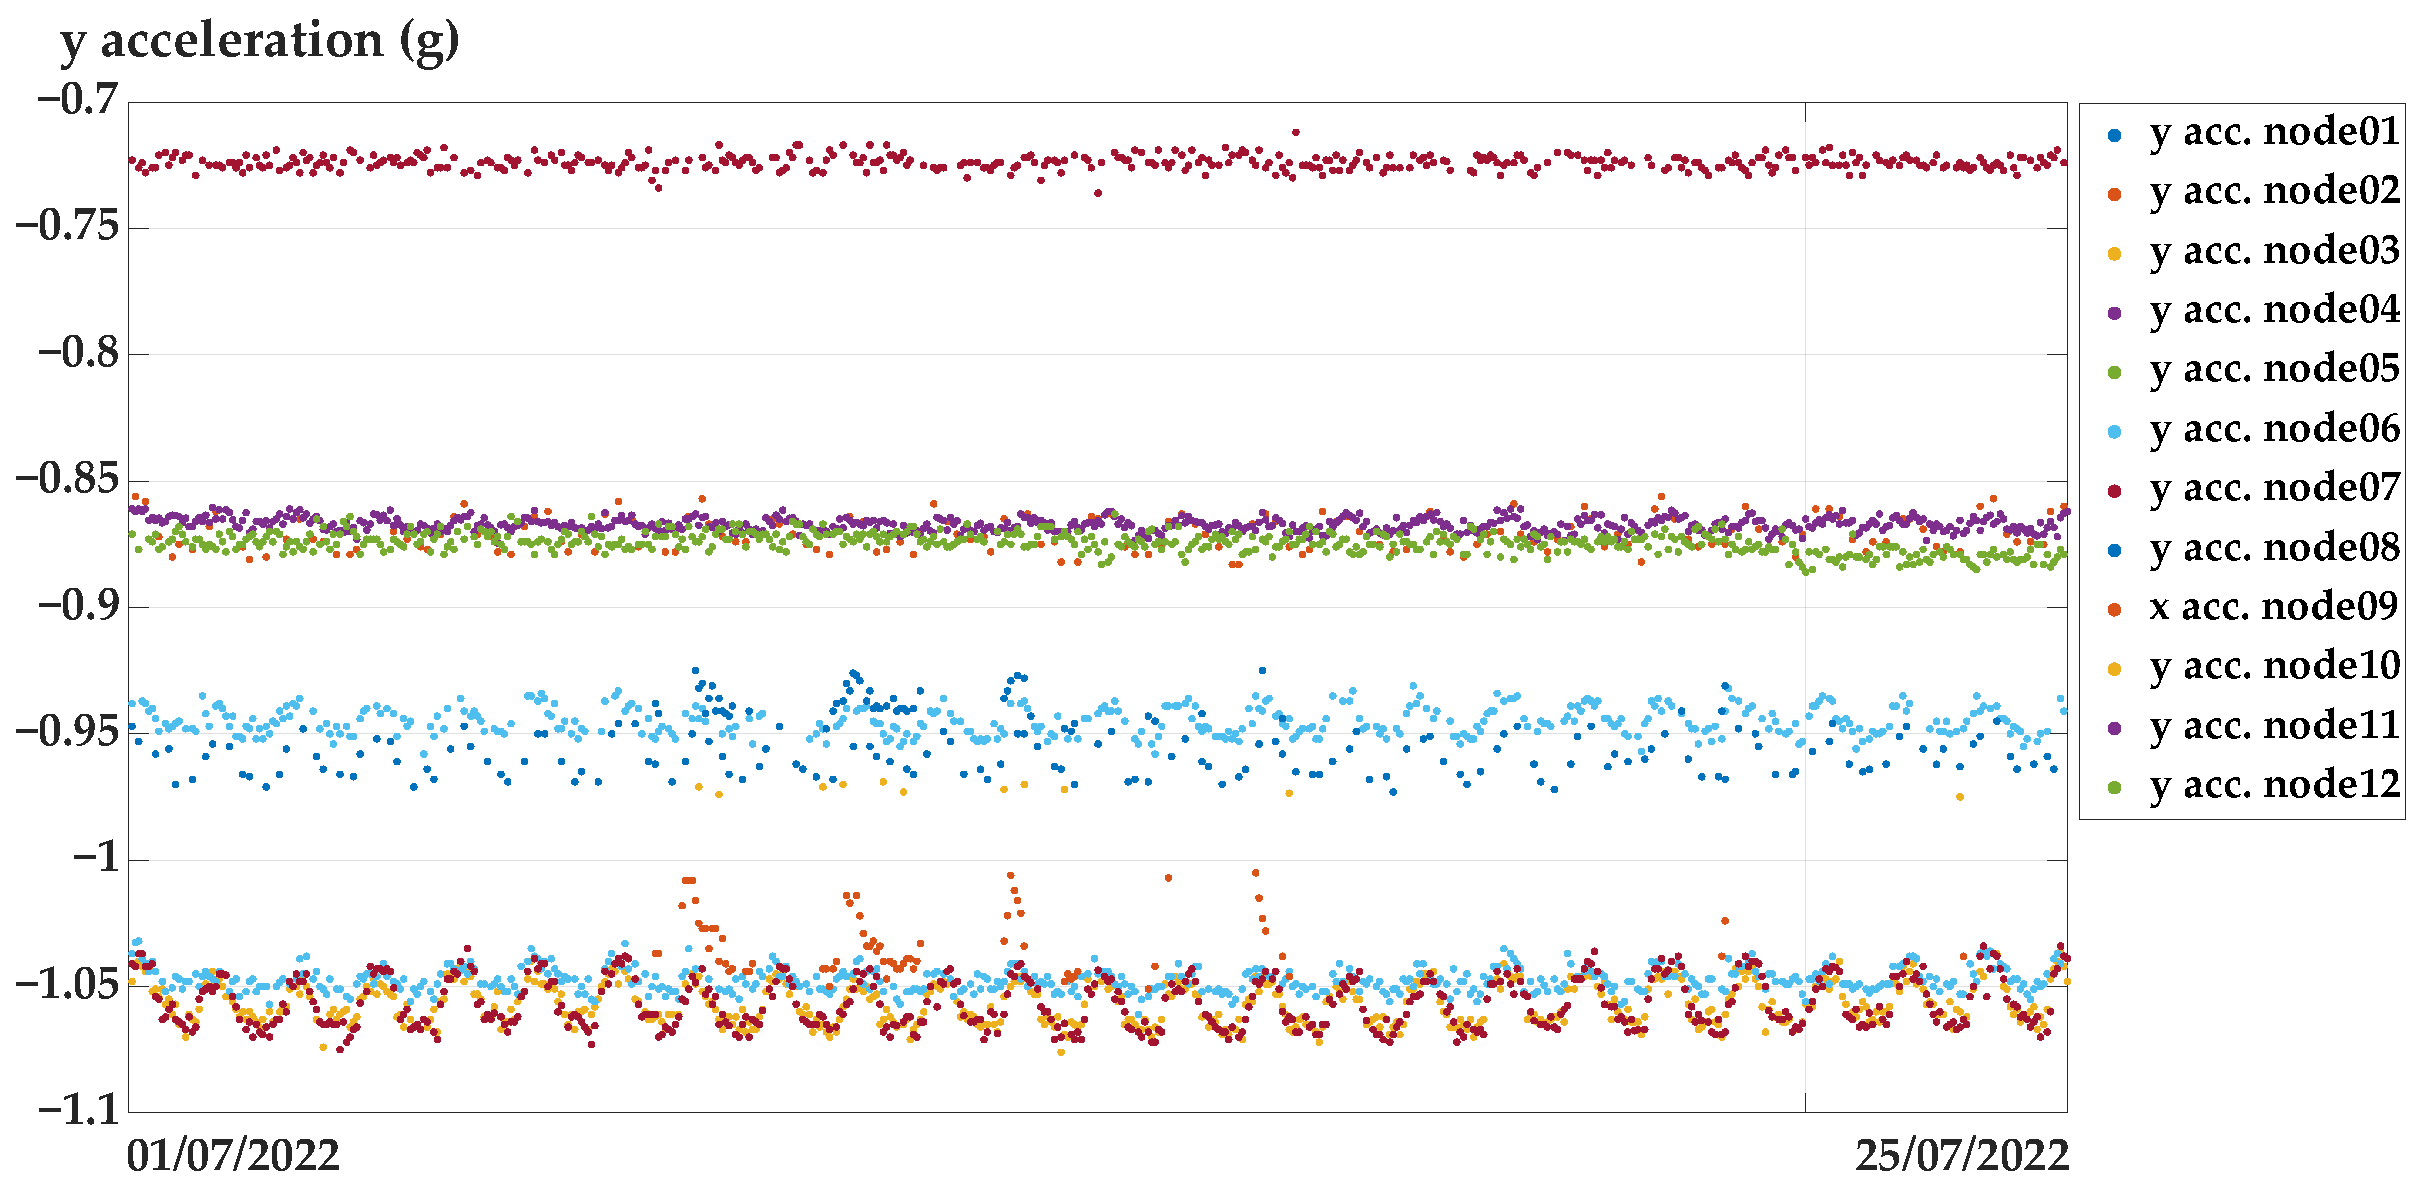
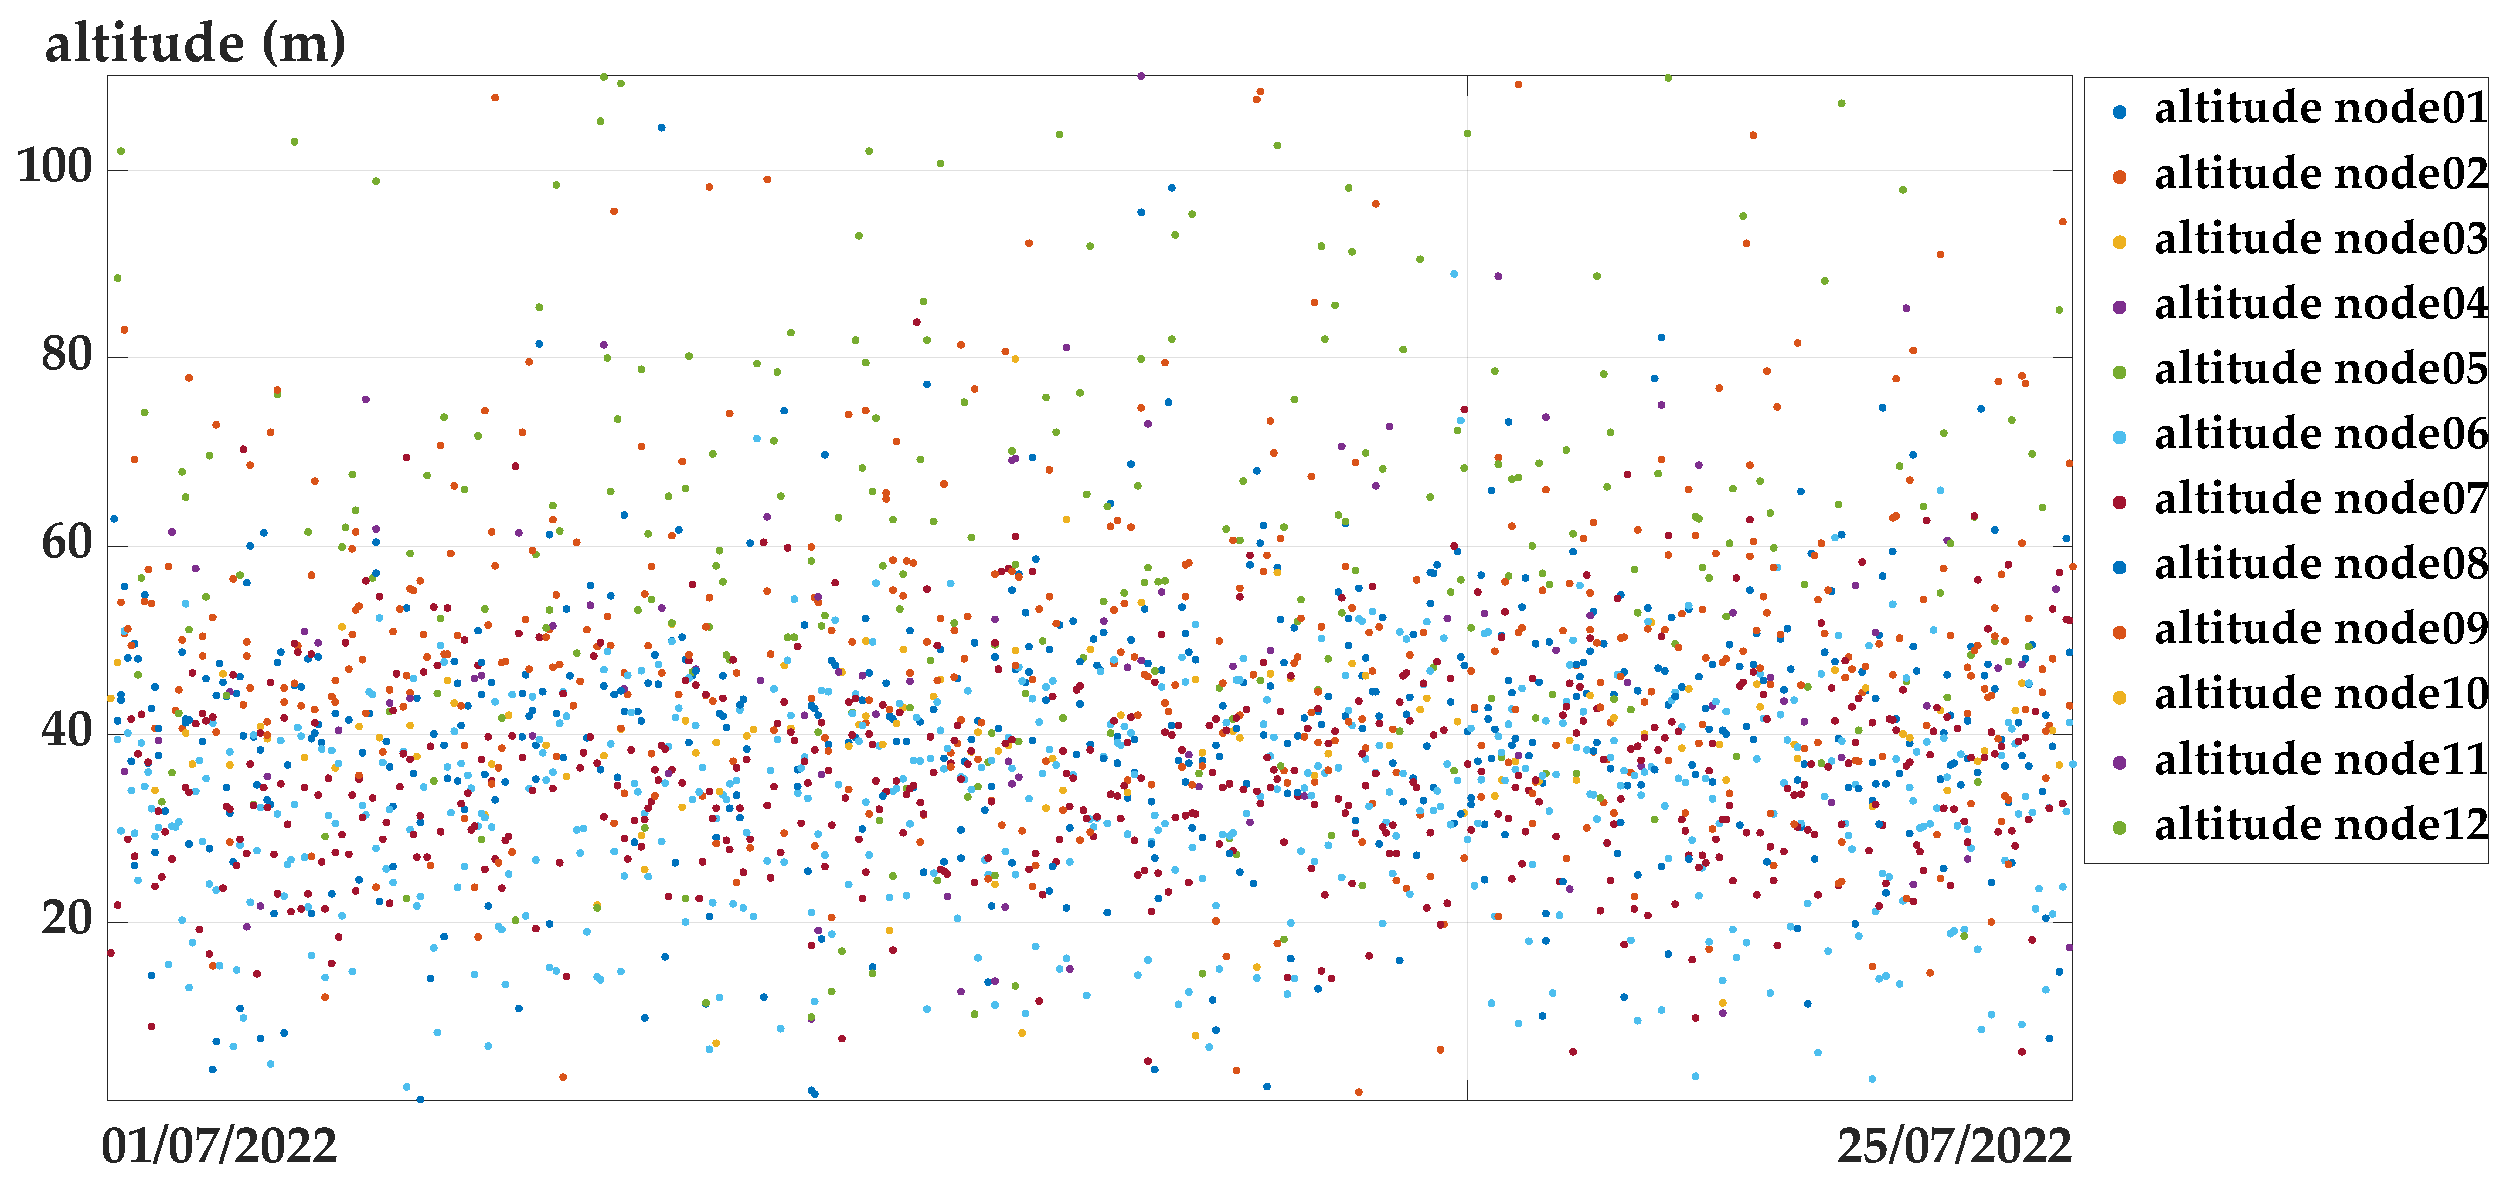
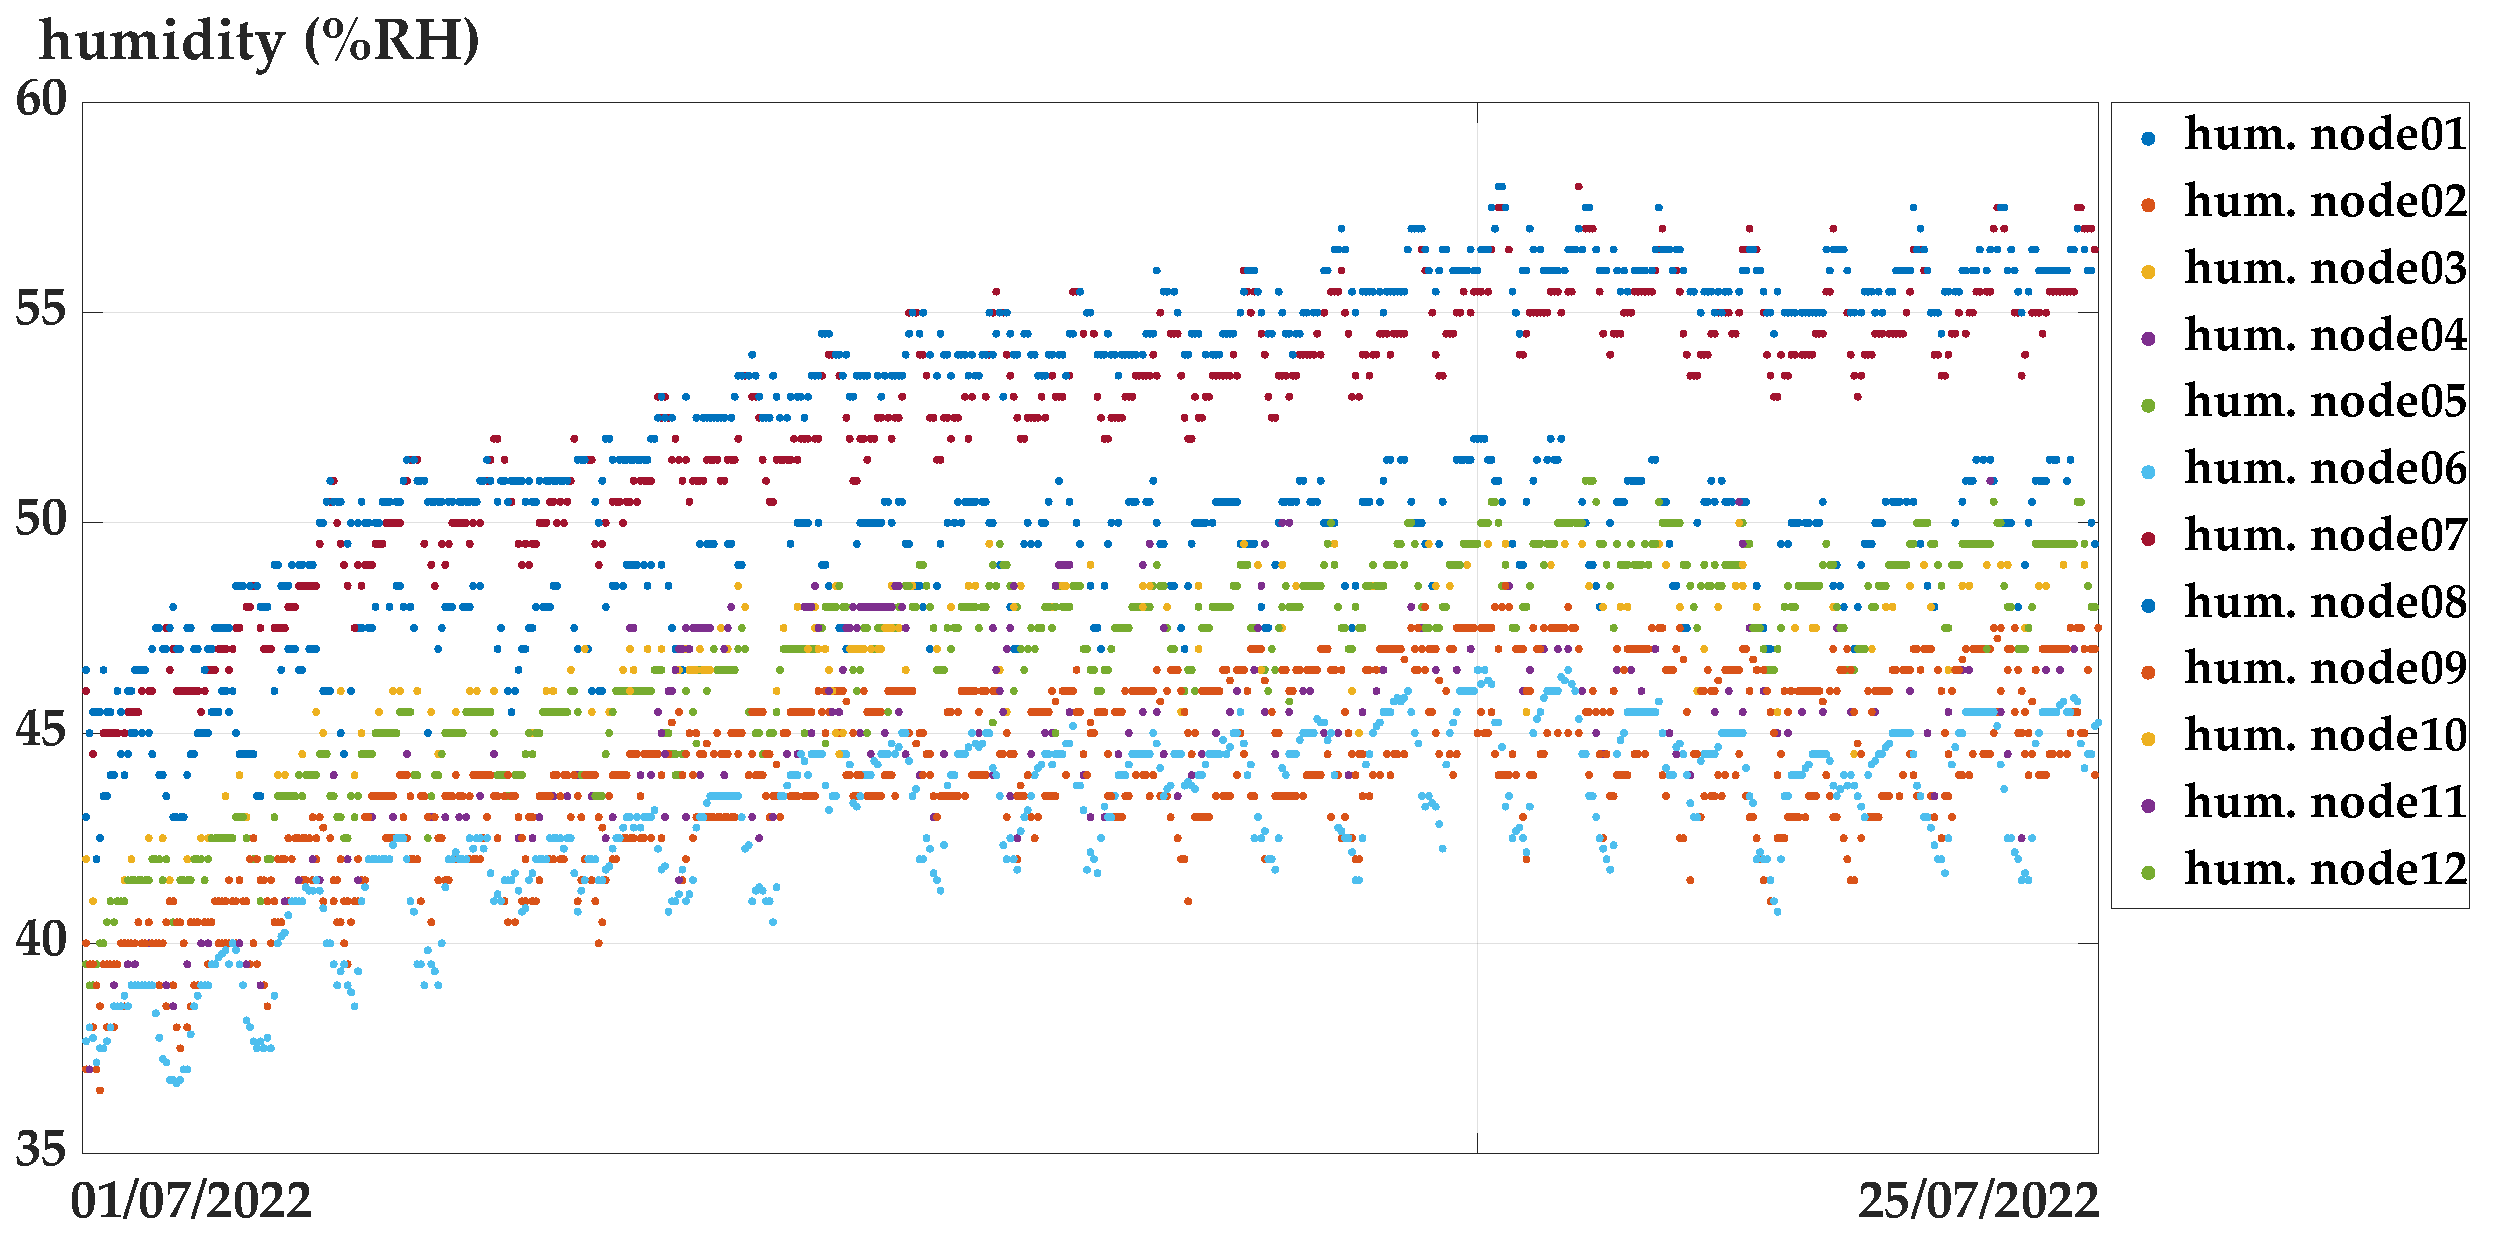
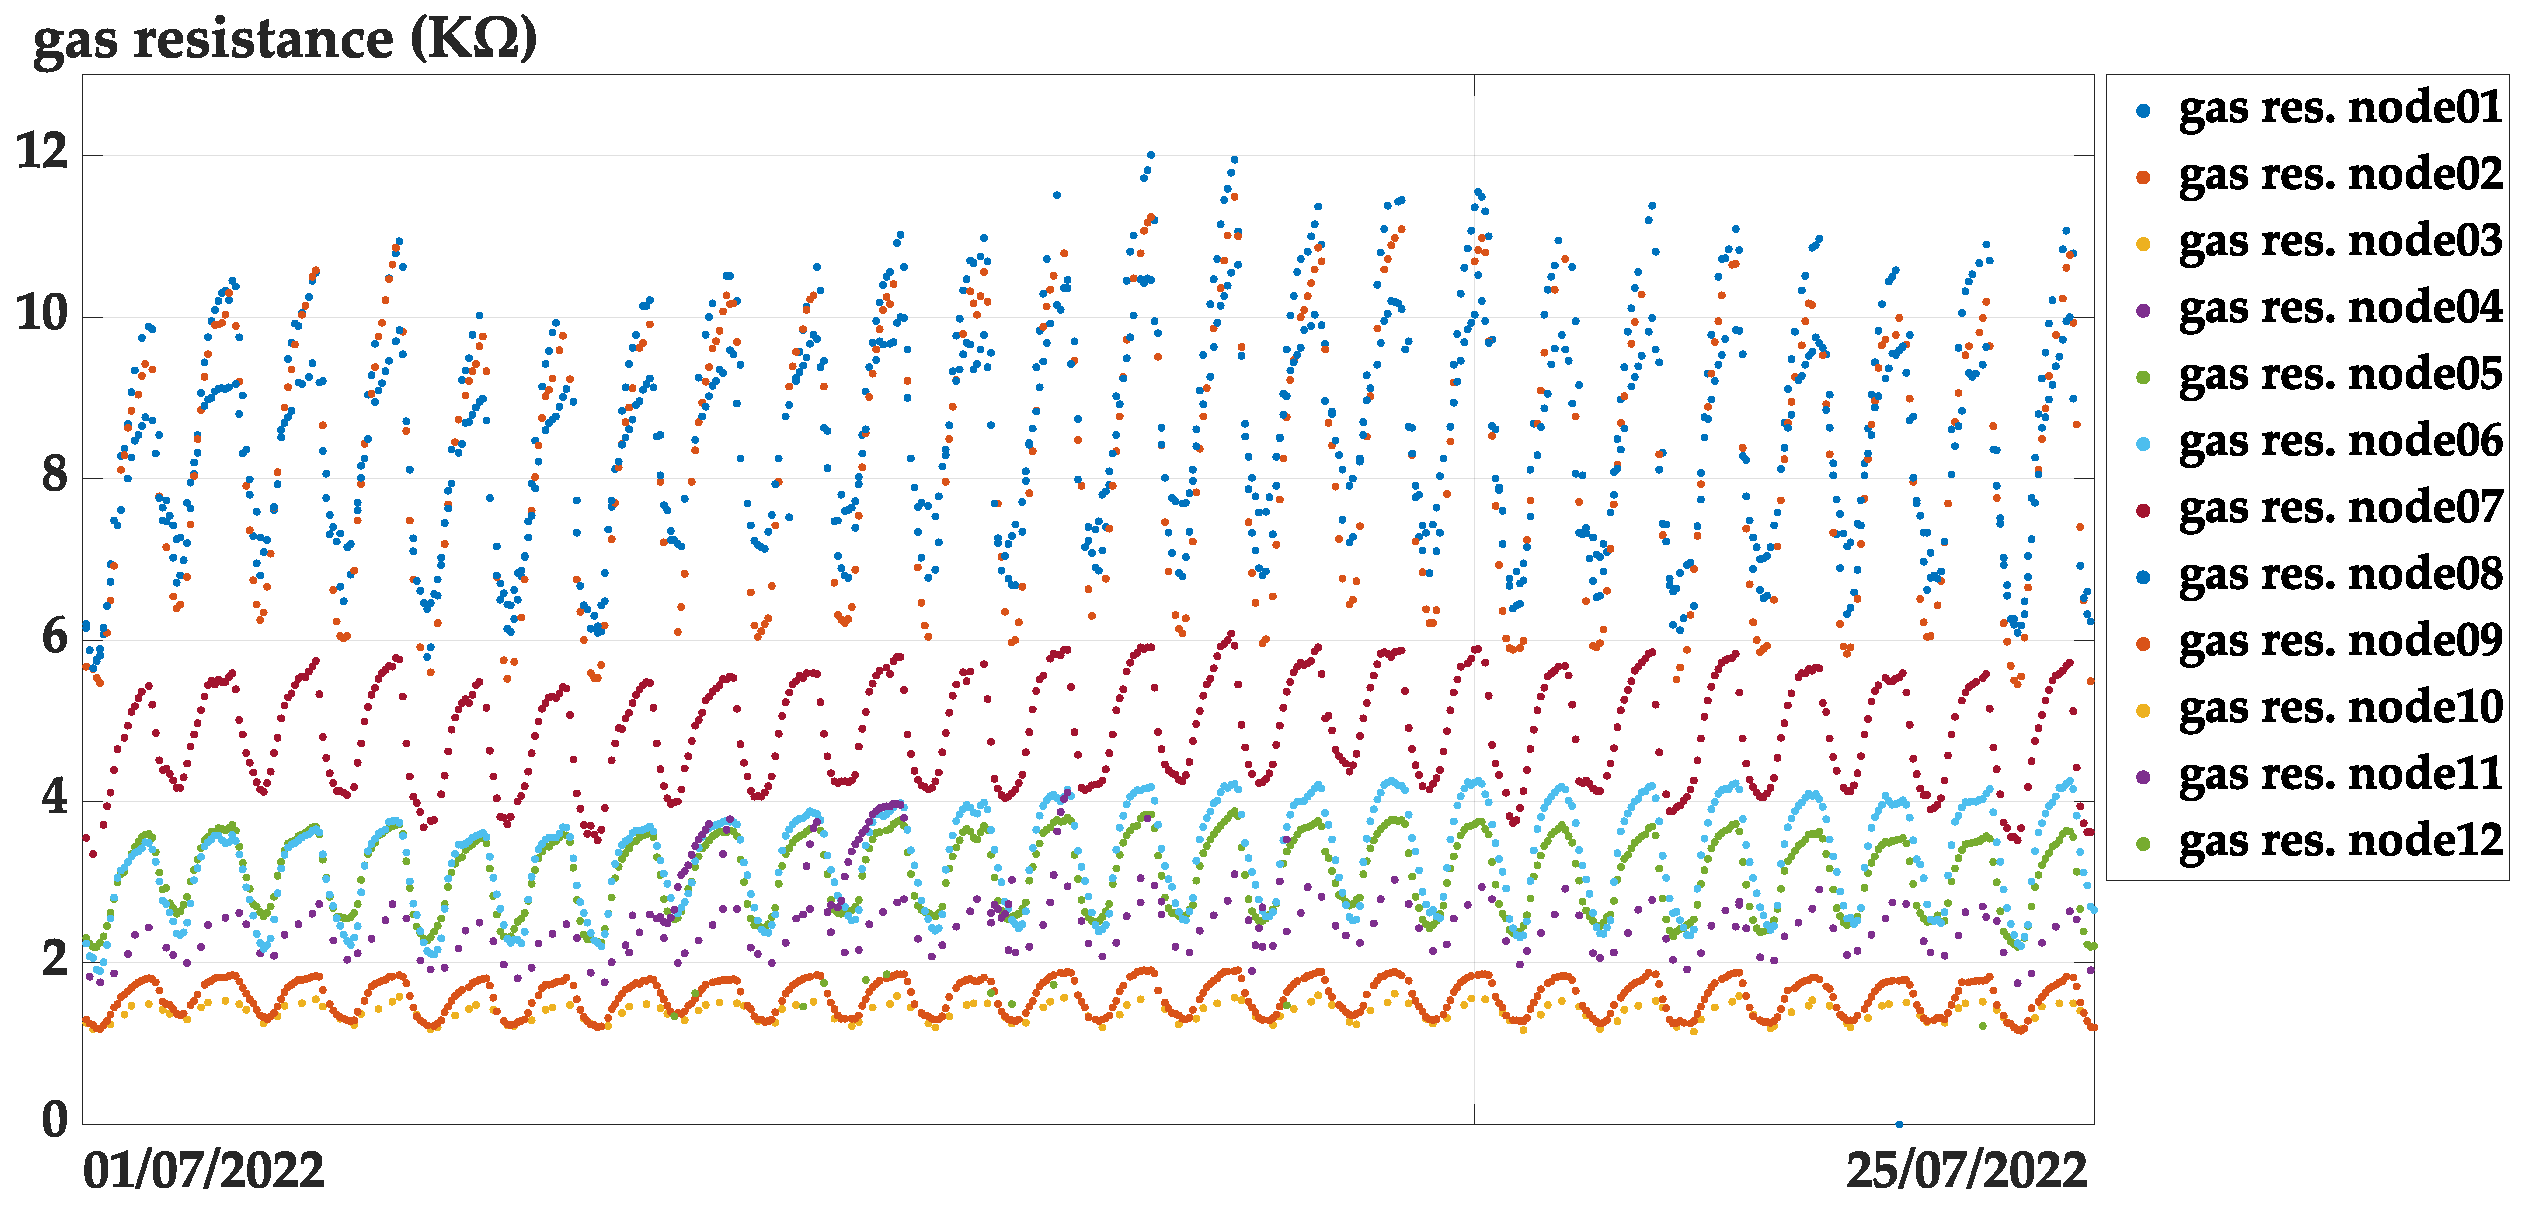
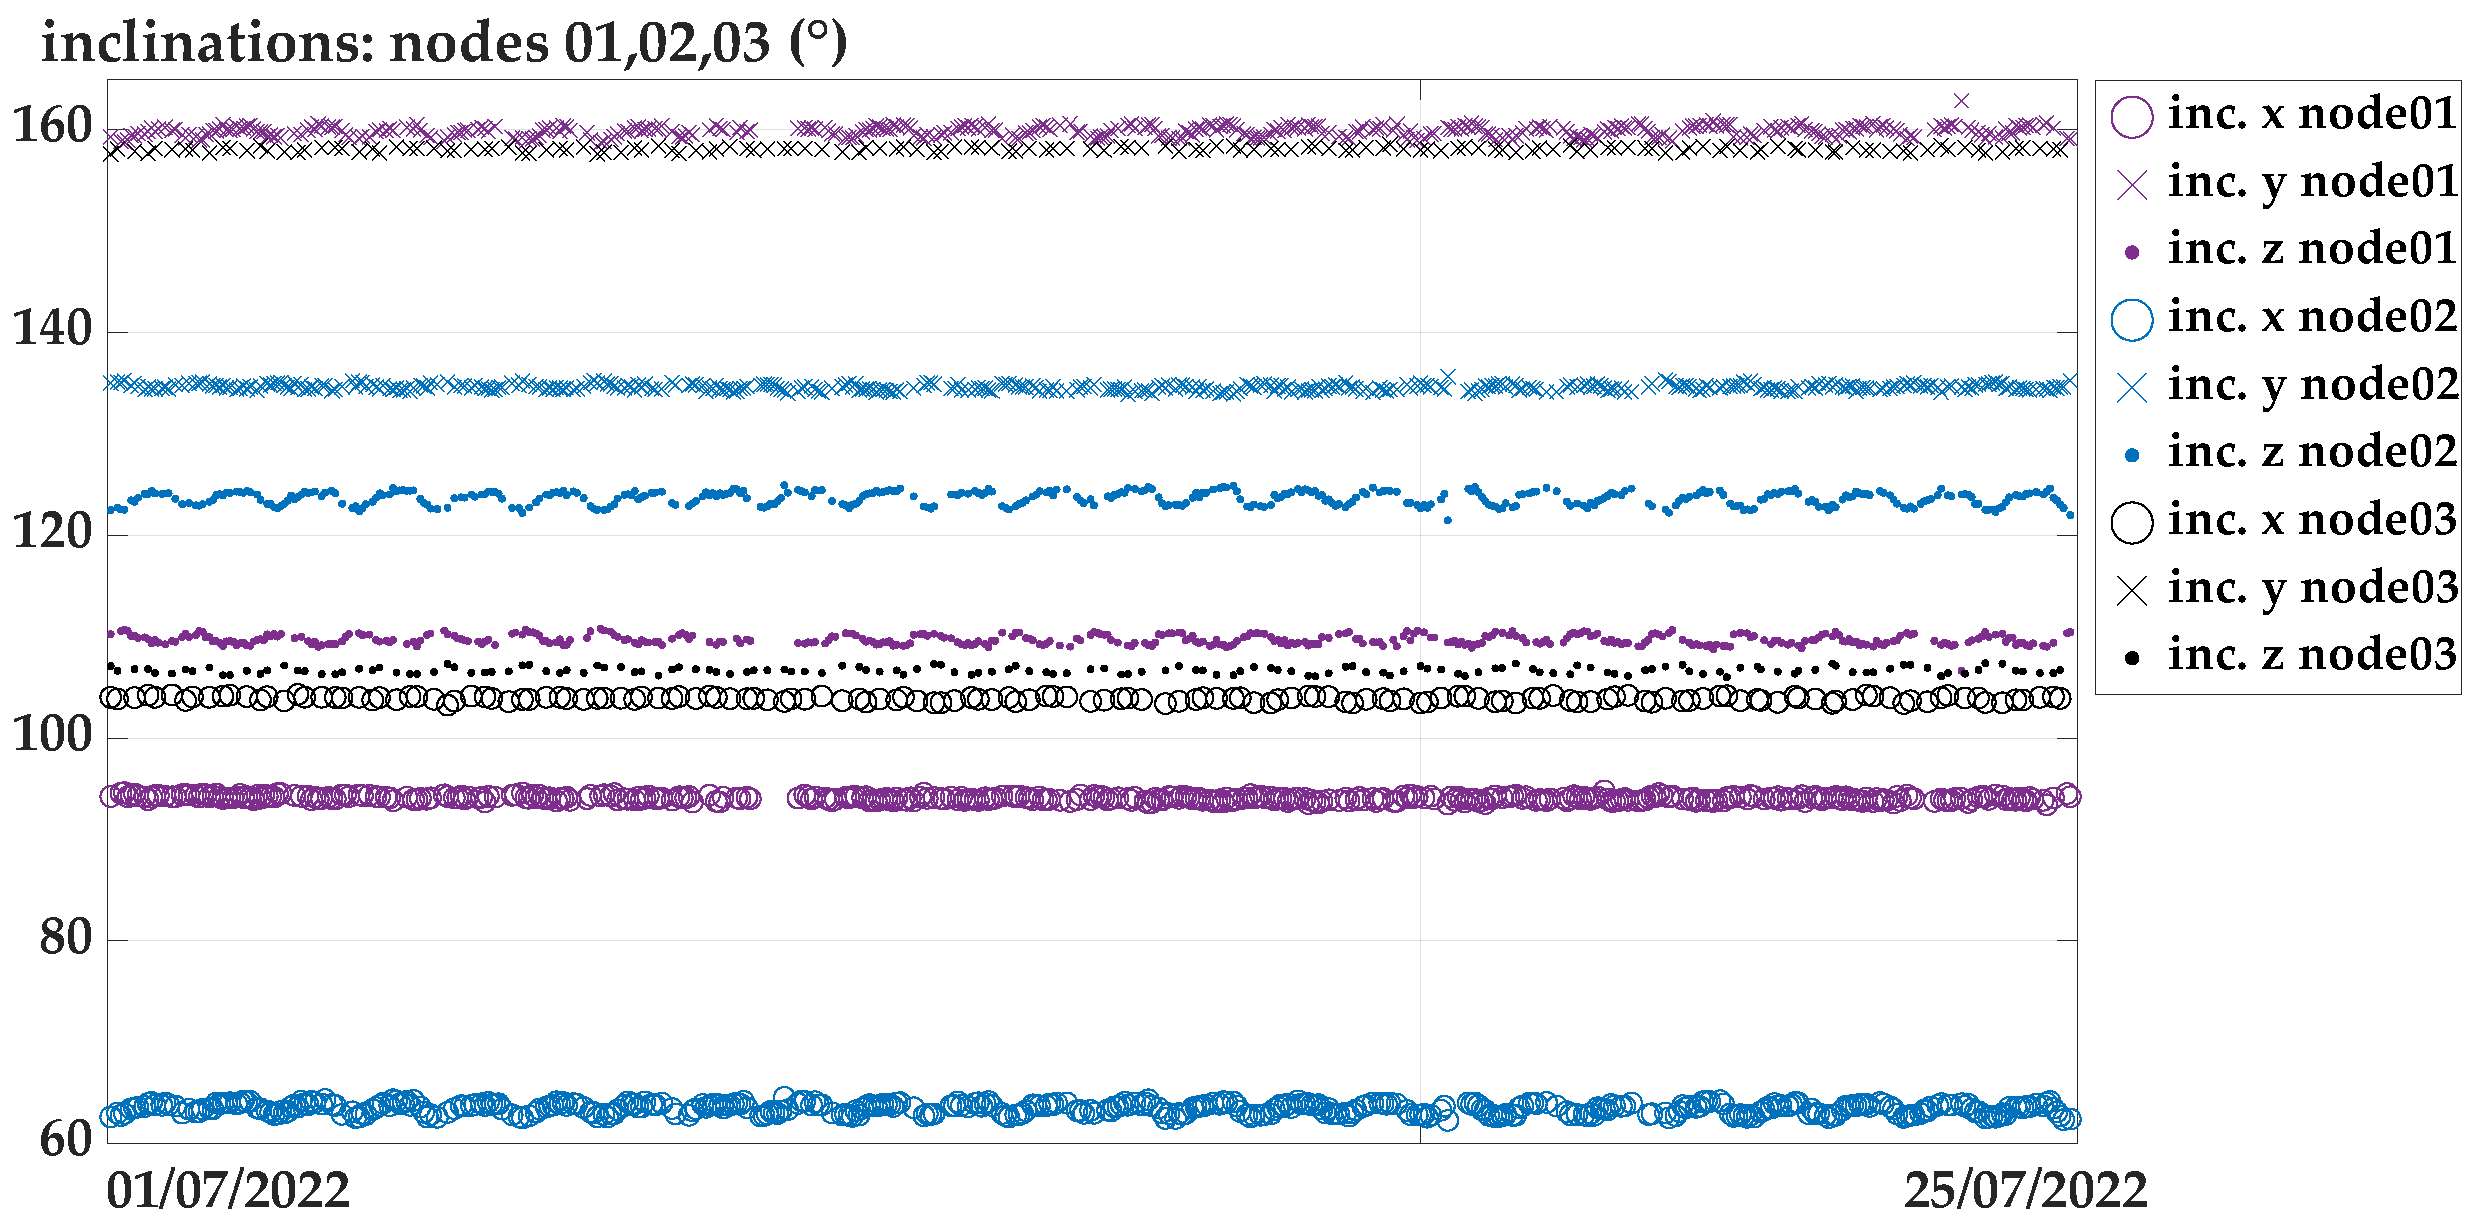
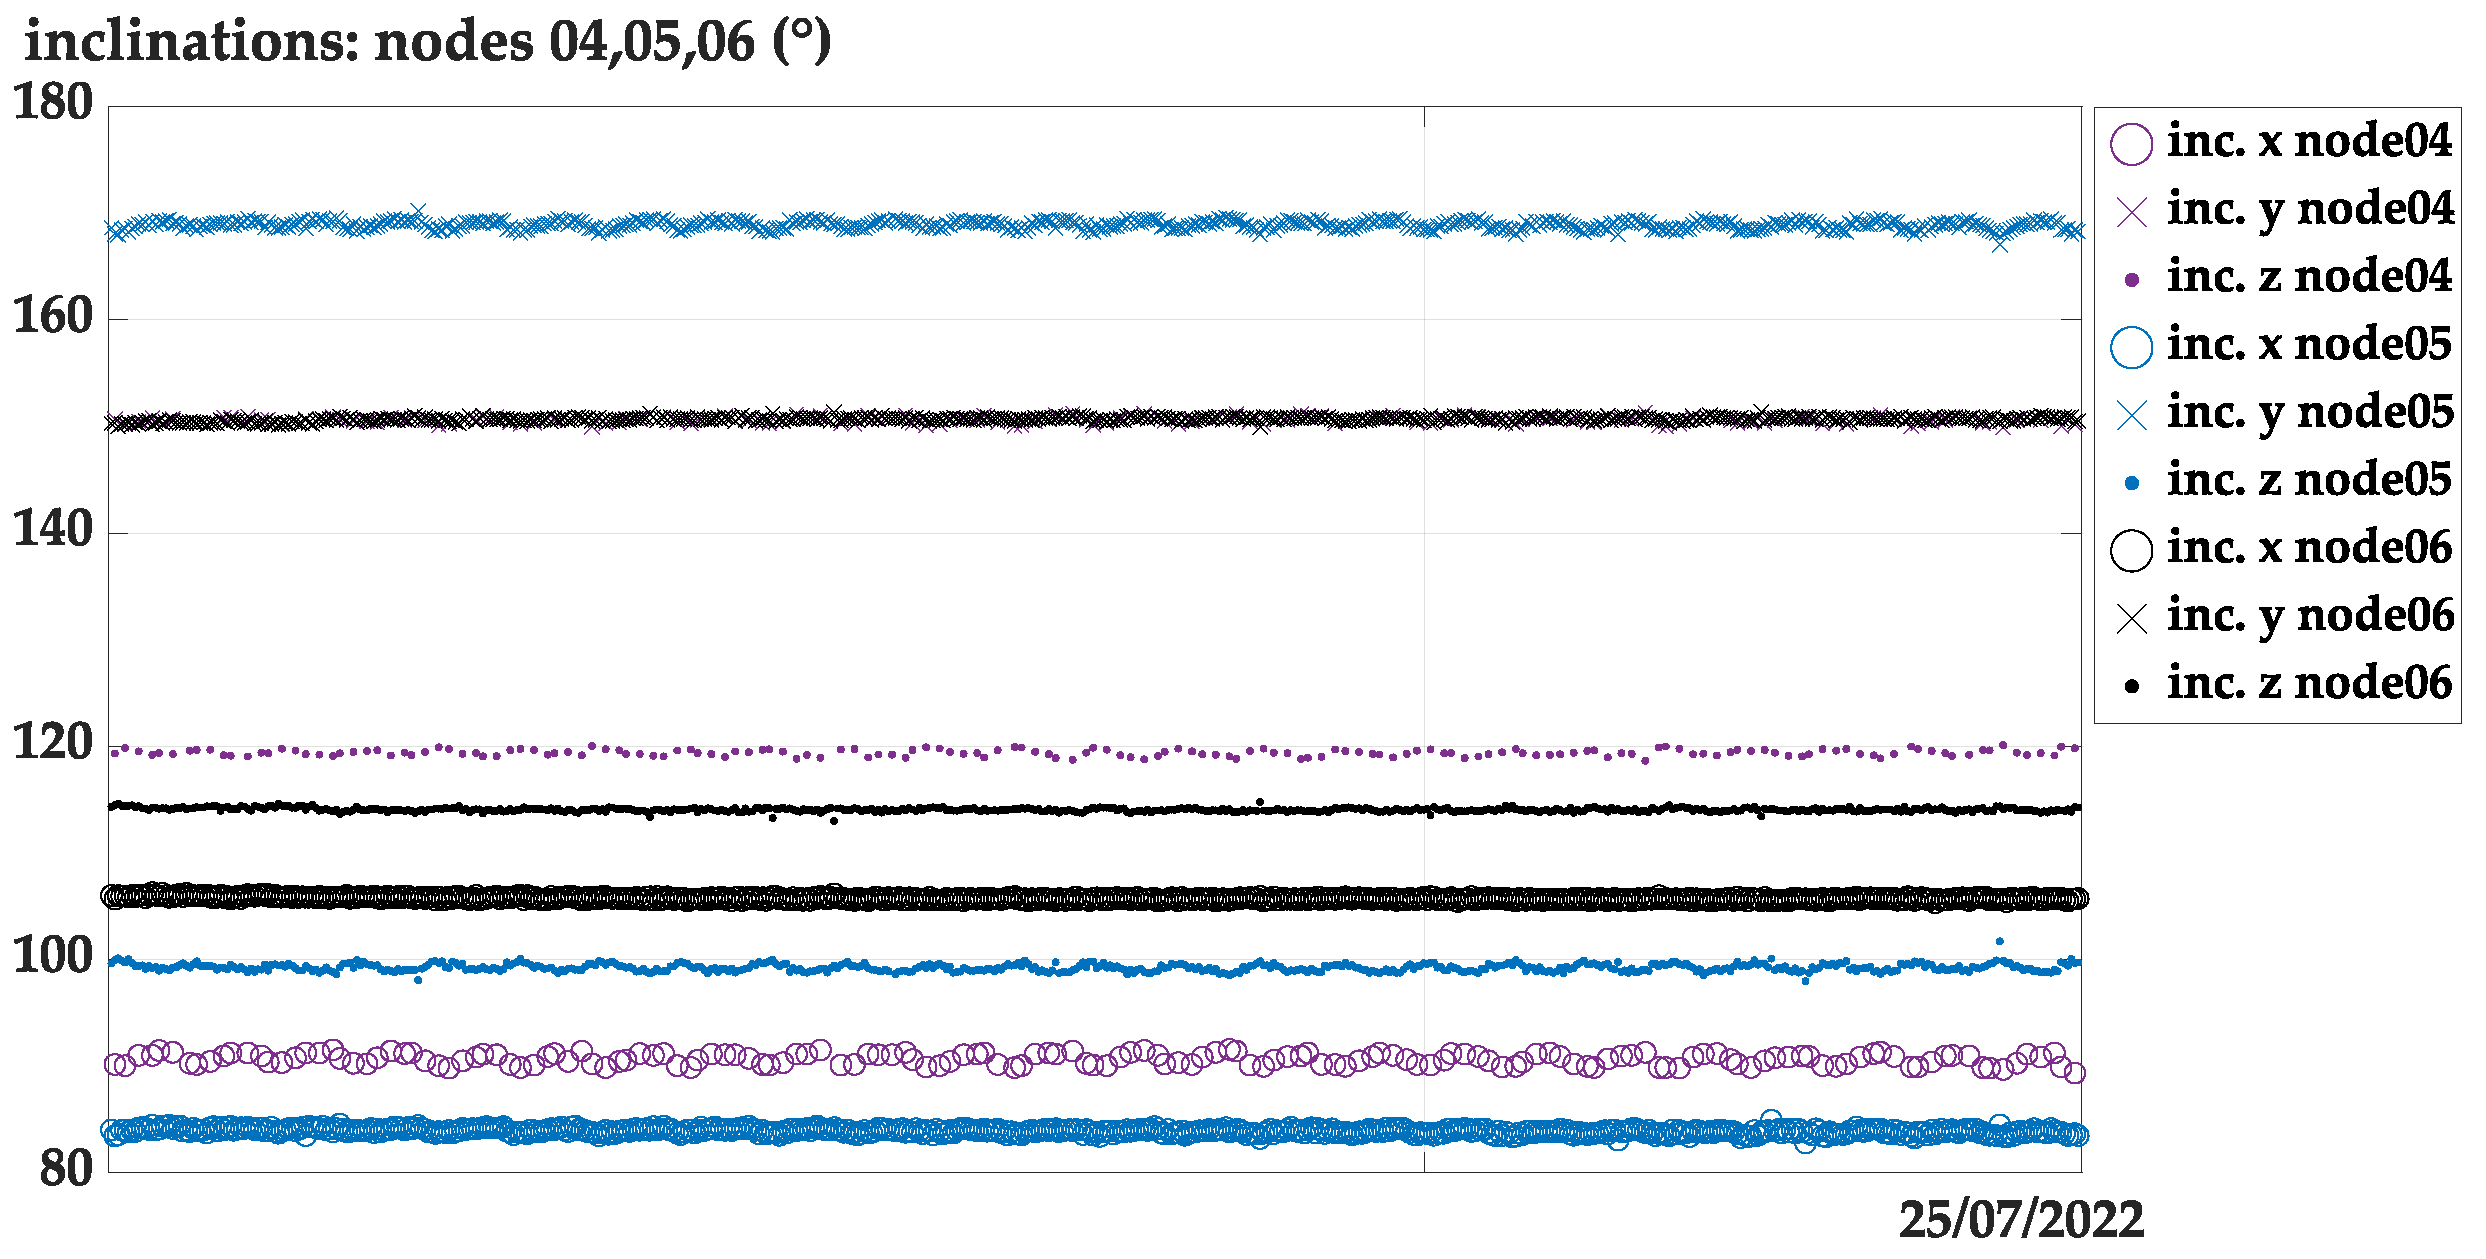
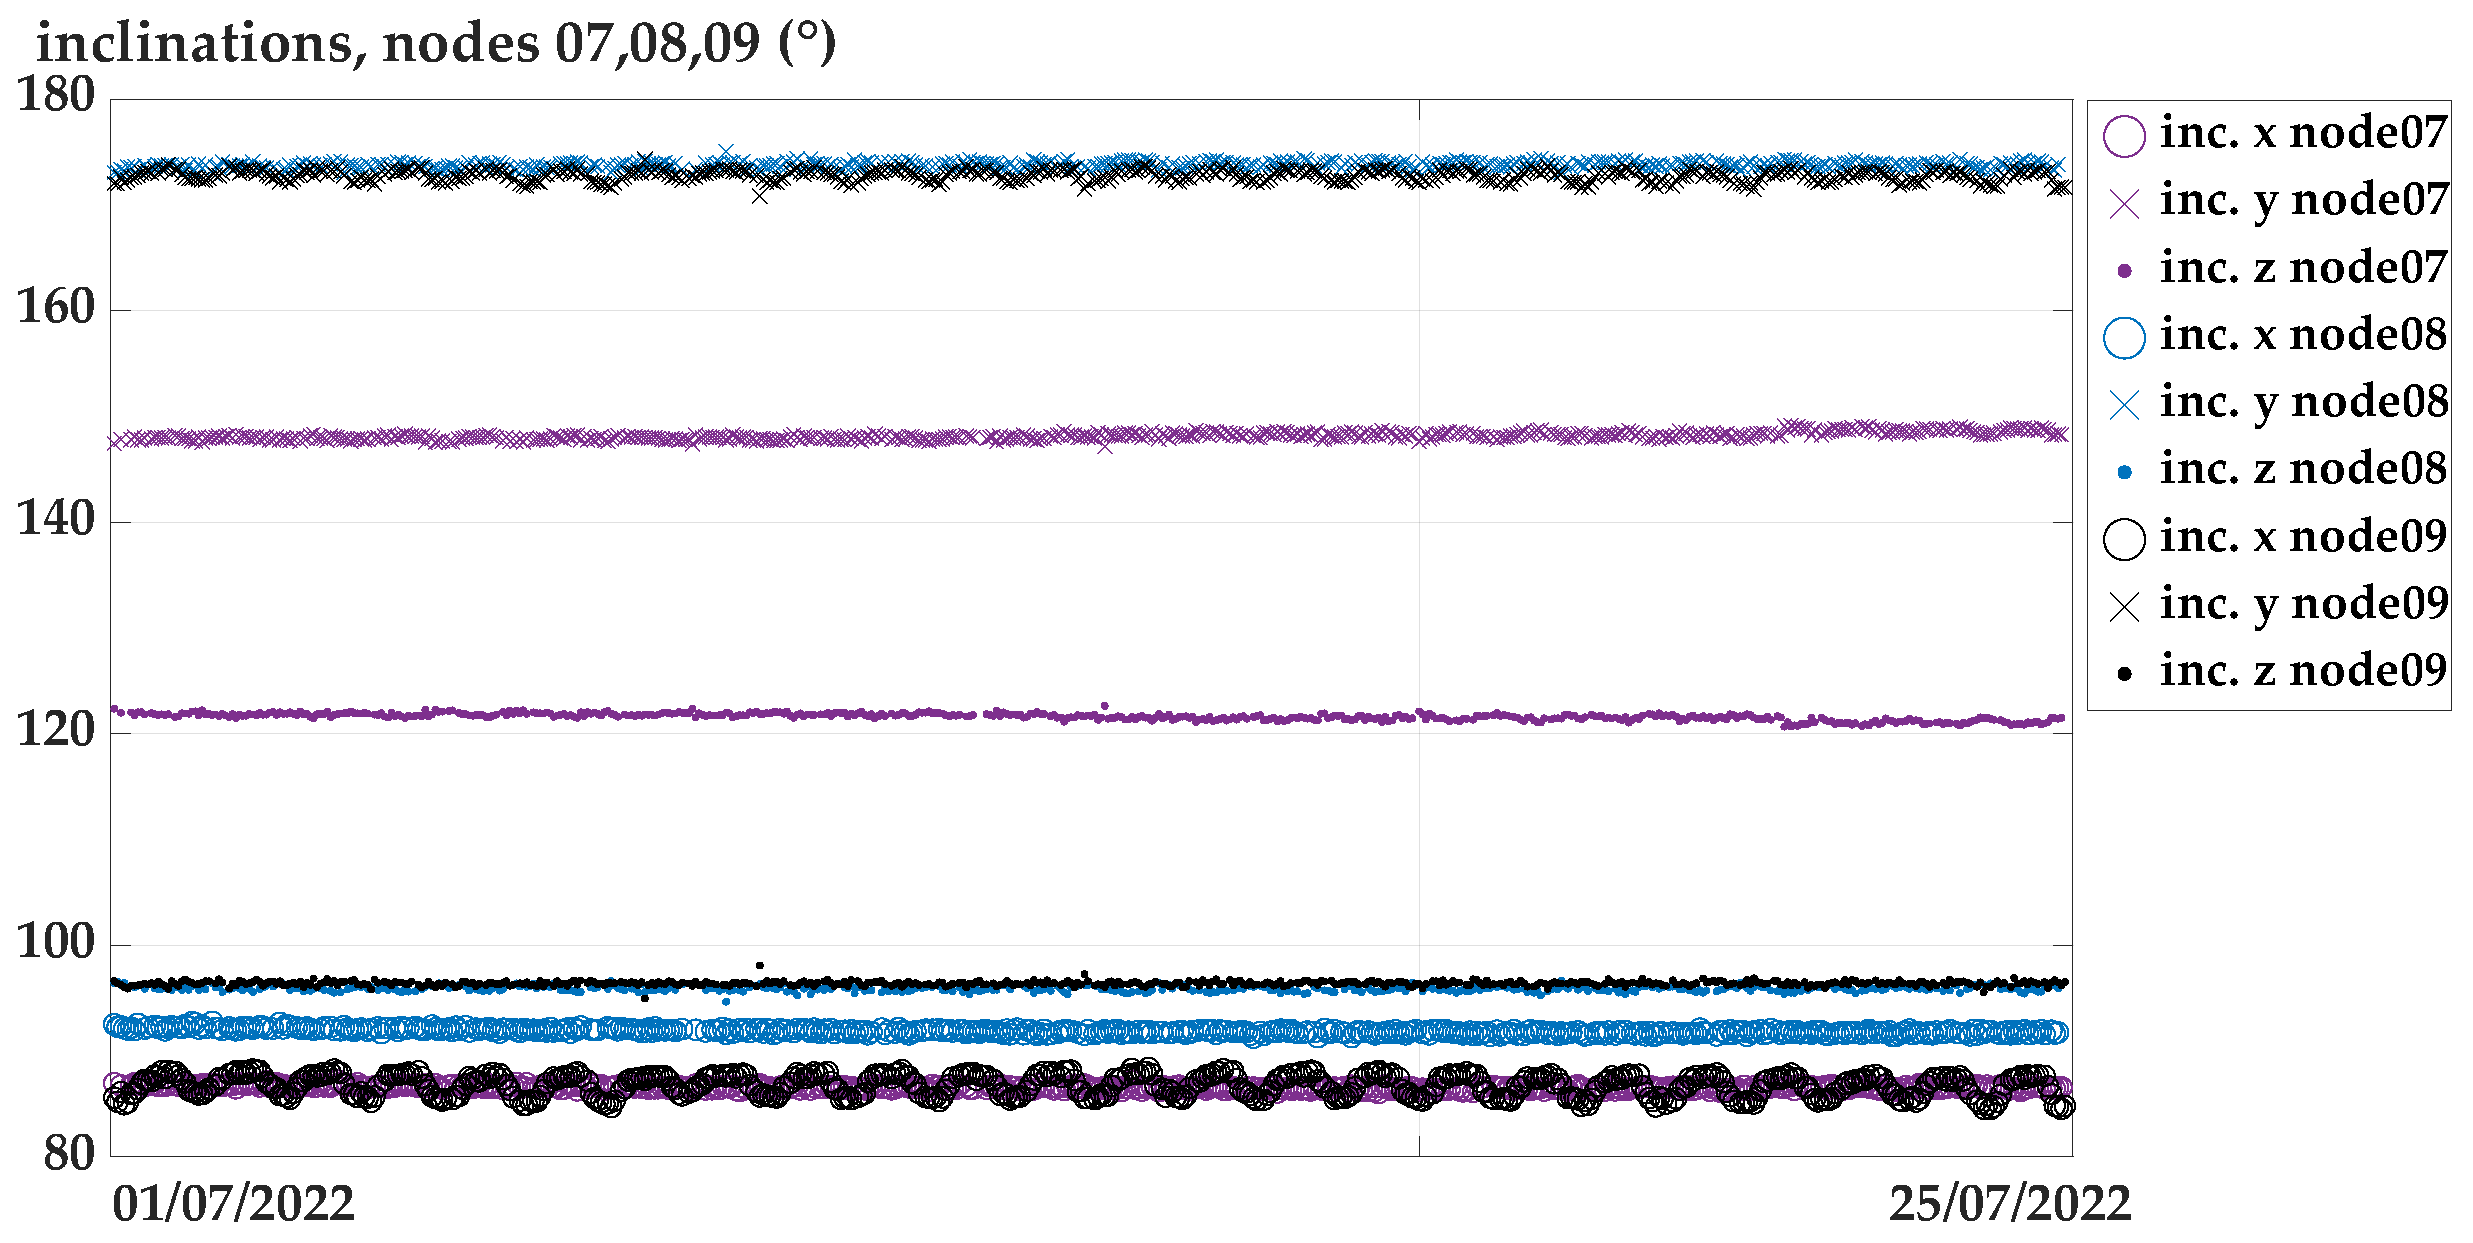
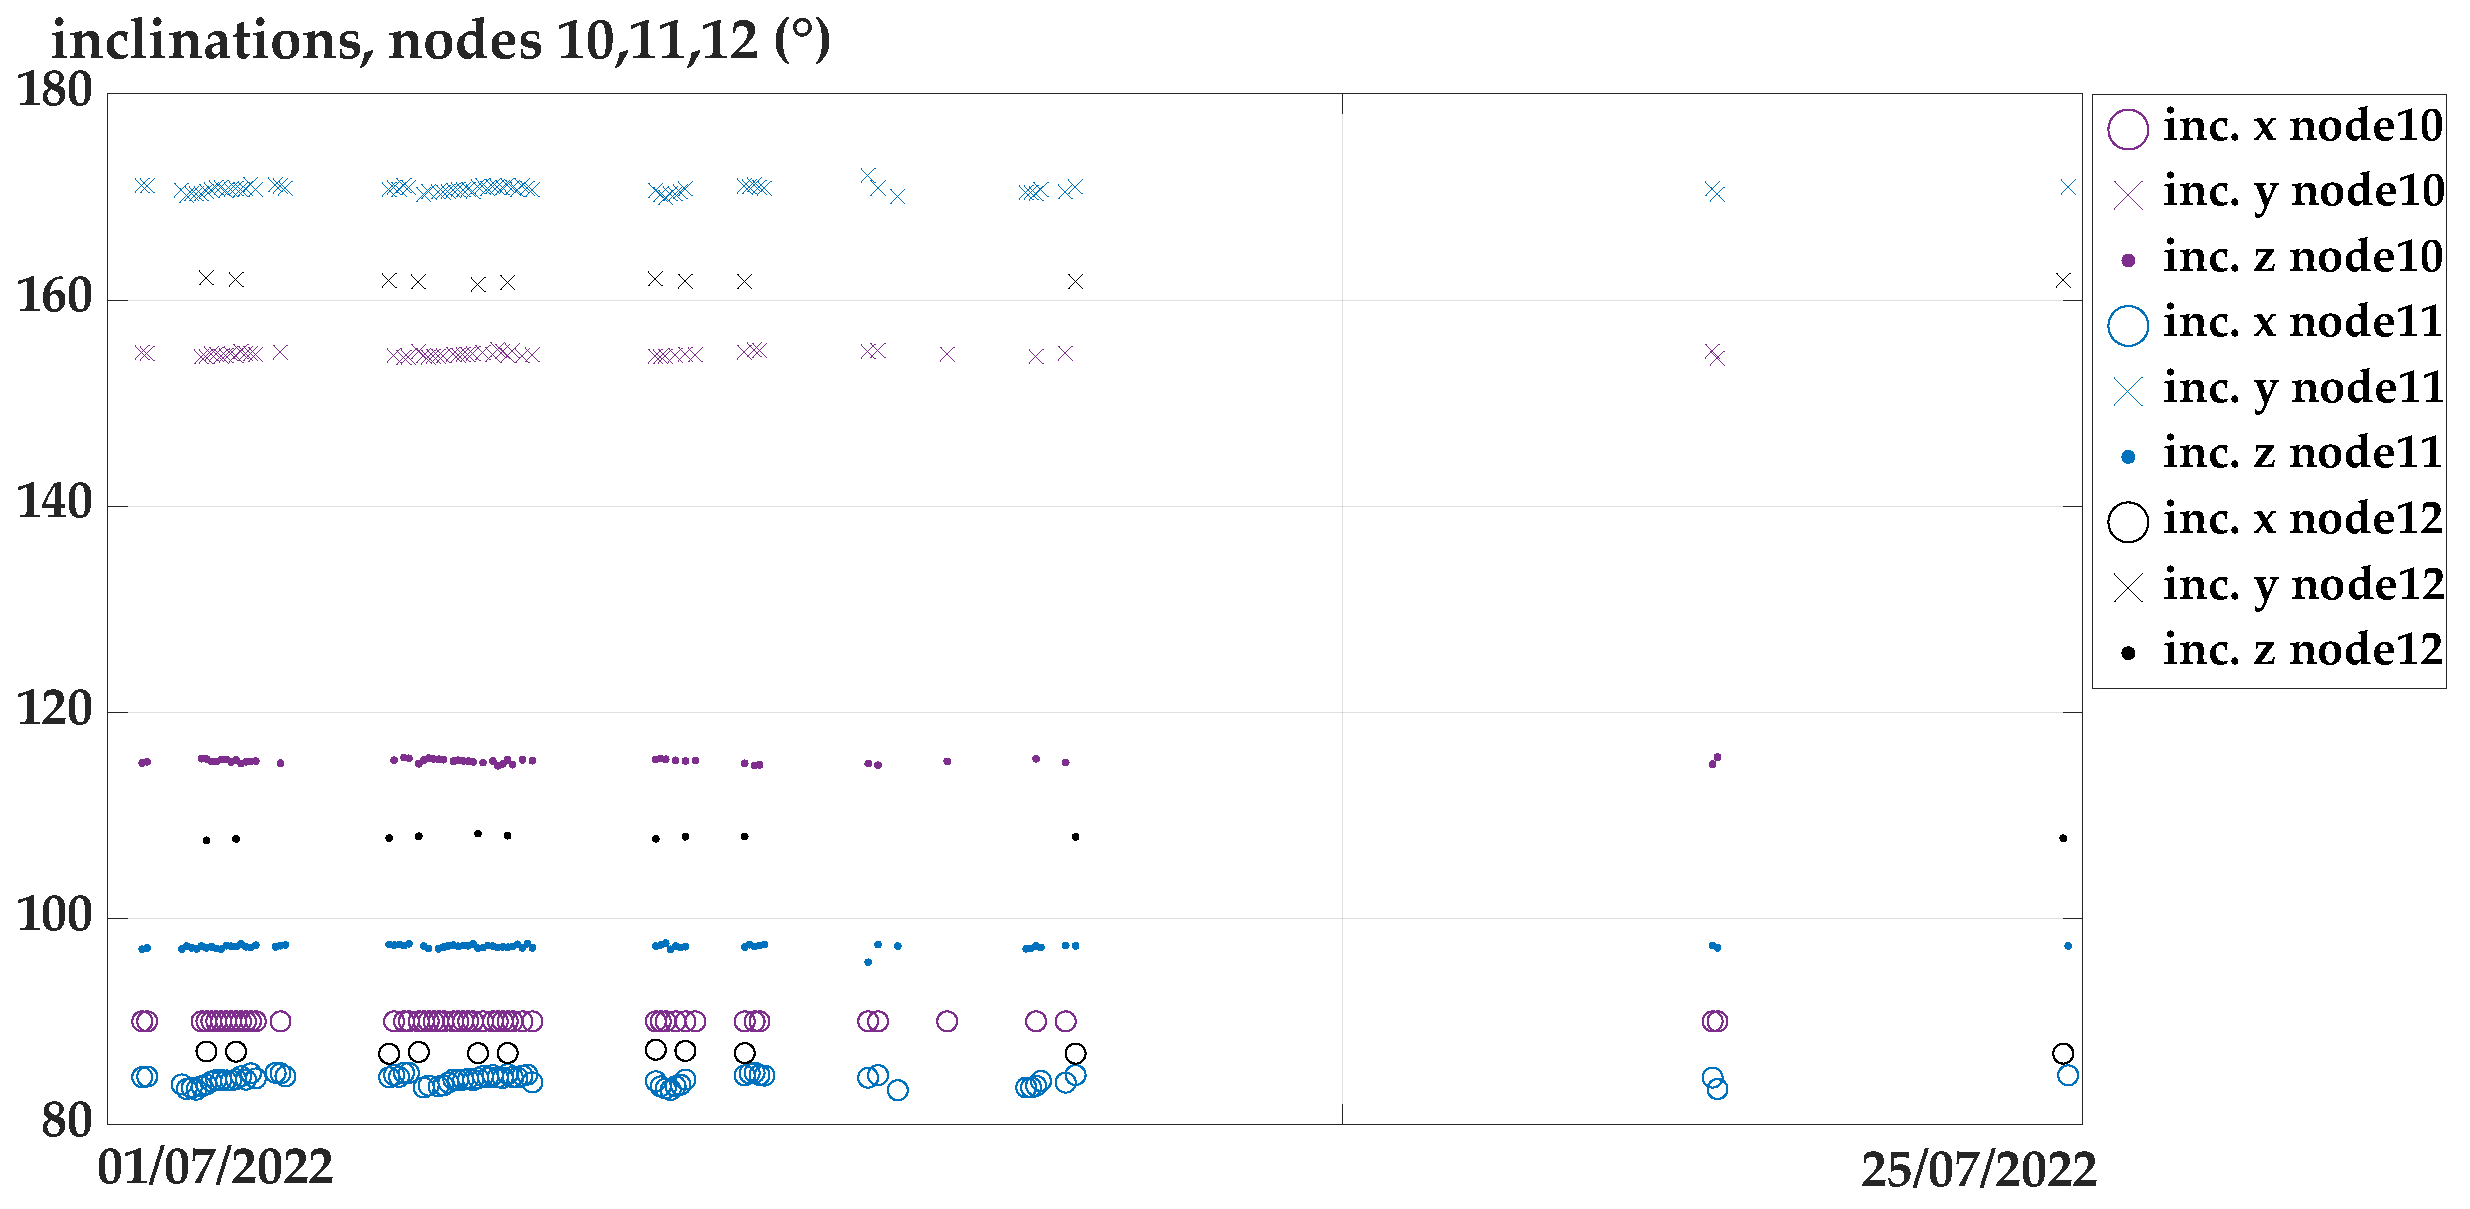
4. Measured Data
5. Conclusions
Author Contributions
Funding
Data Availability Statement
Acknowledgments
Conflicts of Interest
References
- Luuk, K.A. Dorren: A review of rockfall mechanics and modelling approaches. Prog. Phys. Geogr. 2003, 27, 69–87. [Google Scholar] [CrossRef]
- Calista, M.; Menna, V.; Mancinelli, V.; Sciarra, N.; Miccadei, E. Rockfall and Debris Flow Hazard Assessment in the SW Escarpment of Montagna del Morrone Ridge (Abruzzo, Central Italy). Water 2020, 12, 1206. [Google Scholar] [CrossRef]
- Rossi, M.; Guzzetti, F.; Salvati, P.; Donnini, M.; Napolitano, E.; Bianchi, C. A predictive model of societal landslide risk in Italy. Earth-Sci. Rev. 2019, 196, 102849. [Google Scholar] [CrossRef]
- SMineo, S.; Pappalardo, G.; D’Urso, A.; Calcaterra, D. Event tree analysis for rockfall risk assessment along a strategic mountainous transportation route. Environ. Earth Sci. 2017, 76, 620. [Google Scholar] [CrossRef]
- Chau, K.T.; Wong, R.H.C.; Liu, J.; Lee, C.F. Rockfall Hazard Analysis for Hong Kong Based on Rockfall Inventory. Rock Mech. Rock Eng. 2003, 36, 383–408. [Google Scholar] [CrossRef]
- Mattia, M.; Bonaccorso, A.; Guglielmino, F. Ground deformations in the Island of Pantelleria (Italy): Insights into the dynamic of the current intereruptive period. J. Geophys. Res. 2007, 112, B11406. [Google Scholar] [CrossRef]
- Ishikawa, K.-I.; Mita, A. Time synchronization of a wired sensor network for structural health monitoring. Smart Mater. Struct. 2008, 17, 15016. [Google Scholar] [CrossRef]
- Paolucci, R.; Muttillo, M.; Di Luzio, M.; Alaggio, R.; Ferri, G. Electronic Sensory System for Structural Health Monitoring Applications. In Proceedings of the 2020 5th International Conference on Smart and Sustainable Technologies (SpliTech), Split, Croatia, 23–26 September 2020. [Google Scholar] [CrossRef]
- Mainetti, L.; Patrono, L.; Vilei, A. Evolution of Wireless Sensor Networks towards the Internet of Things: A Survey. In Proceedings of the SoftCOM 2011, 19th International Conference on Software, Telecommunications and Computer Networks, Split, Croatia, 15–17 September 2011. [Google Scholar]
- Puccinelli, D.; Haenggi, M. Wireless sensor networks: Applications and challenges of ubiquitous sensing. IEEE Circuits Syst. Mag. 2005, 5, 19–29. [Google Scholar] [CrossRef]
- Oliveira, L.M.; Rodrigues, J.J. Wireless Sensor Networks: A Survey on Environmental Monitoring. J. Commun. 2011, 6, 143–151. [Google Scholar] [CrossRef] [Green Version]
- Darwish, A.; Hassanien, A.E. Wearable and Implantable Wireless Sensor Network Solutions for Healthcare Monitoring. Sensors 2011, 11, 5561–5595. [Google Scholar] [CrossRef] [PubMed]
- Ragnoli, M.; Barile, G.; Leoni, A.; Ferri, G.; Stornelli, V. An Autonomous Low-Power LoRa-Based Flood-Monitoring System. J. Low Power Electron. Appl. 2020, 10, 15. [Google Scholar] [CrossRef]
- Aponte-Luis, J.; Gómez-Galán, J.A.; Gómez-Bravo, F.; Sánchez-Raya, M.; Alcina-Espigado, J.; Teixido-Rovira, P.M. An Efficient Wireless Sensor Network for Industrial Monitoring and Control. Sensors 2018, 18, 182. [Google Scholar] [CrossRef]
- Mei, G.; Xu, N.; Qin, J.; Wang, B.; Qi, P. A Survey of Internet of Things (IoT) for Geohazard Prevention: Applications, Technologies, and Challenges. IEEE Internet Things J. 2020, 7, 4371–4386. [Google Scholar] [CrossRef]
- Barile, G.; Ferri, G.; Leoni, A.; Muttillo, M.; Pantoli, L.; Stornelli, V.; Vettori, D. Automatic Wireless Monitoring System for Real-Time Rock Fall Events. Proceedings 2017, 1, 569. [Google Scholar] [CrossRef]
- Caviezel, A.; Schaffner, M.; Cavigelli, L.; Niklaus, P.; Buhler, Y.; Bartelt, P.; Magno, M.; Benini, L. Design and Evaluation of a Low-Power Sensor Device for Induced Rockfall Experiments. IEEE Trans. Instrum. Meas. 2018, 67, 767–779. [Google Scholar] [CrossRef]
- Giri, P.; Ng, K.; Phillips, W. Wireless Sensor Network System for Landslide Monitoring and Warning. IEEE Trans. Instrum. Meas. 2019, 68, 1210–1220. [Google Scholar] [CrossRef]
- Vassis, D.; Kormentzas, G.; Rouskas, A.; Maglogiannis, I. The IEEE 802.11g standard for high data rate WLANs. IEEE Netw. 2005, 19, 21–26. [Google Scholar] [CrossRef]
- Arosio, D.; Longoni, L.; Papini, M.; Scaioni, M.; Zanzi, L.; Alba, M. Natural Hazards and Earth System Sciences Towards rockfall forecasting through observing deformations and listening to microseismic emissions. Nat. Hazards Earth Syst. Sci. 2009, 9, 1119–1131. Available online: www.nat-hazards-earth-syst-sci.net/9/1119/2009/ (accessed on 24 August 2022).
- Pakzad, S.N.; Fenves, G.L.; Kim, S.; Culler, D.E. Design and Implementation of Scalable Wireless Sensor Network for Structural Monitoring. J. Infrastruct. Syst. 2008, 14, 89–101. [Google Scholar] [CrossRef]
- Crossbow Technology. MicaZ Datasheet; Document Part Number: 6020-0060-04 Rev A; Crossbow Technology: San Jose, CA, USA, 2011. [Google Scholar]
- Tseng, K.-H.; Chung, M.-Y.; Chen, L.-H.; Huang, Y.-W. Implementation of Composite LPWAN on the Slope Disaster Prevention Monitoring System. IEEE Sens. J. 2022, 22, 2658–2671. [Google Scholar] [CrossRef]
- Vangelista, L. Frequency Shift Chirp Modulation: The LoRa Modulation. IEEE Signal Process. Lett. 2017, 24, 1818–1821. [Google Scholar] [CrossRef]
- Semtech. AN1200.22 LoRa™ Modulation Basics. Available online: https://semtech.my.salesforce.com/sfc/p/#E0000000JelG/a/2R0000001OJu/xvKUc5w9yjG1q5Pb2IIkpolW54YYqGb.frOZ7HQBcRc (accessed on 24 August 2022).
- Mangalvedhe, N.; Ratasuk, R.; Ghosh, A. NB-IoT deployment study for low power wide area cellular IoT. In Proceedings of the 2016 IEEE 27th Annual International Symposium on Personal, Indoor, and Mobile Radio Communications (PIMRC), Valencia, Spain, 4–8 September 2016; pp. 1–6. [Google Scholar] [CrossRef]
- GSMA. LTE-M Deployment Guide to Basic Feature Set Requirements; GSMA: London, UK, 2019. [Google Scholar]
- Hsieh, P.C.; Jia, Y.; Parra, D.; Aithal, P. An Experimental Study on Coverage Enhancement of LTE Cat-M1 for Machine-Type Communication. In Proceedings of the 2018 IEEE International Conference on Communications (ICC), Kansas City, MO, USA, 20–24 May 2018; pp. 1–5. [Google Scholar] [CrossRef]
- Raspberry Pi 3 Product Description. Available online: www.rs-components.com/raspberrypi (accessed on 24 August 2022).
- MySQL 8.0 Reference Manual Including MySQL NDB Cluster 8.0; Rev 73994; MySQL: Austin, TX, USA, 2022; Available online: https://downloads.mysql.com/docs/refman-8.0-en.pdf (accessed on 24 August 2022).
- TECO Group, Tecom Co., LTD. Smart Vibration Gauge Solution. Available online: https://teco.com.sg/wp-content/uploads/2019/09/Vibration-Gauge_Eng_0904_v03.pdf (accessed on 24 August 2022).
- B&B Electronics Manufacturing Company. RS-422 and RS-485 Application Note. Available online: https://www.cpii.com/docs/library/4/485appnote.pdf (accessed on 24 August 2022).
- Romdhane, R.F.; Lami, Y.; Genon-Catalot, D.; Fourty, N.; Lagrèze, A.; Jongmans, D.; Baillet, L. Wireless sensors network for landslides prevention. In Proceedings of the 2017 IEEE International Conference on Computational Intelligence and Virtual Environments for Measurement Systems and Applications (CIVEMSA), Annecy, France, 26–28 June 2017; pp. 222–227. [Google Scholar] [CrossRef]
- Wang, C.; Guo, W.; Yang, K.; Wang, X.; Meng, Q. Real-Time Monitoring System of Landslide Based on LoRa Architecture. Front. Earth Sci. 2022, 10, 899509. [Google Scholar] [CrossRef]
- Sidorov, M.; Nhut, P.V.; Matsumoto, Y.; Ohmura, R. LoRa-Based Precision Wireless Structural Health Monitoring System for Bolted Joints in a Smart City Environment. IEEE Access 2019, 7, 179235–179251. [Google Scholar] [CrossRef]
- Haxhibeqiri, J.; De Poorter, E.; Moerman, I.; Hoebeke, J. A Survey of LoRaWAN for IoT: From Technology to Application. Sensors 2018, 18, 3995. [Google Scholar] [CrossRef] [PubMed]
- Semtech Corporation. LoRa and LoRaWAN: A Technical Overview, Technical Paper. 2020. Available online: https://lora-developers.semtech.com/uploads/documents/files/LoRa_and_LoRaWAN-A_Tech_Overview-Downloadable.pdf (accessed on 24 August 2022).
- Ruan, T.; Chew, Z.J.; Zhu, M. Energy-Aware Approaches for Energy Harvesting Powered Wireless Sensor Nodes. IEEE Sens. J. 2017, 17, 2165–2173. [Google Scholar] [CrossRef]
- Di Marco, P.; Stornelli, V.; Ferri, G.; Pantoli, L.; Leoni, A. Dual band harvester architecture for autonomous remote sensors. Sens. Actuators A Phys. 2016, 247, 598–603. [Google Scholar] [CrossRef]
- Luo, P.; Peng, D.; Wang, Y.; Zheng, X. Review of Solar Energy Harvesting for IoT Applications. In Proceedings of the 2018 IEEE Asia Pacific Conference on Circuits and Systems (APCCAS), Chengdu, China, 26–30 October 2018; pp. 512–515. [Google Scholar] [CrossRef]
- di Bernardo, G.; Narayana, A.; Hazarika, R. Choice of effective LPWAN protocol for IoT System: Sigfox and LoRa. Int. J. Eng. Res. Appl. 2020, 10, 53–57. [Google Scholar] [CrossRef]
- Ragnoli, M.; Stornelli, V.; Del Tosto, D.; Barile, G.; Leoni, A.; Ferri, G. Flood monitoring: A LoRa based case- study in the city of L’Aquila. In Proceedings of the 2022 17th Conference on Ph.D Research in Microelectronics and Electronics (PRIME), Villasimius, Italy, 12–15 June 2022; pp. 57–60. [Google Scholar] [CrossRef]
- Chaudhari, B.S.; Zennaro, M.; Borkar, S. LPWAN Technologies: Emerging Application Characteristics, Requirements, and Design Considerations. Future Internet 2020, 12, 46. [Google Scholar] [CrossRef]
- Chaudhari, B.S.; Zennaro, M. LPWAN Technologies for IoT and M2M Applications; Academic Press: Cambridge, MA, USA, 2020. [Google Scholar]
- LoRa Alliance. Available online: https://lora-alliance.org/ (accessed on 24 August 2022).
- Finnegan, J.; Brown, S. An Analysis of the Energy Consumption of LPWA-based IoT Devices. In Proceedings of the 2018 International Symposium on Networks, Computers and Communications (ISNCC), Rome, Italy, 19–21 June 2018; pp. 1–6. [Google Scholar] [CrossRef]
- Sigfox. Sigfox Technical Overview. 2018. Available online: https://www.avnet.com/wps/wcm/connect/onesite/03aebfe2-98f7-4c28-be5f-90638c898009/sigfox-technical-overview.pdf?MOD=AJPERES&CVID=magVa.N&CVID=magVa.N&CVID=magVa.N (accessed on 24 August 2022).
- Lauridsen, M.; Nguyen, H.; Vejlgaard, B.; Kovács, I.Z.; Mogensen, P.; Sorensen, M. Coverage Comparison of GPRS, NB-IoT, LoRa, and SigFox in a 7800 km2 Area. In Proceedings of the 2017 IEEE 85th Vehicular Technology Conference (VTC Spring), Sydney, Australia, 4–7 June 2017; pp. 1–5. [Google Scholar] [CrossRef]
- IBM. Internet Protocol Version 4 (IPv4). Available online: https://www.ibm.com/docs/en/zos/2.3.0?topic=ipv6-internet-protocol-version-4-ipv4 (accessed on 24 August 2022).
- The Things Network. Available online: https://www.thethingsnetwork.org/ (accessed on 24 August 2022).
- Losant IoT. Available online: https://www.losant.com/ (accessed on 24 August 2022).
- STMicroelectronics. STM32L151x6/8/B STM32L152x6/8/B Ultra-Low-Power 32-Bit MCU Datasheet; STMicroelectronics: Geneva, Switzerland, 2016. [Google Scholar]
- SiliconLabs. CP2102/9 Single-Chip Usb-to-Uart Bridge Datasheet; Rev 1.8; SiliconLabs: Austin, TX, USA, 2017. [Google Scholar]
- Texas Instruments. bq21040 Datasheet; Texas Instruments: Dallas, TX, USA, 2016. [Google Scholar]
- Nisshinbo. RP104x Series 150mA Ultra Low Supply Current LDO Regulator Datasheet; NO. EA-150-161026; Nisshinbo: Tokyo, Japan, 2014. [Google Scholar]
- U-Blox. MAX-7 U-Blox 7 GNSS Modules Datasheet; U-Blox: Thalwil, Switzerland, 2021. [Google Scholar]
- Texas Instruments. TPS27082L Datasheet; Texas Instruments: Dallas, TX, USA, 2015. [Google Scholar]
- STMicroelectronics. LIS3DH MEMS Digital Output Motion Sensor: Ultra-Low-Power High-Performance 3-Axis ‘Nano’ Accelerometer Datasheet; STMicroelectronics: Geneva, Switzerland, 2016. [Google Scholar]
- Semtech. SX1276/77/78/79—137 MHz to 1020 MHz Low Power Long Range Transceiver Datasheet; Rev; Semtech: Camarillo, CA, USA, 2020. [Google Scholar]
- Amphenol. 868MHz ISM Band PCB Antenna PIOV008NRA Datasheet; Amphenol: Chicago, IL, USA, 2022; Available online: https://www.mouser.it/datasheet/2/18/1/Amphenol_04262021_PIOV008NRAA-2306547.pdf (accessed on 24 August 2022).
- Texas Instruments. INA229-Q1 Datasheet; Texas Instruments: Dallas, TX, USA, 2021. [Google Scholar]
- Microchip. SAM D21/DA1 Family Low-Power, 32-Bit Cortex-M0+ MCU with Advanced Analog and PWM Features Datasheet; Microchip Technology: Chandler, AZ, USA, 2020. [Google Scholar]
- Milesight. UG65 LoRaWAN Gateway Datasheet. Available online: https://resource.milesight-iot.com/milesight/document/ug65-datasheet-en.pdf (accessed on 24 August 2022).
- Energiasolare100. NX30P Solar Panel Datasheet. Available online: https://www.dropbox.com/sh/mcz3qwx6hi3m9nl/AADHvhD5b3sFhH3AgLvu0r0Ba/01%20-%20Pannelli%20solari/Policristallino/NX30P.pdf?dl=0 (accessed on 24 August 2022).
- Energiasolare100. Manuale d’uso Regolatore di Carica EP5 con Crepuscolare. Available online: https://www.dropbox.com/sh/mcz3qwx6hi3m9nl/AACrlorx6dmQF9nT8SkP4wvpa/04%20-%20Regolatori%20di%20carica/EP%20Solar/EP5.pdf?dl=0 (accessed on 24 August 2022).
- Energiasolare100. PCA12-12 Battery AGM Deep Cycle Datasheet. Available online: https://www.dropbox.com/sh/mcz3qwx6hi3m9nl/AADG5pmgB5Vle1b5d6IoMTdJa/03%20-%20Batterie/AGM/PCA12-12.pdf?dl=0 (accessed on 24 August 2022).
- Li, S.; Raza, U.; Khan, A. How Agile is the Adaptive Data Rate Mechanism of LoRaWAN? In Proceedings of the 2018 IEEE Global Communications Conference (GLOBECOM), Abu Dhabi, United Arab Emirates, 9–13 December 2018. [Google Scholar]
- Semtech. Understanding the LoRa® Adaptive Data Rate Technical Paper; Semtech: Camarillo, CA, USA, 2019. [Google Scholar]
- Eldefrawy, M.; Butun, I.; Pereira, N.; Gidlund, M. Formal security analysis of LoRaWAN. Comput. Netw. 2019, 148, 328–339. [Google Scholar] [CrossRef]
- Farhad, A.; Kim, D.-H.; Pyun, J.-Y. R-ARM: Retransmission-Assisted Resource Management in LoRaWAN for the Internet of Things. IEEE Internet Things J. 2022, 9, 7347–7361. [Google Scholar] [CrossRef]


Publisher’s Note: MDPI stays neutral with regard to jurisdictional claims in published maps and institutional affiliations. |
© 2022 by the authors. Licensee MDPI, Basel, Switzerland. This article is an open access article distributed under the terms and conditions of the Creative Commons Attribution (CC BY) license (https://creativecommons.org/licenses/by/4.0/).
Share and Cite
Ragnoli, M.; Leoni, A.; Barile, G.; Ferri, G.; Stornelli, V. LoRa-Based Wireless Sensors Network for Rockfall and Landslide Monitoring: A Case Study in Pantelleria Island with Portable LoRaWAN Access. J. Low Power Electron. Appl. 2022, 12, 47. https://doi.org/10.3390/jlpea12030047
Ragnoli M, Leoni A, Barile G, Ferri G, Stornelli V. LoRa-Based Wireless Sensors Network for Rockfall and Landslide Monitoring: A Case Study in Pantelleria Island with Portable LoRaWAN Access. Journal of Low Power Electronics and Applications. 2022; 12(3):47. https://doi.org/10.3390/jlpea12030047
Chicago/Turabian StyleRagnoli, Mattia, Alfiero Leoni, Gianluca Barile, Giuseppe Ferri, and Vincenzo Stornelli. 2022. "LoRa-Based Wireless Sensors Network for Rockfall and Landslide Monitoring: A Case Study in Pantelleria Island with Portable LoRaWAN Access" Journal of Low Power Electronics and Applications 12, no. 3: 47. https://doi.org/10.3390/jlpea12030047