1. Introduction
Evidence from the literature evidence [
1] shows that the pharmaceutical supply chain is composed of a set of different players: manufacturers, including pharmaceutical companies, but also laboratories and co-manufacturers, wholesalers, distributors, brokers, customers, logistics providers, and regulatory agencies [
2], with significant variations between countries, particularly in national regulatory frameworks. This supply chain is characterized by a high level of complexity due to the need for communication and coordination between multiple parties, and the definition of the distribution models is also driven by contextual factors, such as product features (often subjected to a cold chain), service requirements, distribution channels, demand properties, and national or local legislative restrictions. The definition of a proper pharmaceutical supply chain may be developed, guaranteeing a high level of service to patients, containing costs, and recognizing the drugs’ ethical value [
3].
To ensure economic viability and accessibility, also considering the increase in the demand for drugs and healthcare services, healthcare systems must explore novel remedies, developing more efficient and resilient supply chain models. For example, shifting the healthcare focal point from hospitals to primary care settings (such as community hospitals or houses and/or homecare deliveries) is emerging as a potential solution to control expenses while upholding service excellence [
4,
5].
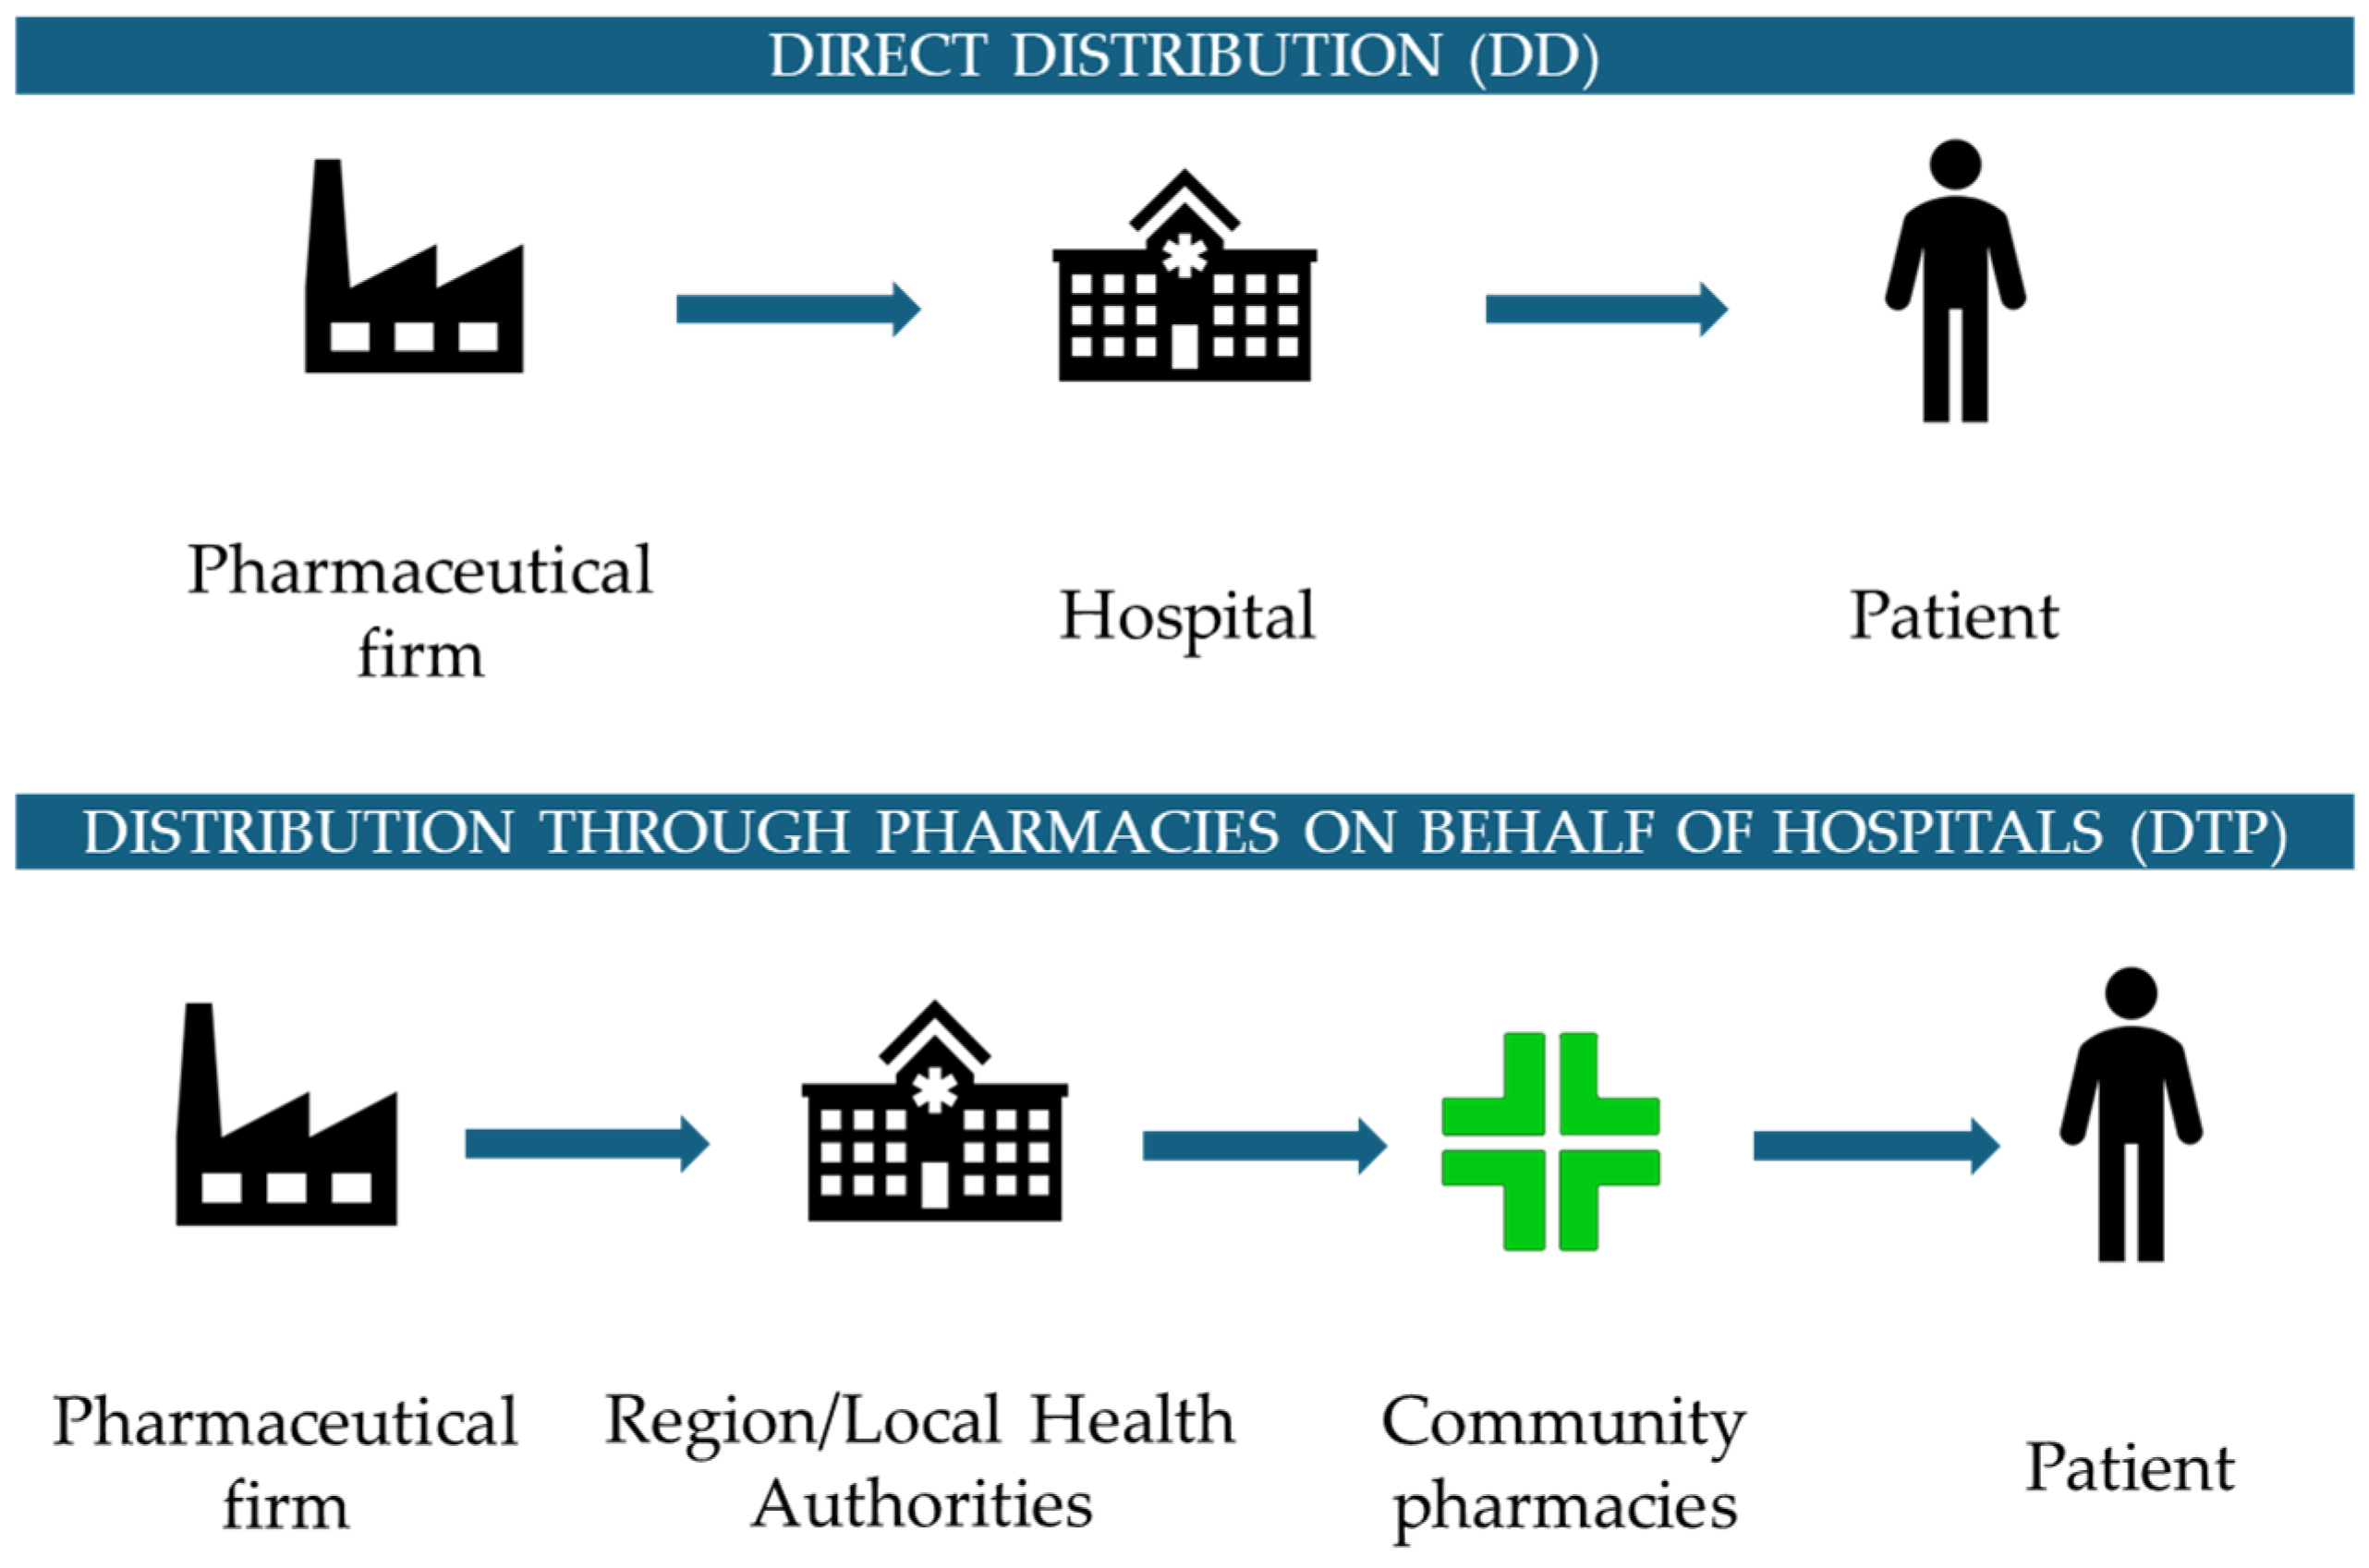
Assuming that the drug dispensation phase is perceived as very relevant for the citizens/users and for society in general, considering both patients and their families/caregivers, two main distribution models and strategies were proposed and implemented by the Italian National Healthcare Service (NHS), as reported in
Figure 1. One approach, characterized by centralization and called “Direct Distribution” (DD), is related to distributing drugs directly through the hospital channel, leading to cost savings concerning treatment management, but often resulting in higher social expenses for both patients and caregivers. On the other hand, to guarantee a more capillary distribution of drugs and to enhance proximity to patients, there is another model in the Italian context, called “Distribution Through Community Pharmacies on Behalf of Hospitals” (DTP), whereby community pharmacies ensure the dispensation phase of the drugs.
When compared to other distribution networks, the COVID-19 pandemic revealed the limitations and weaknesses of the centralized distribution design, which placed hospital pharmacists at the center of the distribution network. With direct access to hospital facilities, direct distribution increased the danger of infection and may have played a pivotal role in the COVID-19 pandemic’s spread. Even during the pandemic period, when many industrial settings saw significant disruptions in their supply chains, the patients’ rights and treatment continuity were guaranteed thanks to a robust National Healthcare Service capable of providing the necessary services and continuing the delivery of care services, representing a significant portion of Italy’s GDP.
However, the pandemic shed light on critical issues in the distribution process and the increased risk of contagion in the event of excessive use of DD, especially for frail patients, in case of a new health emergency [
6]. DD is the principal distribution network used in the healthcare field, and it is typically designed as a centralized model with hospital pharmacies and specialists serving as the principal nodes. However, a decentralized distribution network would be stronger and more resilient if general practitioners, primary care providers, and community pharmacies would play an active role in the distribution phase [
7].
Moving on from these premises, drugs distribution issues are therefore becoming a relevant topic, not only for the healthcare system but also for the different actors actively involved in the pharmaceutical supply chain and the entire society, which is the sum of the families/caregivers and patients/healthcare system users. All the players aim to define and structure a well-organized pharmaceutical supply chain, from an operational perspective, analyzing data about drug consumption and dispensation, but also assuming a more strategic approach, to assess economic and organizational issues, highlighting the advantages of the different distribution models and defining an efficient and resilient distribution network.
Furthermore, considering the current social, epidemiological, demographic, and cultural context characterized by an increased demand for healthcare services and delivery, all National Healthcare Services (NHSs) are inclined to act to ensure economic sustainability and affordability. In particular, chronic conditions, which represent the main cause of 70% of worldwide deaths, define the relevant consumption of services and resources in all healthcare systems, considering their long-lasting nature and the severe correlated healthcare consequences [
8].
Focusing on these diseases, the main aim of this study is to investigate the different available distribution models and channels, analyzing which drugs among those currently dispensed by hospital facilities could be transferred to community pharmacies, also preventing distribution problems in future pandemic or healthcare emergency situations, adopting an optimization approach, and developing a web-based application able to support the decision-making process [
9].
Based on the study’s objective, the following research questions were developed and explored.
RQ1. Which self-administered drugs for chronic diseases among the ones currently dispensed with a centralized distribution approach could be instead dispensed by community pharmacies?
RQ2. Which drug distribution model, centralized or decentralized, is more effective financially and socially? What impacts, including economic, organizational, and patient accessibility, can be observed?
The manuscript is organized as follows. First, the background of the study is provided, offering details on the important factors that must be evaluated to define an optimal pharmaceutical distribution network and on prescriptive analytics in the healthcare distribution setting. Then, the proposed model and decision support system developed to answer the RQs are outlined. Next, results are presented and discussed. Finally, the conclusions are drawn.
2. Background
2.1. Relevant Factors for Pharmaceutical Distribution Network Design
Considering the entire drug management process, the distribution phase appears to be the most relevant phase for users and society in general, involving both patients and their caregivers, and with considerable implications for healthcare system sustainability. For this reason, many studies were focused on the economic impact related to the alternative distribution models [
10], in terms of direct costs and indirect costs, or on the implications of the distribution models for pharmaceutical consumption and expenditure [
11]. The literature stressed the importance of improved service design [
12], but focused, in the majority of cases, on the operational side, lacking evidence concerning performance analysis and management, customer orientation, and organizational factors [
13]. The arrangement of the pharmaceutical services influences the quality of care as perceived by patients and society: devising an effective method for dispensing drugs is not an easy task, encompassing more than just the basic product that is supplied. Thus, starting from these premises, healthcare administrators and logistics professionals need to allocate resources to enhance distribution quality and innovation, with a focus on incorporating the patient’s perspective [
14].
From an organizational perspective, to develop a pharmaceutical distribution network, it is necessary to understand the drugs’ volumes, the number of dispensing points and related geographical locations, the population basin that may be served, the availability and presence of qualified personnel, also some features of the drugs such as the expiration date, or particular storage characteristics [
15].
Several variables, such as the length of the treatment, the innovativeness of the therapy, the administration’s modalities, or the need for a target exam measuring a specific biomarker, could impact the delivery of specialized drugs and medications to the patients. Furthermore, the need to monitor the occurrence of adverse events, also with the support of highly specialized healthcare professionals, could influence treatment management, considering that, at the same time, some drugs could be administered at home, with only the support and monitoring of caregivers and families [
16].
From the patients’ perspective, social costs, in terms of the lack of productivity and equity of access, may be evaluated, considering that adherence to the prescribed pharmaceutical strategy could be affected and influenced by the facility and efficiency of the distribution process, and therapeutic effectiveness should be supported by a structured and easy-to-manage distribution model while reducing any treatment changes [
17]. Considering the caregivers’ point of view, a well-conceived and designed drug distribution network could help reduce supply and delivery times, focusing the efforts on direct patient support, communication issues, and the overall management of the disease.
2.2. Prescriptive Analytics in the Pharmaceutical Distribution Setting
Prescriptive analytics is the process of using data and mathematical algorithms to determine the optimal course of action evaluating alternative decisions that involve goals and requirements characterized by complexity. Scenarios are modeled based on the evaluation of multiple parameters depending on the system being described and on the context the system is a part of. A variety of computational methods and technologies can be exploited to address the objectives of prescriptive analytics supporting decision-making, such as machine learning/data mining, evolutionary computation, simulation, logic-based models, and optimization via mathematical programming or heuristics algorithms [
18].
In the logistics and supply chain environment, prescriptive analytics has been adopted to optimize facility locations, resource allocations, inventory levels, and route planning, enhancing operational efficiency and reducing costs [
19]. Considering the case of the drug supply chain, distribution represents the final link that brings finished products to the final consumers, namely the patients. The distribution stage is usually performed by hospital pharmacies or community pharmacies, or by temporary points of dispensing, providing medicine and medical supplies (vaccines, drugs, and therapeutics) to patients. Prescriptive analytics has mostly considered facility location problems [
20,
21,
22,
23,
24,
25,
26]. The involvement of community pharmacies in the drug distribution model is reported to support the increase in the population’s access to drugs, reduce costs, and provide fair access to patients.
The work by Singh and colleagues [
20] proposes a method for optimizing the location of dispensing points within a set of 1023 community pharmacies within the state of Texas to distribute antiviral drugs, maximizing the reach of the population and limiting access to hospitals. The considered geographic resolution is ZIP code areas and the access level is based on a willingness to travel function, determining the fractions of the target population willing to travel at least a selected distance. Integer linear programming models are adopted to achieve the optimal solutions. This method is appropriate to the limited complexity of the problem, considering a small set of drugs and overlooking several constraints, such as the number of available antiviral drug doses, the amounts to be shipped to each point of dispensing, and their capacities.
The evidence proposed by Zhang, Dai, and Han [
21] encompasses the problem of optimizing the commercial pharmacy distribution network, given fixed amounts of antiviral drugs, in Shanghai city. The optimization is a network-based model aimed at maximizing multiple objectives. In this case, access to clusters from 2036 commercial pharmacies in Shanghai is calculated according to a willingness-to-travel model that considers both the distance between the pharmacy and citizens’ locations and the pharmacy’s reputation. The optimization model is applied to a limited problem, i.e., a problem that considers a restricted set of pharmacies from the clustering as points of dispensing and that overlooks the capacity of the pharmacies.
Another manuscript by Risanger and colleagues [
22] deals with selecting community pharmacies as points of dispensing COVID-19 tests to maximize the number of citizens who can travel to pharmacies. The developed mixed integer linear programming optimization model considers a willingness-to-travel function, based on an exponentially decaying fraction of the population and distance. The problem considered by this study comprises sites at national and state levels in the US partitioned into ZIP code areas. On the other hand, the considered model does not encompass the capacity of each pharmacy, assuming that supply is sized to be proportional to demand by market forces, as it is challenging to manage matching dispensing capacity with demand. Optimal solutions are obtained for reduced problem sets, considering different subsets of points of dispensing.
The problem considered by Emu and co-authors [
23] deals with the selection of optimal vaccine distribution centers developing a constraint satisfaction programming model for a given geographical region considering priority groups. The objective function aims to maximize distribution for priority groups, e.g., the aged population, while minimizing the average travel distance to reach the point of dispensing. A clustering technique is adopted to assign each hospital to its closest vaccine point and then consider the travel distance, obtaining a set of optimally selected vaccine points of dispensing based on the distance. The model is applied to two experiments based on randomly generated data and real data obtained from the city of Chennai, India, dividing the area into 15 zones. The proposed algorithm provides an efficient solution to the problem, representing an alternative to optimization.
Other recent works have focused attention on dynamic approaches. Liu and colleagues [
25] address facility location and dynamic capacity planning with demand uncertainty. A two-phase optimization framework is developed to locate facilities and adjust capacity during large-scale emergencies, first locating testing facilities and designing their capacities using a sample average approximation formulation, and as the second step, dynamically adjusting resources facing varying demand caused by pandemics. The goal of this work is to identify the optimal location and capacity strategies during the entire time horizon, i.e., considering uncertainty, to minimize the total operational cost. This problem concerns the testing facilities, i.e., it focuses on a unique item. The model is applied to the case of 333 geographical centers of towns across Beijing demonstrating its applicability. Similarly, He et al. [
26] focus on testing sites, i.e., on a unique item to be distributed, to optimize the site deployment strategy considering the spatial–temporal distribution of the testing population and the time-varied availability of testing resources. The model is tested through a real-world case study in the Chenghua district of Chengdu, China, demonstrating that dynamic deployment contributes to cost reduction.
Previous literature has tackled the issue of considering alternative points of dispensing in the drug distribution network, mainly by optimizing methods in mathematical programming, such as linear programming and its variances [
24]. The objectives most often considered are the minimization of operational costs adopting an alternative point of dispensing and the maximization of the reached population. As constraints, providing equitable and easy access to all patients, mainly modeled through limitations on distances representing patients’ willingness to travel, point of dispensing capacity, and budget, or the number of fully open facilities are considered. Moreover, depending on populations of different sizes and densities, a variety of solutions is needed.
In tackling the issue of alternative points of dispensing in the drug distribution network, previous literature has limited attention to either a unique drug or test, to a part of the population affected by a specific disease, or to a set of pharmacies/dispensation points, without having an extensive view of a comprehensive population, representative of the population and patients’ needs. Extending previous literature, this work proposes a model that considers a wide set of drugs and all the available dispensation points and patients, while considering the capacity constraints on dispensation points and equitable access.
3. Materials and Methods
This study aims to respond to the RQs by developing a prescriptive analytics model that exploits the strengths of previous research, i.e., considering willingness to travel and equitable access, and overcomes its limitations, i.e., considering small sets of drugs, overlooking capacity constraints, and considering clusters of pharmacies. The prescriptive model is hosted by a web application that could be accessed by decision-makers via a web interface. The present study proposes an application of the model to the case of the Local Health Protection Agency Insubria (below named ATS Insubria), an Italian local health authority, covering the areas of the Como and Varese municipalities, located in Northern Italy.
3.1. Data Collection
Through a data extraction algorithm, all drug therapies distributed in three years from 2018 to 2020, in the case of patients suffering from chronic pathologies, belonging to the ATS Insubria territory and who have had access to the distribution of drugs from hospital pharmacies or community pharmacies, will be selected considering all the cases meeting the inclusion criteria specified below. For the purpose of this study, all patients with at least two months of prescriptions and drug dispensation through these two alternative distribution points will be enrolled, starting from all the prescriptions that occurred in the ATS Insubria territory during the reference time horizon, defined concerning the primary objective, which is based on an organizational and economic approach, and considering that the study has not been driven by therapeutic efficacy and the patients’ compliance to the treatment. Patients requiring home treatment under a hospital specialist prescription are considered and, in the extraction, the data will refer to drugs prescribed to the patients only by a hospital specialist, considering drugs to be self-administered by the patients themselves or with the support of caregivers. These drugs could then be dispensed in Direct Distribution (DD) or Distribution Through Community Pharmacies on Behalf of Hospitals (DTP), depending on the typology of the drugs, the pathology treated, and the patients’ characteristics. All these medications were registered and reported in an administrative flow, called “File F” (a specific Italian record infrastructure for the management and reporting of all drugs prescribed by hospital specialists, supplied by hospitals or community pharmacies for outpatient or home use, to ensure continuity of care).
The study protocol was verified and approved by the ATS Insubria and Carlo Cattaneo—LIUC University Ethical Committees. This step ensured that the data handling and analysis methods met the highest standards of integrity, respecting the patients’ privacy and data processing principles.
3.2. Quantitative Assessment: An Organizational and Economic Assessment
Organizational assessment could provide valuable information to health local or regional authorities looking to improve their performance and better respond to stakeholders’ needs and requirements. From an economic perspective, the methodology employed in this research project pivoted on a robust quantitative assessment aimed at unraveling the economic costs occurring in the distribution of drugs through hospitals and community pharmacies.
Assuming the perspective of ATS Insubria, an economic evaluation was conducted to define the financial implications of drug distribution through different channels, analyzing the differential cost components, including acquisition, storage, and distribution of medications, in the two main distribution channels of reference, and assuming the differential costs among the two potential distribution channels. Considering the organizational assessment, the cost per dispensation in hospitals (EUR/dispensation) was analyzed and defined, considering aspects such as the pharmacists’ or other professionals’ remuneration tariffs per hour/minute.
In addition, the research delved into the remuneration models for community pharmacists, exploring economic sustainability and assessing whether the compensation structures aligned with the burdens covered by the community pharmacies, as also defined by the regional regulations to state the EUR/package (Lombardy Regional Agreement No. XI/796, 2018).
3.3. The Prescriptive Model
The model represents the problem of selecting the correct distribution channel through which the patients could obtain drugs, considering if each drug could be eligible for distribution in the community pharmacy and constraints on the distances and capacities. The formulated problem combines the facility location optimization model and the capacity allocation to consider: (i) the consequent increase in distribution costs, (ii) the need to provide equitable and easy access to all patients, (iii) the desired reduction of pressure on hospitals, and (iv) constraints on community pharmacy capacity.
Table 1 reports the notations of the model.
Considering the model inputs,
MaxHospital is the quantity measured in units that signifies the volume required to alleviate pressure on hospital distributions, as determined by the decision maker, i.e., the minimum volume that should be distributed through community pharmacies. While the model accounts for equitable access as the maximum travel distance determined by the decision maker (
Mdist), using
DISTikl the allocation of distribution through pharmacy channel
l ∈
L can only occur when the distance between the pharmacy
l ∈
L and patient group
k ∈
K is less than the established maximum distance. Therefore,
DISTikl equals 1 if the distance between the pharmacy and the patient group is either smaller or equal to the distance specified by the decision-maker. The values of
DISTikl are part of the model’s input and are computed using the haversine function.
MaxPharmal is a measurement in units that signifies the highest volume that can be allocated to each community pharmacy. The demand volumes, denoted as
Dik, for each drug and geographical area, can span from 1 to N years, as determined by the input provided by the decision maker. According to Costantino [
27], the typical horizon considered by strategic decisions in the context of the Italian drug supply chain spans from 1 to 3 years. Given these assumptions, the objective function and the model constraints are outlined in the following, obtaining an integer linear problem.
The objective function outlined in Equation (1) seeks to minimize the rise in costs associated with the distribution of drugs through pharmacies (
xikl). This cost increase depends on several factors, including whether a particular drug
i is distributed by pharmacy
l serving area
k (
xikl = 1), the demand volume within area
k (
Dik), and the specific cost increase associated with drug
i (
Ci) for each unit distributed through this channel. The primary goal is to minimize costs while adhering to the following constraints:
The constraints in Equations (2) and (3) model the exclusivity of the distribution channel for each drug
i. The variable
zi assumes a value equal to 0 if the drug
i ∈
I is suggested to be distributed through hospital pharmacies (DD), while it assumes a value equal to 1 if the drug
i ∈
I is suggested to be distributed through community pharmacies (DTP):
According to Equation (2), if, for a given drug i belonging to the set of drugs I, the variable zi is equal to 1, it indicates that the total demand for drug i from any patient group k in set K will be fulfilled exclusively through a community pharmacy l in set L. Consequently, in this scenario, xikl will be set to 1, denoting this distribution channel. If zi is not equal to 1, then xikl will be set to 0, indicating that the distribution does not occur through community pharmacy l. Conversely, if for a given drug i in set I, the variable zi is equal to 0, it signifies that the entire demand for drug i from any patient group k in set K will not be fulfilled through a community pharmacy l in set L. In this case, xikl will be set to 0, indicating that the distribution through community pharmacy l does not take place for that drug.
According to Equation (3), if for a specific drug i within set I, zi equals 0, then the entire demand for drug i from any patient group k in set K will be distributed through a hospital pharmacy h in set H. In this scenario, yikh will be set to 1, indicating that the distribution is occurring through the hospital pharmacy. Conversely, if zi equals 1 for the drug i in set I, the demand for drug i from any patient group h in H will not be fulfilled through hospital pharmacy h, and yikh will be set to 0, signifying that there is no distribution through the hospital pharmacy for that drug.
The constraint represented by Equation (4) ensures that each drug i for every patient group k is exclusively distributed through either a community pharmacy l in set L or a hospital pharmacy h in set H. This guarantees that the distribution of each drug to any patient group is uniquely assigned to only one type of pharmacy, thereby preventing any overlap in distribution channels.
The constraints from Equation (5) through Equation (7) are designed to address various operational requirements, including the patient service level, the capacity of community pharmacies, and the aim to reduce the strain on hospitals. Specifically, Equation (5) ensures that the distance from a community pharmacy (l in set L) as the dispensing point to the patient’s location (k in set K) does not surpass a maximum limit established by the decision-maker. This service level constraint is crucial for providing patients with equitable and convenient access to medications. Furthermore, the model accounts for the dispensing capacity of community pharmacies. As stipulated by Equation (6), the volume of drugs distributed at each dispensing point (l in set L) must not exceed a predetermined maximum threshold. Lastly, the requirement set forth by Equation (7) mandates that community pharmacies (L) distribute a specific volume of drugs, which is instrumental in achieving the targeted reduction in the workload of hospital pharmacies.
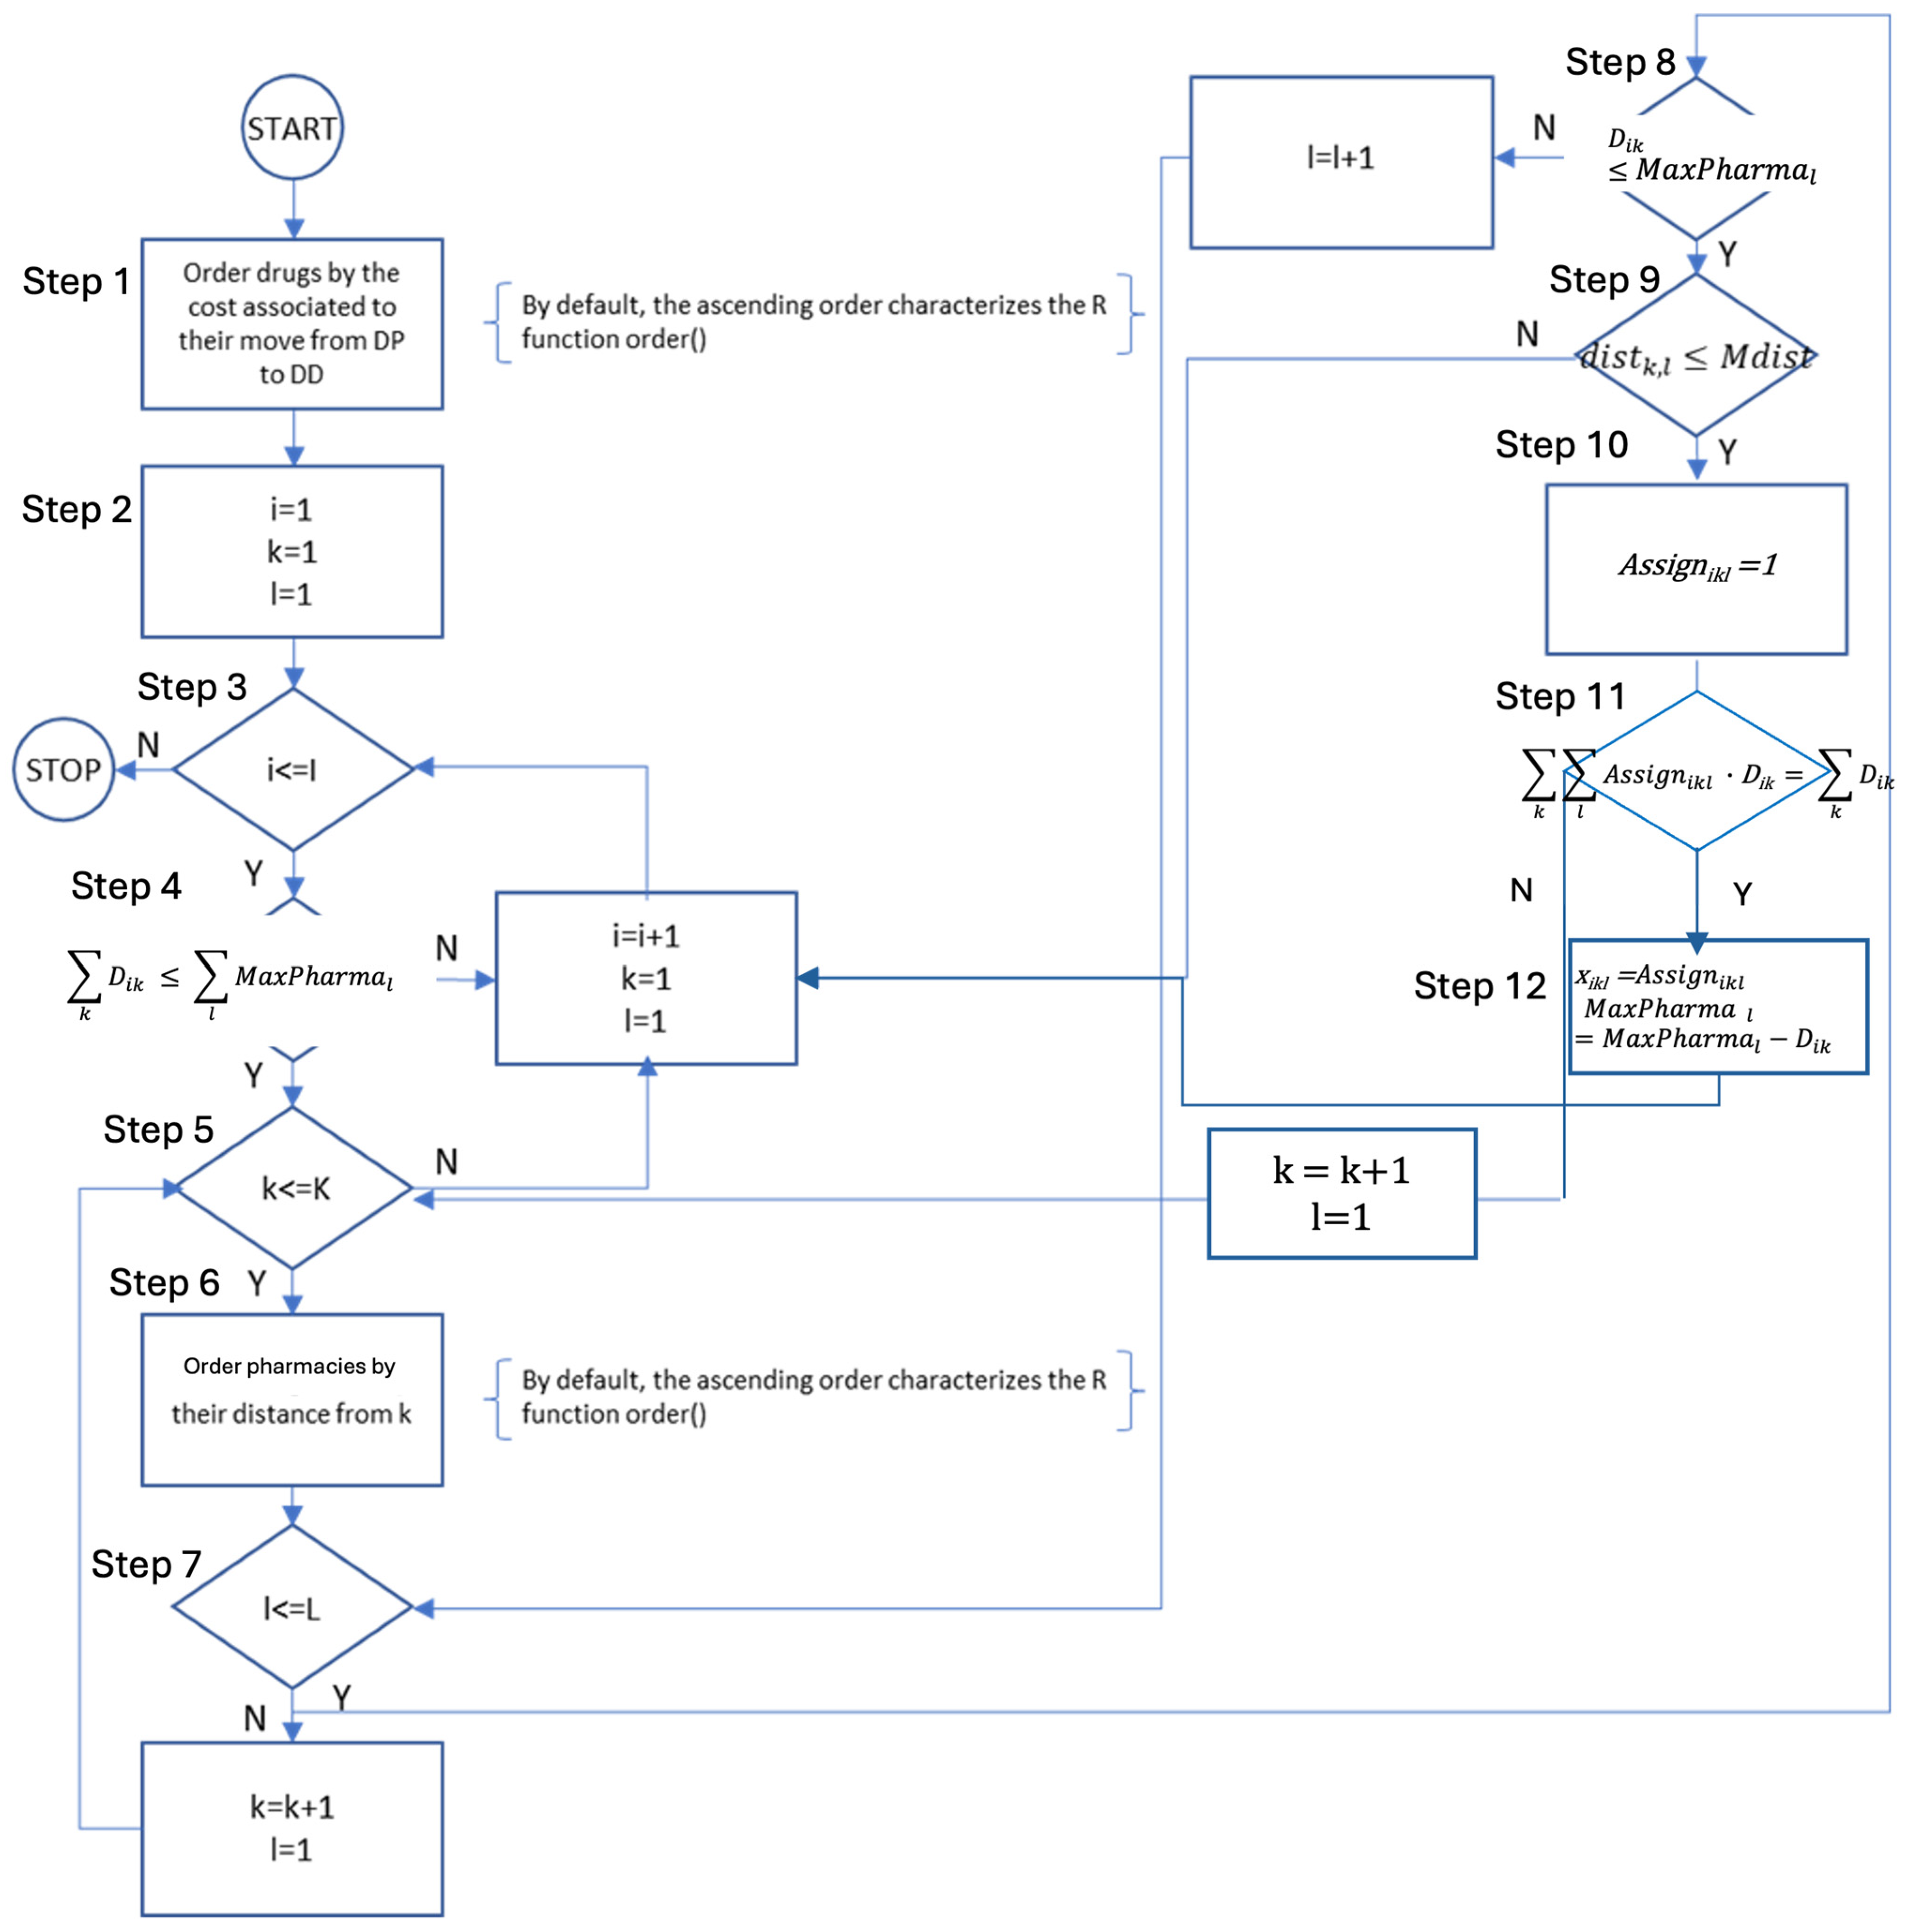
3.4. Heuristic Algorithm
The web server hosting the application, implemented using the base R package called Shiny, is the software layer responsible for receiving requests entered through the user interface (starting from the web client), appropriately managing them, and providing corresponding responses. To overcome potential issues deriving from the time needed to achieve the optimal solution of problems potentially constituted by a billion variables, in the study planning phases, a further algorithm, based on heuristic principles, was designed and implemented to achieve a solution nearing the optimal within a feasible timeframe, in the event the web app’s response times are too long. This heuristic algorithm consists of the following steps (and the flowchart is depicted in
Figure 2):
- (1)
Prioritizing drugs in ascending order based on their cost (Ci) impact on the national healthcare system transitioning their distribution from hospitals (DD) to pharmacies (DTP). This ordering is critical as the heuristic algorithm evaluates drugs individually, making it prudent to begin with those having the least cost impact. Starting with higher-cost drugs risks saturating pharmacy capacities, thereby hindering efficient distribution in the Italian National Healthcare Service.
- (2)
Setting up initial indices for various entities: drugs (i), groups of patients (k), and groups of pharmacies (l).
- (3)
Determining whether there are more drugs to evaluate (i ≤ I). If no further drugs are left, the algorithm concludes. If there are additional drugs to be considered, it proceeds to step 2.
- (4)
Verifying that the total demand for drug ‘i’ () does not exceed the remaining access capacity of all pharmacies (), ensuring that drug ‘i’ is eligible for DTP. If this condition is not met, the algorithm increases the drug index (i = i + 1), resets the indices for a patient (k = 1) and pharmacy groups (l = 1), and reverts to step 3. If the condition is fulfilled, then the remaining access capacity is updated () and the process progresses to step 5.
- (5)
Evaluating the presence of additional patient groups for drug ‘i’ (k ≤ K). If none remain, the algorithm increases the drug index (i = i + 1), resets the indices for a patient (k = 1) and pharmacy groups (l = 1), and revisits step 3. If more groups exist, it proceeds to step 6.
- (6)
Organizing community pharmacies in ascending order of their distance from the considered patient group ‘k’. This prioritization aims to expedite the process. It allows for a cut-off when the distance to a pharmacy group ‘l’ exceeds the maximum acceptable distance for patient group ‘k’, eliminating the need to assess further pharmacy groups.
- (7)
Determining if more pharmacy groups need to be considered for patient group ‘k’ (l ≤ L). If not, the algorithm increases the patient group index ‘k’ (k = k + 1), resets the pharmacy group index (l = 1), and returns to step 5. If additional groups are to be considered, it proceeds to the next step.
- (8)
Verifying that the number of accesses from patient group ‘k’ for drug ‘i’ (Dik) is within the remaining capacity of pharmacy group ‘l’ (MaxPharmal). If it exceeds, the pharmacy group index (l) is incremented (l = l + 1) and the process loops back to step 7. If within capacity, the algorithm progresses to step 9.
- (9)
Ensuring that the distance between patient group ‘k’ and pharmacy group ‘l’ does not surpass the maximum distance acceptable to the patient group. If it does, the algorithm increments the patient group index ‘k’ (k = k + 1), resets the pharmacy group index (l = 1), and reverts to step 3. If the distance is acceptable, the algorithm progresses to step 10.
- (10)
The variable Assignikl is set = 1, to record that demand of drug i ∈ I expressed by the group of patients k ∈ K can be distributed through community pharmacy l ∈ L, and the algorithm progresses to step 11.
- (11)
Determining if all demands of drug i ∈ I expressed by all patients have been considered. If not, the patient group index ‘k’ is increased (k = k + 1), the pharmacy group index (l) is reset (l = 1), and the process returns to step 5. If all demands of drug i ∈ I have been considered the algorithm progresses to step 12.
- (12)
The decision variable xikl is set to Assignikl (indicating that pharmacy group ‘l’ will serve patient group ‘k’ for drug ‘i’), the remaining capacity of pharmacy group ‘l’ is updated (MaxPharmal = MaxPharmal − Dik), the drug index ‘i’ is increased (i = i + 1), the pharmacy group index (l) is reset (l = 1) and the process returns to step 3.
Constraints (2)–(4) of the programming model, modeling the exclusivity of the distribution channel for each drug and ensuring that each drug is exclusively distributed through either a community pharmacy or a hospital pharmacy, are enforced in the algorithm in several ways. First, the algorithm ensures that if the distribution is set through a community pharmacy all demand will be satisfied through this channel (Steps 4–11). Otherwise, in case total drug demand exceeds the total pharmacy capacity (Step 4), or the maximum distance between patients and pharmacies is exceeded in at least one case (Step 9), the distribution is not set through community pharmacies. Steps 10 and 11 ensure the exclusivity of the distribution channel.
3.5. Scenario Definition
To implement the proposed model, the actual drug distribution design, the relevant drugs currently distributed and already recorded in the administrative flows of ATS Insubria for the three years observed for which data are available (in terms of volumes, drugs distributed, healthcare facilities involved, and economic value reached), represent the AS IS Scenario. Thus, the AS IS Scenario was defined considering the current choices of ATS Insubria in terms of drug dispensation channels between DD and DTP, with more restrictive decisions than what regulatory dictates could allow. The drugs currently registered in the typology of File F are called “Double Channel”, because this category of drugs could be distributed without distinction or restriction under DD or DTP, and for which also ATS Insubria’s regulations define the possibility to be managed and dispensed by community pharmacies, are allocated to the DTP channel. All the others were allocated to the DD channel.
Then, five potential TO BE Scenarios, to calibrate the optimization model, were defined and validated involving a panel of eleven expert hospital pharmacists from different Italian Regions. To outline the TO BE Scenarios of interest for the proposed analyses, the necessity to assume a comprehensive perspective able to capture all the Italian Regions’ legislations and approaches to the drug dispensation models that are currently implemented arises, considering that in real practice, among the twenty-one Italian Regions and Autonomous Provinces, economic aspects as well as the organizational models implemented in hospital and community facilities could change, due to the differences existing in the territories, and related regulatory dictates. Therefore, the distribution of pharmacies and their purposes are often mismatched according to regional regulations and agreements.
In the following, the five TO BE Scenarios are described. For each scenario, alternative sets of drugs (I) considered by the prescriptive model are presented.
- i.
The first TO BE Scenario is based on the current ATS Insubria regulations, potentially allocating only 13.6% of the drugs currently dispensed by hospital pharmacies to the DTP channel.
- ii.
The second TO BE Scenario is based on the other Italian Regions’ regulations, assuming that a drug could be dispensed within the DTP channel if 70% of the other Italian Regions’ regulations define that drug as suitable for DTP; thus, potentially allocating 14.1% of the drugs currently dispensed by hospital pharmacies to the DTP channel.
- iii.
The third TO BE Scenario is based on the other Italian Regions’ regulations, assuming that a drug could be dispensed within the DTP channel if half of the other Italian Regions’ regulations define that drug as suitable for the DTP; thus, potentially allocating 16.6% of the drugs currently dispensed by hospital pharmacies to the DTP channel.
- iv.
The fourth TO BE Scenario is based on the other Italian Regions’ regulations, assuming that a drug could be allocated to the DTP channel if almost in one of the other Italian Regions that drug is currently dispensed by the community pharmacies; thus, potentially allocating 35.8% of the drugs currently dispensed by hospital pharmacies to the DTP channel.
- v.
The fifth TO BE Scenario is based on the hypothesis that only the innovative drugs in the related budget remain within the Direct distribution channel, and all the other drugs could be dispensed in the DTP setting; thus, potentially allocating 68.5% of the drugs currently dispensed by hospital pharmacies to the DTP channel.
Considering the 1660 different drugs dispensed and registered in File F, the following Table (
Table 2) reports the percentage of drugs potentially distributed through the DTP channel, that were considered in the model. For each TO BE Scenario, within the set of drugs I, the prescriptive model will identify which drug
i ∈
I will be dispensed through community pharmacies, considering the constraints on total demand, distances, and community pharmacies capacity.
4. Results
As the number of decision variables in this model for the ATS Insubria context is in the range of billions, its optimal resolution was computationally impossible. Hence the heuristic algorithm developed was implemented to obtain a solution close to the optimum while adhering to the constraints of the original model in a reasonable amount of time. In the following, the results proposed by the model and the comparison with the current distribution network are presented. A total sample of 43,571 patients was identified through the data extraction algorithm and 1,066,930 records in the three-year time horizon of reference, retrieved from File F, were analyzed. In addition, the dataset of reference includes 1660 different drugs for File F.
4.1. Quantitative Assessment: An Organisational and Economic Assessment
From an economic and organizational standpoint, focusing on the dispensing phase of the medications’ management, and assuming that this could be considered as the differential phase to evaluate the financial impact of the two alternative distribution channels, the following considerations were stated. For Direct Distribution, performed within the hospitals, it was necessary to evaluate the organizational costs linked to the presence of the pharmacist(s) and nurse to dispense the drugs to the patients. Assuming the Italian NHS perspective, the Table below shows the minutes dedicated by the different healthcare professionals for the dispensation phase (considering a range between the minimum and the maximum) and the cost per minute for each professional role. As reported in
Table 3, for each medication dispensation within the hospital setting, a hospital pharmacist, or alternatively a nurse, must be present. In addition, another hospital pharmacist could play an information support role. Each medication dispensation within the hospital pharmacy was economically evaluated on average as equal to 14.62 EUR/dispensation, considering that the dispensing phase in hospital pharmacies involves nurses only in 30% of cases.
4.2. Scenarios Modeling and Results
Table 4 reports the main results of the study considering 60 km as the maximum distance between the patients’ locations and considered points of dispensing. The results are organized focusing on aspects such as the number of drugs dispensed within the Direct Distribution channel, the number of hospital dispensations, the number of visits by the patients (grouping drug dispensations for the same patient and date), the number of hospitals in which the hospital pharmacy is involved in drug distribution, the average distance traveled by the patients to retrieve their drugs (expressed in kilometers) and the economic evaluation (considering the pharmaceutical expenditure and the organizational costs related to the EUR/dispensation for the hospital pharmacies or the EUR/package as the reimbursement for the community pharmacies). In addition, the number of accesses to the community pharmacies is included in the analysis.
Table 5 highlights a synthesis of the achieved results among all the potential TO BE Scenarios, i.e., considering different sets of drugs to be dispensed within the DTP channel, in comparison with the AS IS considering the reduction in terms of hospital accesses and distance traveled by the patients to reach the point of drugs’ dispensation but also the increase in the managerial and operational costs, considering the healthcare service perspective.
Focusing on the possibility of defining a decentralized drug distribution network, the results highlight the reduction in hospital accesses as the consequence of the increase in the number of drug dispensations through the community pharmacy channel. This reduction could represent a considerable phenomenon in all the years, but reaching the maximum decrease rate in 2020 (−19.54%), also as a consequence of the pandemic period in which a low hospital access rate was registered, considering hospitals as a potential place of the spread of the virus, particularly for chronic and frail patients, as well as a reduction in the ability to attract new patients’ diagnoses for fear in contracting COVID in hospitals. Considering the average distance traveled by patients to retrieve their drugs within the pharmaceutical network, the fifth TO BE Scenario, i.e., the one based on the hypothesis that all the drugs except the innovative ones could be dispensed in the DTP setting, resulted as the most effective in reducing pressure on hospitals, with a significant decrease in 2019 (−10.53%) and 2020 (−21.43%). The cost increase connected to this scenario is marginal compared to the reduction in hospital accesses and traveled distances.
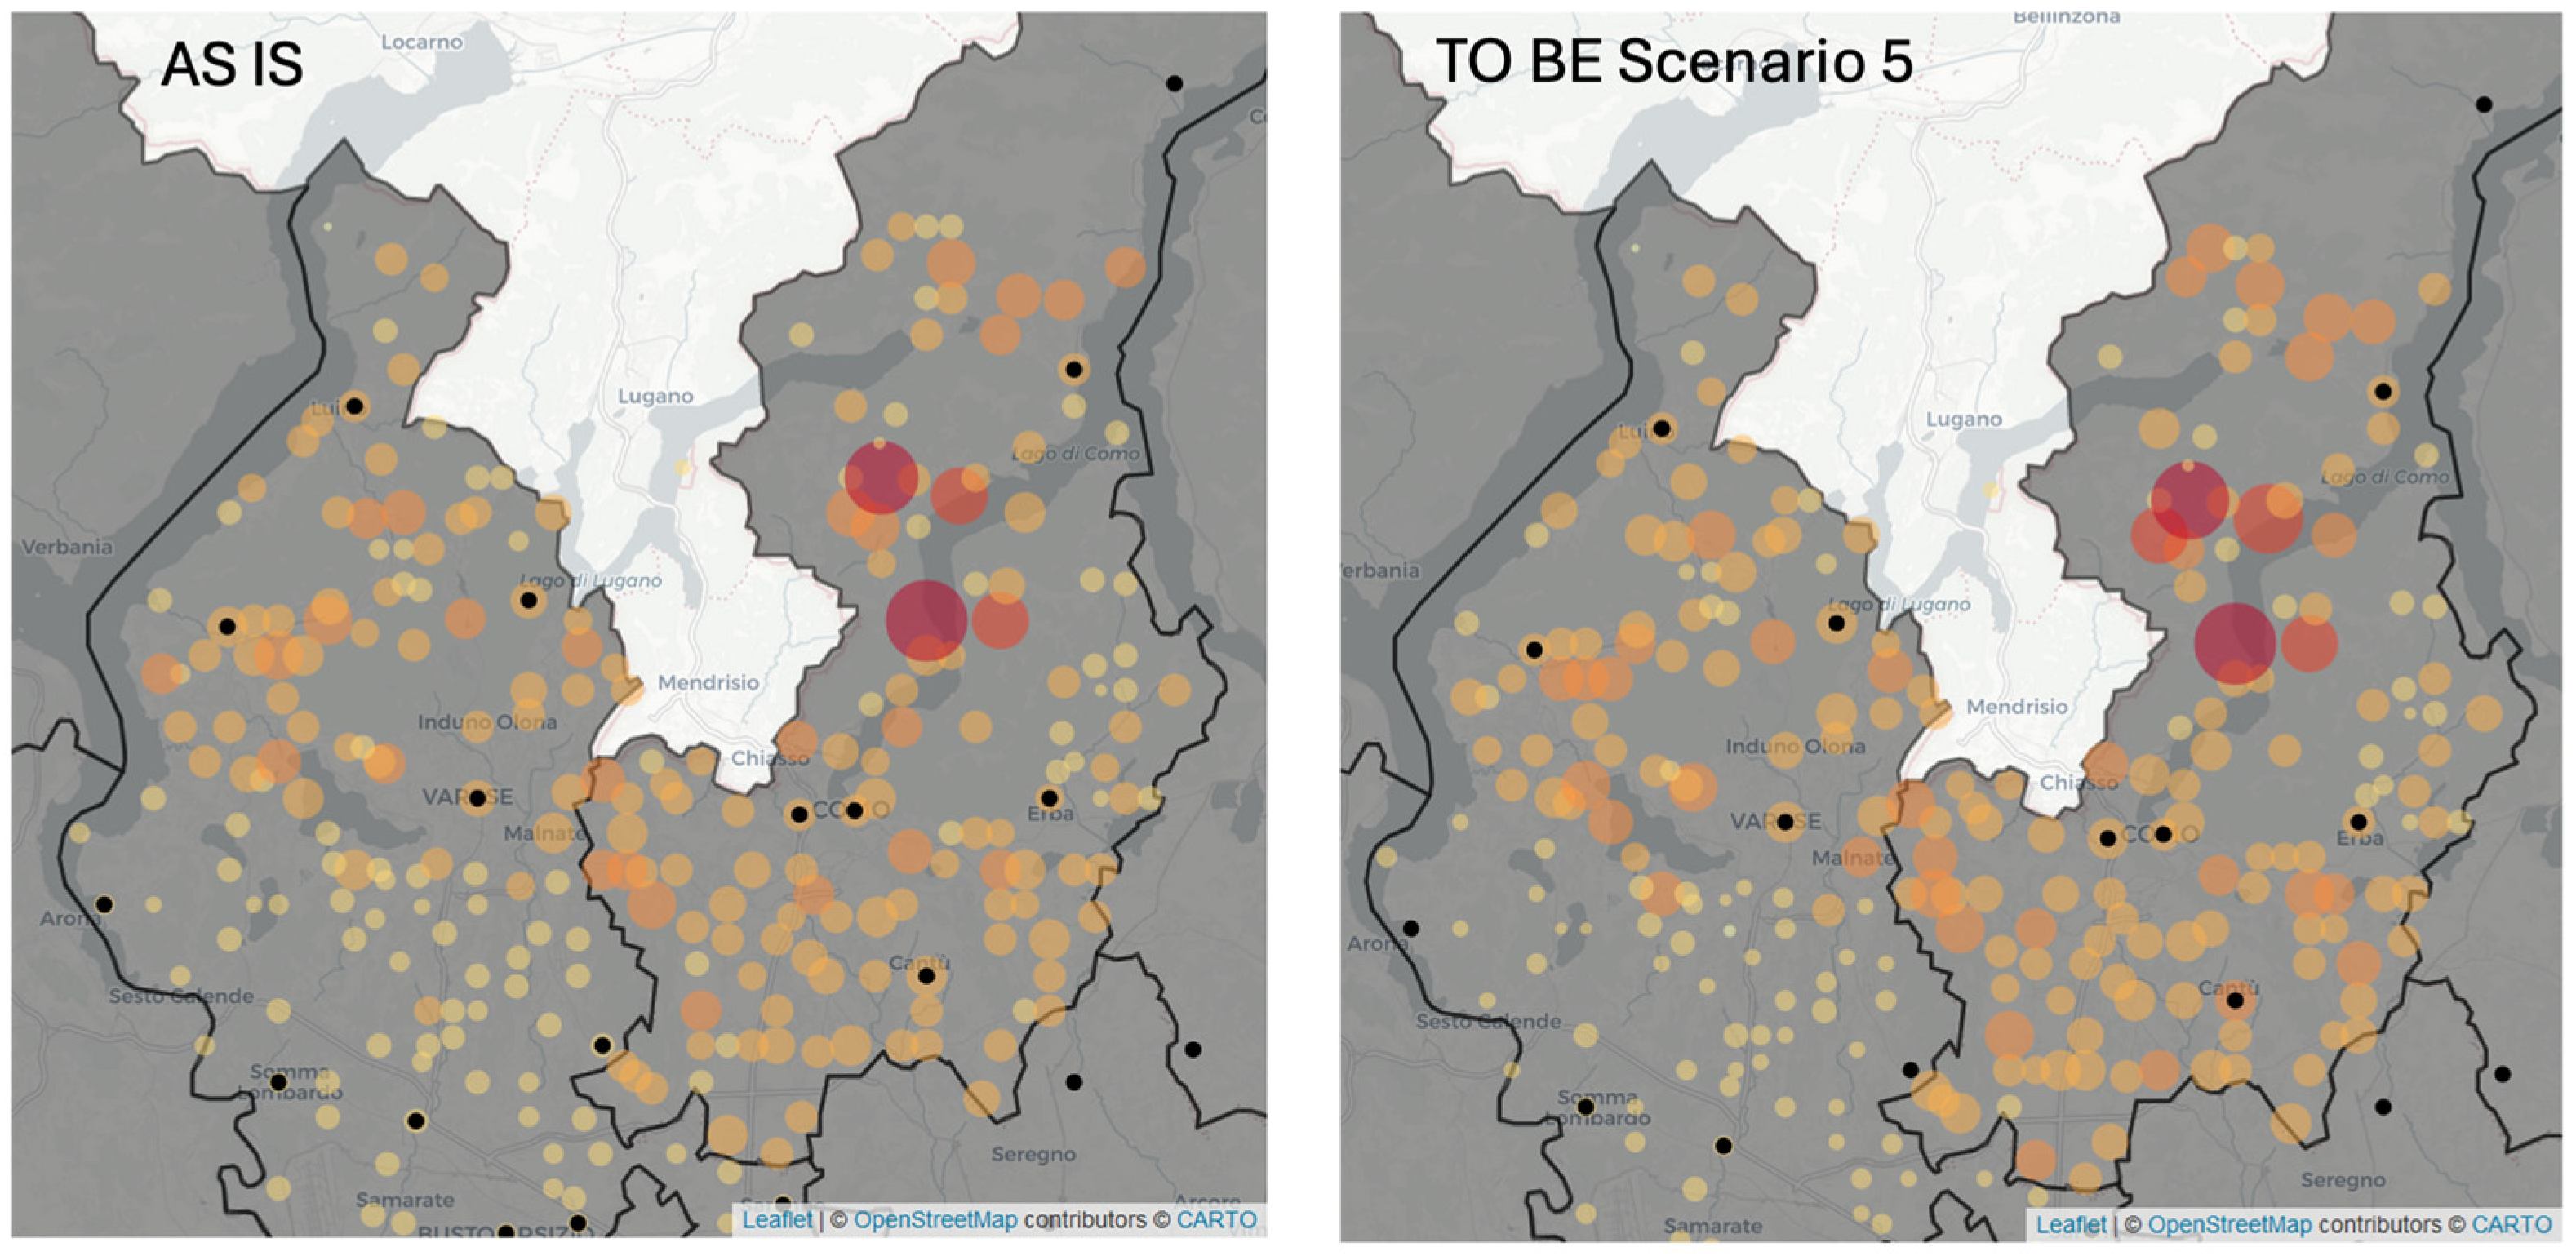
Figure 3 depicts the groups of patients (orange dots) served by hospital pharmacies (black dots) in the AS IS Scenario and, in the 5th TO BE Scenario in 2020. The size and color of each orange dot represents the number of hospital dispensations for the group of patients. In the TO BE Scenario the size of orange dots is slightly reduced compared to the AS IS case. In the areas that are far from hospitals, e.g., in the south-east area, the dots representing the groups of patients are reduced.
5. Discussion
5.1. Answering RQ1: Which Self-Administered Drugs for Chronic Diseases among the Ones Currently Dispensed with a Centralized Distribution Approach Could Be Instead Dispensed by Community Pharmacies?
The proposed prescriptive analytics model provides support to decision-makers in the selection of drugs to be distributed by community pharmacies. As reported by previous literature [
24], the linear programming model is the prescriptive method adopted to provide a solution to this RQ and developed to consider the peculiarities of the present problem, such as the exclusive channel of distribution. According to previous evidence from the literature [
23], an algorithm is used to solve the model. Moreover, on the one hand, the model comprises the need to reduce access to hospitals and limit the distance traveled by patients and caregivers, ensuring their satisfaction, using constraints. On the other hand, the selection of the drugs to be distributed by community pharmacies is based on cost minimization, to consider the economic sustainability of this selection.
Hence, the model, starting from the defined scenarios, provides a number of drugs that can be distributed by community pharmacies, reducing the access to hospitals and ensuring respect for the patients’ willingness to travel, while providing the minimum cost increase for the NHS. Among the potential TO BE Scenarios, a maximum reduction in the drugs distributed by the hospital pharmacies is computed (−53.15%, −52.23%, and −54.60%, respectively, for 2018, 2019, and 2020), considering the 5th TO BE Scenario.
5.2. Answering RQ2: Which Drug Distribution Model, Centralized or Decentralized, Is More Effective Financially and Socially? What Impacts, including Economic, Organizational, and Patient Accessibility, Can Be Observed?
The evaluation of how the changes in the distribution channel could influence the number of hospital accesses and impact social aspects could be answered also highlighting the financial and economic perspective.
The modeling and analyses of the Scenarios, over these three years, showed a potential shift from hospital-based drug dispensation towards a more community pharmacy-centric approach as the optimal strategy, considering the decrease in the total access within the hospital setting and the increase in community pharmacy visits by the patients. This choice could be influenced by several parameters that the prescriptive model considers as inputs: the extra cost for distributing the drug i ∈ I through the community pharmacies (Ci), demand for drug i ∈ I expressed by the group of patients k ∈ K, and the maximum capacity of each community pharmacy l ∈ L (MaxPharmal). The analysis highlights the delicate balance between the projected operational efficiencies and patient convenience and accessibility, even if evaluated indirectly. The predicted gradual increases in costs, despite the projected reductions in dispensations and facilities, emphasize the complexities of the distribution process, considering the trade-off between the necessity to support organizational efforts within the hospital setting and to guarantee the economic sustainability of the activities performed by the community pharmacists. In the considered case, the slight increase in costs that characterizes the TO BE Scenarios, compared to a more significant reduction in hospital accesses, causes the DTP distribution to be attractive. In fact, in the considered case, the cost of managing distribution through hospital pharmacies almost balances the cost of distributing through community pharmacies. In contexts characterized by a similar balance, it would be convenient to switch the distribution to community pharmacies.
Furthermore, geographical distribution could play a significant role in the decision. As the distance between patients and hospitals increases, the convenience of distributing drugs through community pharmacies increases from the social sustainability point of view. The results concerning the average distance that patients should travel to be able to retrieve their medications demonstrate that a shift from the hospital to the territorial setting as a distribution channel could contribute to redesigning travel more efficiently, also having a significant impact on social and environmental issues, reducing productivity losses as well as CO2 emissions.
All the underlined advantages should be tested directly with the developed web-based application, which considers the parameters, and their variability as widgets supporting the uncertainty analyses. A sensitivity analysis was conducted, and the variability never exceeded 5%, demonstrating the robustness of the proposed Scenarios and the optimization model.
The choice to adopt community pharmacy distribution is also influenced by the maximum capacity of each community pharmacy. The proposed manuscript considers a small percentage of the actual number of dispensations, considering an increase in volume that would be sustainable for the community pharmacies with their current resources. On the other hand, as reported in Italian Ministerial Decree number 77, which sought to re-organize the healthcare services at the territorial level, community pharmacies are given a pivotal role, allowing these facilities to provide more services to citizens. Hence, the community pharmacies’ potential capacity would probably increase, providing extra-capacity for increasing the number of distributed drugs, and increasing their catchment area and the served population basin.
Furthermore, the benefits of the decentralized distribution model are in line with Italian Ministerial Decree number 77, focused on the re-organization of healthcare services between the hospital and territorial settings, demonstrating the innovativeness of this study. Considering the previous literature, these findings are in line with the ones in Singh [
20], reporting that community pharmacies are essential to provide equitable access to drug dispensation, and Whang [
21], demonstrating that territorial pharmacies could help achieve equitable access by measuring accesses considering different levels of social unbalance and spatial influence, but also those in Risanger and colleagues [
22], concluding that pharmacy-based testing provides good coverage and reasonable travel distances for large portions of population. Moreover, this work enlarges the results from the previous literature quantifying the investment costs needed to achieve such an objective.
Considering the impact of the COVID-19 pandemic on the drug distribution network and strategies, the results show that in 2020, as a consequence of a partial change in the distribution channels, a reduction in average times and kilometers is demonstrated, but the configuration, despite being better than in previous years, is not the optimal one. Focusing on chronic diseases, despite the presence of the COVID-19 pandemic or in other future health emergencies, patients must be treated and able to withdraw their drugs, and a tool such as the one developed in this study could support a proactive and community-centered model of care, starting from drug distribution processes [
28].
6. Conclusions
This work is grounded on the need to ensure the economic viability and accessibility of drugs and the increase in the demand for medications and healthcare services. Among the novel remedies that NHSs must explore, prescriptive analytics is reported to provide support in decisions encompassing the selection of medical product dispensing points.
The developed prescriptive analytics tool offers the potential to enhance the performance of drug distribution, both assuming the regional/national healthcare system’s perspective and from the standpoint of patients or users, also facilitating the decision-making process. Redesigning the medication distribution network to take advantage of the widespread presence of community pharmacies, as opposed to the Direct Distribution supported by hospital channels, increases the likelihood that patients, their caregivers, and family members can visit a pharmacy. This approach not only addresses social distancing concerns in cases of healthcare emergencies, but also aligns with environmental sustainability goals by avoiding the need for high-risk individuals to use public transport or other services. Considering the whole pharmaceutical supply chain, placing larger orders, and coordinating meticulously with drug manufacturers could lead to punctual deliveries, thereby minimizing waiting lists, controlling costs, and maintaining the system’s resilience.
The final goal of the study is related to both practical and theoretical contributions. In practical terms, the results and the defined tool could support to healthcare organizations and policymakers in developing more resilient medication supply chains and distribution networks, also with an active role played by local healthcare facilities. Considering the fields of optimization and healthcare analytics, from a theoretical perspective, the study could open avenues for future research applicable to a wide range of healthcare challenges.
This study is also threatened by limitations. First, the considered case is unique and limited to a geographic area of approximately 1895.8 sq.km., involving about 1.5 million citizens. Replicating the study by considering other cases could provide additional insights. Other limitations are related to the developed model. An important limitation is related to the sizing of community pharmacies, considering their capacity in terms of the number of patient visits per day, a dimension not taken into consideration in the simulation phase of the study in the absence of the relevant information. This aspect could generate problems of waiting and queues in community pharmacies, but certainly not of equity and accessibility, considering that all the TO BE Scenarios allow for the improvement of the existing drug distribution network. Another limitation is the use of an algorithm to solve the developed model, needed to deal with the number of variables constituting the problem in a reasonable amount of time. This means that the obtained solutions might not be the optimal ones. On the other hand, the adoption of the algorithm enables quick resolution and is accessible to all decision-makers.
Furthermore, this study opens possible avenues for future research, considering that the defined model should also be applied to other diseases or clinical conditions, such as acute conditions and vaccines. The model should be also used to process data from other geographical contexts, beyond the boundaries of ATS Insubria in the Lombardy Region, as in the present study. Instead, to optimize delivery processes, depending on the decision-makers’ willingness and need, data from both other local contexts or considering a broader level, from a regional or national setting, should be implemented within the tool using the same scenarios of optimization.
In addition, other pivotal future research could be developed to directly evaluate the impact of an optimized drug distribution network on patient accessibility, defining social costs, whereas the present study only considered this aspect using an indirect approach, by reducing the total travel time and distance, not quantifying the related costs sustained by the families.
Author Contributions
Conceptualization, E.F., M.P. and T.R.; methodology, G.P. and R.P.; software, G.P.; validation, E.F., F.A. and F.S.; formal analysis, G.P. and F.S.; investigation, F.S. and G.P.; resources, E.F., F.A. and F.S.; data curation, G.P. and F.S.; writing—original draft preparation, F.A. and R.P.; writing—review and editing, F.A., R.P. and E.F.; visualization, G.P.; supervision, E.F., T.R. and M.P.; project administration, T.R.; funding acquisition, E.F. and T.R. All authors have read and agreed to the published version of the manuscript.
Funding
This research is part of the ORFEA Project—Progetto di Ottimizzazione dei pRocessi distributivi dei Farmaci in tEmpi di pandemiA (2020-4155), funded by Fondazione Cariplo “Data Science for science and society” Area Ricerca Scientifica—year 2020.
Data Availability Statement
Data available on request due to privacy and ethical restrictions.
Conflicts of Interest
The authors declare no conflicts of interest.
References
- Singh, R.K.; Kumar, R.; Kumar, P. Strategic issues in pharmaceutical supply chains: A review. Int. J. Pharm. Healthc. Mark. 2016, 10, 234–257. [Google Scholar] [CrossRef]
- Kelle, P.; Woosley, J.; Schneider, H. Pharmaceutical supply chain specifics and inventory solutions for a hospital case. Oper. Res. Health Care 2012, 1, 54–63. [Google Scholar] [CrossRef]
- Baglio, M.; Garagiola, E.; Dallari, F. Outsourcing strategies and distribution models in Italian Pharma Supply Chain. In Proceedings of the 2017 IEEE International Conference on Service Operations and Logistics, and Informatics (SOLI), Bari, Italy, 18–20 September 2017; pp. 175–180. [Google Scholar] [CrossRef]
- Compagni, A.; Tediosi, F.; Tozzi, V.D. L’integrazione tra ospedale e territorio nelle Aziende Sanitarie. In Rapporto OASI 2010; Egea: Milano, Italy, 2010; pp. 519–538. [Google Scholar]
- Creazza, A.; Restelli, U.; Porazzi, E.; Garagiola, E.R.; Croce, D.; Arpesella, M.; Dallari, F.; Noè, C. Benchmarking of health technologies distribution models: An investigation of Lombardy’s local health authorities. Benchmarking Int. J. 2016, 23, 817–842. [Google Scholar] [CrossRef]
- Socal, M.P.; Sharfstein, J.M.; Greene, J.A. The pandemic and the supply chain: Gaps in pharmaceutical production and distribution. Am. J. Public Health 2021, 111, 635–639. [Google Scholar] [CrossRef] [PubMed]
- Smith, D.J.; McGill, L.; Carranza, D.; Adeyemo, A.; Hakim, A.J. Global engagement of pharmacists in test and treat initiatives: Bringing care from clinics to communities. J. Am. Pharm. Assoc. 2023, 63, 419–423. [Google Scholar] [CrossRef] [PubMed]
- Isernia, S.; Pagliari, C.; Bianchi, L.N.C.; Banfi, P.I.; Rossetto, F.; Borgnis, F.; Tavanelli, M.; Brambilla, L.; Baglio, F. Characteristics, components, and efficacy of telerehabilitation approaches for people with chronic obstructive pulmonary disease: A systematic review and meta-analysis. Int. J. Environ. Res. Public Health 2022, 19, 15165. [Google Scholar] [CrossRef] [PubMed]
- AbuKhousa, E.; Al-Jaroodi, J.; Lazarova-Molnar, S.; Mohamed, N. Simulation and modeling efforts to support decision making in healthcare supply chain management. Sci. World J. 2014, 2014, 354246. [Google Scholar] [CrossRef] [PubMed]
- Garlatti, A.; Bruni, V. Distribuzione dei farmaci: Gestione diretta o tramite farmacie?: Materiali e metodi da un caso aziendale. Mecosan 2014, 2014, 81–104. [Google Scholar] [CrossRef]
- Jommi, C.; Armeni, P.; De Luca, C.; Otto, M.; Vella, V. Il governo regionale dell’assistenza farmaceutica e il suo impatto sulla spesa. In L’aziendalizzazione della Sanità in Italia. Rapporto OASI 2011; Egea: Milano, Italy, 2011; pp. 259–296. [Google Scholar]
- Murillo-Zamorano, L.R.; Petraglia, C. Technical efficiency in primary health care: Does quality matter? Eur. J. Health Econ. 2011, 12, 115–125. [Google Scholar] [CrossRef]
- Garagiola, E.; Creazza, A.; Porazzi, E. Analyzing the performance of health technologies distribution models in primary care services. Meas. Bus. Excell. 2020, 25, 452–474. [Google Scholar] [CrossRef]
- Carsughi, A.; Santini, S.; Lamura, G. Impact of the lack of integrated care for older people with urinary incontinence and their family caregivers: Results from a qualitative pilot study in two large areas of the Marche Region. Ann. Dell’istituto Super. Sanità 2019, 55, 26–33. [Google Scholar]
- Esmaeillou, Y.; Asl, I.M.; Tabibi, S.J.; Cheraghali, A. Identifying factors affecting the pharmaceutical supply chain management in Iran. Galen Med. J. 2017, 6, 346–355. [Google Scholar] [CrossRef]
- Haleem, A.; Javaid, M.; Singh, R.P.; Suman, R. Telemedicine for healthcare: Capabilities, features, barriers, and applications. Sens. Int. 2021, 2, 100117. [Google Scholar] [CrossRef] [PubMed]
- Trap, B.; Todd, C.H.; Moore, H.; Laing, R. The impact of supervision on stock management and adherence to treatment guidelines: A randomized controlled trial. Health Policy Plan 2001, 16, 273–280. [Google Scholar] [CrossRef] [PubMed]
- Lepenioti, K.; Bousdekis, A.; Apostolou, D.; Mentzas, G. Prescriptive analytics: Literature review and research challenges. Int. J. Inf. Manag. 2020, 50, 57–70. [Google Scholar] [CrossRef]
- Min, H.; Zhou, G. Supply chain modeling: Past, present and future. Comput. Ind. Eng. 2002, 43, 231–249. [Google Scholar] [CrossRef]
- Singh, B.; Huang, H.-C.; Morton, D.P.; Johnson, G.P.; Gutfraind, A.; Galvani, A.P.; Clements, B.; Meyers, L.A. Optimizing distribution of pandemic influenza antiviral drugs. Emerg. Infect. Dis. 2015, 21, 251–258. [Google Scholar] [CrossRef] [PubMed]
- Zhang, C.; Dai, Y.; Han, J. Optimizing pharmacy-based distribution of pandemic influenza antiviral drugs based on large urban network. In Proceedings of the 2017 IEEE International Conference on Computational Science and Engineering and IEEE/IFIP International Conference on Embedded and Ubiquitous Computing, CSE and EUC 2017, Guangzhou, China, 21–24 July 2017; Volume 1, pp. 801–803. [Google Scholar] [CrossRef]
- Risanger, S.; Singh, B.; Morton, D.; Meyers, L.A. Selecting pharmacies for COVID-19 testing to ensure access. Health Care Manag. Sci. 2021, 24, 330–338. [Google Scholar] [CrossRef]
- Emu, M.; Chandrasekaran, D.; Mago, V.; Choudhury, S. Validating Optimal COVID-19 Vaccine Distribution Models. In Lecture Notes in Computer Science (Including Subseries Lecture Notes in Artificial Intelligence and Lecture Notes in Bioinformatics), LNCS; Springer International Publishing: Cham, Switzerland, 2021; Volume 12742, pp. 352–366. [Google Scholar] [CrossRef]
- Alghanmi, N.; Alotaibi, R.; Alshammari, S.; Alhothali, A.; Bamasag, O.; Faisal, K. A Survey of Location-Allocation of Points of Dispensing During Public Health Emergencies. Front. Public Health 2022, 10, 811858. [Google Scholar] [CrossRef]
- Liu, K.; Liu, C.; Xiang, X.; Tian, Z. Testing facility location and dynamic capacity planning for pandemics with demand uncertainty. Eur. J. Oper. Res. 2023, 304, 150–168. [Google Scholar] [CrossRef]
- He, X.; Luo, L.; Tang, X.; Wang, Q. Optimizing Large-Scale COVID-19 Nucleic Acid Testing with a Dynamic Testing Site Deployment Strategy. Healthcare 2023, 11, 393. [Google Scholar] [CrossRef]
- Costantino, N.; Dotoli, M.; Falagario, M.; Fanti, M.P.; Mangini, A.M.; Sciancalepore, F.; Ukovich, W. A model for the optimal design of the hospital drug distribution chain. In Proceedings of the 2010 IEEE Workshop on Health Care Management, WHCM 2010, Venice, Italy, 18–20 February 2010; pp. 1–5. [Google Scholar] [CrossRef]
- Sanfelici, M. The Italian response to the COVID-19 crisis: Lessons learned and future direction in social development. Int. J. Community Soc. Dev. 2020, 2, 191–210. [Google Scholar] [CrossRef]
| Disclaimer/Publisher’s Note: The statements, opinions and data contained in all publications are solely those of the individual author(s) and contributor(s) and not of MDPI and/or the editor(s). MDPI and/or the editor(s) disclaim responsibility for any injury to people or property resulting from any ideas, methods, instructions or products referred to in the content. |
© 2024 by the authors. Licensee MDPI, Basel, Switzerland. This article is an open access article distributed under the terms and conditions of the Creative Commons Attribution (CC BY) license (https://creativecommons.org/licenses/by/4.0/).


 ,
, 


