

Smart Installation Weather Warning Decision Support
 , , , , and
Abstract
:1. Introduction
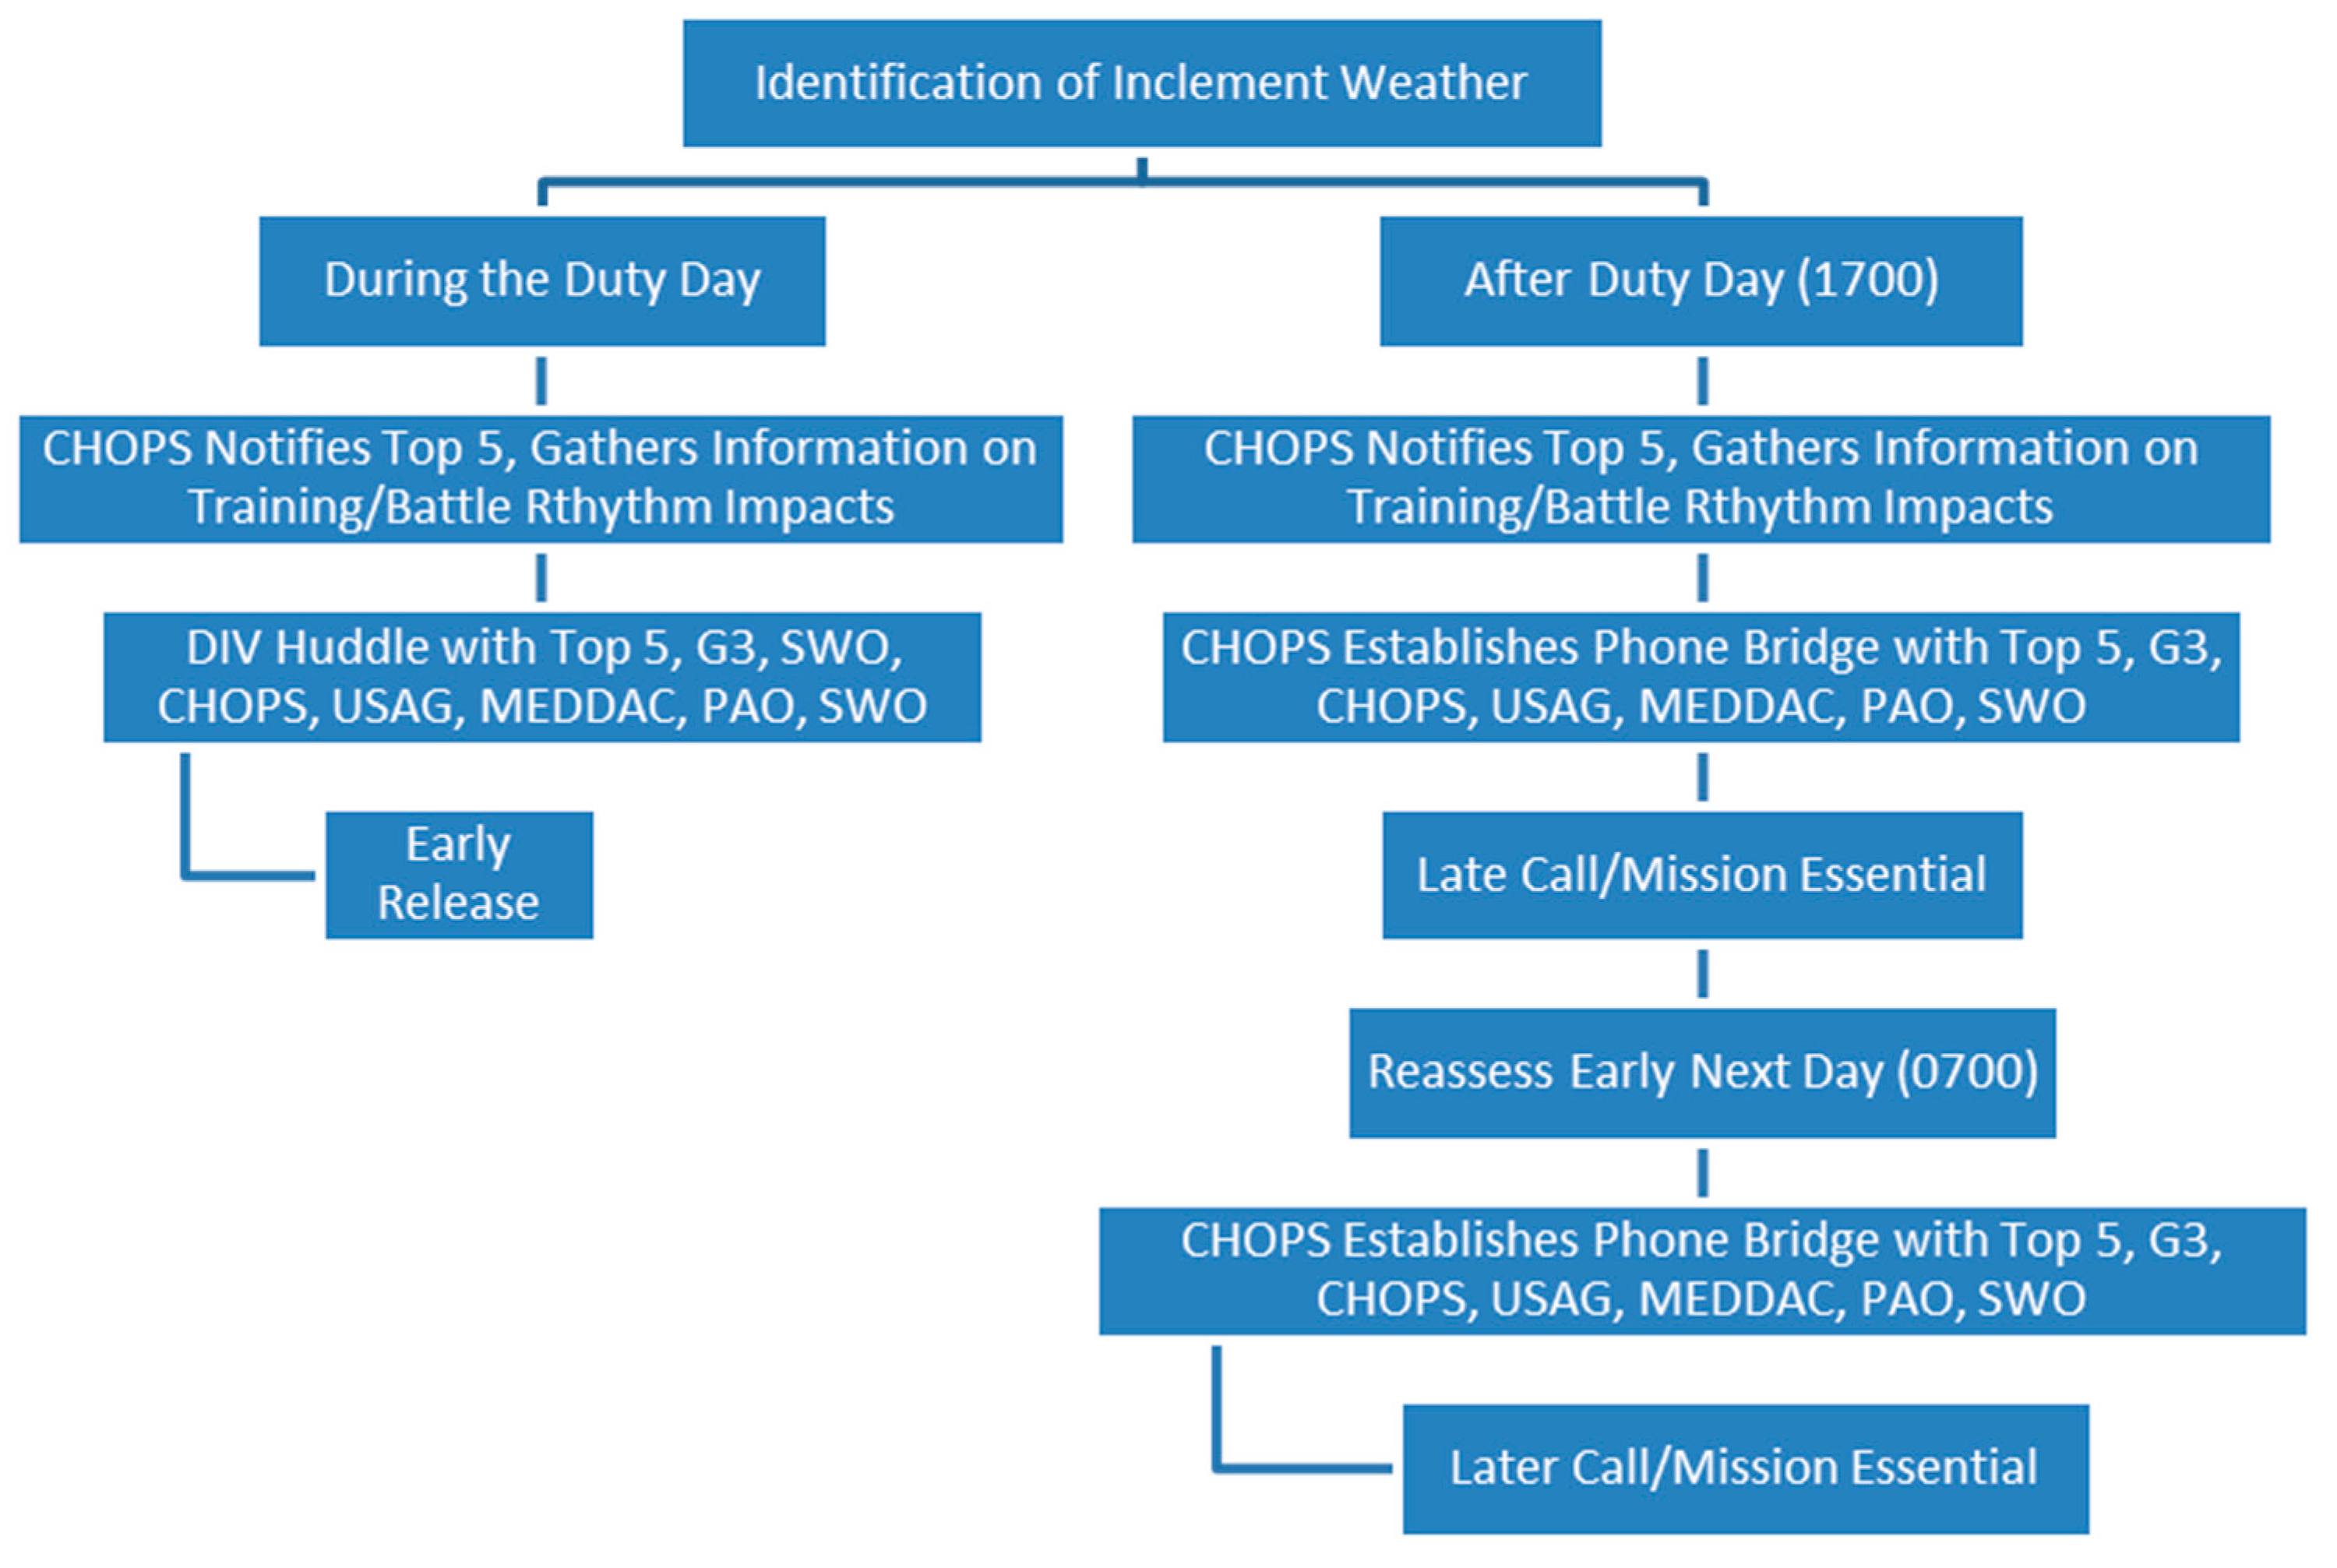
2. Current Severe Weather Warning Process
3. Project Scope
4. Weather Data
4.1. Data Source Identification
- NWS Forecast API;
- NOAA NDFD Forecast;
- NOAA High-Resolution Rapid Refresh (HRRR) model;
- Real-time NWS Products;
- Local Climatological Data (LCD);
- On-site weather stations.
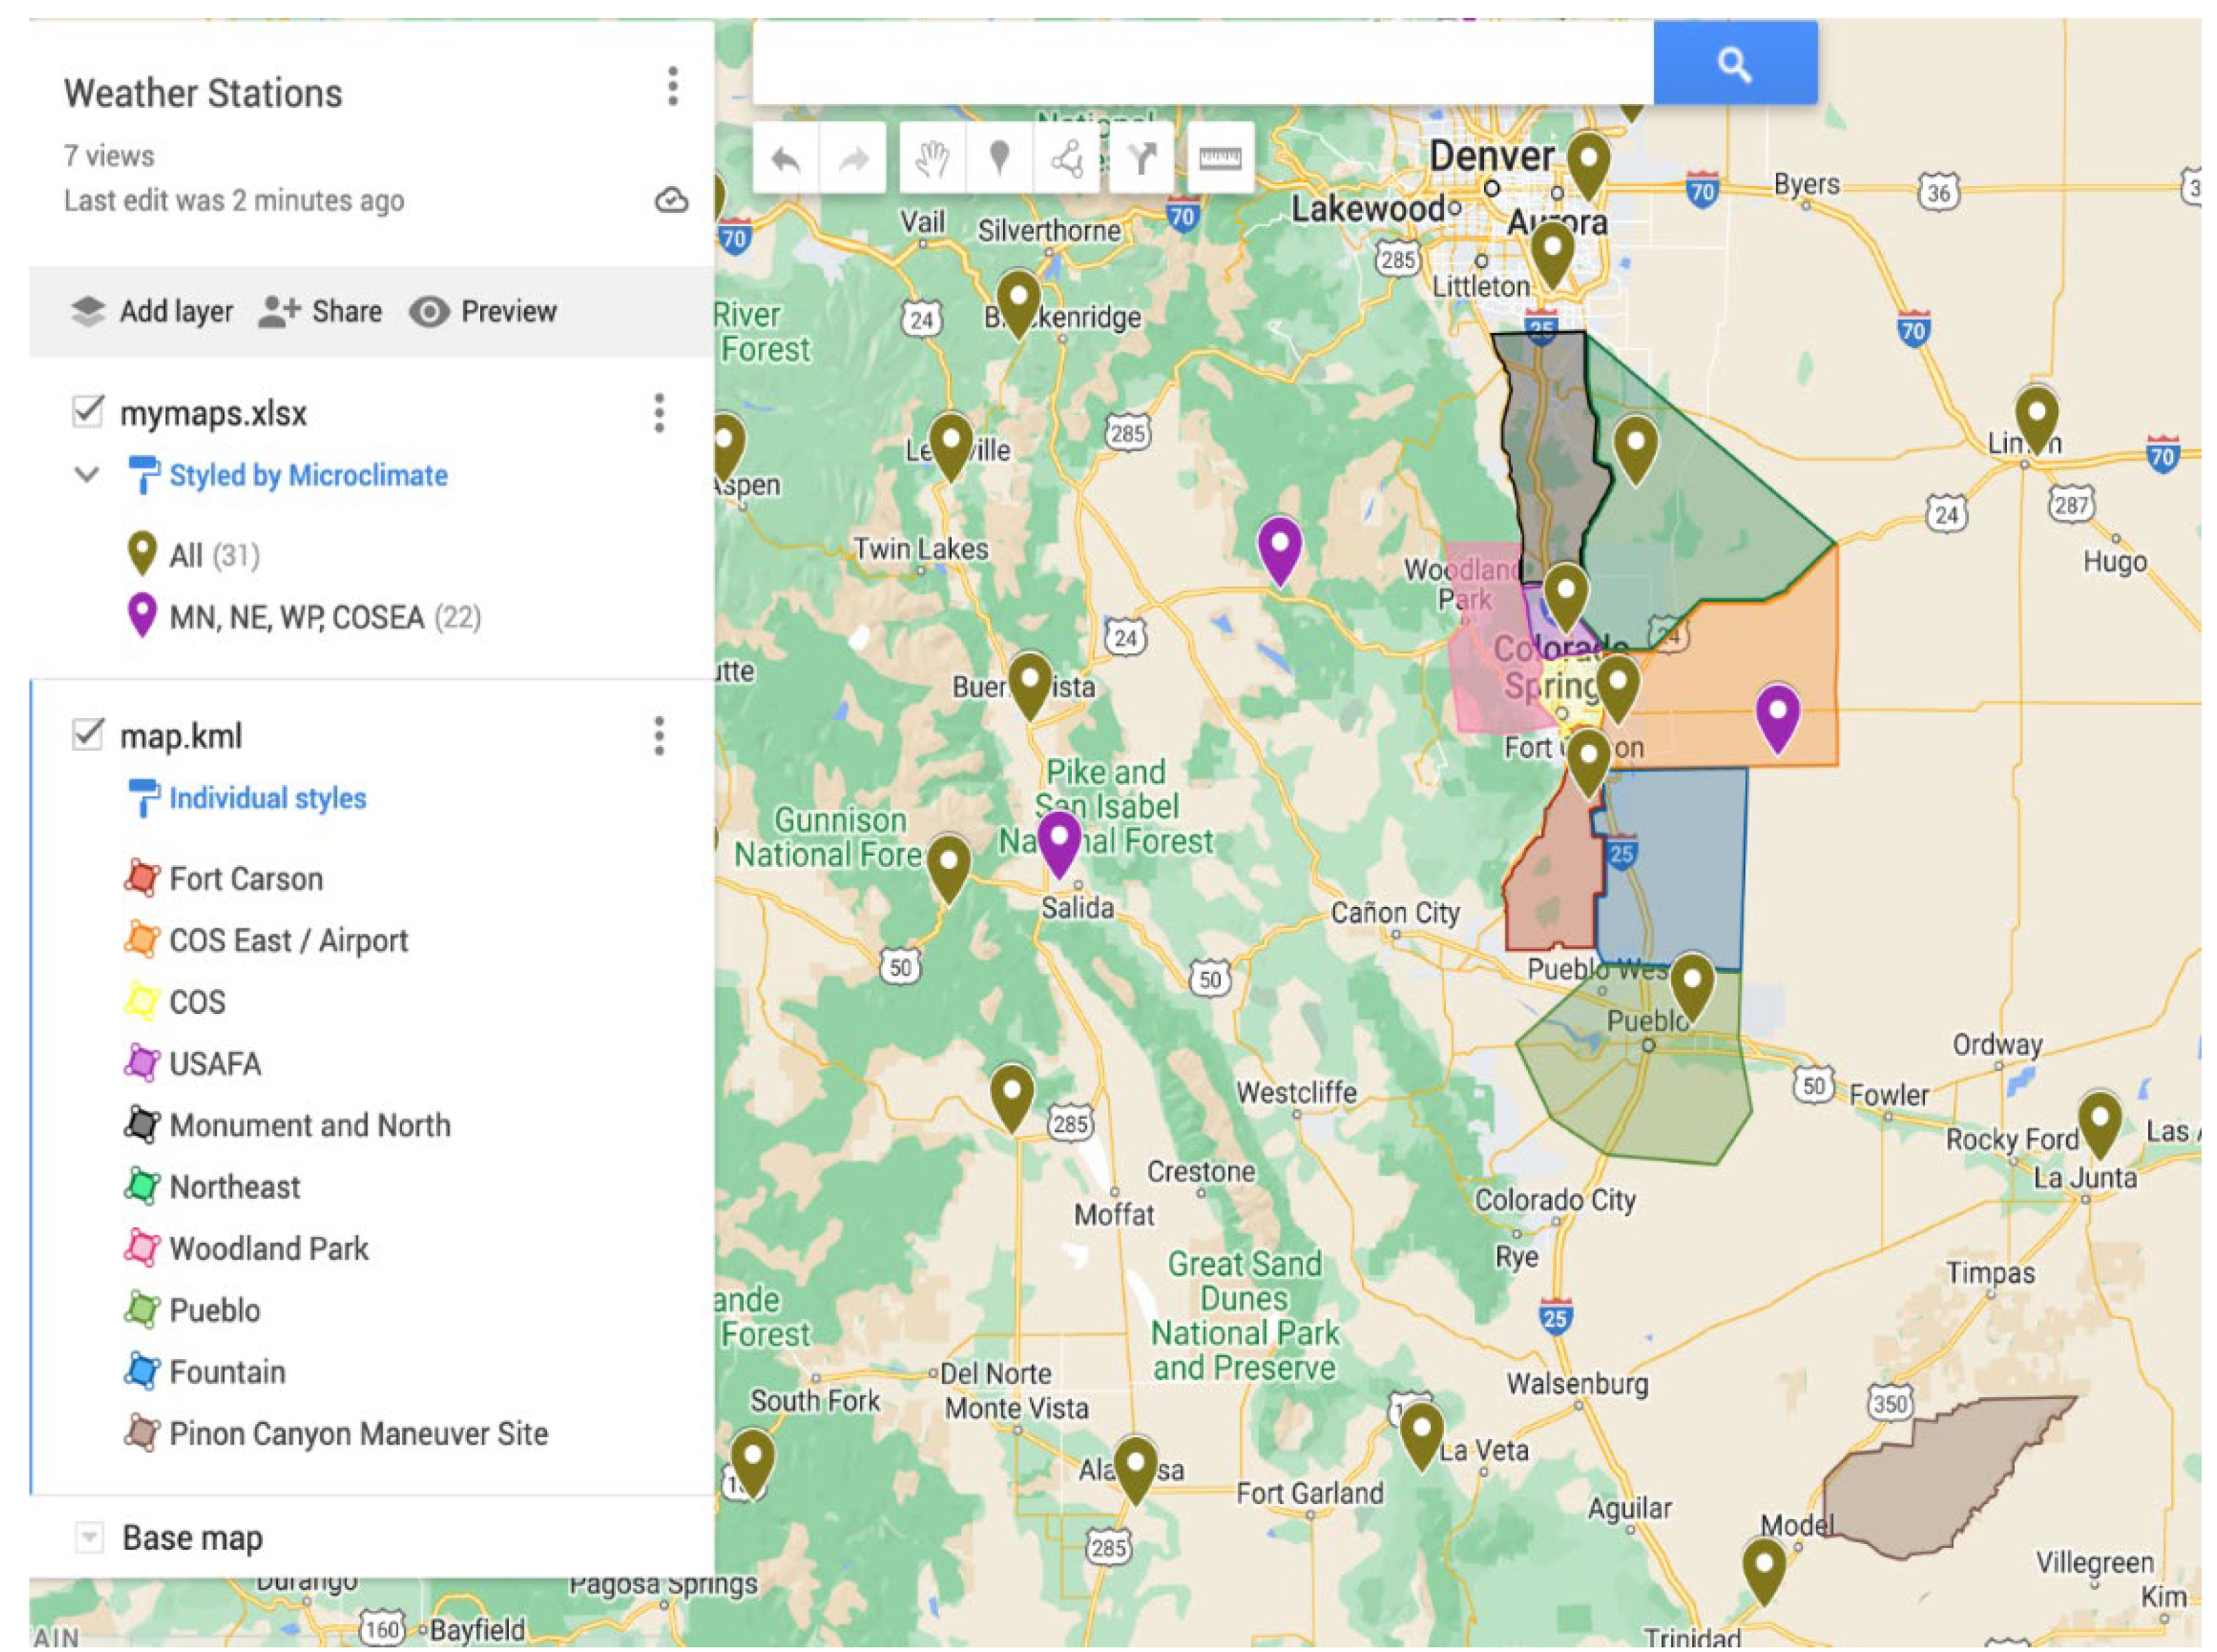
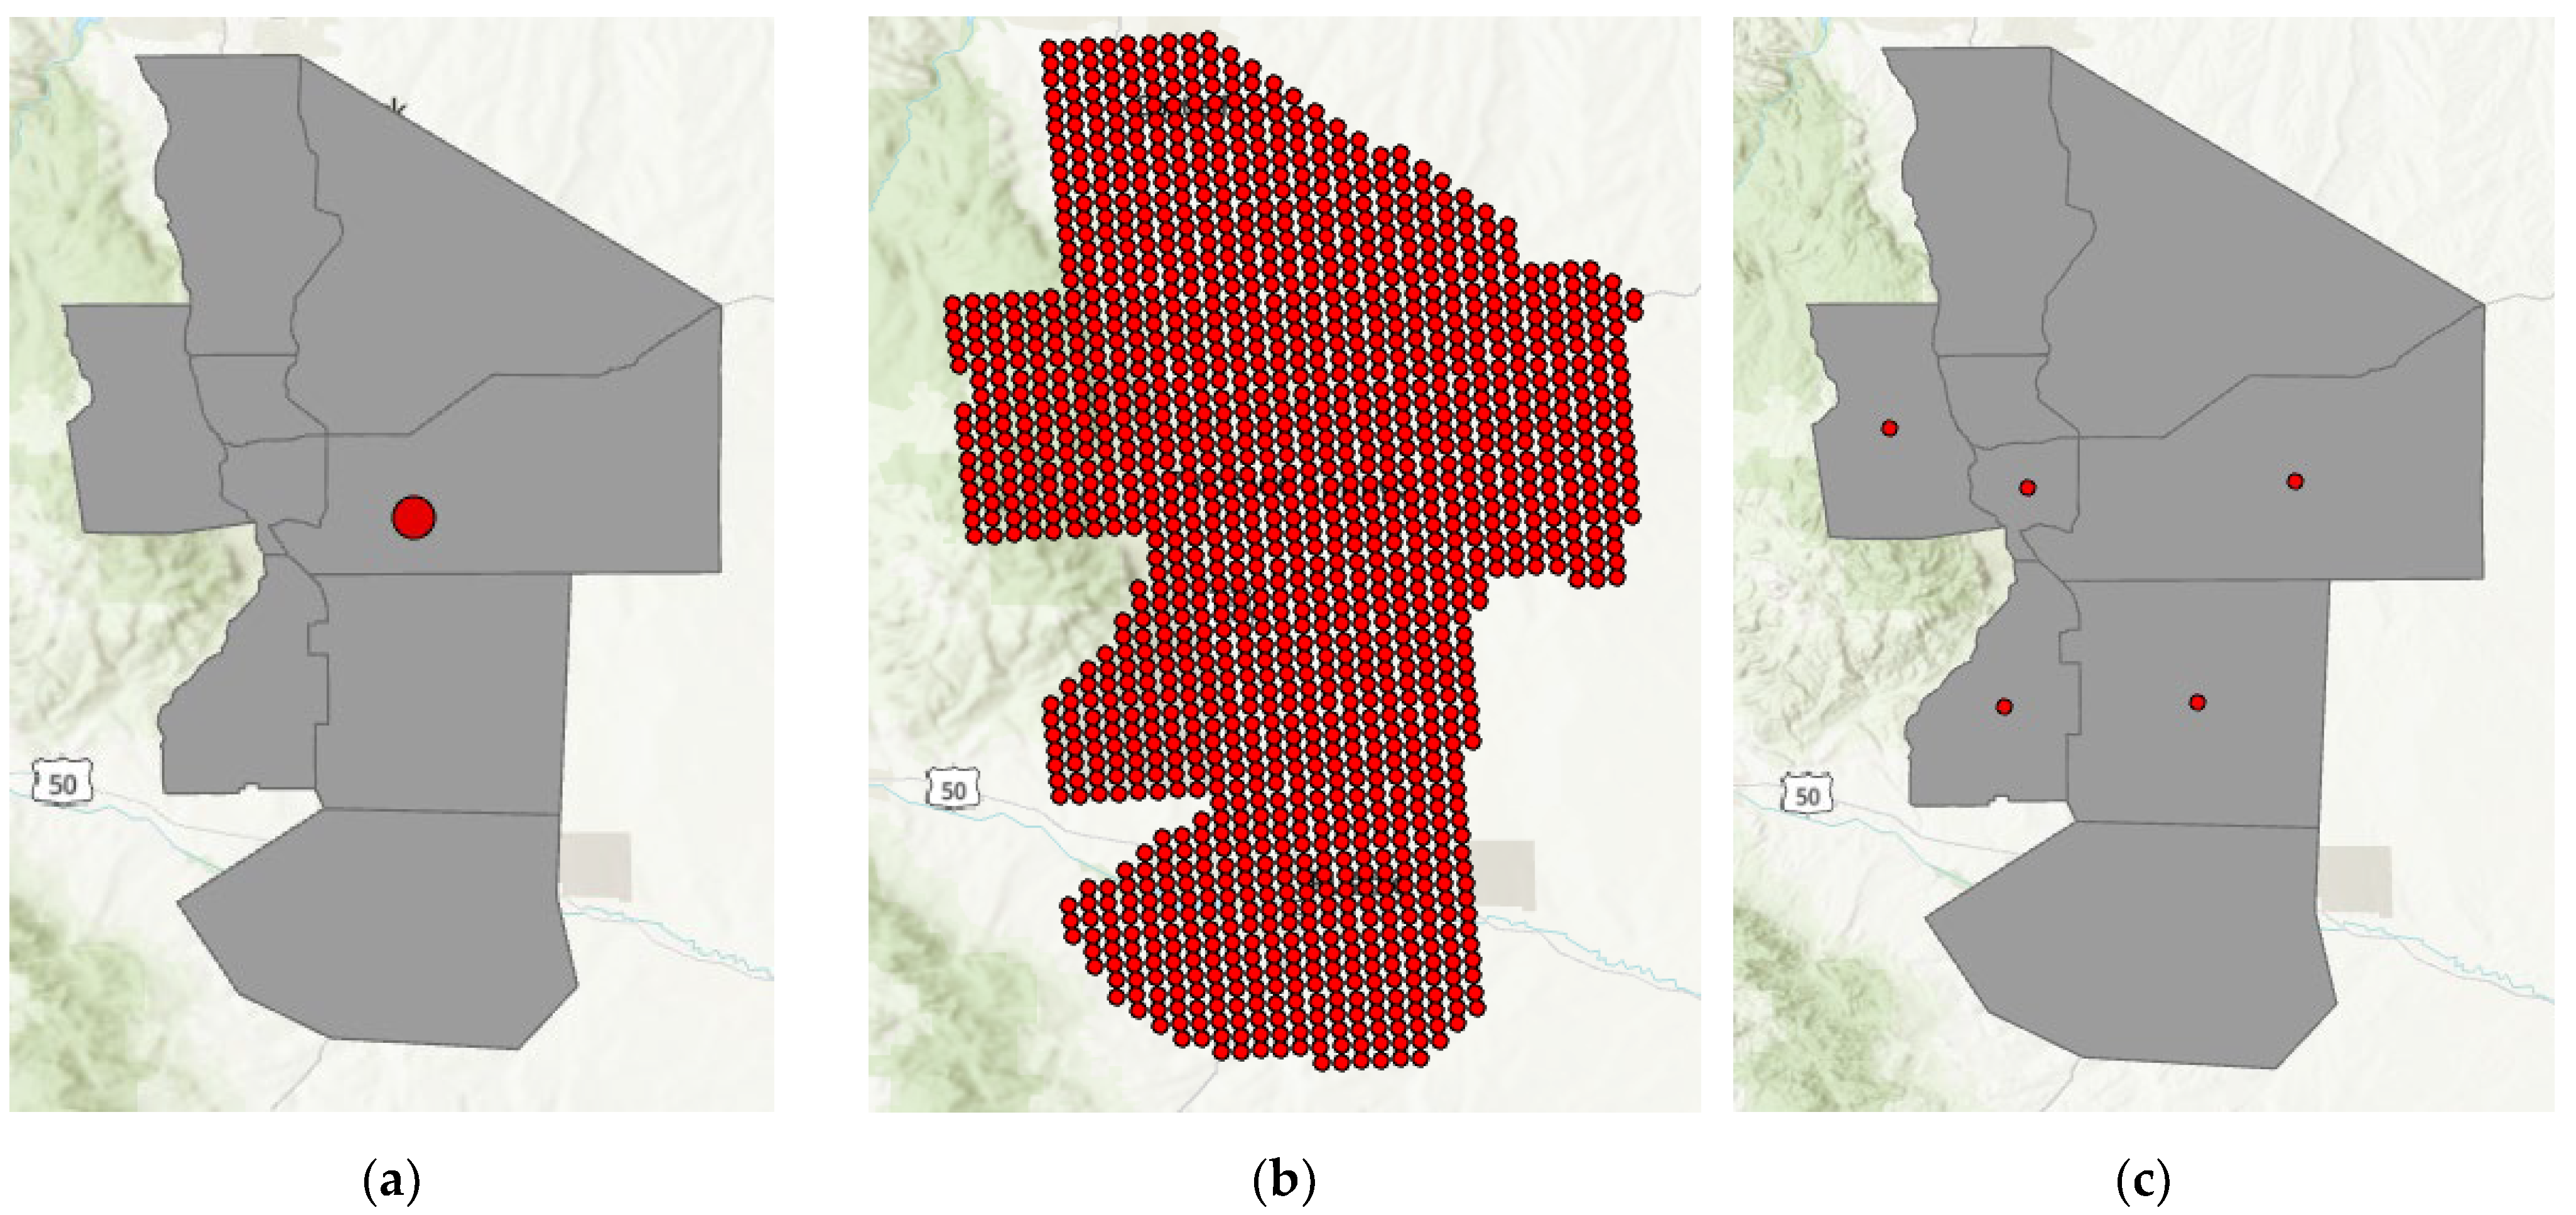
4.2. Weather Station Locations
4.3. National Weather Service Forecast Data
4.4. NOAA NDFD Data
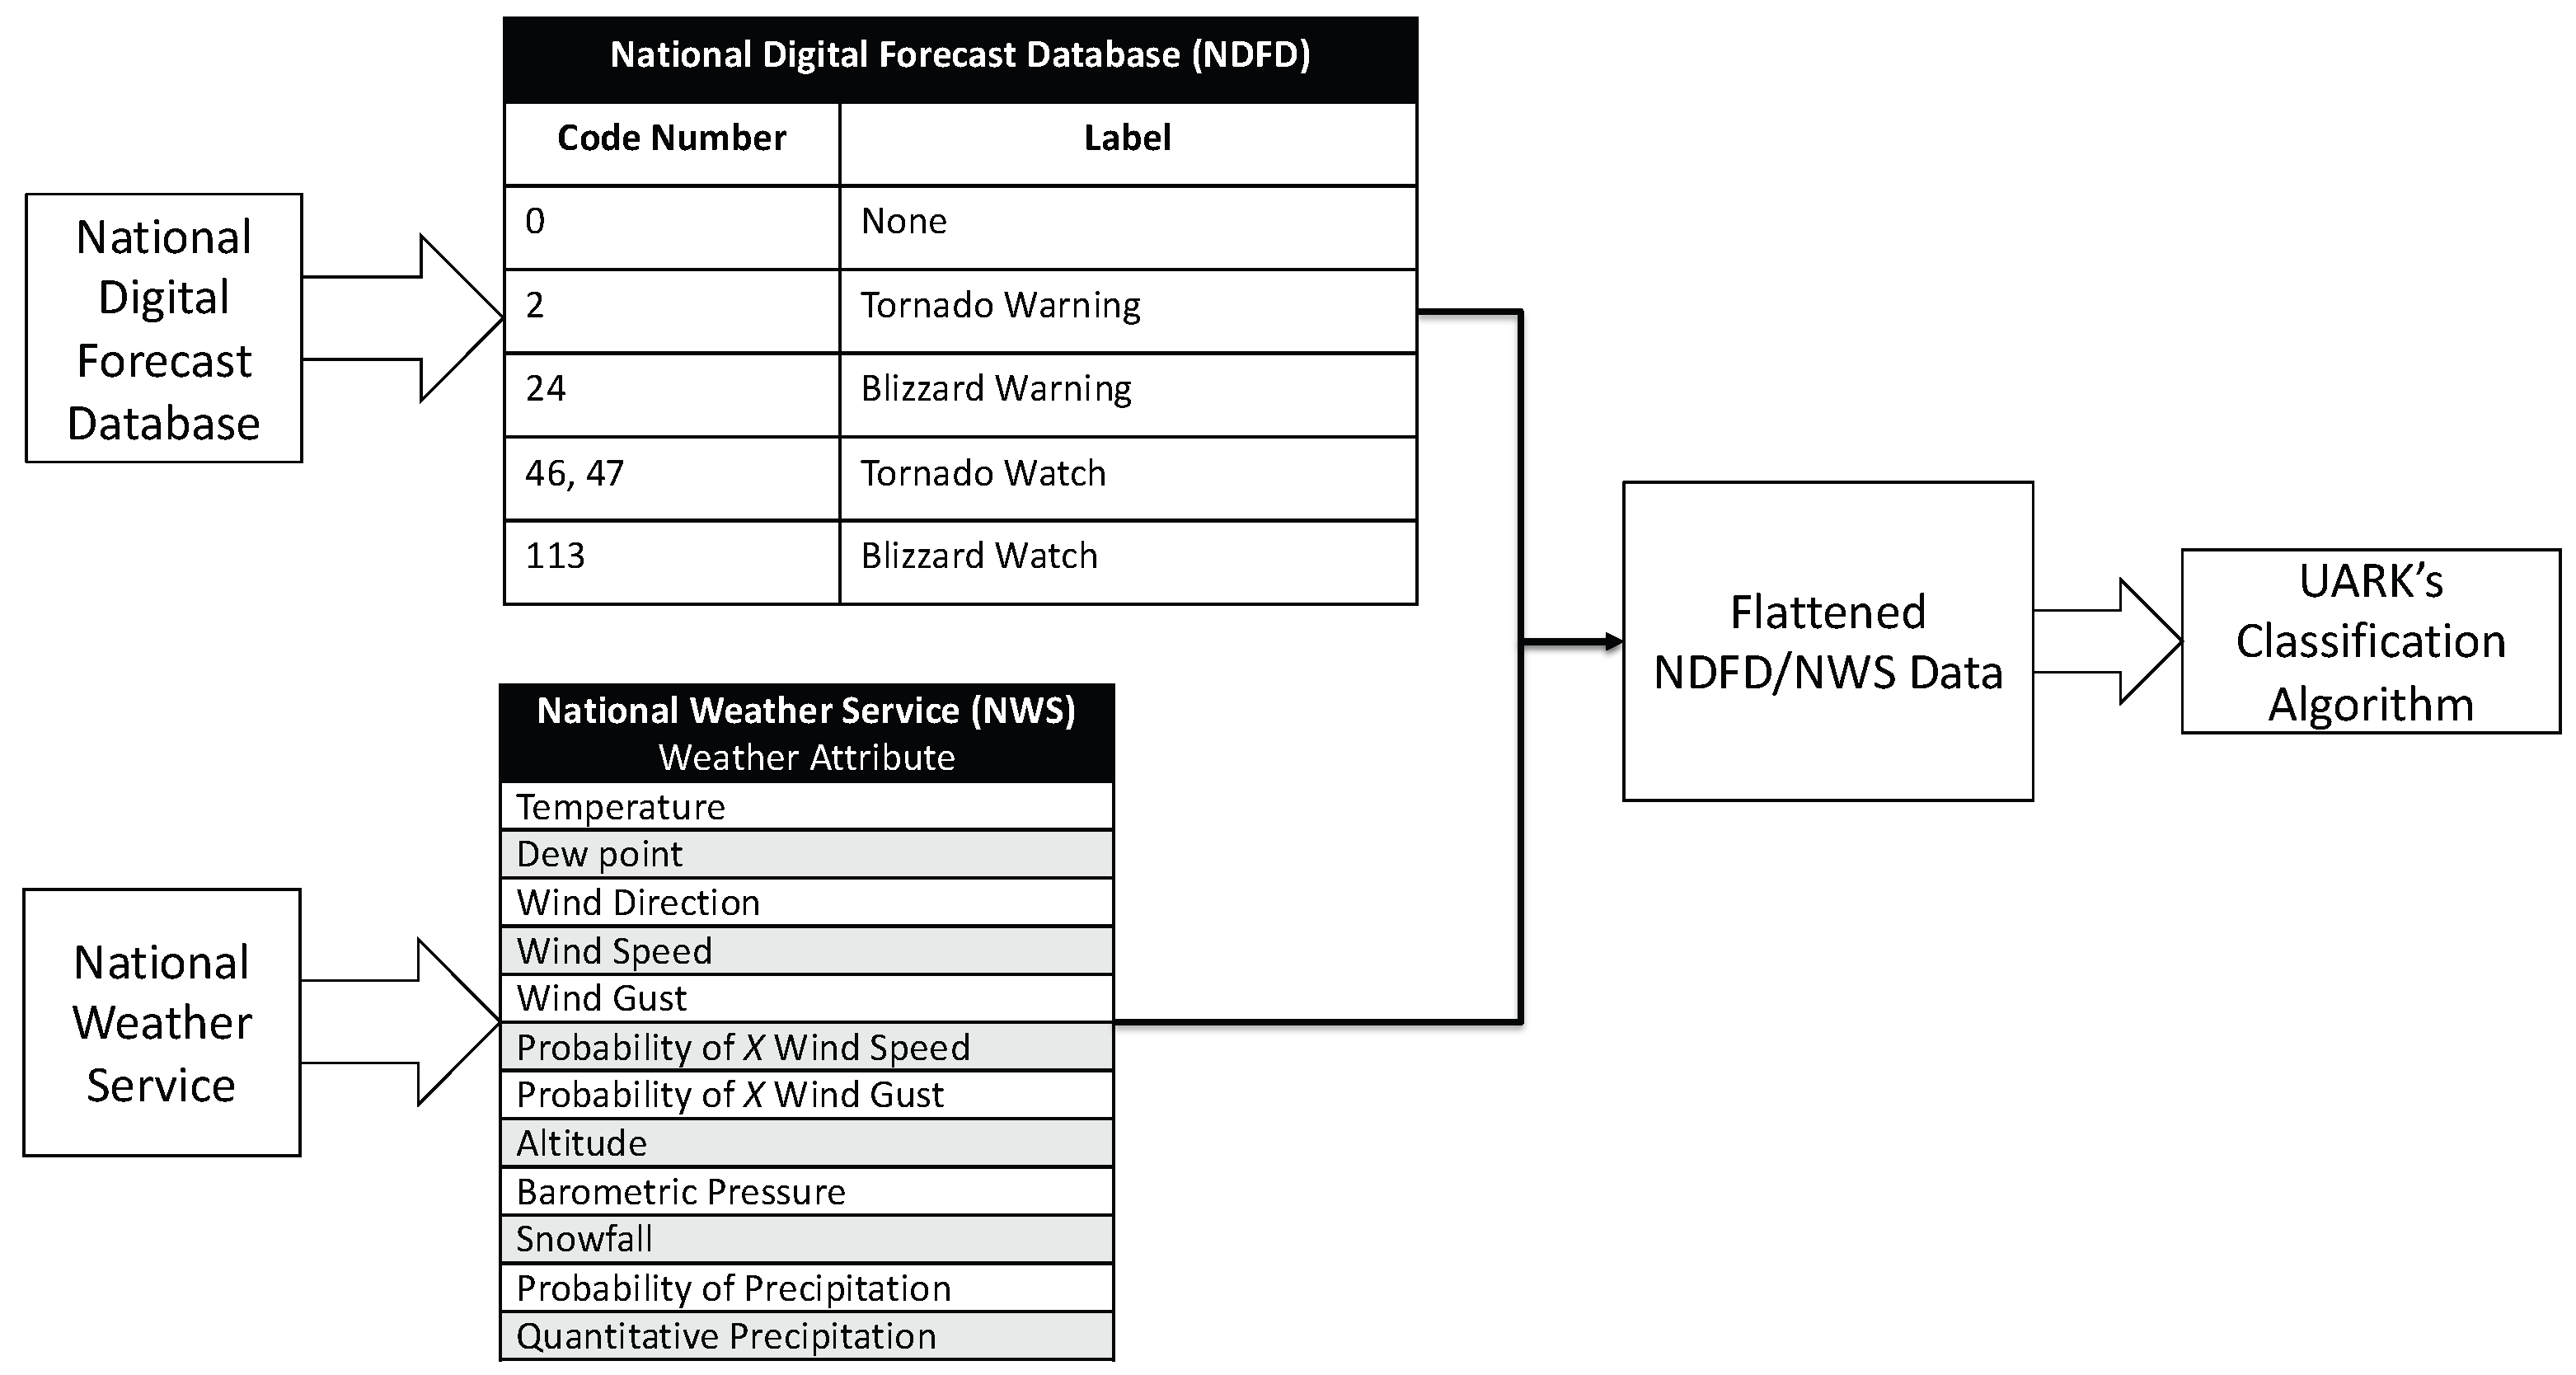
4.5. Combining NWS and NDFD Data
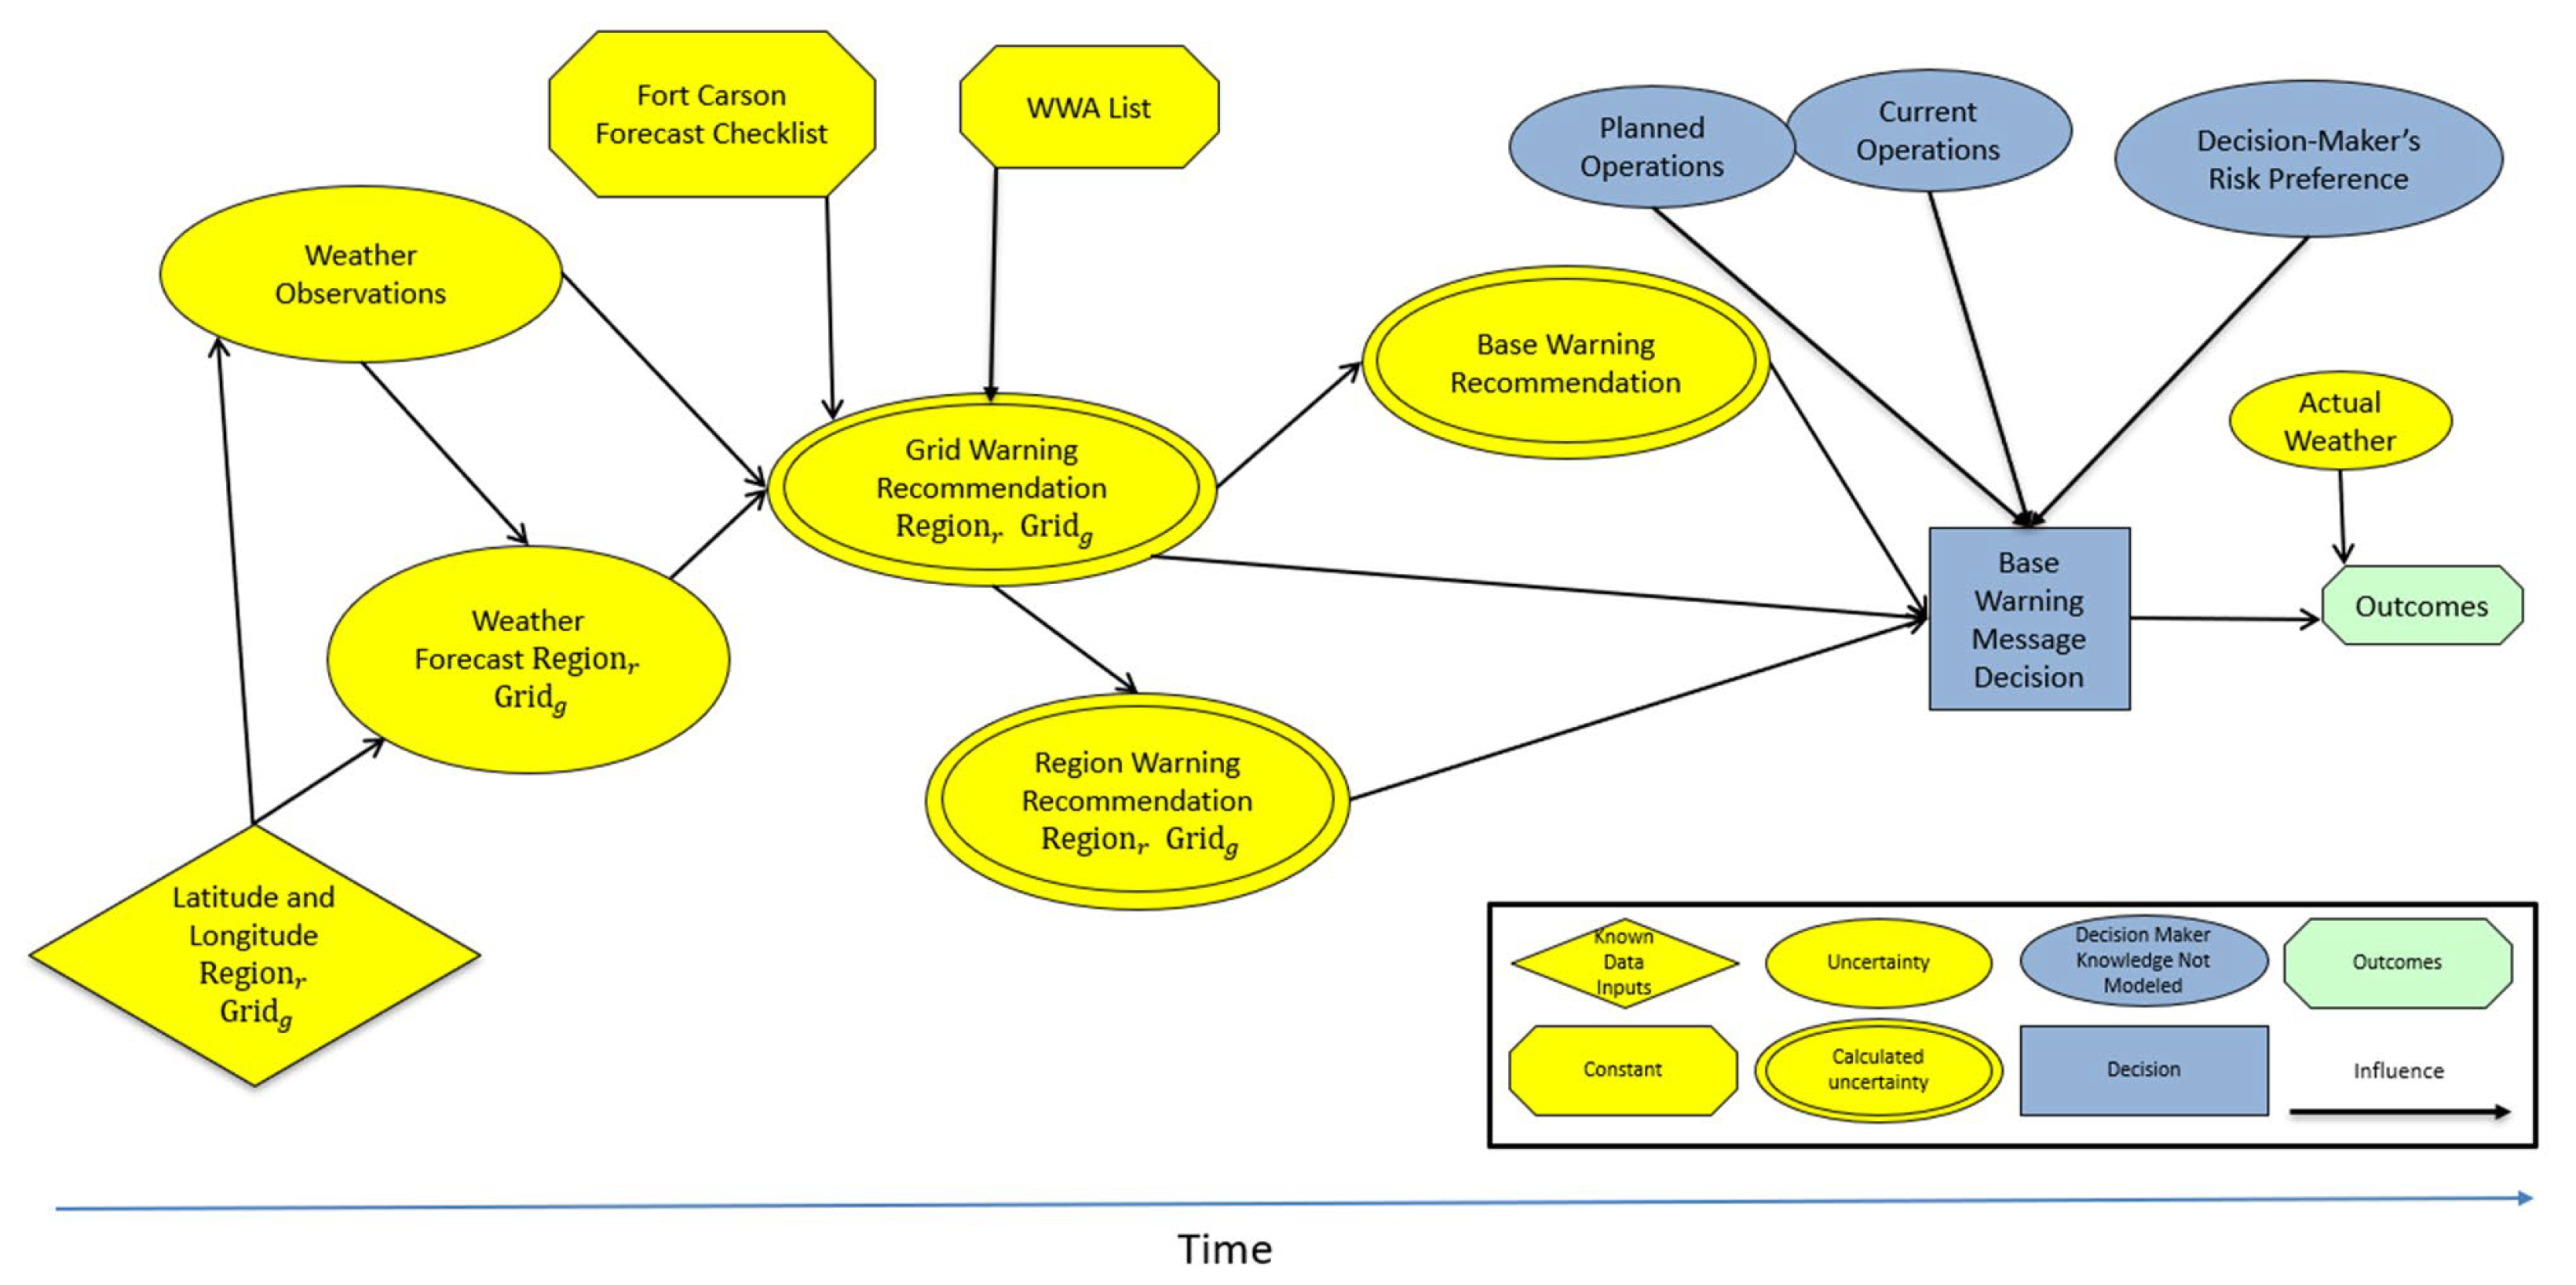
5. Weather Decision Support Tool
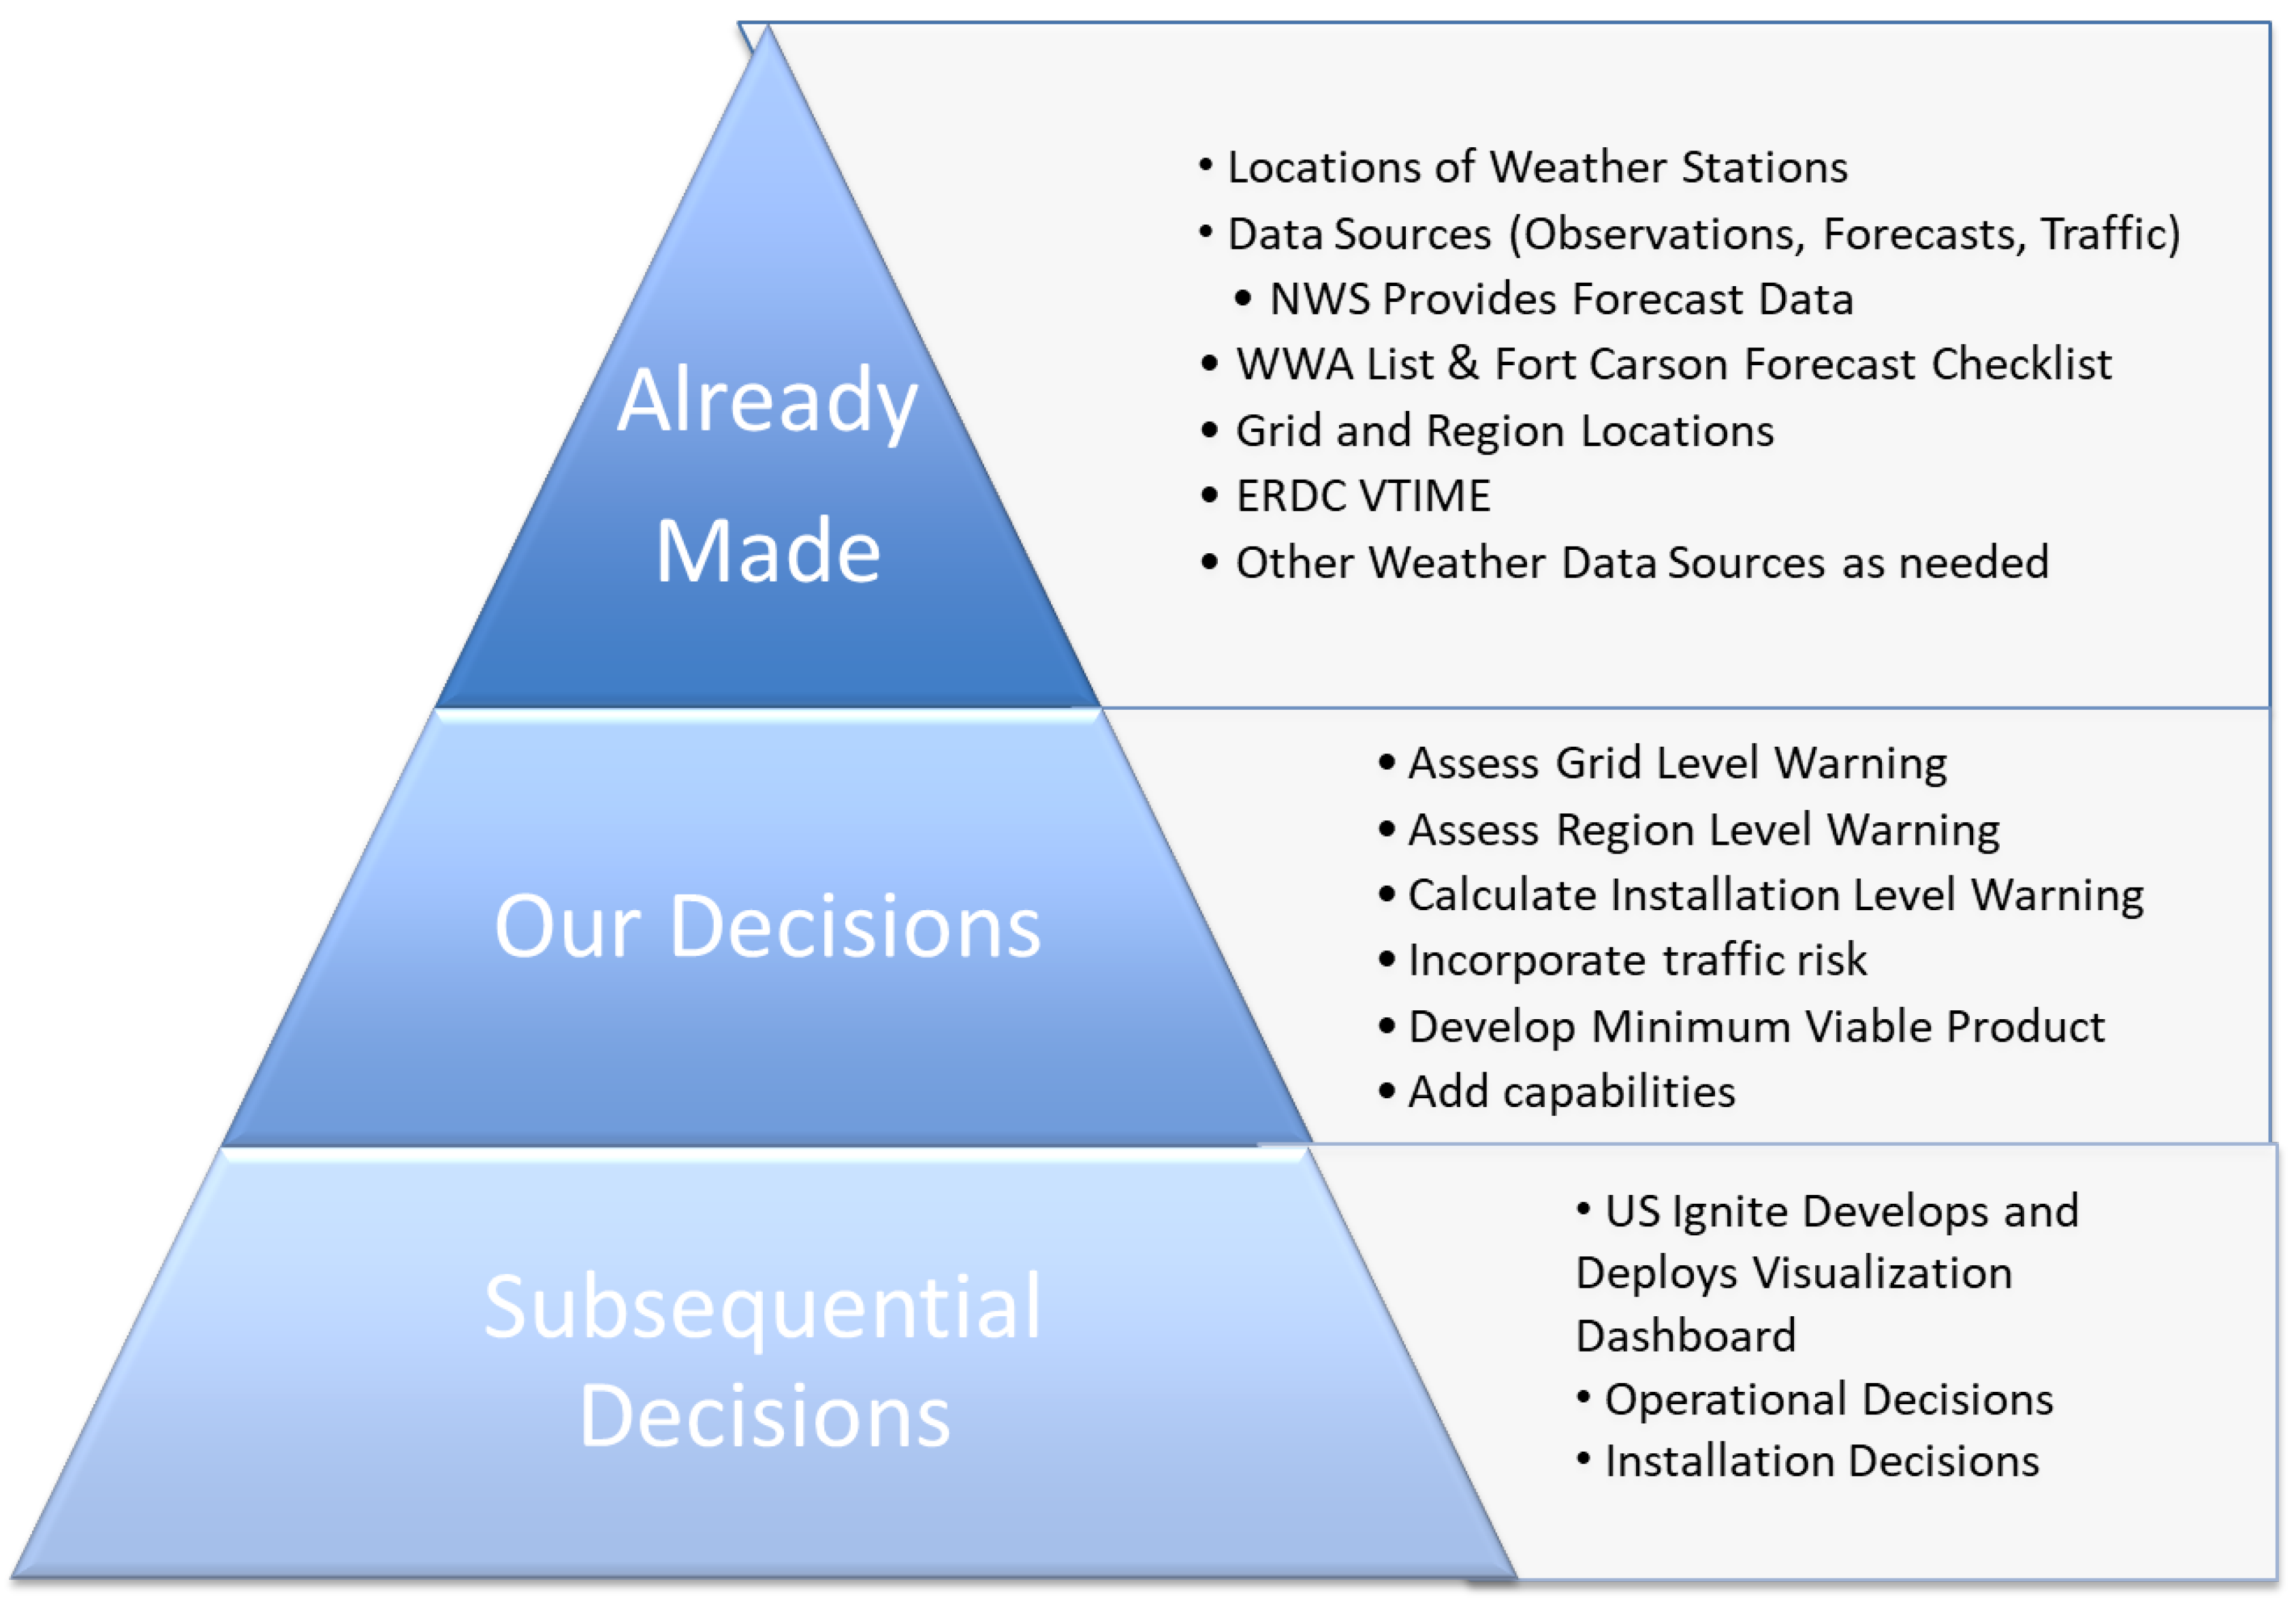
5.1. Interpreting the Modeling Process
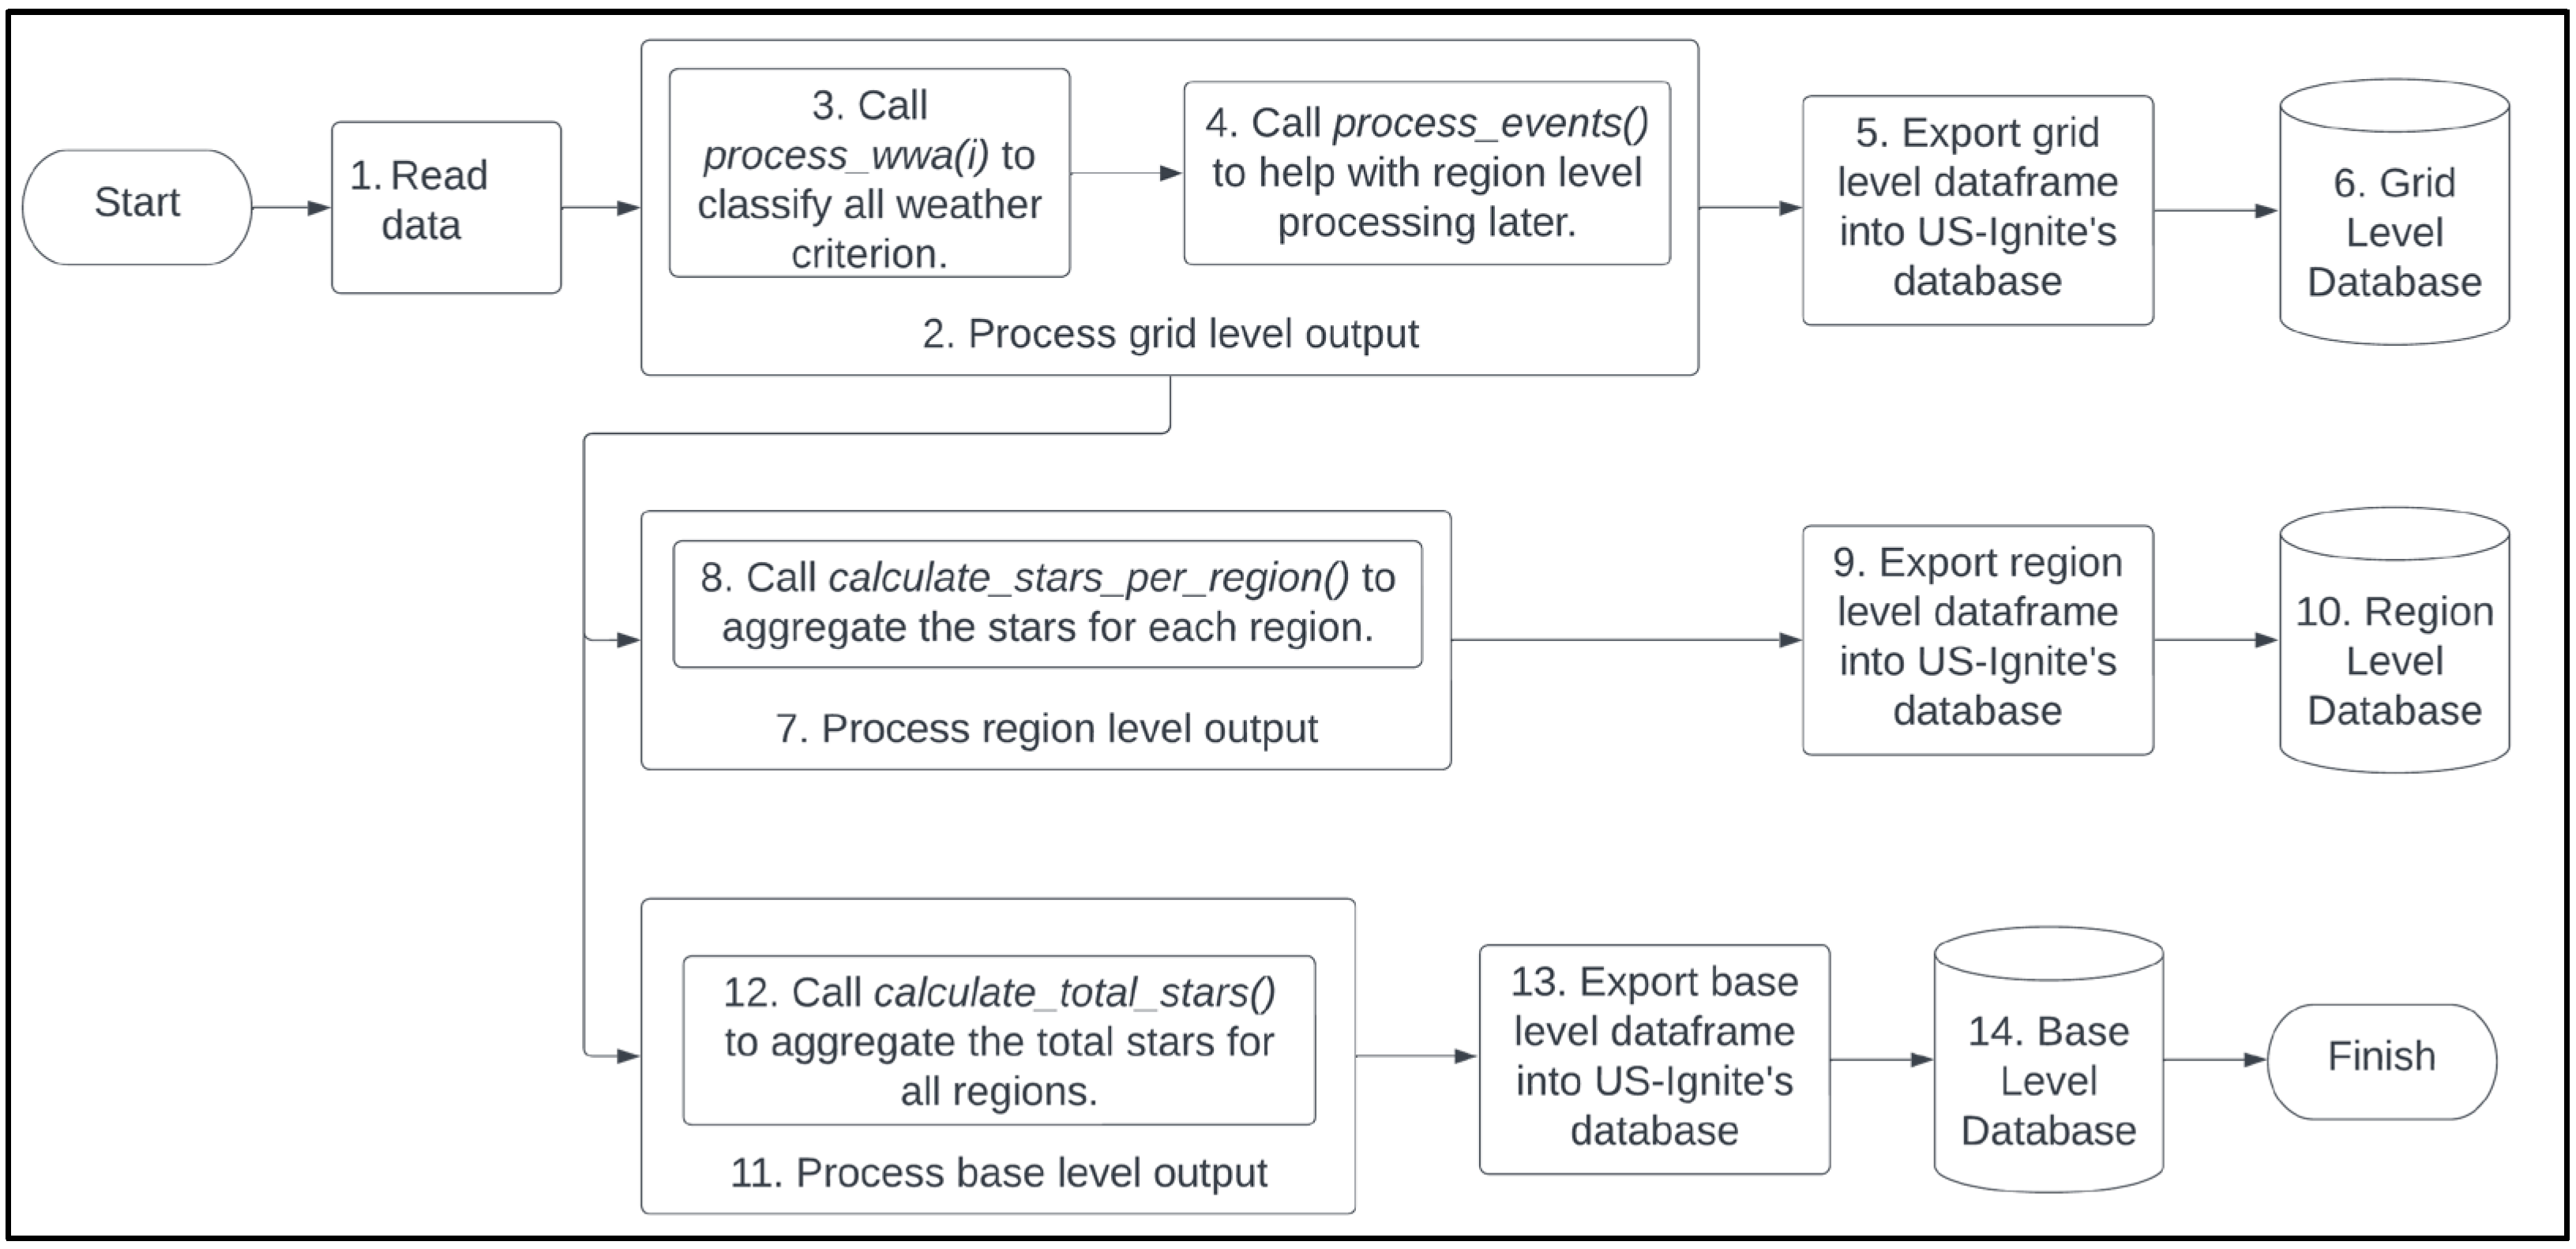
5.2. Weather Classification Algorithm
6. Results
7. Summary
8. Research Contributions
9. Limitations and Challenges
10. Future Work
Author Contributions
Funding
Data Availability Statement
Acknowledgments
Conflicts of Interest
References
- Lakshmanan, V.; Smith, T.; Stumpf, G.; Hondl, K. The Warning Decision Support System—Integrated Information. Weather Forecast. 2007, 22, 596–612. [Google Scholar] [CrossRef]
- Stumpf, G.J.; Gerard, A.E. National Weather Service Severe Weather Warnings as Threats-in-Motion. Weather Forecast. 2021, 36, 627–643. [Google Scholar] [CrossRef]
- Brown, B.G.; Nance, L.B.; Williams, C.L.; Newman, K.M.; Franklin, J.L.; Rappaport, E.N.; Kucera, P.A.; Gall, R.L. User-Responsive Diagnostic Forecast Evaluation Approaches: Application to Tropical Cyclone Predictions. Weather Forecast. 2023, 38, 2321–2342. [Google Scholar] [CrossRef]
- Lu, H.; Zhu, Y.; Shi, K.; Lv, Y.; Shi, P.; Niu, Z. Using Adverse Weather Data in Social Media to Assist with City-Level Traffic Siltation Awareness and Alerting. Appl. Sci. 2018, 8, 1193. [Google Scholar] [CrossRef]
- Shi, K.; Wang, Y.; Lu, H.; Zhu, Y.; Zhendong, N. EKGTF: A knowledge-enhanced model for optimizing social network-based meteorological briefings. Inf. Process. Manag. 2021, 58, 102564. [Google Scholar] [CrossRef]
- Choi, J.Y.; Engel, B.A.; Farnsworth, R.L. Web-based GIS, and spatial decision support system for watershed management. J. Hydroinformatics 2005, 7, 165–174. [Google Scholar] [CrossRef]
- Soyemi, J.; Bolaji, A.A. A Web-based Decision Support System with SMS-based Technology for Agricultural Information and Weather Forecasting. Int. J. Comput. Appl. 2018, 180, 1–6. [Google Scholar] [CrossRef]
- Fort Carson CO Natural Disasters and Weather Extremes. Available online: http://www.usa.com/fort-carson-co-natural-disasters-extremes.htm (accessed on 5 September 2022).
- Brandt, J.; Dawson, L.; Johnson, J.; Kirby, S.; Marlin, D.; Sauter, D.; Shirkey, R.; Swanson, J.; Szymber, R.; Zeng, S. Second Generation Weather Impacts Decision Aid Applications and Web Services Overview; Army Research Laboratory: Adelphi, MD, USA, 2013. [Google Scholar]
- Aljohani, F.H.; Ahmed, A.A.S.; Ramazan, M.S.; Alzahrani, B.; Bahbouh, N.M. A Smart Framework for Managing Natural Disasters on the IoT and ML. Appl. Sci. 2023, 13, 3888. [Google Scholar] [CrossRef]
- Piadeh, F.; Behzadian, K.; Chen, A.S.; Campos, L.C.; Rizzuto, J.P.; Kapelan, Z. Event-based decision support algorithm for real-time flood forecasting in urban drainage systems using machine learning modelling. Environ. Model. Softw. 2023, 167, 105772. [Google Scholar] [CrossRef]
- Chen, X.; Wang, M.; Wang, S.; Chen, Y.; Wang, R.; Zhao, C.; Hu, X. Weather Radar Nowcasting for Extreme Precipitation Prediction Based on the Temporal and Spatial Generative Adversarial Network. Atmosphere 2022, 13, 1291. [Google Scholar] [CrossRef]
- Eylander, J.; Bieszczad, J.; Ueckermann, M.; Peters, J.; Brooks, C.; Audette, W.; Ekegren, M. Geospatial Weather Affected Terrain Conditions and Hazards (GeoWATCH) description and evaluation. Environ. Model. Softw. 2023, 160, 105606. [Google Scholar] [CrossRef]
- O’Grady, M.; Langton, D.; Salinari, F.; Daly, P.; O’Hare, G. Service design for climate-smart agriculture. Inf. Process. Agric. 2021, 8, 328–340. [Google Scholar] [CrossRef]
- Singh, K.K.; Ghosh, K.; Bhan, S.C.; Singh, P.; Vishnoi, L.; Balasubramanian, R.; Attri, S.D.; Goroshi, S.; Singh, R. Decision support system for digitally climate informed services to farmers in India. J. Agrometeorol. 2023, 25, 205–214. [Google Scholar] [CrossRef]
- Na-Yemeh, D.Y.; Fiebrich, C.A.; Hocker, J.E.; Shafer, M. Assessing the Impact of a Weather Decision Support System for Oklahoma Public Safety Officials. Weather Clim. Soc. 2022, 14, 597–608. [Google Scholar] [CrossRef]
- Zhou, H.; Ren, H.; Royer, P.; Hou, H.; Yu, X. Big Data Analytics for Long-Term Meteorological Observations at Hanford Site. Atmosphere 2022, 13, 136. [Google Scholar] [CrossRef]
- Yang, S.; Yang, T.; Chang, Y.; Chen, C.; Lin, M.; Ho, J.; Lee, K.T. Development of Hydrological Ensemble Prediction System to Assist with Decision-Making for Floods during Typhoons. Sustainability 2020, 12, 4258. [Google Scholar] [CrossRef]
- Smallman, H.S.; Rieth, C.A. ADVICE: Decision Support for Complex Geospatial Decision Making Tasks. Virtual Augment. Mix. Real. 2017, 10280, 453–465. [Google Scholar] [CrossRef]
- Parnell, G.S.; Bresnick, T.A.; Tani, S.N.; Johnson, E.R. Handbook of Decision Analysis; John Wiley & Sons, Inc.: Hoboken, NJ, USA, 2013. [Google Scholar]
- About Models. Available online: https://www.weather.gov/about/models#:~:text=Today%2C%20the%20NWS%20runs%20an,American%20continent%20(the%20North%20American (accessed on 3 November 2023).
- NWS JetStream—Thunderstorm Hazards: Hail. Available online: www.weather.gov/jetstream/hail#::text=Thunderstorm%20Hazards%20-%20Hail%20%20%20%20Hailstone (accessed on 1 January 2024).
- Tran, M.; Hernandez, B.; Kreinberg, S.; Specking, E.; Parnell, G.S.; Pohl, E. Fort Carson Weather Warning Decision Support System; Technical Report; University of Arkansas: Fayetteville, AR, USA, 2023. [Google Scholar]
- NOAA—National Digital Forecast Database. Available online: https://registry.opendata.aws/noaa-ndfd/ (accessed on 1 January 2024).
- National Digital Forecast Database. Available online: https://www.ncei.noaa.gov/products/weather-climate-models/national-digital-forecast-database (accessed on 1 December 2022).
- Pandas.Dataframe. Available online: https://pandas.pydata.org/docs/reference/api/pandas.DataFrame.html (accessed on 3 November 2023).


| Fort Carson | Colorado Springs | U.S. Air Force Academy | |
|---|---|---|---|
| Hail | 1679 | 1806 | 1944 |
| Thunderstorm Winds | 242 | 261 | 235 |
| Flood | 139 | 158 | 152 |
| Heavy Snow | 41 | 41 | 43 |
| Winter Storm | 35 | 35 | 35 |
| Strong Wind | 14 | 14 | 13 |
| Wildfire | 10 | 10 | 10 |
| Blizzard | 7 | 7 | 7 |
| Winter Weather | 7 | 7 | 7 |
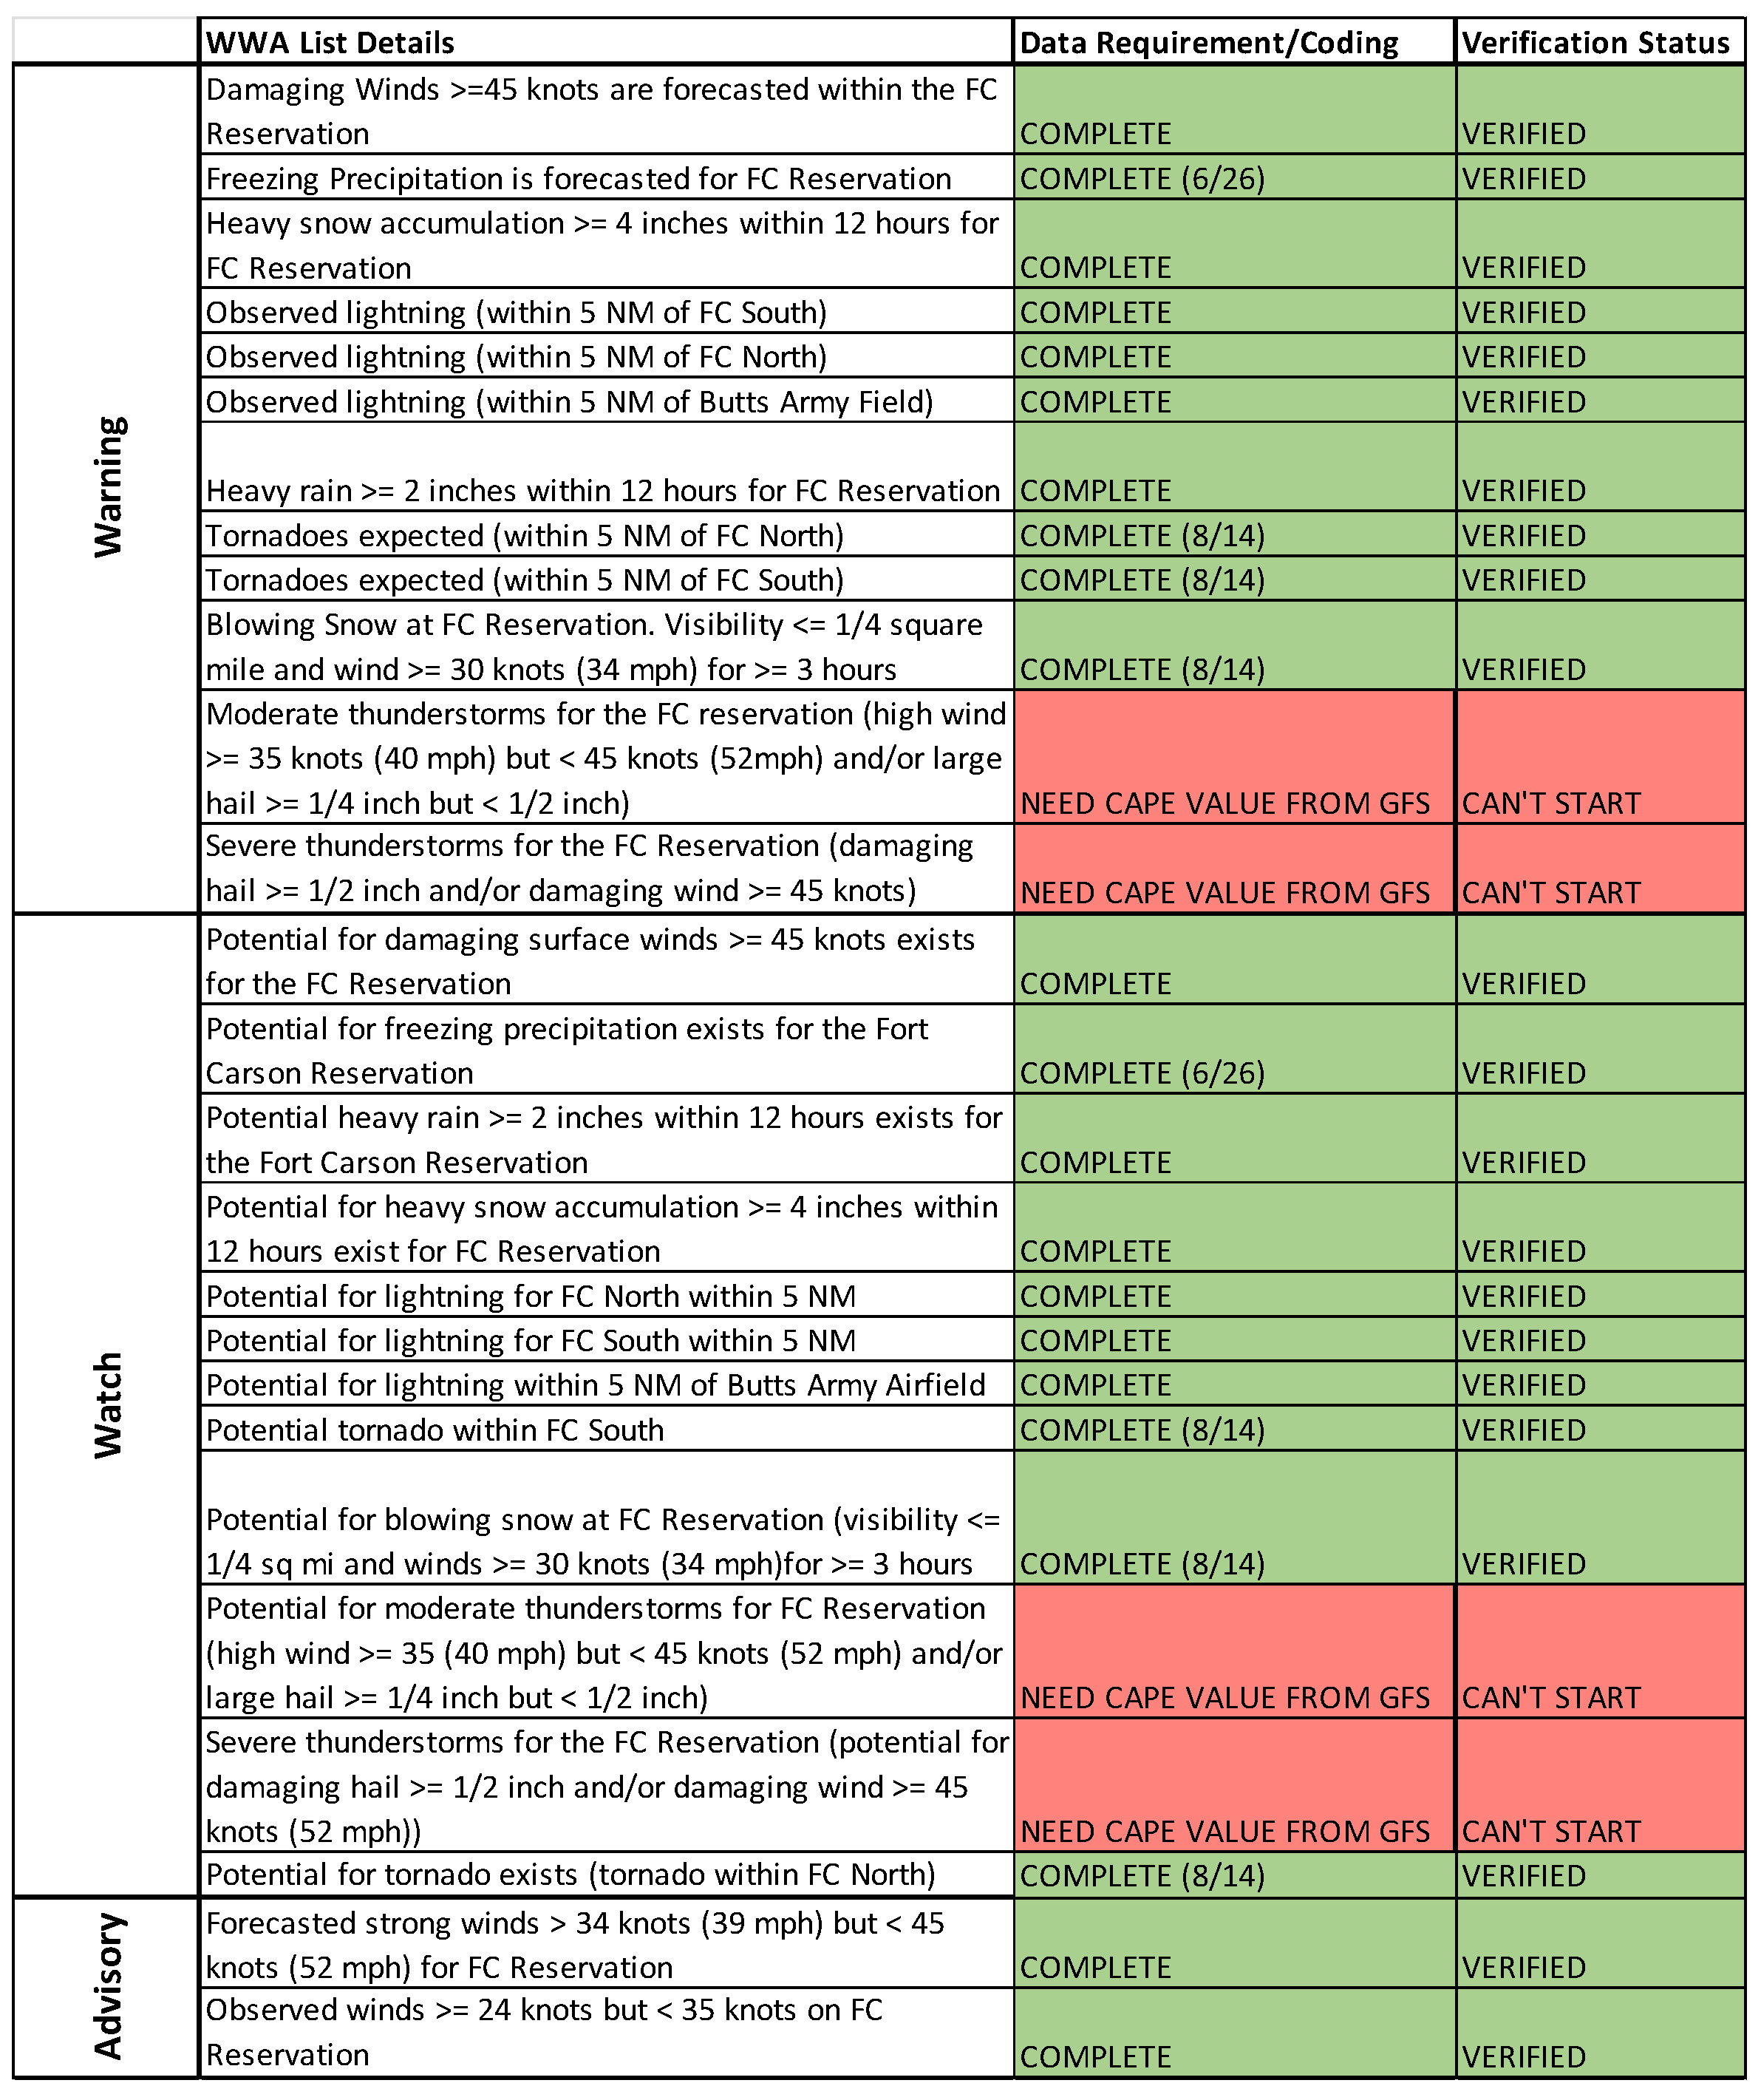
| Severity Level | WWA List Details |
|---|---|
| Warning | Damaging Winds ≥ 45 knots are forecasted within the FC Reservation |
| Freezing Precipitation is forecasted for FC ReservationHeavy snow accumulation ≥ 4 inches within 12 h for FC Reservation | |
| Observed lightning (within 5 NM of FC South) | |
| Observed lightning (within 5 NM of FC North) | |
| Observed lightning (within 5 NM of Butts Army Field) | |
| Heavy rain ≥ 2 inches within 12 h for FC Reservation | |
| Tornadoes expected (within 5 NM of FC North) | |
| Tornadoes expected (within 5 NM of FC South) | |
| Blowing Snow at FC Reservation. Visibility ≤ 1/4 square mile and wind ≥ 30 knots (34 mph) for ≥ 3 h | |
| Moderate thunderstorms for the FC reservation (high wind ≥ 35 knots (40 mph) but <45 knots (52 mph) and/or large hail ≥ 1/4 inch but <1/2 inch) | |
| Severe thunderstorms for the FC Reservation (damaging hail ≥ 1/2 inch and/or damaging wind ≥ 45 knots) | |
| Watch | Potential for damaging surface winds ≥ 45 knots exists for the FC Reservation |
| Potential for freezing precipitation exists for the Fort Carson Reservation | |
| Potential heavy rain ≥ 2 inches within 12 h exists for the Fort Carson Reservation | |
| Potential for heavy snow accumulation ≥ 4 inches within 12 h exist for FC Reservation | |
| Potential for lightning for FC North within 5 NM | |
| Potential for lightning for FC South within 5 NM | |
| Potential for lightning within 5 NM of Butts Army Airfield | |
| Potential tornado within FC South | |
| Potential for blowing snow at FC Reservation (visibility ≤ 1/4 sq mi and winds ≥ 30 knots (34 mph) for ≥3 h | |
| Potential for moderate thunderstorms for FC Reservation (high wind ≥ 35 (40 mph) but <45 knots (52 mph) and/or large hail ≥ 1/4 inch but <1/2 inch) | |
| Severe thunderstorms for the FC Reservation (potential for damaging hail ≥ 1/2 inch and/or damaging wind ≥ 45 knots (52 mph)) | |
| Potential for tornado exists (tornado within FC North) | |
| Advisory | Forecasted strong winds > 34 knots (39 mph) but <45 knots (52 mph) for FC Reservation |
| Observed winds ≥ 24 knots but <35 knots on FC Reservation |
| Region | Weather Stations Providing Data | Weather Stations within Region |
|---|---|---|
| Colorado Springs | 31 | 0 |
| Colorado Springs East/Airport | 53 | 2 |
| Fort Carson | 31 | 1 |
| Fountain | 31 | 0 |
| Monument and North | 53 | 0 |
| Northeast | 53 | 1 |
| Pinion Canyon | 31 | 0 |
| Pueblo | 31 | 1 |
| USAFA | 31 | 1 |
| Woodland Park | 53 | 0 |
| Weather Attribute | Units |
|---|---|
| Temperature | Celsius |
| Probability of X wind speed | Percent |
| Wind speed | Km/h |
| Probability of X wind gust speed | Percent |
| Wind gust speed | Km/h |
| Ice accumulation | Millimeters |
| Quantitative precipitation | Millimeters |
| Probability of precipitation | Percent |
| Snowfall amount | Millimeters |
| Lightning activity level | Scale for lightning activity (1–6) |
| Probability of thunderstorms | Percent |
| Code Number | Label | Documentation |
|---|---|---|
| 0 | None | |
| 2 | Tornado Warning | A Tornado Warning is issued when a tornado is imminent. When a tornado warning is issued, seek safe shelter immediately |
| 24 | Blizzard Warning | A Blizzard Warning means that the following conditions are occurring or expected within the next 12 to 18 h.
|
| 46, 47 | Tornado Watch | A Tornado Watch is issued when severe thunderstorms and tornadoes are possible in and near the watch area. It does not mean that they will occur. It only means they are possible. Severe thunderstorms are defined as follows:
|
| 113 | Blizzard Watch | A Blizzard Watch is issued when conditions are forecasted to last 3 h or longer.
|
| Variable Type | Variable | Description |
|---|---|---|
| Index | g | Grid index = {1, 2, …, 2299} |
| Index | r | Region = {1, 2, …, 10} |
| Index | t | Time in hours |
| Index | c | WWA criteria = {1, 2, …, 22} |
| Constant | G | Total number of grids = 2299 |
| Constant | Nr | number of grids in region r in the Colorado Springs area |
| Constant | Bc | number of grids for the base criteria c |
| Constant | Grid importance score = {1, 2, 3, 4, 5} |
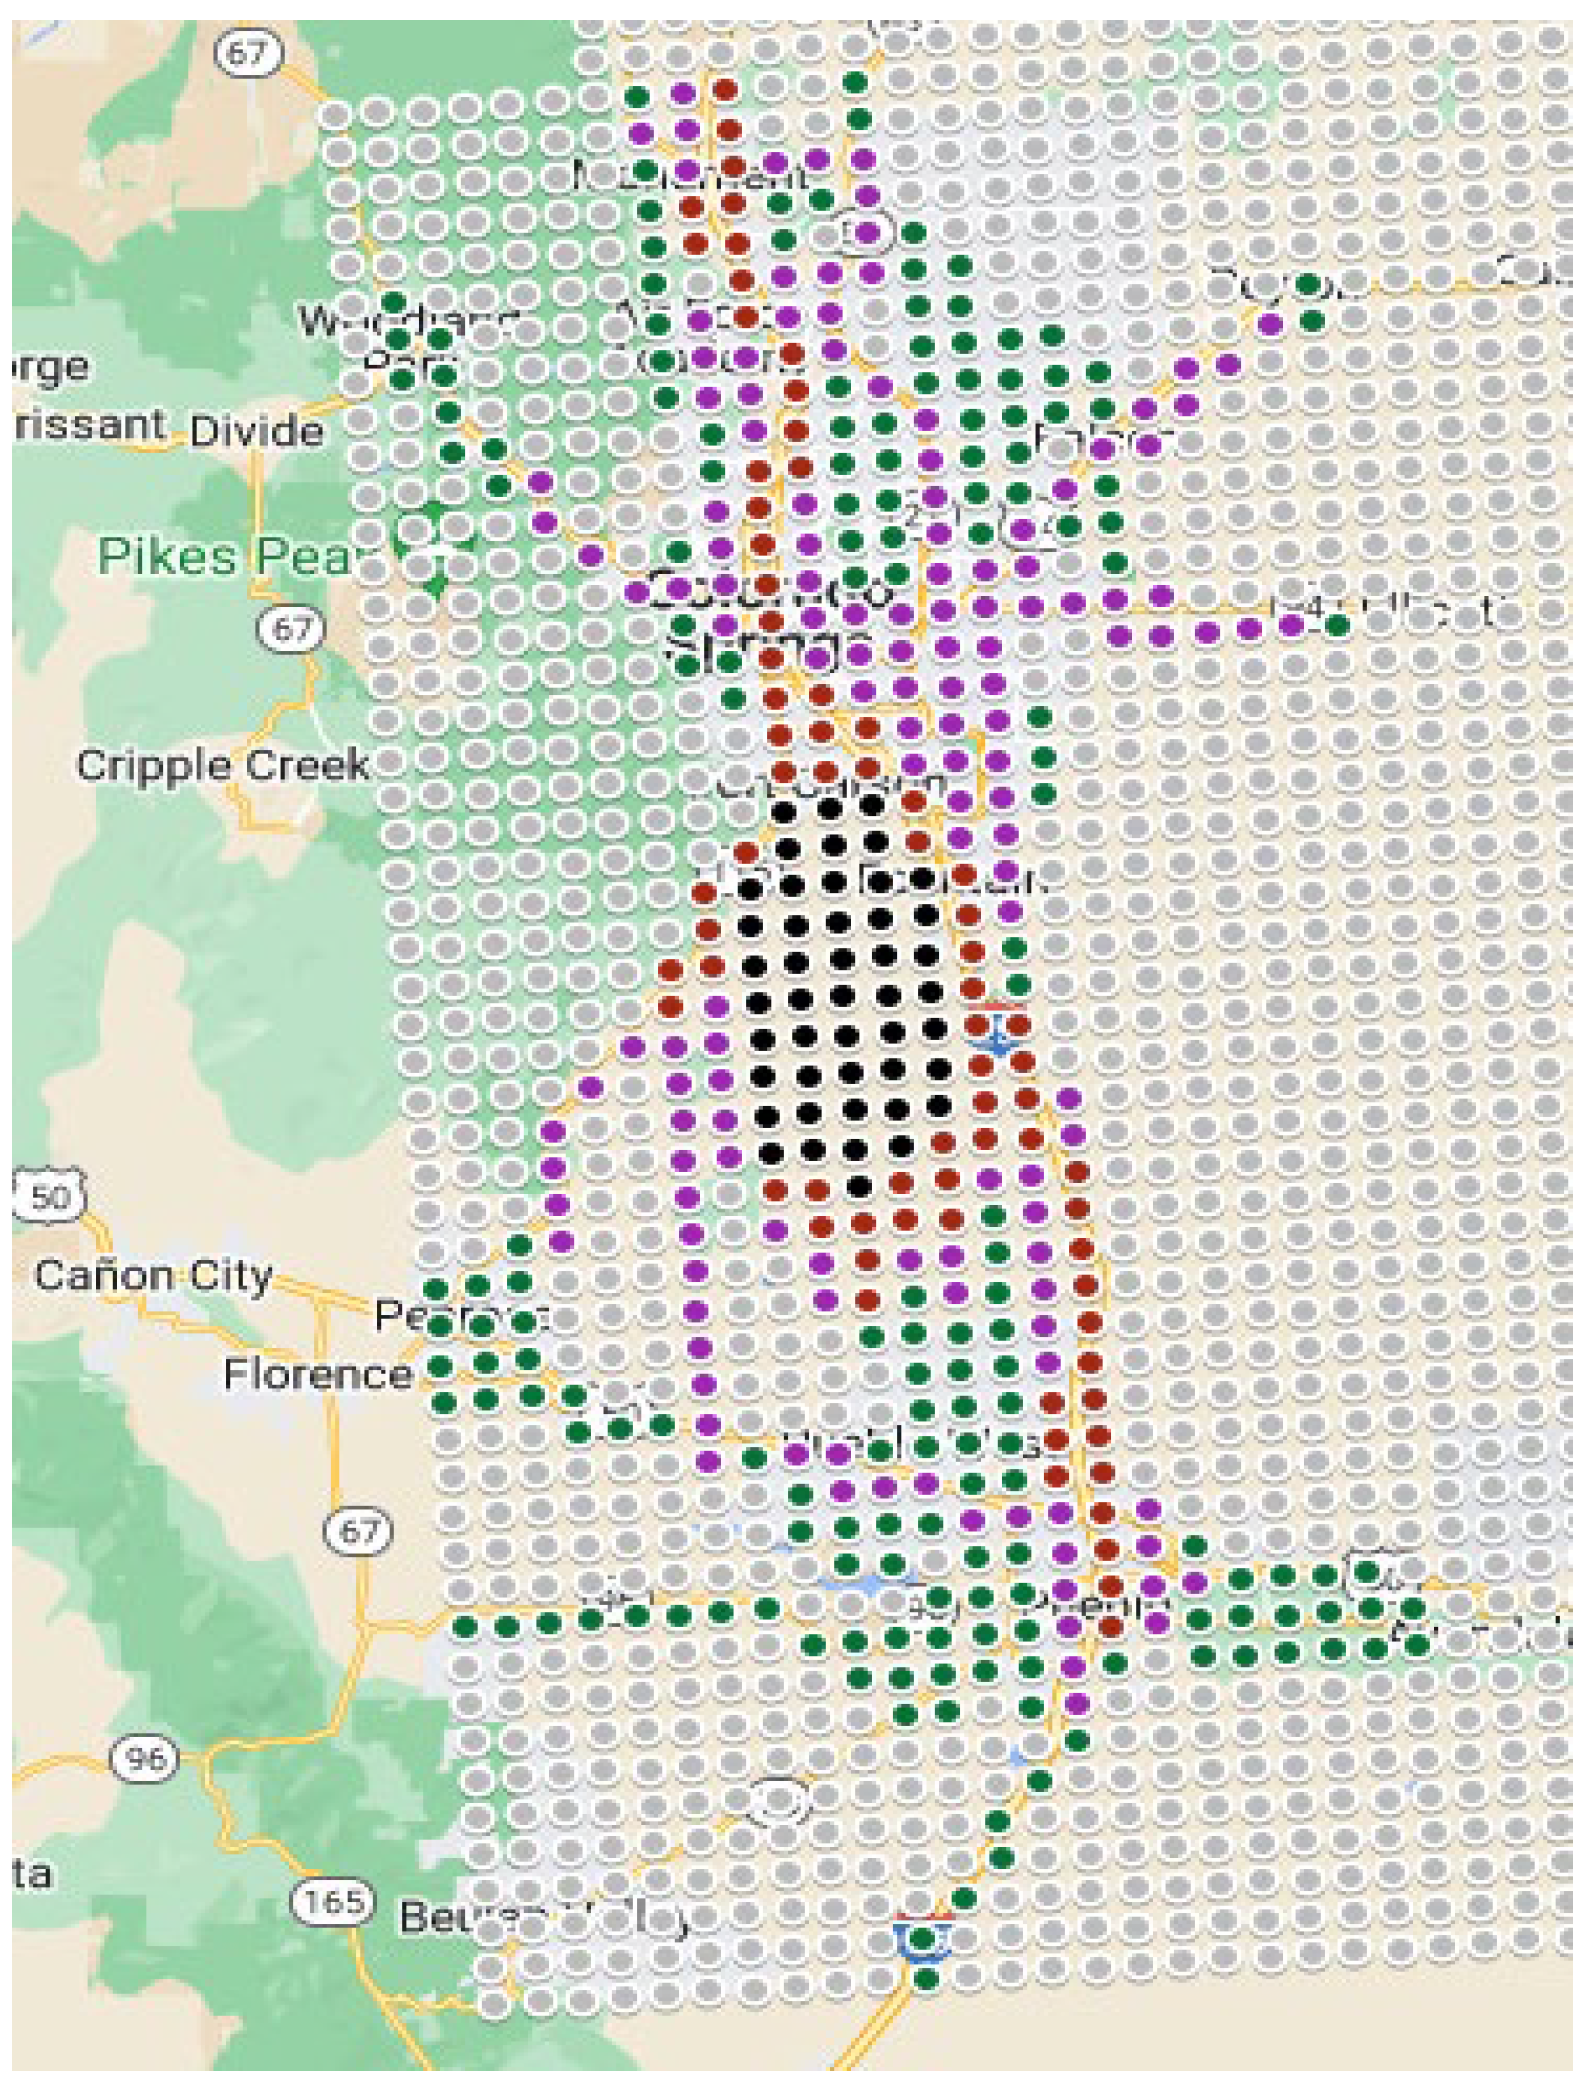
| Score | Description | Color |
|---|---|---|
| Most Critical 5 | geographical grids on the Fort Carson installation | Black |
| 4 | geographical grids on major highways or areas near Fort Carson | Red |
| 3 | geographical grids on highways that feed major highways or areas close to the Fort Carson installation | Purple |
| 2 | geographical grids in residential areas or areas on highways that are not that near to the Fort Carson | Green |
| 1 Least Critical | all other geographical grids | White |
| Color | WWA Severity |
|---|---|
| Black | Warning |
| Red | Watch |
| Amber | Advisory |
| Green | None |
Disclaimer/Publisher’s Note: The statements, opinions and data contained in all publications are solely those of the individual author(s) and contributor(s) and not of MDPI and/or the editor(s). MDPI and/or the editor(s) disclaim responsibility for any injury to people or property resulting from any ideas, methods, instructions or products referred to in the content. |
© 2024 by the authors. Licensee MDPI, Basel, Switzerland. This article is an open access article distributed under the terms and conditions of the Creative Commons Attribution (CC BY) license (https://creativecommons.org/licenses/by/4.0/).
Share and Cite
Tran, M.; Kreinberg, S.; Specking, E.; Parnell, G.S.; Hernandez, B.; Pohl, E.; Gallarno, G.; Richards, J.; Buchanan, R.; Rinaudo, C. Smart Installation Weather Warning Decision Support. Systems 2024, 12, 14. https://doi.org/10.3390/systems12010014
Tran M, Kreinberg S, Specking E, Parnell GS, Hernandez B, Pohl E, Gallarno G, Richards J, Buchanan R, Rinaudo C. Smart Installation Weather Warning Decision Support. Systems. 2024; 12(1):14. https://doi.org/10.3390/systems12010014
Chicago/Turabian StyleTran, Martin, Samuel Kreinberg, Eric Specking, Gregory S. Parnell, Brenda Hernandez, Ed Pohl, George Gallarno, John Richards, Randy Buchanan, and Christina Rinaudo. 2024. "Smart Installation Weather Warning Decision Support" Systems 12, no. 1: 14. https://doi.org/10.3390/systems12010014