Article

Prediction of China Automobile Market Evolution Based on Univariate and Multivariate Perspectives

1
School of Management, Shanghai University, Shanghai 200444, China
2
Department of Digital Management, Shanghai MAHLE Thermal Systems Co., Ltd., Shanghai 201206, China
3
SILC Business School, Shanghai University, Shanghai 201800, China
*
Author to whom correspondence should be addressed.
Systems 2023, 11(8), 431; https://doi.org/10.3390/systems11080431
Submission received: 25 July 2023 / Revised: 10 August 2023 / Accepted: 15 August 2023 / Published: 17 August 2023
(This article belongs to the Special Issue Decision Making and Policy Analysis in Transportation Planning)

Abstract

:
The automobile is an important part of transportation systems. Accurate prediction of sales prospects of different power vehicles can provide an important reference for national scientific decision making, flexible operation of enterprises and rational purchases of consumers. Considering that China has achieved the goal of 20% sales of new energy vehicles ahead of schedule in 2025, in order to accurately judge the competition pattern of new and old kinetic energy vehicles in the future, the automobile market is divided into three types according to power types: traditional fuel vehicles, new energy vehicles and plug-in hybrid vehicles. Based on the monthly sales data of automobiles from March 2016 to March 2023, the prediction effects of multiple models are compared from the perspective of univariate prediction. Secondly, based on the perspective of multivariate prediction, combined with the data of economic, social and technical factors, a multivariate prediction model with high prediction accuracy is selected. On this basis, the sales volume of various power vehicles from April 2023 to December 2025 is predicted. Univariate prediction results show that in 2025, the penetration rates of three types of vehicles will reach 43.8%, 44.4% and 11.8%, respectively, and multivariate prediction results show that the penetration rates will reach 51.0%, 37.9% and 11.1%, respectively.

1. Introduction

1.1. Background and Motivation

China’s automotive industry is in a new stage of energy and technological innovation, and the era of multi-power with traditional fuel vehicles, battery electric vehicles and plug-in hybrid vehicles as the mainstay has begun. According to the data of the China Association of Automobile Manufacturers, in 2022, the operating income of China’s automobile manufacturing industry reached 9289.99 billion CNY, up 6.8% year-on-year, accounting for 6.7% of the total operating income of industrial enterprises above the designated size. According to the statistics of the China Association of Automobile Manufacturers, in the first quarter of 2023, China exported 1.07 million automobiles, surpassing Japan for the first time and becoming the largest automobile exporter in the world. As a pillar industry, the automobile industry plays a key role in accelerating industrialization, promoting manufacturing innovation, stimulating domestic demand, increasing employment and promoting economic growth.
Under the dual pressure of environmental protection and energy shortages, developing new energy vehicles is a common strategic choice for all countries in the world. In 2022, the State Council, China, issued the Twelfth Five-Year National Strategic Emerging Industries Development Plan, which listed the new energy automobile industry as one of the seven strategic emerging industries in China. On 28 March 2023, the agreement of EU member states to ban the sale of new fossil fuel vehicles from 2035 was officially approved. In 2021, US President Biden announced an order that by 2030, the sales of new energy vehicles will account for half of the national car sales.
In 2022, Xu Changming, deputy director of the National Information Center, said that traditional fuel vehicles and new energy vehicles have their own advantages, and both have certain development space in the foreseeable future. In 2023, at the monthly meeting of the National Passenger Car Market Information Association, Cui Dongshu, Secretary-General of the Association, said that the development of new energy and the development of fuel vehicles are not simply antagonistic. While rationally arranging the new energy automobile industry, it is necessary to avoid the sudden drop in demand for traditional automobile products and ensure the steady transformation, upgrading and sustainable development of the industry.
The competition pattern of the automobile industry is influenced by many factors [1,2], such as the economic environment, technological progress, consumer demand, environmental laws and regulations, etc. The market demand and competition pattern of various power vehicles in the future are still uncertain. Under the condition of limited data, it is of great significance for the production planning of automobile enterprises and the scientific decision making of the government to effectively capture the historical sales laws of various types of automobiles in the automobile sales system, analyze the dynamic relationship among various influencing factors and various types of automobile sales, and then accurately predict the sales trend of various power types of automobiles.

1.2. Literature Review

1.2.1. Influencing Factors of Vehicle Sales

The sales of traditional cars and new energy vehicles are affected by many factors. Government policy is an important factor affecting the development of the automobile industry, which plays a key role in stabilizing consumption and releasing demand. In all stages of the development of new energy vehicles, government support has played an important role in its large-scale promotion [3]. Socioeconomically, the employment rate of residents and the level of the consumer price are usually considered as important factors affecting automobile sales. In addition, price is also one of the most widely studied socioeconomic factors affecting automobile sales, and most consumers are sensitive to price [4]. Subsidies can reduce the price of new energy vehicles, thus increasing consumers’ willingness to buy [5]. In terms of technology, the progress and innovation of automobile technology are directly related to the use cost, cruising range, energy consumption and other issues of automobiles, and are the key factors affecting the promotion and popularization of automobiles [6]. There is a positive correlation between technological innovation and the adoption of electric vehicles [7]. Supporting infrastructure is directly related to whether consumers can enjoy convenient services after buying a car, so it is considered to have an impact on automobile promotion and sales. Studies have shown that perfect charging facilities for new energy vehicles will help to enhance consumers’ willingness to buy [8]. However, Lin and Wu [3] think that in the case of short-distance travel, consumers mostly choose home charging, and the coverage of charging infrastructure has limited influence on the purchase intention. Some studies focus on the influence of consumer psychological factors on the sales of new energy vehicles. Yang, et al. [9] and other research shows that the comfort, handling, space and cost performance of electric vehicles have a significant impact on the sales of electric vehicles. Wang, et al. [10] and other studies show that perceived risk and environmental awareness have a significant impact on the acceptance of electric vehicles. Some studies think that the energy price is one of the driving forces of automobile promotion and sales [11,12]. For example, increase in the gasoline price is beneficial to the promotion of electric vehicles [13], but some studies show that the energy price has little influence on the promotion of electric vehicles [14].

1.2.2. Prediction Models of Vehicle Sales Volume

Statistical models are widely used in automobile sales forecasting. Li, et al. [15], based on the improved Bass model and grey theory, constructed the demand forecasting model of new energy vehicles, and its effectiveness is verified by using three data sets from Norway, France and Europe. Hsieh, et al. [16] developed a Monte Carlo model based on historical data. Kumar, et al. [17] used Gompertz, Logistic, Bass and Generalized Bass models to simulate the future demand for electric vehicles, and determined the best-fitting model for 20 major countries.
However, some studies believe that the traditional statistical model cannot effectively extract the nonlinear characteristics of automobile sales data [18]. Therefore, some scholars improved the traditional forecasting method. Zhou, et al. [19] put forward a new time-varying grey Bernoulli model, which better captured the nonlinear, complex and time-varying characteristics related to electric vehicle sales. Pei and Li [20] established a nonlinear grey Bernoulli model based on data grouping, and pointed out that in 2020, the sales of new energy vehicles will exceed 2 million. Liu, et al. [1] point out that by 2025, the sales of new energy vehicles in China will reach 8.84 million. Li, et al. [21], after improving the parameters of Bass model and LV model, showed it has a better forecasting effect on the sales of battery electric vehicles in China, and the Bass model is more accurate.
Some scholars also apply artificial intelligence algorithms to the problem of automobile sales forecasts. Zhang, et al. [22], using the LSTM algorithm, established a smart car sales forecasting model based on the KOL network public opinion and network search index, which improves the forecasting accuracy of smart car sales. Liu, et al. [23] proposed a multi-factor sales forecasting model combining discrete wavelet transform and BiLSTM, and obtained the MAE value, Maple value and RMSE value of the optimal DWT-BiLSTM model of 0.811, 5.671 and 1.001, respectively. Xia, et al. [24] used the XGBoost prediction algorithm for automobile sales prediction and achieved high prediction accuracy in a short runtime. Wu and Chen [25] combined a principal component analysis and neural network to predict the sales volume and growth rate of electric vehicles, and pointed out that the sales volume of electric vehicles in the world and China will continue to increase in the next 50 years, but the growth rate will continue to decline. With the development of machine learning technology, sentiment analysis technology has also been applied to the problem of automobile sales forecasts. Liu, et al. [26] proposed a combined forecasting model based on multi-angle feature extraction and sentiment analysis, which improved the forecasting accuracy of automobile sales. Ding, et al. [27] uses an online comment-driven combination forecasting model to improve the forecasting accuracy of new energy vehicle sales.
In addition to the innovation of methods, some studies focus on the competition and substitution between traditional fuel vehicles and new energy vehicles. Sun and Wang [28] predicted the market evolution of new energy vehicles and new energy vehicles in China based on the Lotka–Volterra model and system dynamics (SD) model. Guo, et al. [29] divided the passenger car market into four types—gasoline passenger car, natural gas passenger car, blade electric passenger car and plug-in hybrid passenger car—and predicted the evolution trend of the passenger car market based on the Lotka–Volterra model and historical data of automobile sales.
There is a lot of literature on the diffusion trend of automobile sales; however, few publications study the dynamic change trend of automobile sales with competition based on the perspective of prediction. On the basis of related research, this paper analyzes the diffusion of different power types of vehicles in 2025 from the perspectives of univariate prediction and multivariate prediction.

1.3. Contribution and Organization

The innovation and contribution of this paper are mainly reflected in two aspects. Firstly, the automobile industry is divided into three types, according to the power type: traditional fuel vehicles (ICEs), battery electric vehicles (BEVs) and plug-in hybrid vehicles (PHEVs). Based on the monthly sales data, from the perspective of univariate and multivariable, the prediction effects of various statistical models and machine learning models for automobile sales are compared, and high prediction accuracy is obtained. Secondly, in the multivariable forecasting part, the VAR model and BP neural network model are innovatively combined to analyze the lag effect of 17 influencing factors from economic, social and technical aspects on automobile sales, and a multivariable BP neural network forecasting model with lag characteristics is developed.

2. Materials and Methods

Figure 1 shows the framework of this study.
The vehicle is one of the basic components of transportation systems, and the reform of the automobile industry will profoundly affect the reconstruction of transportation systems. Considering that the monthly sales of traditional fuel vehicles and new energy vehicles have certain cyclical and seasonal characteristics, firstly, the automobile industry is divided into traditional fuel vehicles, battery electric vehicles and plug-in hybrid vehicles, according to power types. Secondly, based on the historical sales data of different power types from March 2016 to March 2023, the capturing effects of three univariate forecasting models, namely, the BP neural network (BPNN) model, quadratic exponential smoothing (QES) model and Prophet model, on the trends and laws of sales changes are compared. The univariate forecast results of automobile sales of three power types in 2025 are obtained by selecting the model with better overall performance. In addition, the multivariate prediction model can effectively identify the dynamic coupling relationship between the target variables and related influencing factors. Therefore, the influencing factors of automobile sales are selected from the aspects of economy, society and technology, and based on the automobile sales data and influencing factor data from March 2016 to March 2023, a vector autoregressive (VAR) model is established; the lagging order of influencing factors is analyzed; the input samples of the multivariate prediction model are constructed; and the prediction effects of the VAR model, support vector regression model (SVM) model and BP neural network model are compared.

2.1. Variable Selection and Data Description

Electric energy is one of the main power sources of new energy vehicles. The automobile market is divided into three categories: traditional fuel vehicles, battery electric vehicles and plug-in hybrid vehicles. Through the analysis of the influencing factors of automobile sales in Section 1.2.1, and considering the availability of data, 17 influencing factors of traditional fuel vehicles, battery electric vehicles and plug-in hybrid vehicles are selected from the aspects of economy, society and technology, as shown in Table 1.
The statistical data cover the period from March 2016 to March 2023, with a total of 85 groups of data. The historical sales data of three types of cars are shown in Figure 1. Among them, automobile sales data come from the official website of the China Association of Automobile Manufactures, average automobile price data come from the car home website, patent data come from the China National Intellectual Property Administration website, customs import and export data come from the Oriental Fortune Network, and other data come from the National Bureau of Statistics and the China Statistical Yearbook. Some missing data are filled in by linear interpolation.
Car companies and governments pay more attention to the monthly data of car sales, while the annual data can better reflect the general development trend of different power types of cars. As can be seen from Figure 2, from 2011 to 2022, according to the growth of the penetration rate of new energy vehicles, the development of new energy vehicles in China can be roughly divided into three stages: (1) Before 2014: the initial stage; (2) From 2014 to 2020: the stage of rapid development; (3) From 2022 to present: the stage of transformation and upgrading. The red dotted line represents the dividing line of these three stages, which is used to distinguish them more clearly. The overall sales of traditional fuel vehicles are showing an obvious downward trend, while the overall sales of battery electric vehicles and plug-in hybrid vehicles are showing an upward trend.

2.2. Methodology

2.2.1. Quadratic Exponential Smoothing Model

The exponential smoothing model is one of the classic statistical models in time series prediction [30], among which quadratic exponential smoothing model is suitable for the prediction of time series with a linear trend [31]. The formula of the quadratic exponential smoothing model is as follows:
S t 1 = α Y t + 1 α S t 1 1
S t 2 = α S t 1 + 1 α S t 1 2
where S t 1 and S t 2 represent the first exponential smoothing value and the second exponential smoothing value in the t period, respectively; and α ( 0 < α < 1 ) is the smoothing coefficient.
F t + T = a t + b t T
a t = 2 S t 1 S t 2
b t = α 1 α ( S t 1 S t 2 )
According to Formula (5), the sales of traditional fuel vehicles, battery electric vehicles and plug-in hybrid vehicles from April 2023 to March 2024 are predicted respectively, where F t + T represents the predicted value of the t + T period, and T represents the number of predicted periods. a t and b t are the model coefficients of the t period.

2.2.2. Prophet Model

The Prophet model is a time series forecasting model put forward by FackBook Company in 2017, which can effectively fit the trend and seasonal characteristics of the series, and can also deal with holiday factors [32]. The expression is shown in formula (6):
y t = g t + s t + h t + t
where g t represents the trend term for modeling the non-periodic change of sales of traditional fuel vehicles, battery electric vehicles and plug-in hybrid vehicles; s t represents the seasonal term for modeling the periodic change of time series; h t represents holidays; and t represents the error term.
There are two types of trend term g t : nonlinear saturated growth model and piecewise linear model. Because the automobile sales data did not show an obvious saturated growth trend, the piecewise linear model was chosen. The expression is as follows:
g t = k + a t T δ t + b + a t T γ
where k represents the growth rate, b represents the offset, a ( t ) represents the indicator function, and γ represents the offset of smoothing.
The Prophet model uses Fourier series to simulate the periodic change of time series, which is expressed as follows:
s t = n = 1 N ( a n cos 2 π n t T + b n sin 2 π n t T )
where N represents the total number of cycles, T represents cycles, and a n and b n are parameters to be estimated.
The expression of holiday item is as follows:
h t = Z t γ i ,   γ ~ N o r m a l ( 0 , v 2 )
where i represents various holidays, Z t = 1 ( t D 1 ) , , 1 ( t D L ) represents the indicator function, D 1 represents holiday collection, and γ i is the parameter of each holiday.

2.2.3. Vector Autoregressive Model

The vector autoregressive model (VAR) was originally proposed by Christopher Sims to study the dynamic relationship between variables [33,34]. The VAR model regards all variables as endogenous variables, which reduces the uncertainty in the simultaneous equations model caused by subjective judgment errors. The VAR model is used to determine the optimal lag order of the influencing factors of automobile sales, which is used as the basis for constructing the multivariate prediction model.
The form of the VAR (p) model is shown in Formula (10):
Y t = A 0 + A 1 Y t 1 + A 2 Y t 2 + + A n Y t p + μ t
where Y t = y 1 t y 2 t y n t , A 0 = a 10 a 20 a n 0 , e t = e 1 t e 2 t e n t , A i = a 11 , i a 12 , i a 1 n , i a 21 , i a 22 , i a 2 n , i a n 1 , i a n 2 , i a n n , i , Y t is the n-dimensional vector of endogenous variables, p is the lag order, A 0 and A i are the matrices of coefficients to be estimated, and μ t is the n-dimensional random perturbation term.

2.2.4. Support Vector Regression Model

The support vector regression model (SVM) is a classic machine learning model, and the support vector regression (SVR) is an important branch of SVM [35,36]. The expression of the SVM model is as follows:
y = ω φ x + b
where ω is the weight vector, and b is the deviation.
According to the principle of structural risk minimization, SVM is transformed into the following optimization problem:
m i n 1 2 ω 2 + C i = 1 N ( δ i + δ i * )
y i ω φ x b ε + δ i ω φ x + b y i ε + δ i * δ i 0 δ i * 0 ,   i = 1,2 , , N
where δ i and δ i * are relaxation variables, c C is a penalty factor, and ε is a loss function.

2.2.5. BP Neural Network Model

The BP neural network, put forward by scholars such as Rinehart and MeClelland, is the most widely used artificial neural network [37], which has the characteristics of self-learning adaptation, parallel processing, strong learning ability and generalization [38], and generally consists of an input layer, hidden layer and output layer. Studies have shown that a three-layer BP neural network prediction model can approximate any nonlinear function [39,40]. Based on the Keras deep learning framework, this study constructs the univariate prediction model and multivariate prediction model of the BP neural network.
The general process of BP neural network prediction is as follows:
Step 1: Normalize the original data sequence, and input the normalized training samples into the network.
x i = x i x m i n x m a x x m i n
Step 2: Initialize the network parameters. Set the number of neurons in each layer of the network, set the maximum number of iterations and learning rate, randomly assign initial values to the weights and deviations of the network, and determine the activation function.
Step 3: Calculate the input and output values of each layer, and compare the output value with the target value to determine the error.
Step 4: Based on the error, correct the weights and thresholds.
Step 5: Repeat the process from steps (3) and (4) until the model error drops to the preset value or the training times reach the preset value. After the training, the trained BP neural network can be used for data prediction.

2.3. Model Evaluation Index

The mean absolute percentage error (MAPE) and root-mean-square error (RMSE) are selected as evaluation indexes to compare the accuracy of the above models for automobile sales forecasting. The lower the index value, the better the forecasting effect of the model is proved.
M A P E = 1 n i = 1 n y i ^ y i y i
R M S E = 1 n i = 1 n ( y i ^ y i ) 2

3. Results

3.1. Comparison of Univariate Prediction Models

The multivariate forecasting model can comprehensively consider the influence of various factors on automobile sales, but it cannot fully extract the trend information contained in the monthly automobile sales data. In some cases, the effect of univariate forecasting may be better than multivariate forecasting [41]. Therefore, based on the historical sales data of traditional fuel vehicles, battery electric vehicles and plug-in hybrid vehicles, univariate forecasting models are established individually. In order to remain consistent with the dimensions of subsequent multivariate prediction, the data series are processed by logarithm, and fitting and prediction are based on logarithm.
Taking the first 85% of data from March 2016 to February 2022 as the training set, and the remaining 15% of data from March 2022 to March 2023 as the test set, this paper compares the accuracy of the selected univariate forecasting model for the sales forecast of three power types. The univariate BP neural network model and Prophet model are realized using Python3.9 programming, and the quadratic exponential smoothing model is realized using Matlab2017b programming.

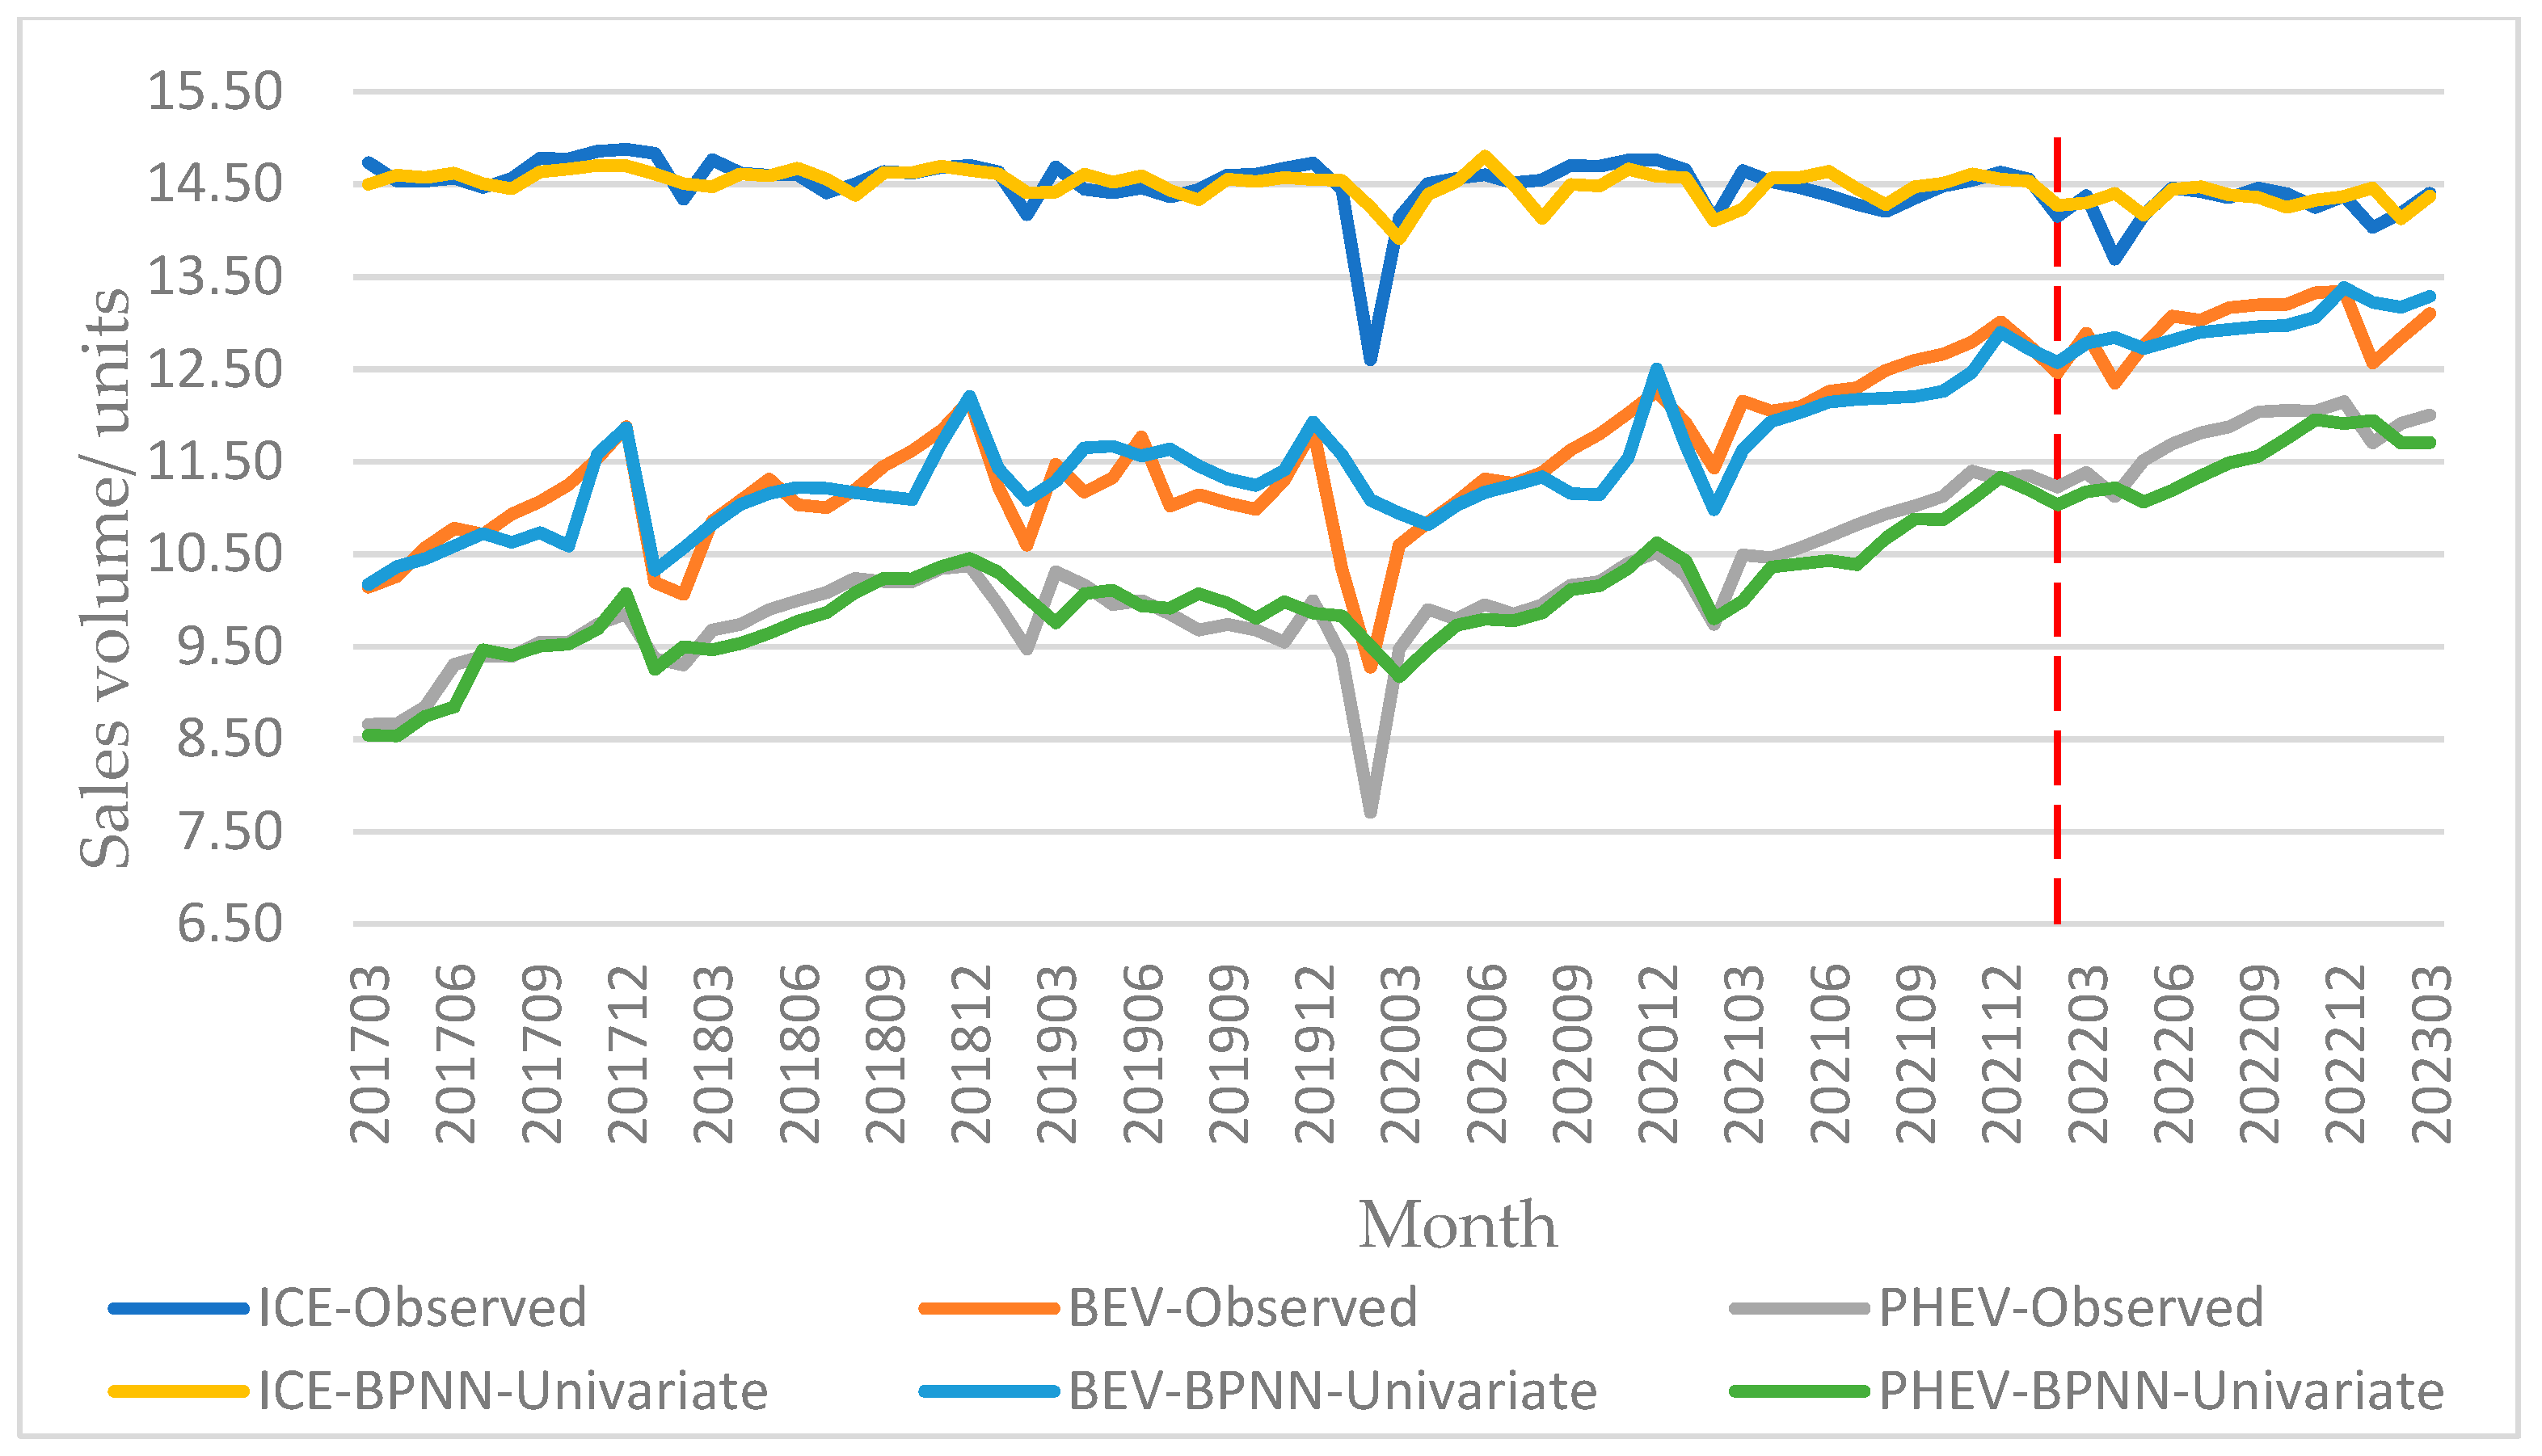
3.1.1. Prediction Results of Univariate BP Neural Network

Considering that the monthly sales data of automobiles is periodic with a step size of 12, a sliding window with a length of 12 is set; so, the input variable of the univariate BP neural network model is a 12-dimensional vector.
Taking 12 as a step, based on the historical sales data of traditional fuel vehicles, battery electric vehicles and plug-in hybrid vehicles from March 2016 to March 2023, 60 sets of training data from March 2017 to February 2022 and 13 sets of test data from March 2022 to March 2023 were constructed.
Based on the Keras deep learning framework, the univariate BP neural network models of traditional fuel vehicle sales, battery electric vehicle sales and plug-in hybrid vehicle sales are constructed individually, and the parameter settings are shown in Table 2.
In total, 60 groups of pre-constructed training data of three types of power vehicles are individually input into the univariate BP neural network model, and they are trained according to the steps in Section 2.2.5, and the trained univariate BP neural network model and the fitting value of automobile sales from March 2017 to February 2022 are obtained. A total of 13 groups of data used for testing are input into the univariate BP neural network model based on the training set data, and the forecast value of automobile sales from March 2022 to March 2023 is obtained.
Comparing the fitted and predicted values with the actual values in the corresponding periods, the fitting and predicted results of the univariate BP neural network model for traditional fuel vehicles, battery electric vehicles and plug-in hybrid vehicles are shown in Figure 3.

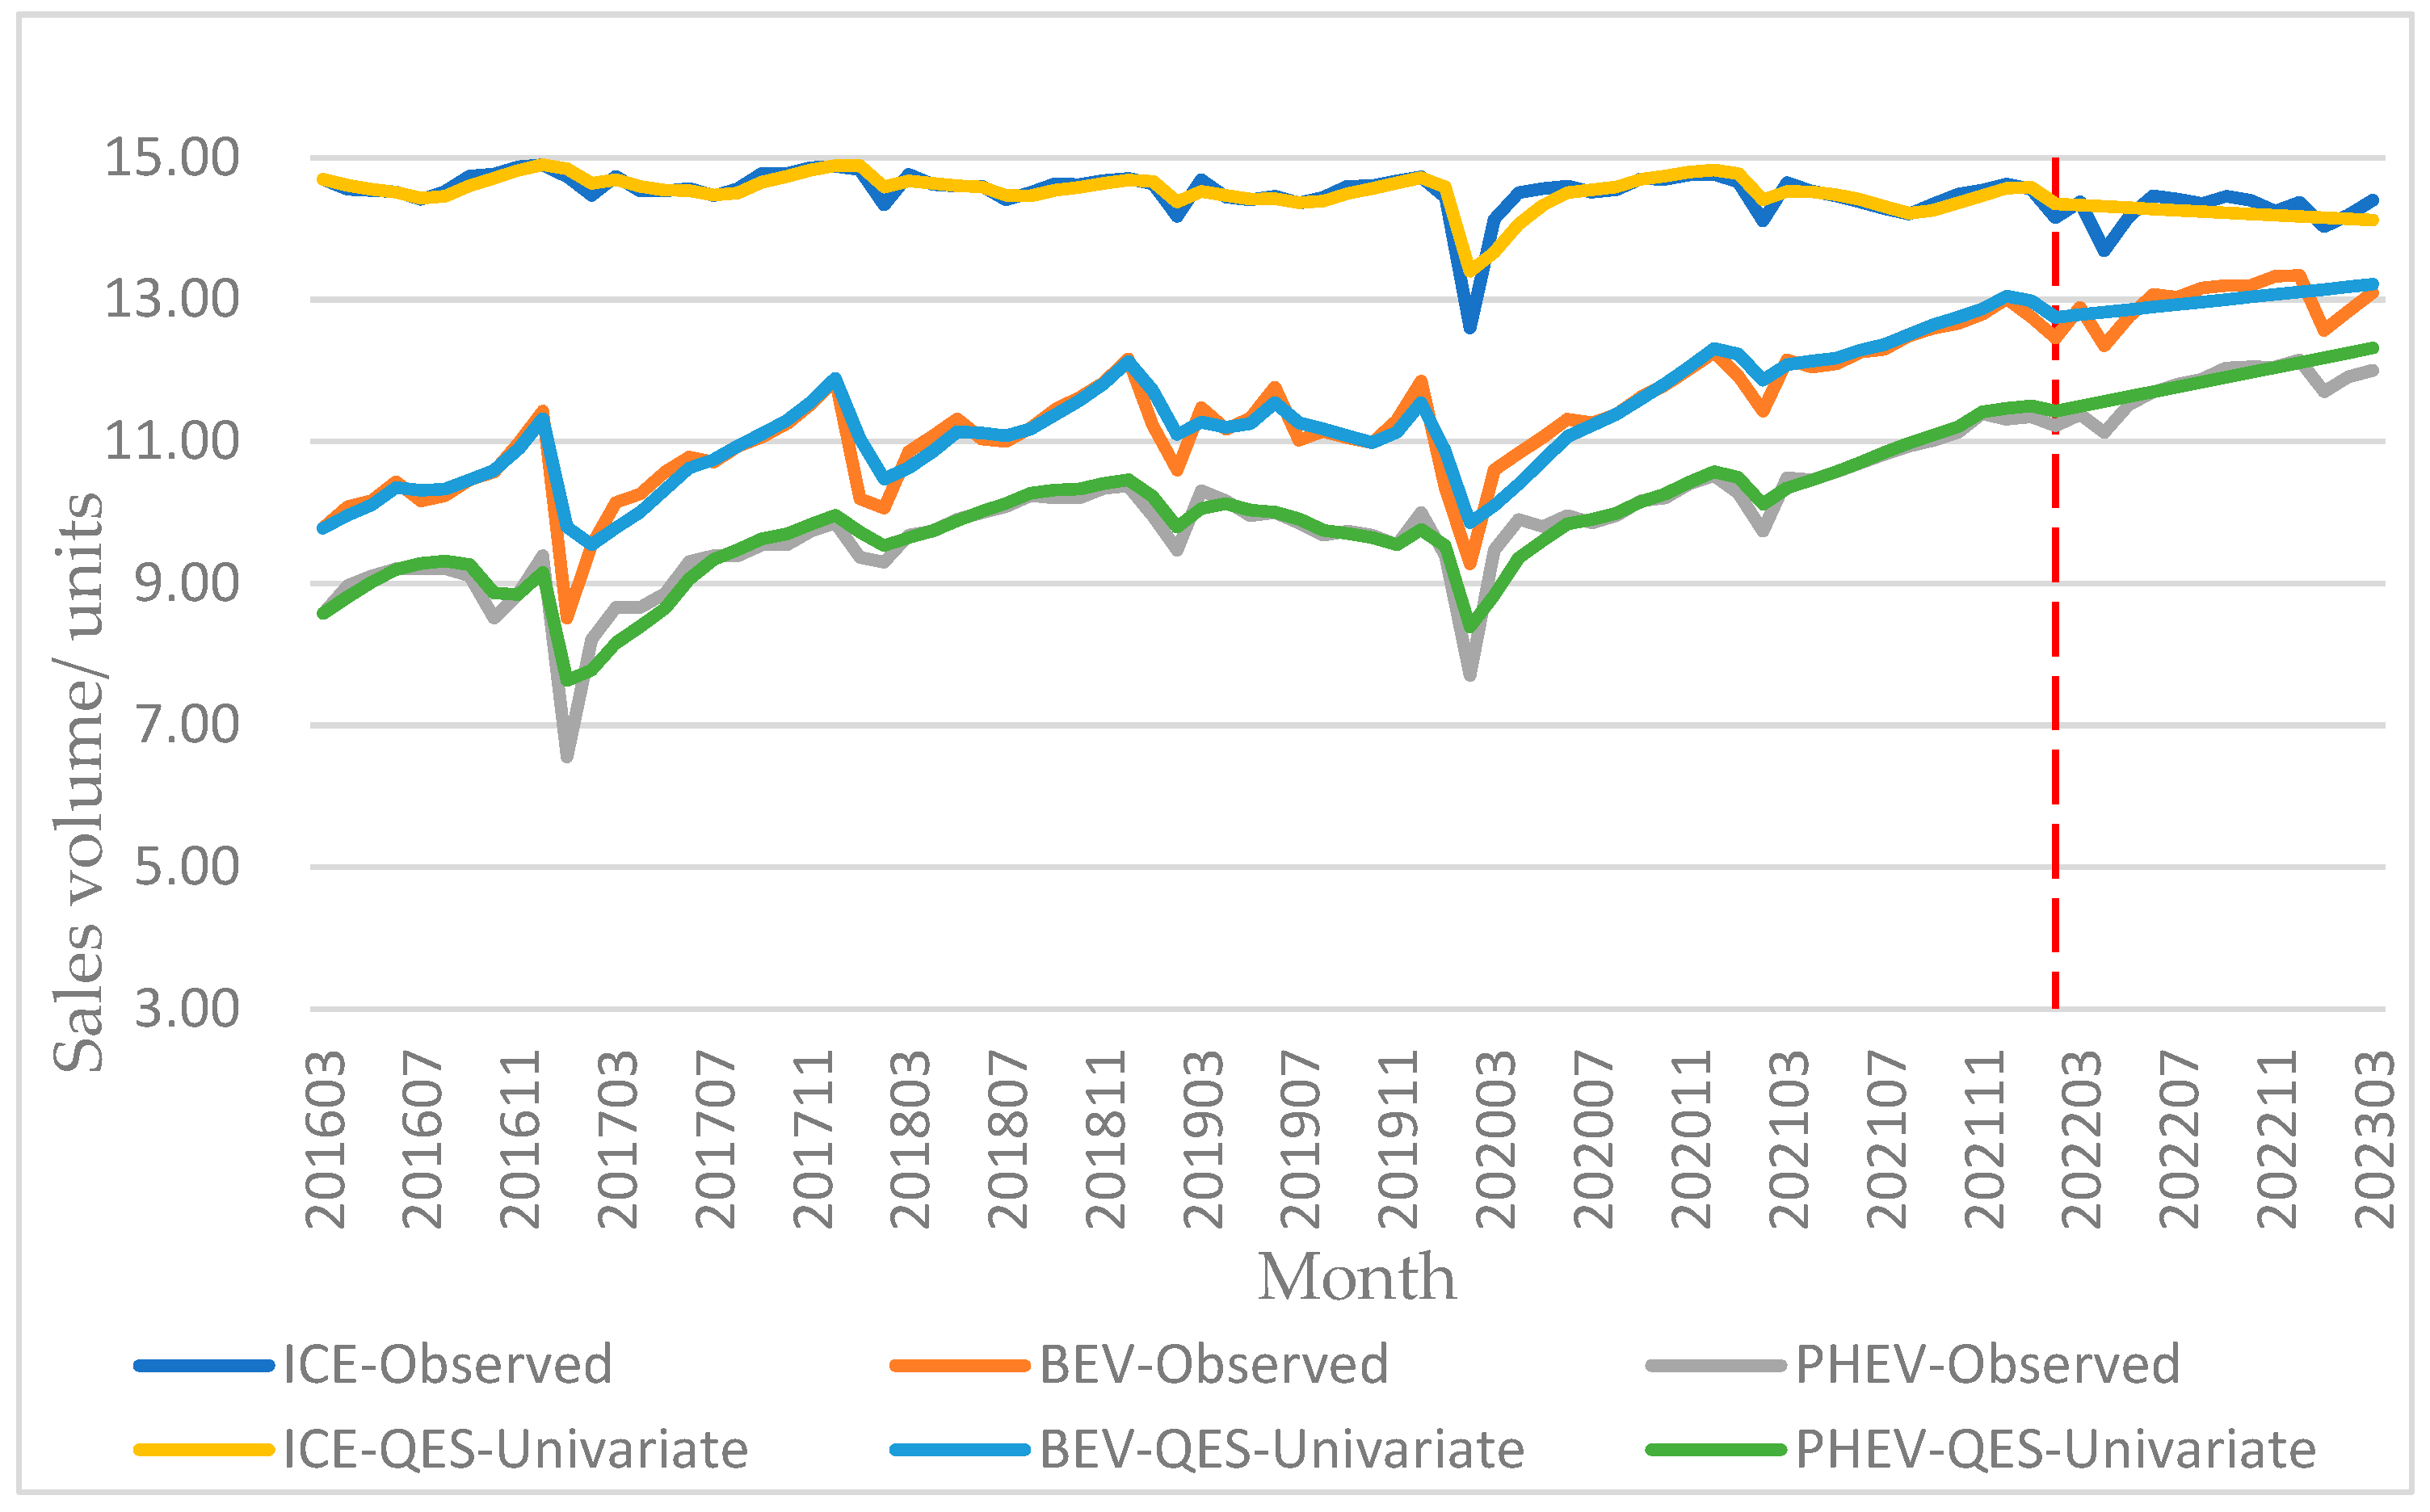
3.1.2. Prediction Results of Quadratic Exponential Smoothing

The input variable of the quadratic exponential smoothing model is a one-dimensional vector, that is, the historical sales data of the automobile. Based on the historical sales data of traditional fuel vehicles, battery electric vehicles and plug-in hybrid vehicles from March 2016 to February 2022, the quadratic exponential smoothing models of three types of power vehicles are constructed according to Formulas (1)–(5), and the quadratic exponential smoothing fitting values of the sales of three types of power vehicles from March 2016 to February 2022 are calculated. Based on the constructed quadratic exponential smoothing model and Formula (3), the predicted sales values of three types of power vehicles from March 2022 to March 2023 are calculated individually.
After many attempts, the quadratic exponential smoothing model has the best effect when the smoothing coefficient α is 0.3. Comparing the fitted and predicted values with the actual values in the corresponding periods, the fitting and predicted results of the quadratic exponential smoothing model for three types of power vehicles are shown in Figure 4.

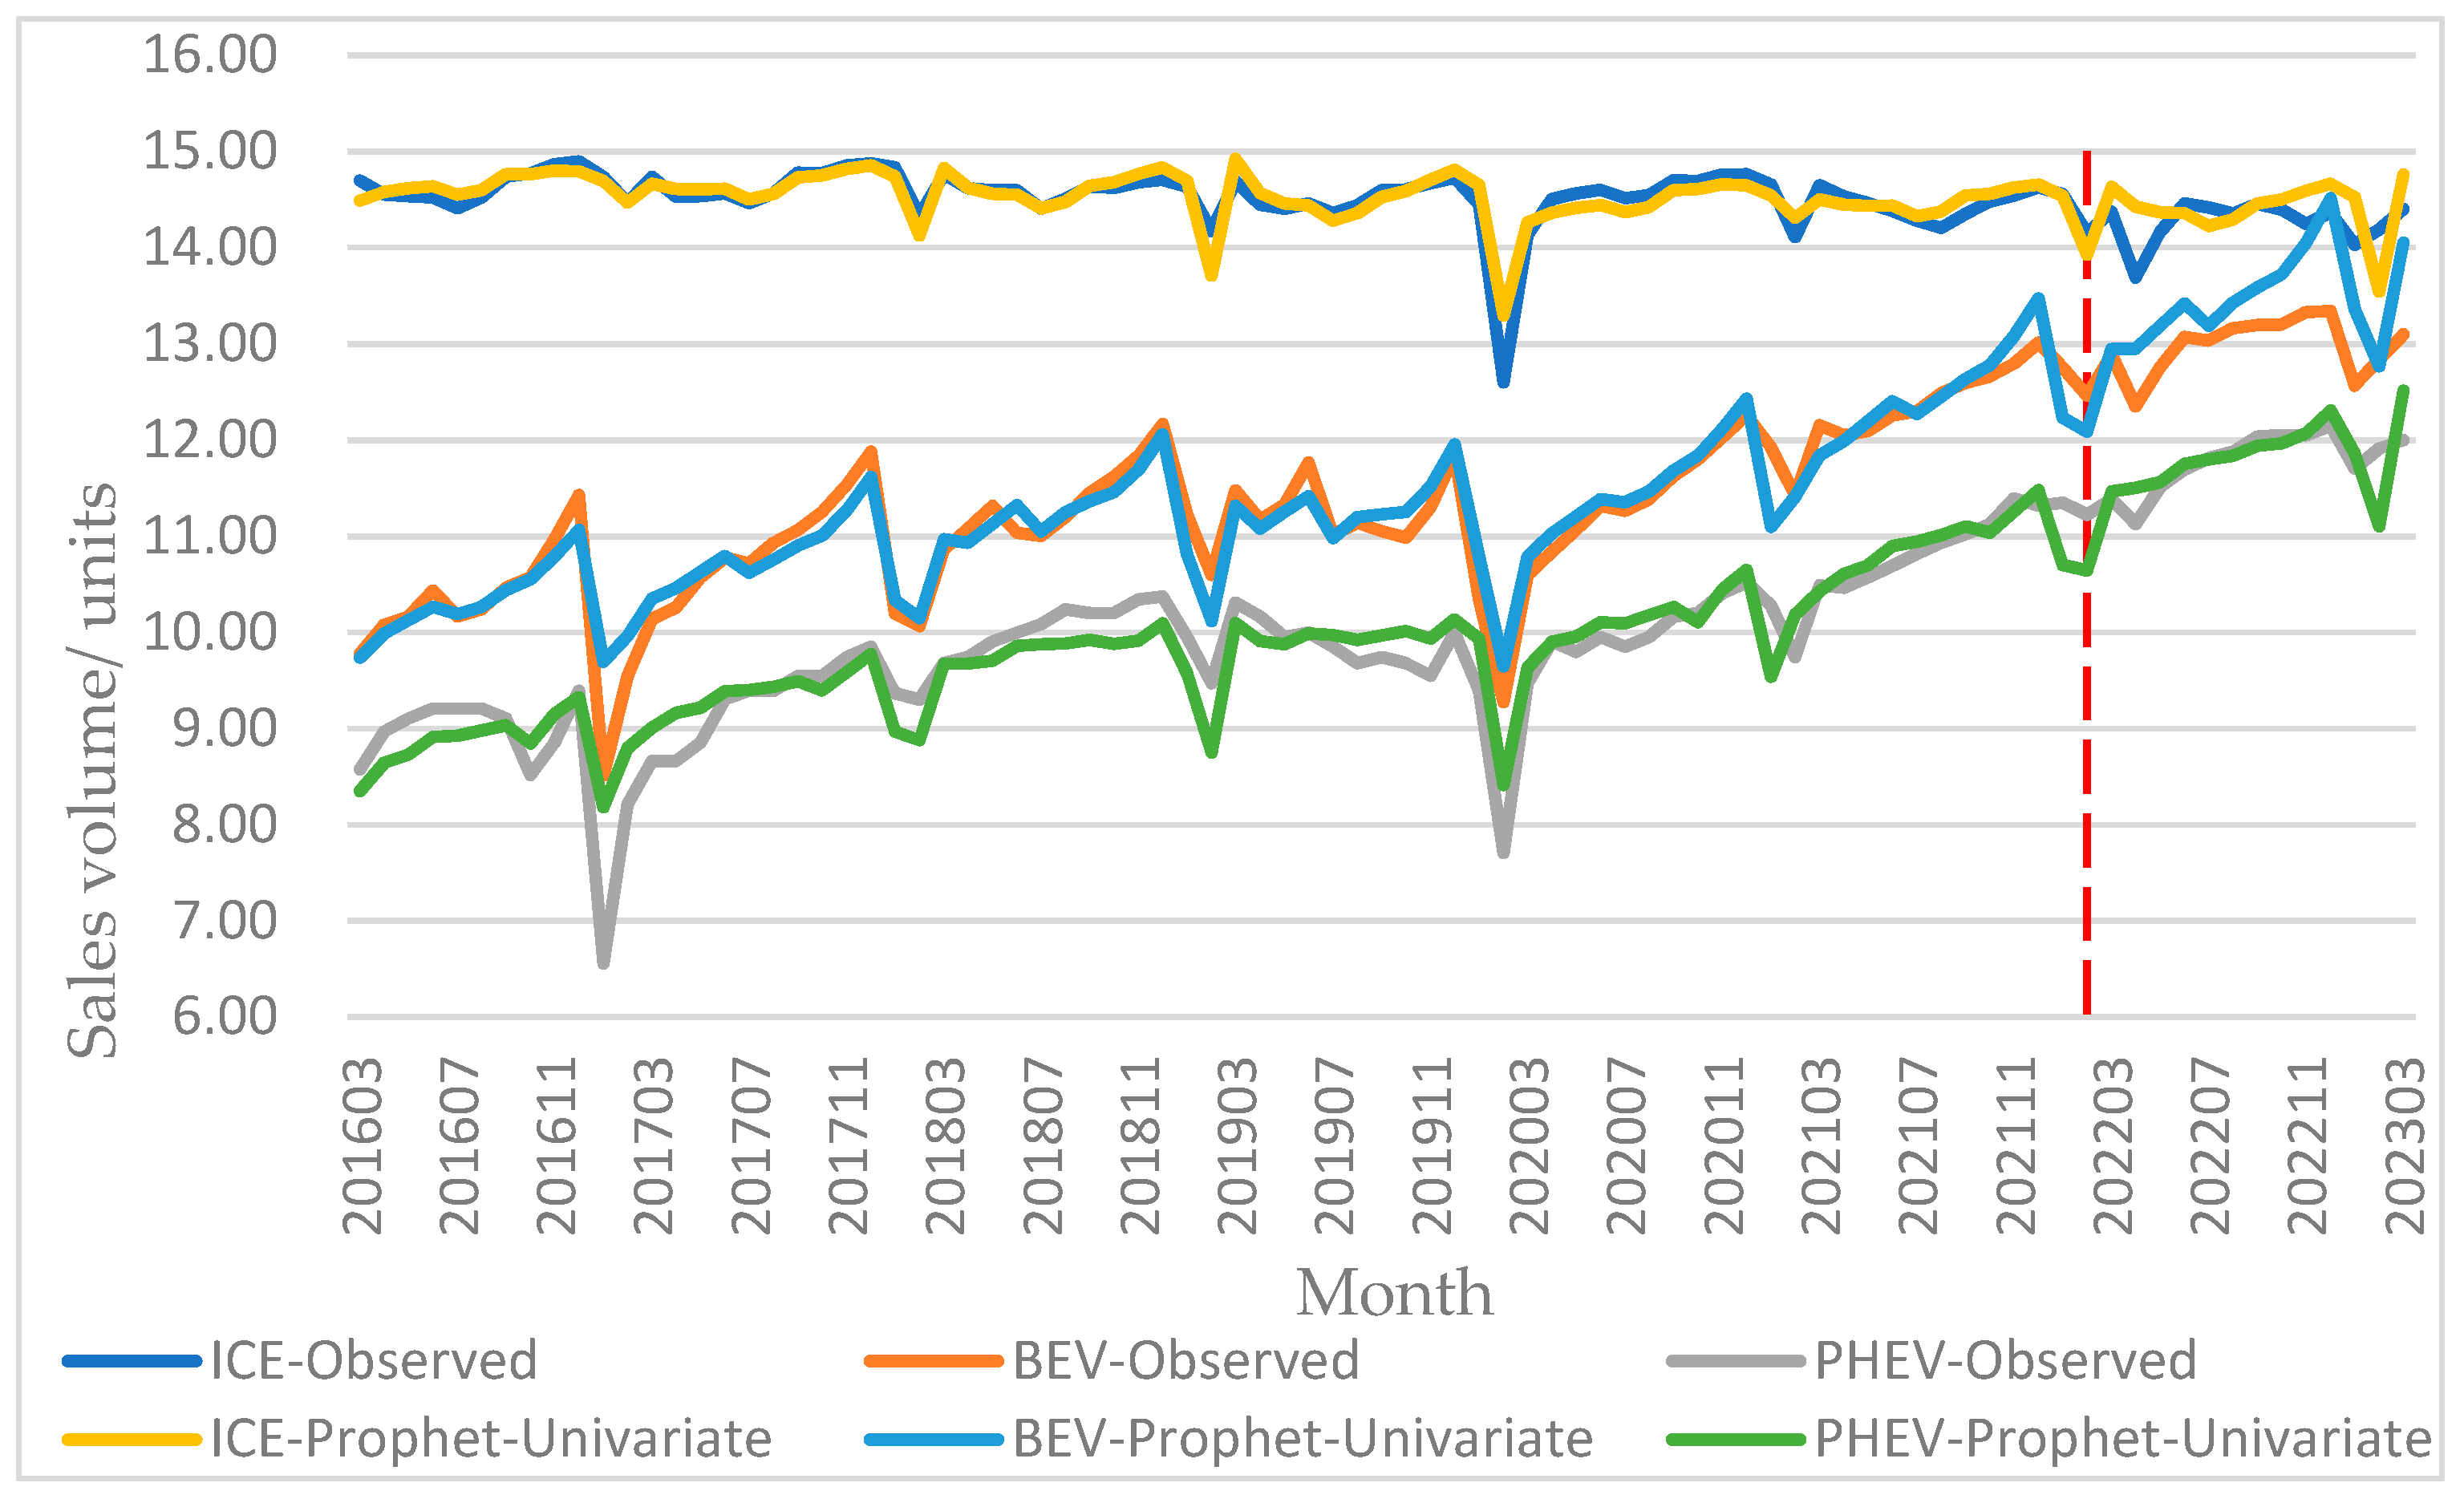
3.1.3. Prediction Results of Prophet Model

The input variables of the Prophet model are two-dimensional vectors, namely, the date and corresponding historical sales data. The default parameters of the fbProphet library are used in this Prophet model. Based on the date series of traditional fuel vehicles, battery electric vehicles and plug-in hybrid vehicles from March 2016 to February 2022 and the corresponding vehicle sales data, according to Formulas (6)–(9), the prediction models of three power types of vehicles are constructed individually, and the fitting values of the vehicle sales of three power types are calculated. Based on the constructed Prophet model, the sales volume of three types of power vehicles from March 2022 to March 2023 are predicted by Formula (6).
Comparing the fitted and predicted values with the actual values in the corresponding periods, the fitted and predicted results of automobile sales of three power types are shown in Figure 5.

3.1.4. Error Comparison

Table 3 shows the fitting prediction errors of the BP neural network model, quadratic exponential smoothing model and Prophet model for the sales of three types of power vehicles. Among them, because the BP neural network model is based on the training data constructed by a sliding window, the fitting time range is from March 2017 to February 2022.
Comparing the fitting and forecasting effects of each benchmark model on the sales volume of traditional fuel vehicles, the RMSE index shows that the fitting error of the Prophet model is the smallest, and the forecasting error of the exponential smoothing model is the smallest. The MAPE index shows that the fitting error of the quadratic exponential smoothing model is the smallest, and the prediction error of the BP neural network model is the smallest. For battery electric vehicles and plug-in hybrid vehicles, except RMSE index, the fitting error of Prophet model for pure electric vehicles is the smallest, and other RMSE indexes and MAPE indexes show that the fitting and prediction error of quadratic exponential smoothing model is the smallest.
Although the quadratic exponential smoothing model performs well on most indicators, it lacks the ability to identify the turning point of data, and the long-term prediction effect is poor, so it is difficult to meet the needs of out-of-sample prediction. Considering the fitting and forecasting performance of each benchmark model for three types of automobile sales, it is considered that the overall forecasting performance of the Prophet model is more in line with the requirements, and its average fitting MAPE and RMSE are only 1.748% and 0.255, respectively, and the average forecasting MAPE and RMSE are only 2.502% and 0.418, respectively. Therefore, the Prophet model is selected to forecast the sales volume of three types of power vehicles from April 2023 to December 2025.

3.2. Comparison of Multivariate Prediction Models

Taking the data from March 2016 to February 2022 as the training set, and the data from March 2022 to March 2023 as the test set, this paper compares the effectiveness of various multivariate prediction models, establishes the VAR prediction model based on Eviews9, and establishes the SVM model and the multivariate BP neural network prediction model based on Python3.9.

3.2.1. Analysis of Lag Effect Based on VAR Model

The VAR model is widely used to analyze the causal relationship between variables, so the VAR model is used to analyze the lag effect and dynamic mechanism of various factors on automobile sales, and to determine the input variables of the multivariate prediction model.
(1)
Stationarity test. In order to avoid pseudo-regression, we test the stationarity of the original sales volume and influencing factor series based on the ADF test. In order to eliminate the influence of heteroscedasticity, this paper carries out logarithmic processing on automobile sales data and influencing factors data. As shown in Table 4, at the significance level of 1%, the 17 data series involved in the study are stationary.
(2)
Determination of the optimal lag order. The establishment of the VAR model needs to choose the appropriate lag order. In order to fully reflect the dynamic characteristics of the established VAR model, many factors need to be considered when choosing the lag order. Based on LR, FPE, AIC, SC and HQ criteria, the optimal lag order is determined, and the maximum number of * is the optimal lag period. As shown in Table 5, the optimal lag order is 3.
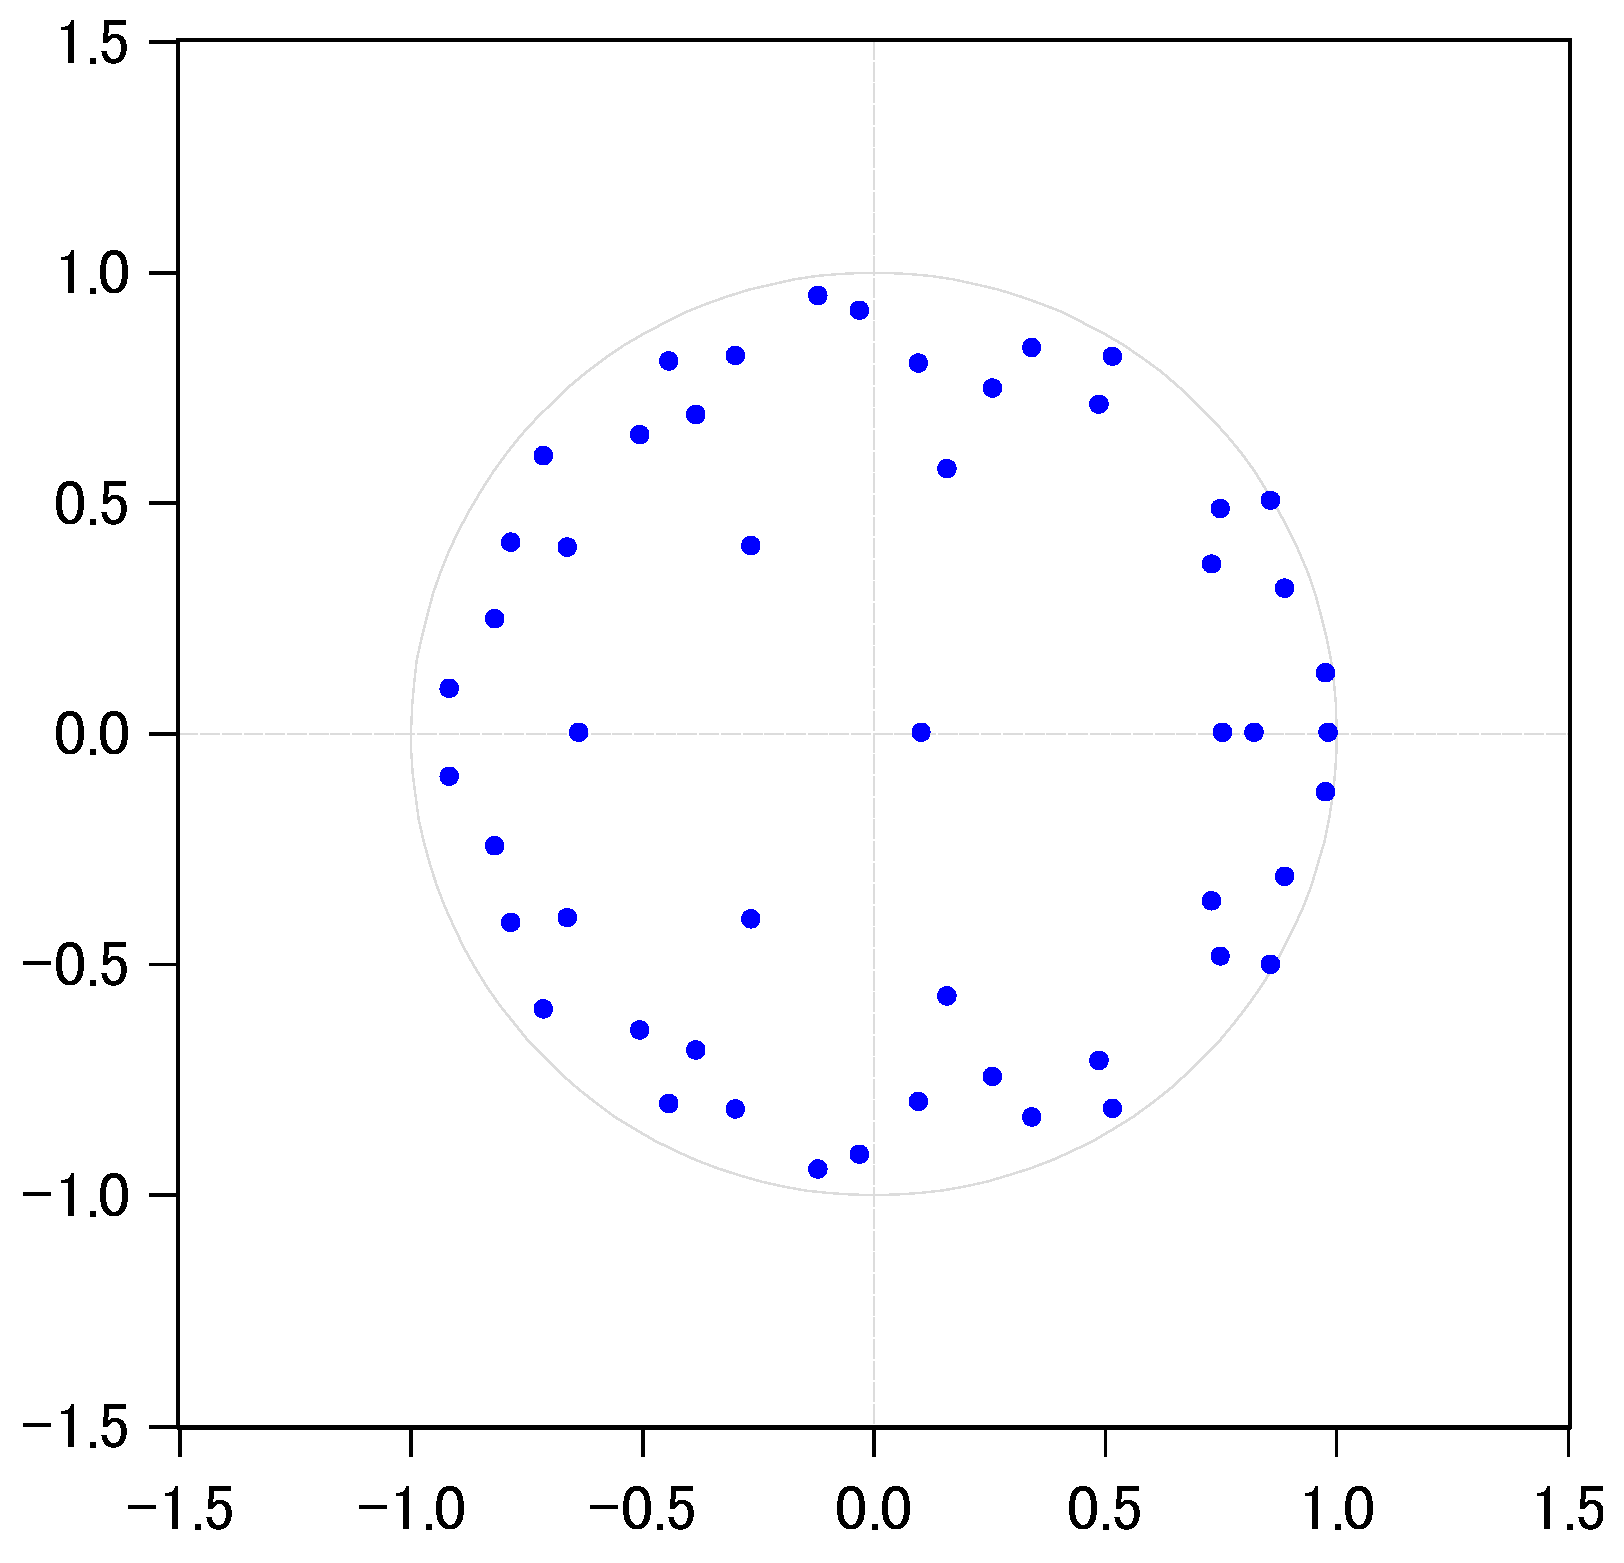
(3)
Stability test of the VAR model. When a pulsating impact is applied to the process of an equation in the VAR model, the system is considered to be stable if the pulse disappears with the passage of time. When the modulus of the reciprocal of the characteristic root is less than 1, it means that the VAR model is stable. As shown in Figure 6, the feature roots are all located in the unit circle, which proves that the VAR (3) model is stable.
(4)
The parameters of the unconstrained VAR (3) model constructed in this paper are shown in Table 6:
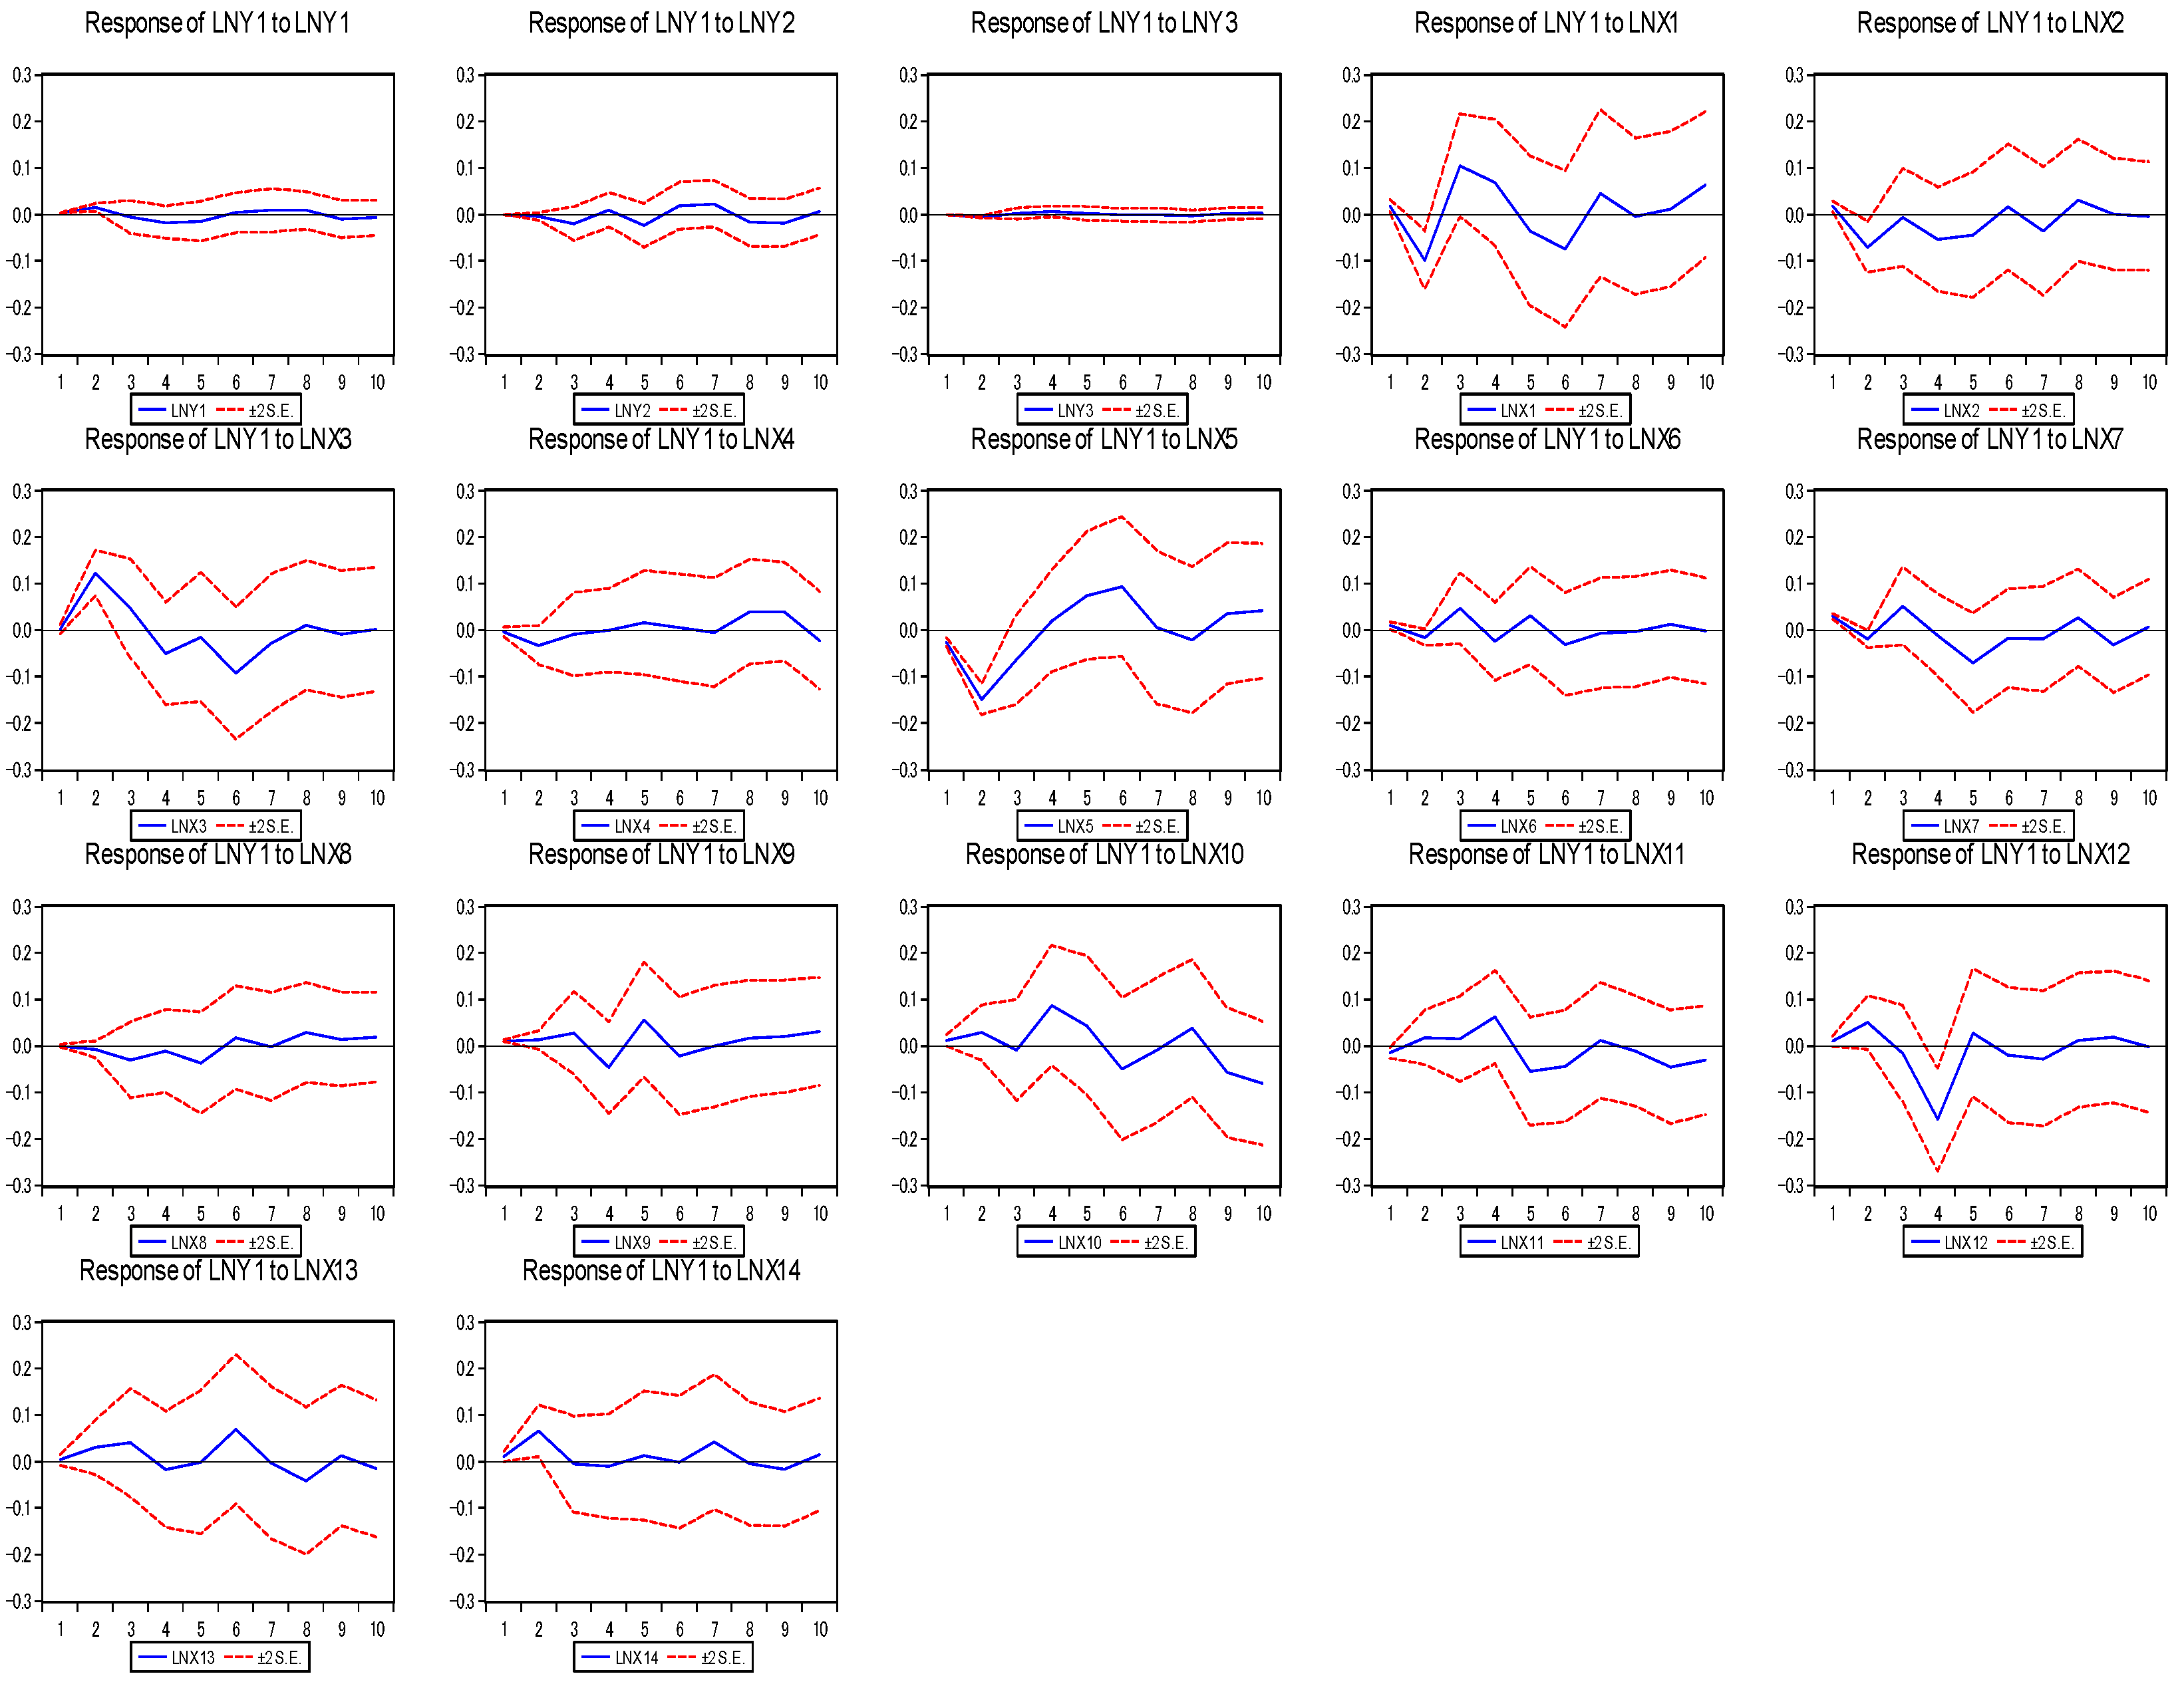
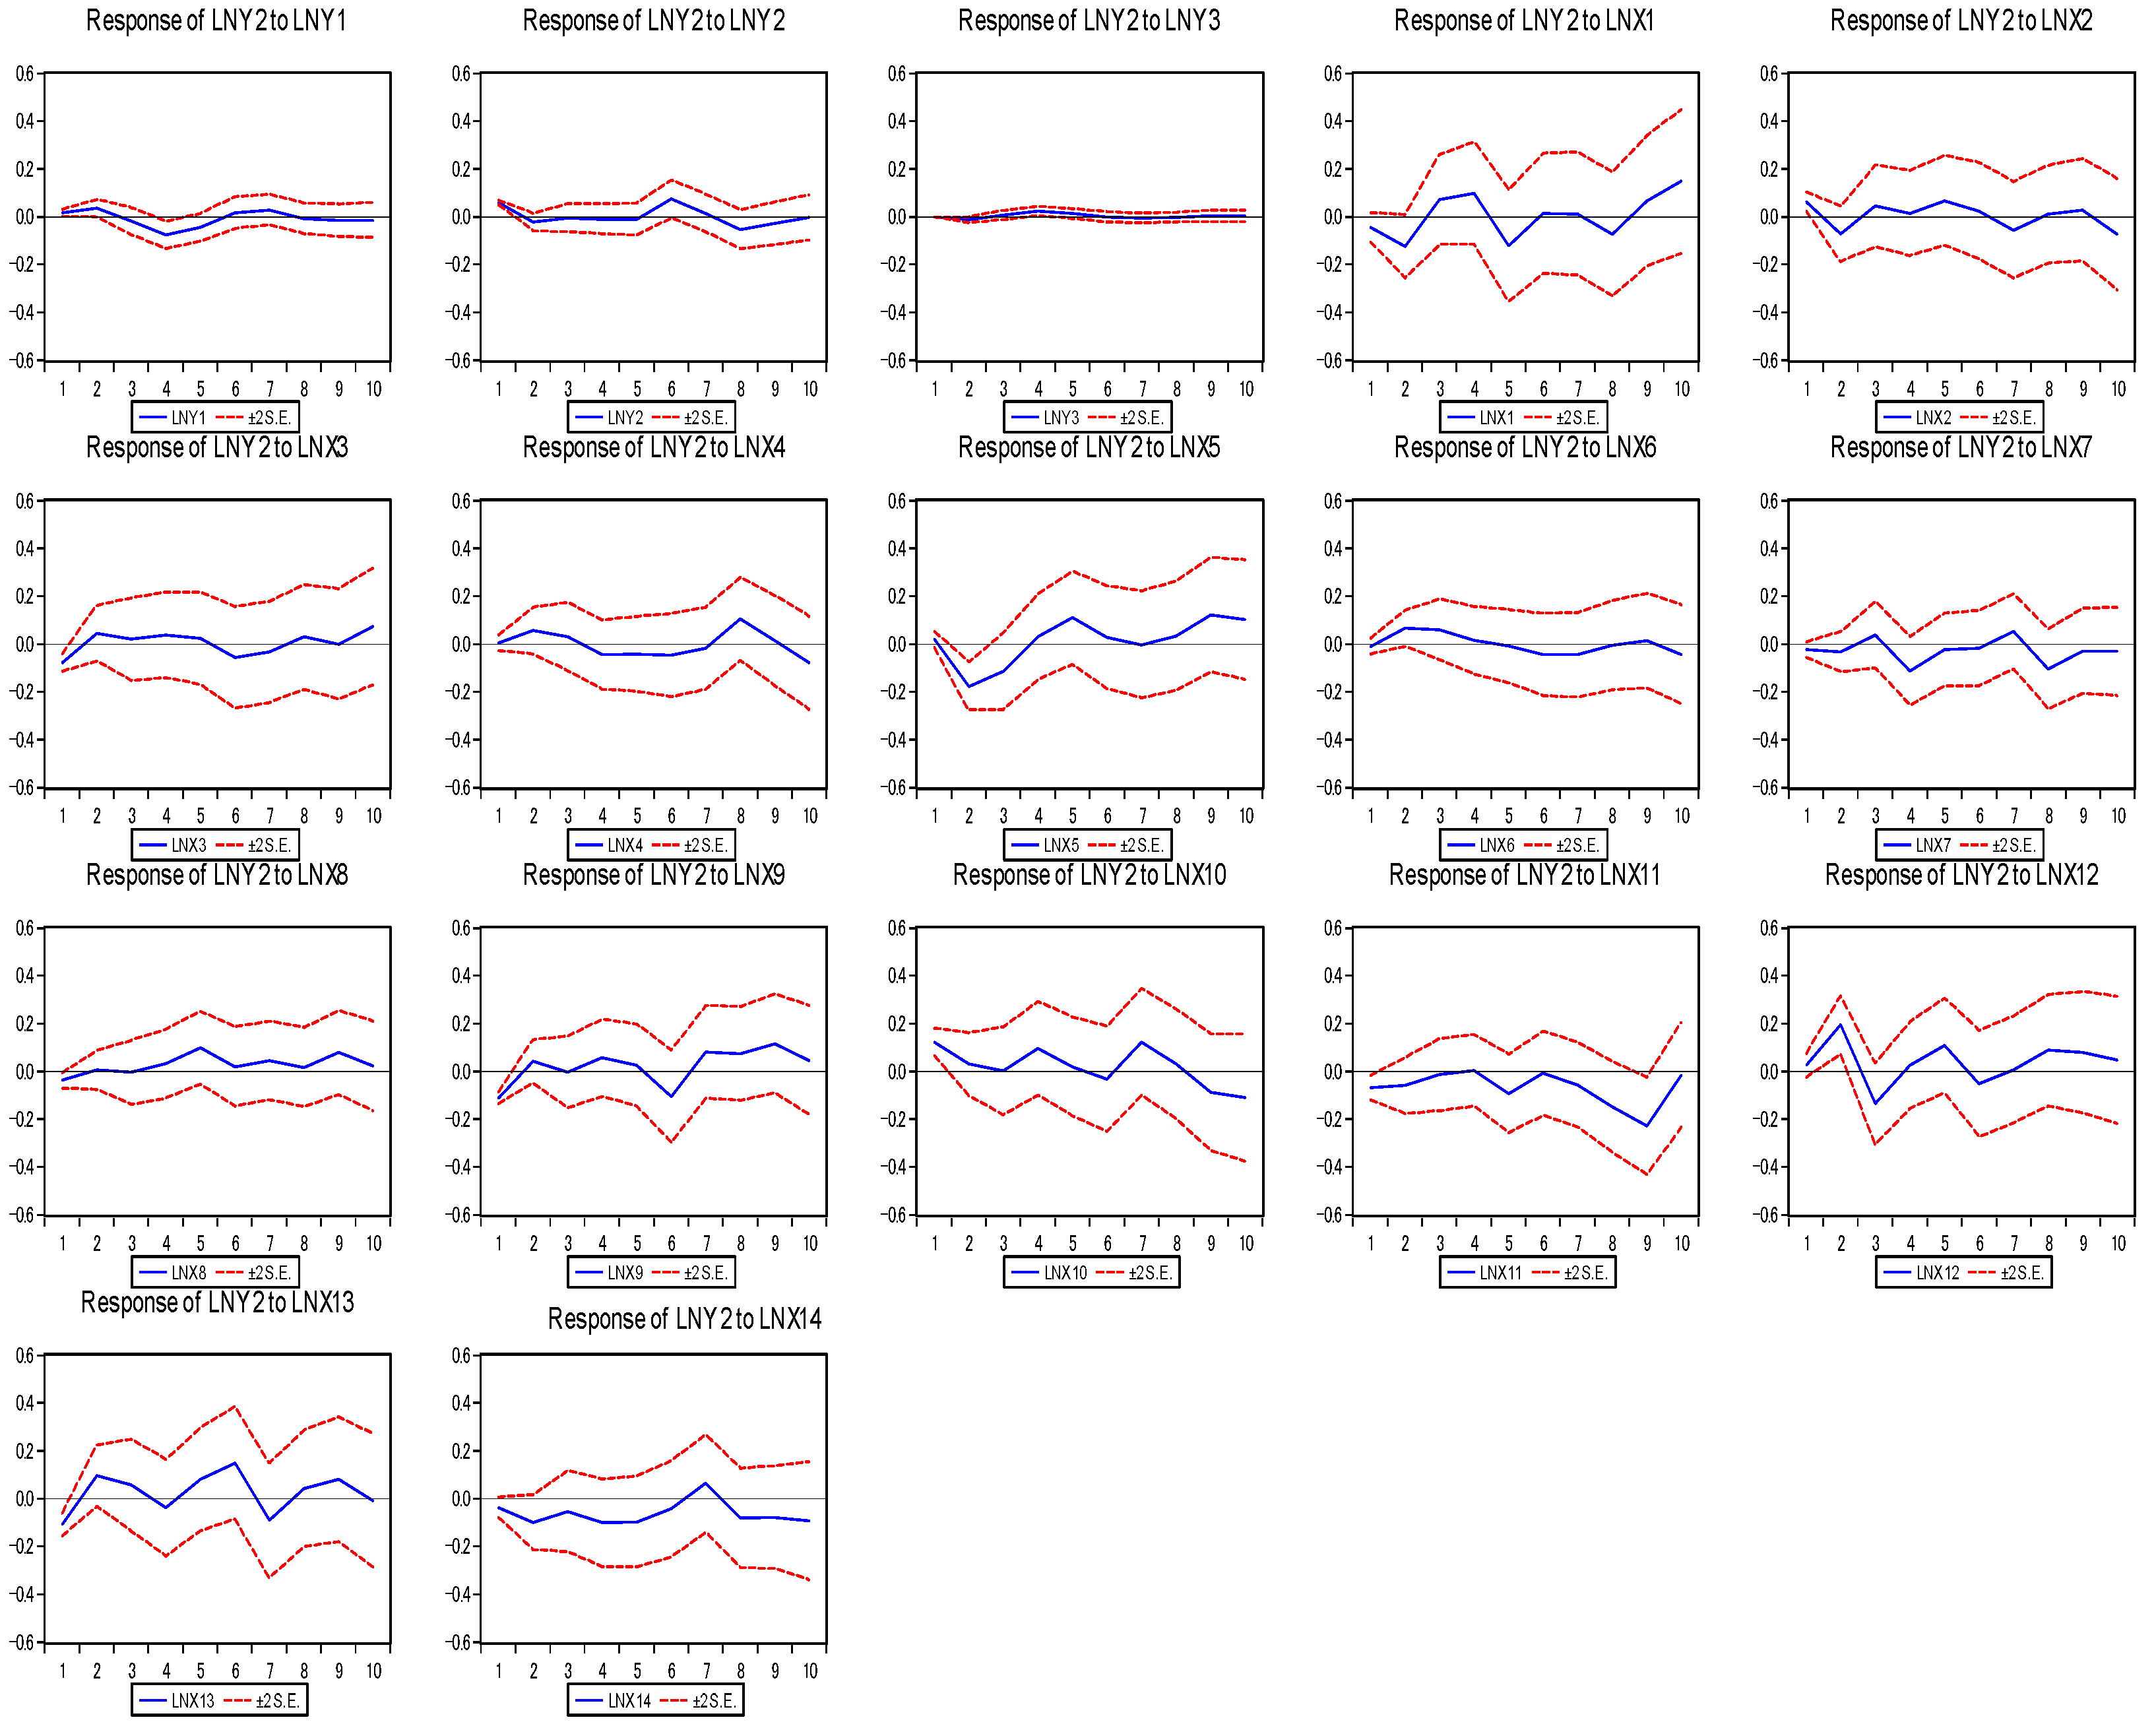
(5)
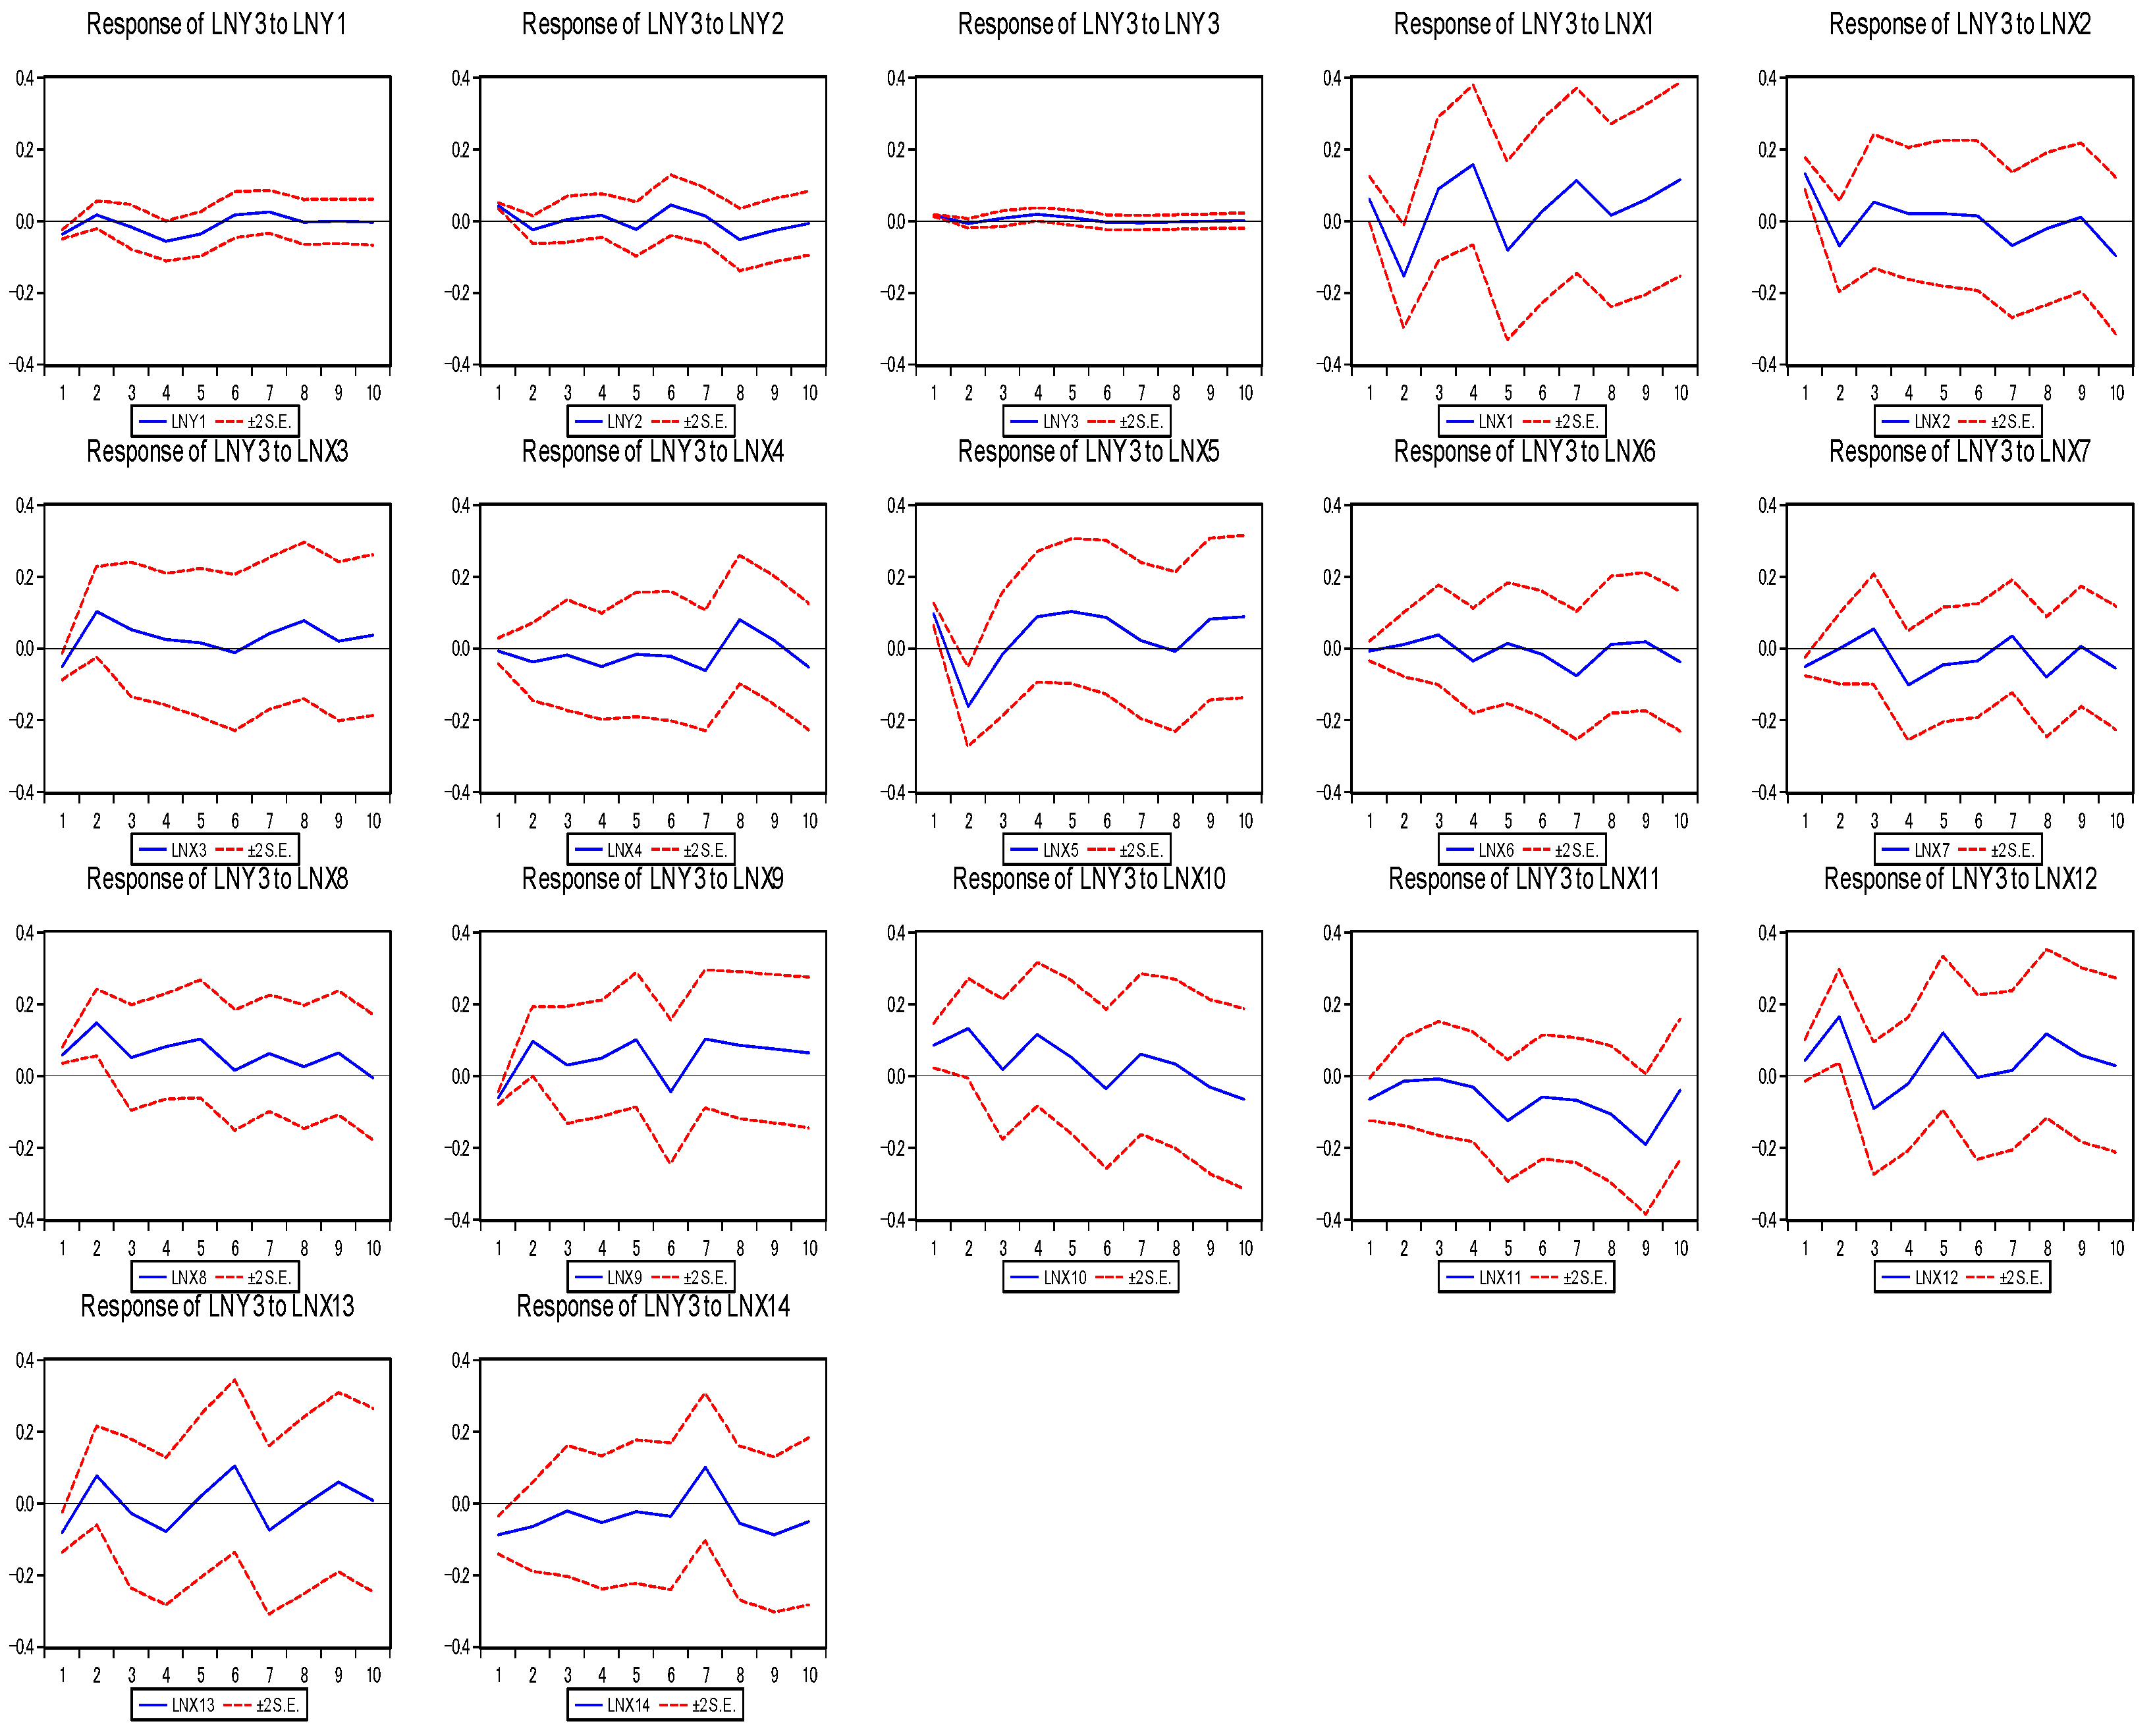
Impulse response analysis. The impulse response function reflects the dynamic relationship between variables and the dynamic influence path of the impact of one variable on another [42].
Figure 7, Figure 8 and Figure 9 show the trajectories of the impact of the sales of three types of power vehicles on 17 influencing factors. In Figure 7, Figure 8 and Figure 9, the horizontal axis represents the number of periods, the vertical axis represents the magnitude of the impulse response function, the blue solid line represents the impulse response function, and the red dotted line represents the standard deviation band of plus or minus two times (±2S.E.).
Comparing the subgraphs, it can be found that in the long run, the sales of traditional fuel vehicles and plug-in hybrid vehicles and the average price of fuel vehicles tend to be stable, while the sales of battery electric vehicles have a negative impact on the three types of vehicles. In the short term, the consumer price index, the total export value, the number of patents granted for electric vehicles and the effective number of patents granted for power batteries all show the characteristics of fluctuation on the sales of the three types of vehicles, while in the long term, this influence tends to be positive. The impact trajectories of customs import, average price of new energy vehicles, nuclear power generation and employee index on the sales of three kinds of vehicles all show the characteristics of alternating ups and downs; in the long run, the average price of new energy vehicles has a positive impact on the sales of traditional fuel vehicles and a negative impact on the sales of battery electric vehicles and plug-in hybrid vehicles. The impact of customs imports, nuclear power generation and employee index on the sales of traditional fuel vehicles has gradually weakened, while it has a positive impact on the sales of battery electric vehicles and plug-in hybrid vehicles. The impact of customs export volume and road passenger volume on the sales of the three kinds of vehicles shows the characteristics of alternating ups and downs. In the long run, the impact on the sales of traditional fuel vehicles is gradually weakened, and it has a negative impact on the sales of battery electric vehicles and plug-in hybrid vehicles. In the short term, the effects of total import value, lithium-ion battery output and hydropower generation on the sales of the three types of vehicles all show the characteristics of alternating ups and downs, and in the long term, this effect tends to be negative.
According to Figure 7, it can be found that the logarithm of 17 influencing factors, such as consumer price index, customs export volume and customs import volume, has a fluctuation characteristic of fluctuation in the impact trajectory of traditional fuel vehicle sales. The initial response value of traditional fuel vehicle sales to the unit impact of customs import volume, total export value, electric vehicle patent license amount and employee index is 0, and the subsequent response values alternate between positive and negative, indicating that these factors will not have an impact on traditional fuel vehicle sales at the initial stage. In the long run, the impact of customs import volume and electric vehicle patent license amount on traditional fuel vehicle sales tends to be stable, and the total export value and employee index will have a cyclical fluctuation impact on traditional fuel vehicle sales. The impact of consumer price index, customs export volume, total export value, average price of fuel vehicles, average price of new energy vehicles, effective patent authorization of power batteries, output of lithium-ion batteries, hydropower generation, nuclear power generation and road passenger traffic will make the sales of traditional fuel vehicles fluctuate to varying degrees. The sales of traditional fuel vehicles, battery electric vehicles and plug-in hybrid vehicles have a relatively stable influence on the sales of traditional fuel vehicles.
Figure 8 shows the effect of various influencing factors on the sales of battery electric vehicles. At the beginning, the response value of battery electric vehicle sales to the sales shock of traditional fuel vehicles fluctuated slightly, and finally stabilized. The response value of battery electric vehicle sales to its own impact fluctuated slightly in the middle and finally stabilized. The response value of battery electric vehicle sales to plug-in hybrid vehicle sales shock has been relatively stable. The impact from other influencing factors will make the sales of battery electric vehicles fluctuate to varying degrees.
Figure 9 shows the impact response of plug-in hybrid vehicle sales to various factors. The response value of plug-in hybrid vehicle sales to its own impact has been relatively stable. In the short term, the dynamic impact effect of traditional fuel vehicle sales and battery electric vehicle sales on plug-in hybrid vehicle sales presents the characteristics of ups and downs. In the long term, the influence of traditional fuel vehicle sales tends to be stable, but the influence of battery electric vehicle sales presents the characteristics of ups and downs. Consumer price index, customs import, electric vehicle patent authorization, power battery patent effective authorization and nuclear power generation have obvious positive effects on plug-in hybrid vehicle sales. The response value of plug-in hybrid vehicle sales to the impact of other influencing factors fluctuates up and down.
According to the analysis results of the VAR (3) model on influencing factors, based on 14 influencing factor data series and historical sales data of three types of power vehicles, the time window is set to 3, and the rolling time window is used to generate training samples as inputs of the VAR model, SVM model and multivariable BP neural network model.

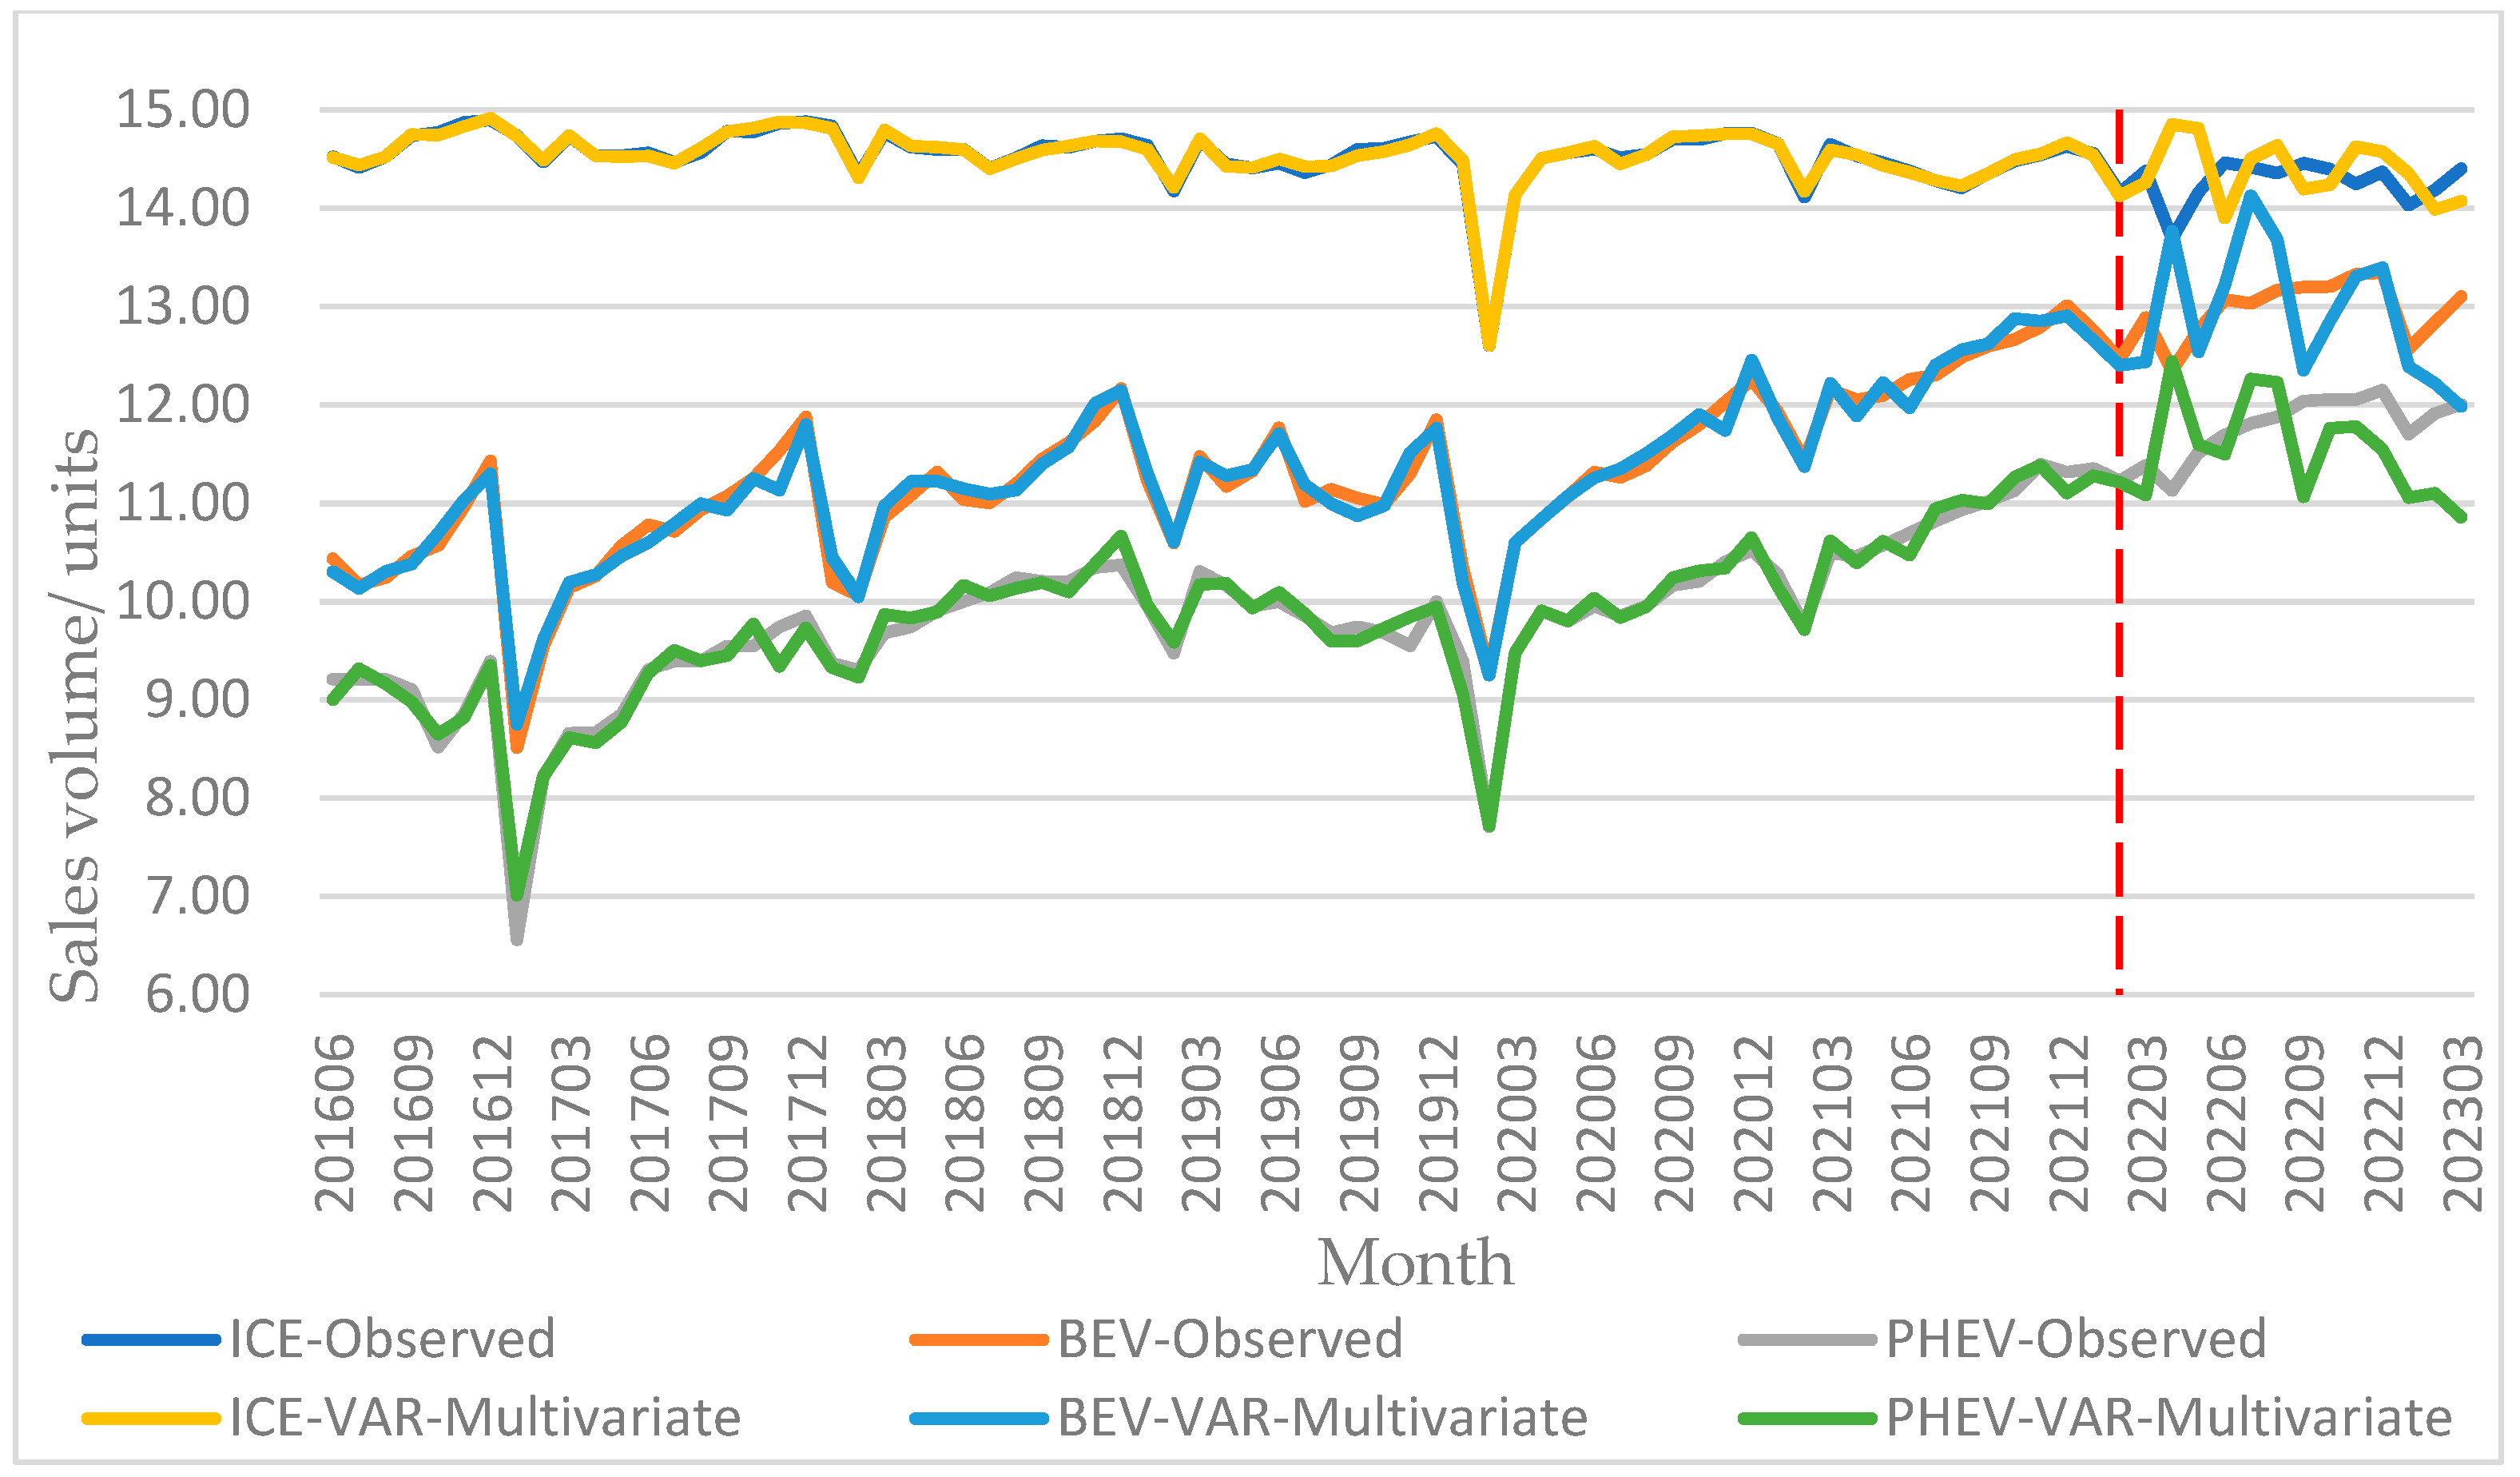
3.2.2. Predictive Results of VAR Model

The input variables of the VAR (3) model are 17-dimensional vectors, namely, the historical sales data of three types of power vehicles and the data of 14 influencing factors. Based on the sales data of traditional fuel vehicles, battery electric vehicles and plug-in hybrid vehicles from March 2016 to February 2022 and the data of 14 influencing factors, according to the analysis of Formula (10) and Section 3.2.1, the VAR (3) prediction model is constructed, and the fitting values of the sales of three power types from June 2016 to February 2022 are calculated. Based on the constructed VAR (3) model and Formula (10), the predicted sales volume of three types of power vehicles from March 2022 to March 2023 is calculated.
Using the VAR (3) model, the fitting and forecasting results of the logarithm of the sales volume of traditional fuel vehicles, battery electric vehicles and plug-in hybrid vehicles are shown in Figure 10.

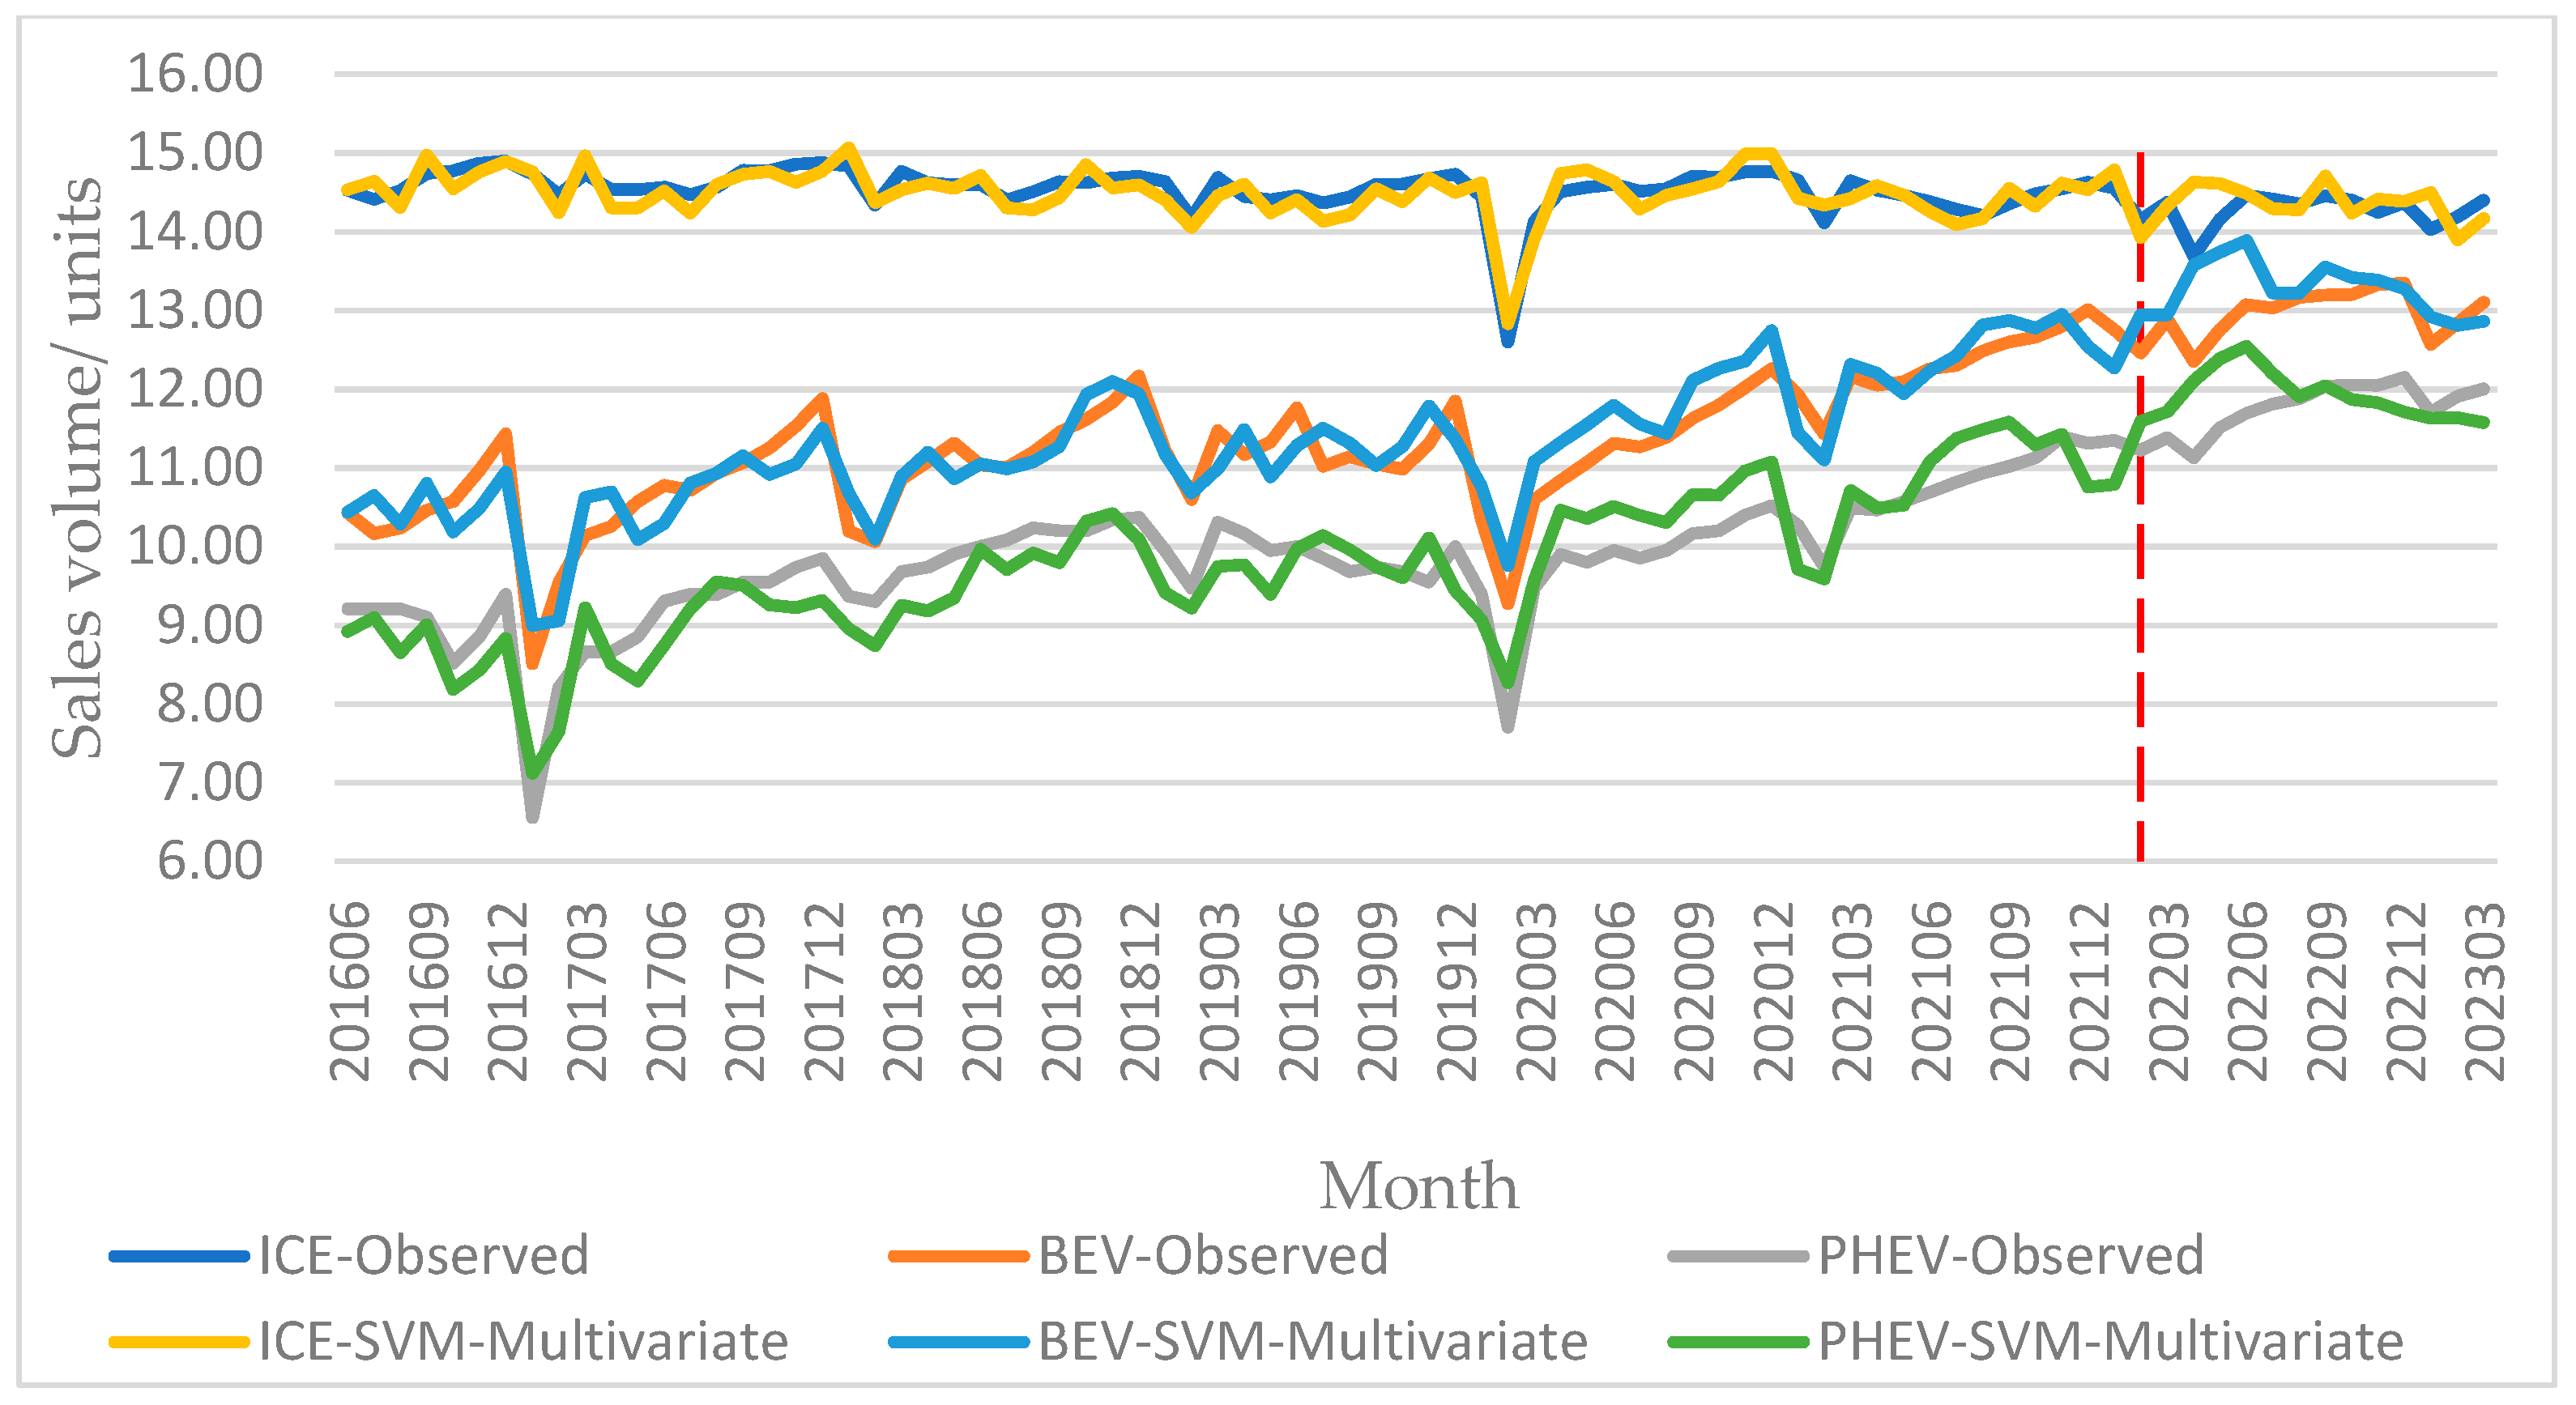
3.2.3. Predictive Results of SVM Model

Taking the construction process of the SVM forecasting model for the sales of traditional fuel vehicles as an example, based on the sales data of traditional fuel vehicles from March 2016 to March 2023 and the data of 14 influencing factors, 69 sets of training data from June 2016 to February 2022 and 13 sets of test data from March 2022 to March 2023 were constructed. In this SVM model, the input variables are 45-dimensional vectors.
Based on the principles shown in Equations (11)–(13), the SVM prediction model of traditional fuel vehicle sales is constructed by using the scikit-learn library of the Python platform. In total, 69 groups of pre-constructed training data are input into the SVM model and trained, and the trained SVM model and the fitting value of traditional fuel vehicle sales from June 2016 to February 2022 are obtained. A total of 13 groups of data used for testing are input into the SVM model based on the training set data, and the predicted sales value of traditional fuel vehicles from March 2022 to March 2023 is obtained.
The construction method of the SVM forecasting model for battery electric vehicle sales and plug-in hybrid vehicle sales is similar.
After many trainings, when forecasting the sales of traditional fuel vehicles, battery electric vehicles and plug-in hybrid vehicles, the kernel function is set to “Linear”, the penalty coefficient is set to 10, and the default values of the scikit-learn library of the Python platform are used for other parameters. The fitting and forecasting results of the SVM model for automobile sales are shown in Figure 11.

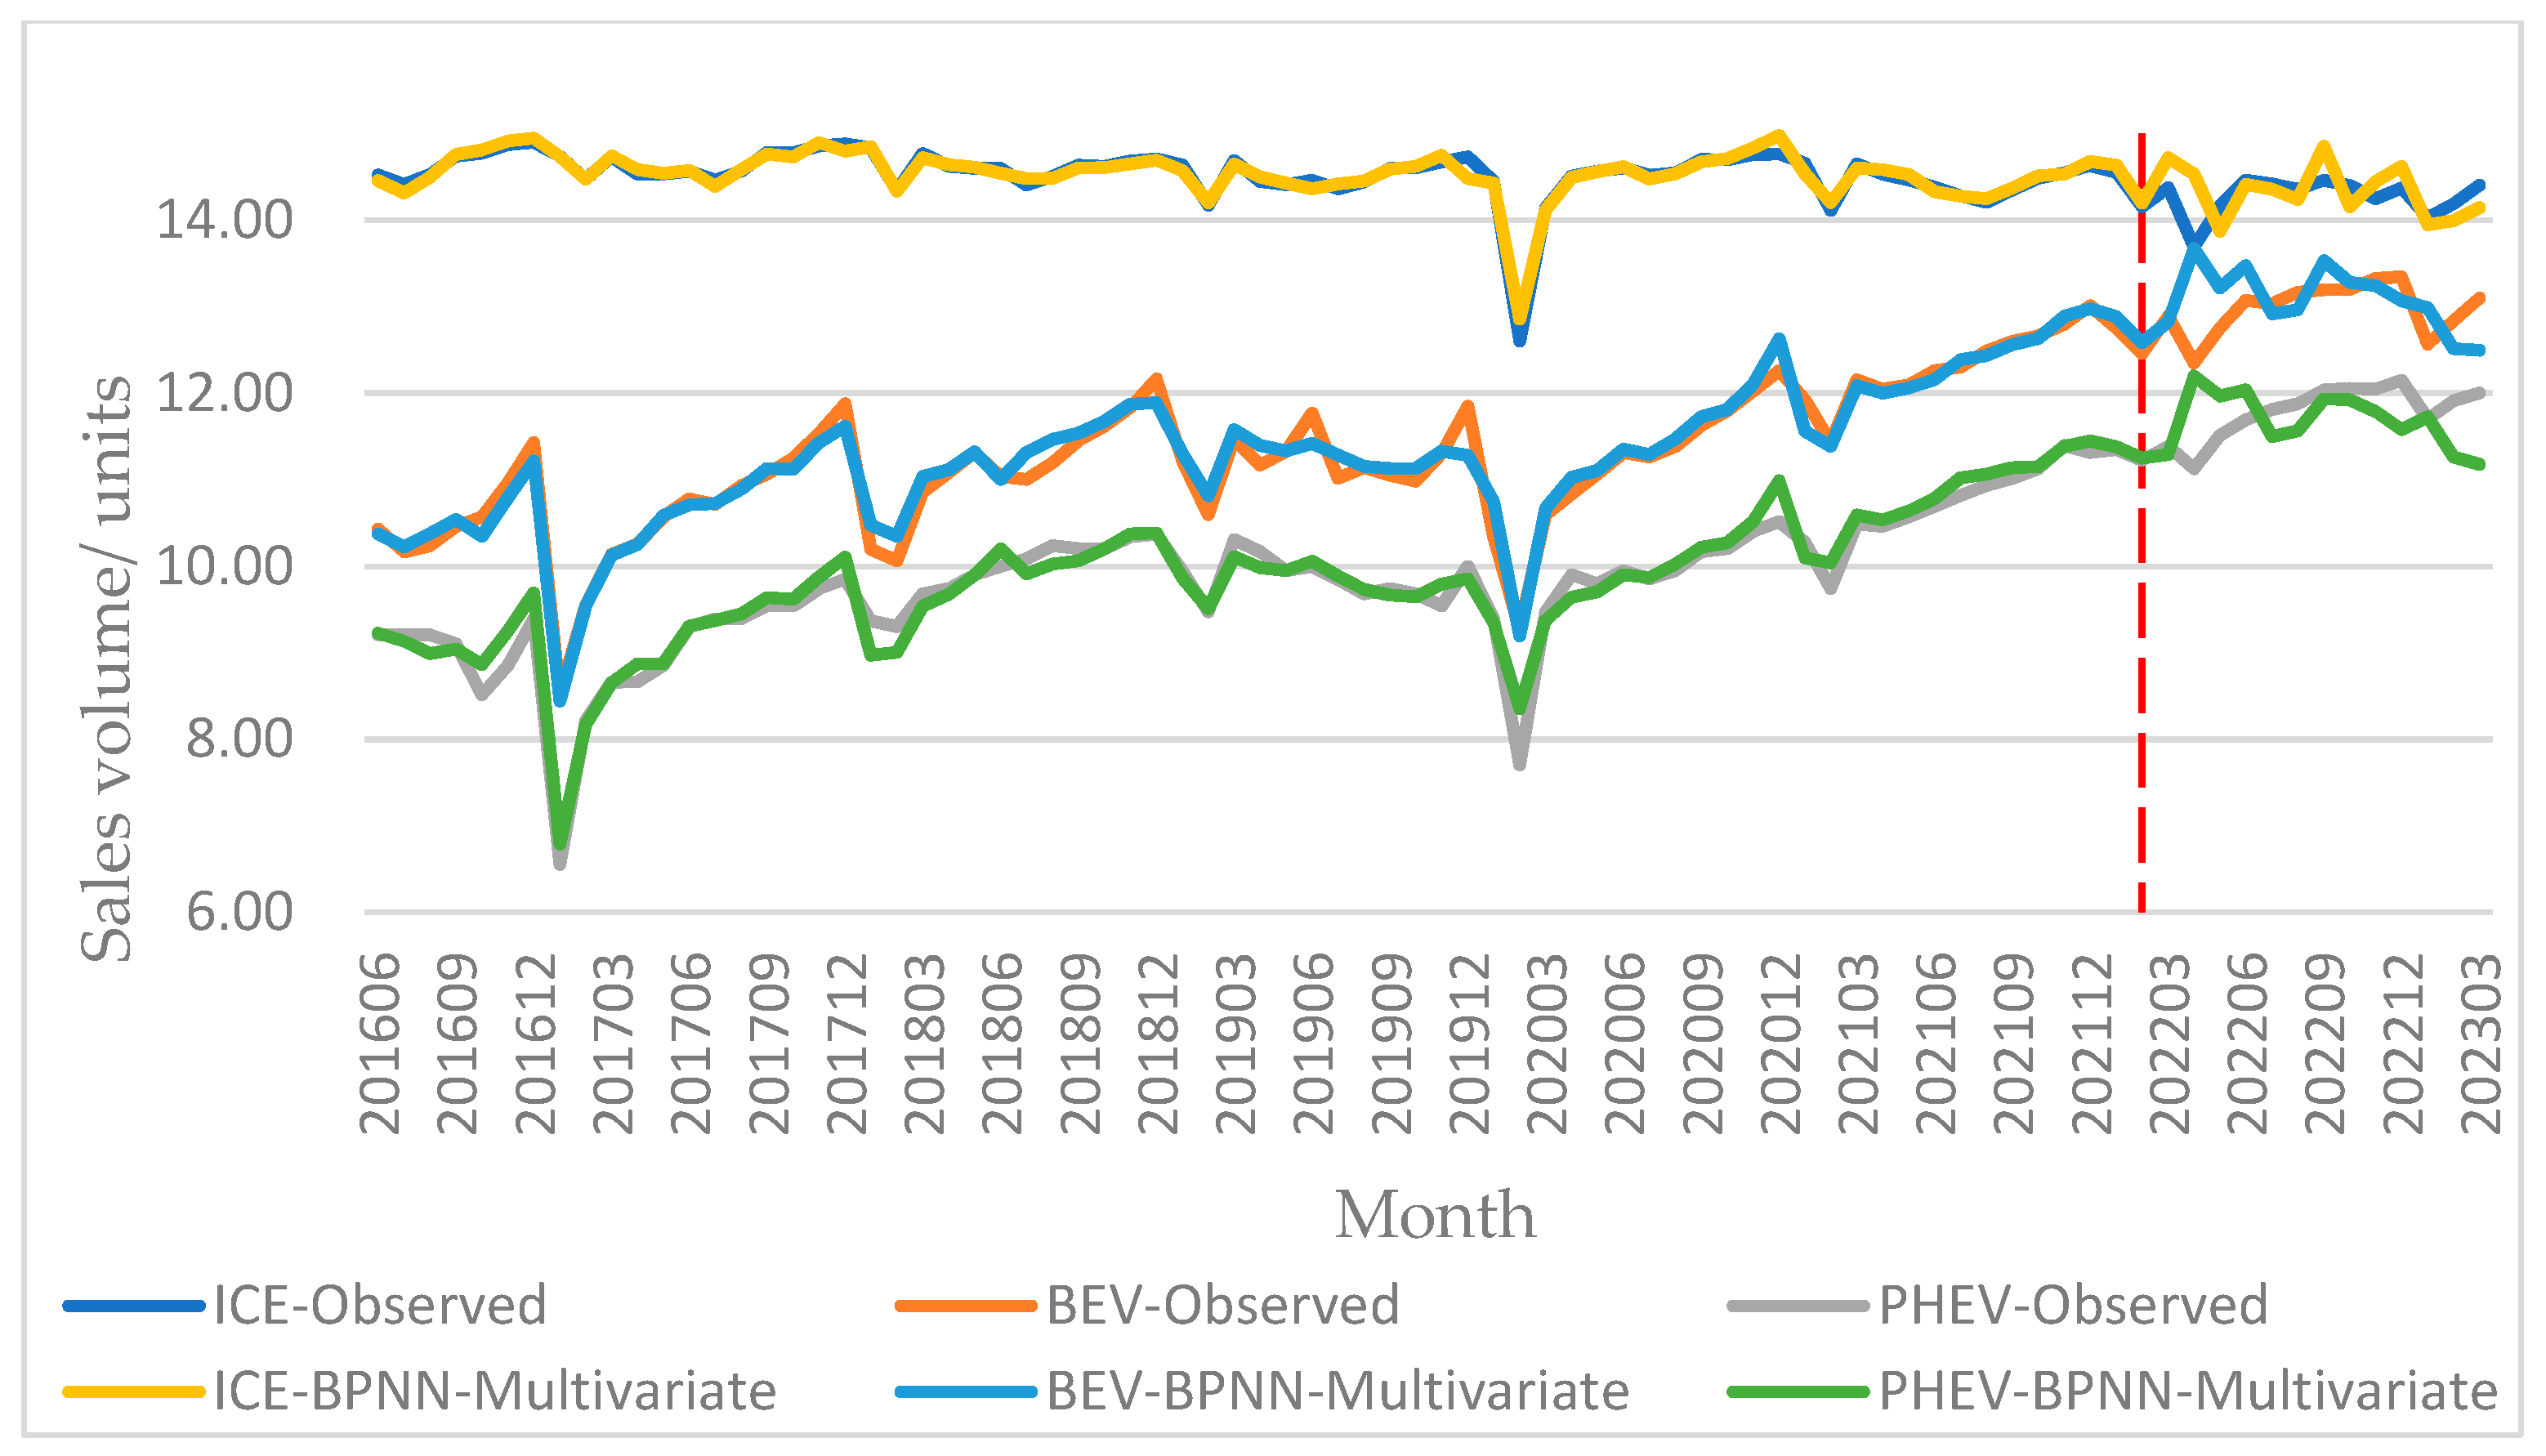
3.2.4. Prediction Results of Multivariate BP Neural Network Model

Taking 3 as a step, based on the sales data of traditional fuel vehicles, battery electric vehicles and plug-in hybrid vehicles from March 2016 to March 2023 and the data of 14 influencing factors, 69 sets of training data from June 2016 to February 2022 and 13 sets of test data from March 2022 to March 2023 are constructed, so the input variable of the multivariate BP neural network model here is a 51-dimensional vector.
Based on the Keras deep learning framework, a multivariate BP neural network prediction model is constructed, and the parameter settings are shown in Table 7. We input 69 groups of pre-constructed training data into the multivariate BP neural network model, and trained them according to the steps in Section 2.2.5, and obtained the trained multivariate BP neural network model and the fitting value of automobile sales from June 2016 to February 2022. In total, 13 groups of data used for testing are input into the multivariate BP neural network model based on the training set data, and the forecast value of automobile sales from March 2022 to March 2023 is obtained.
The fitting results and prediction results of three kinds of vehicle sales trained by the multivariate BP neural network model are shown in Figure 12.

3.2.5. Error Comparison

Table 8 shows the fitting and prediction errors of the VAR model, SVM model and multivariate BP neural network model for the sales of traditional fuel vehicles, battery electric vehicles and plug-in hybrid vehicles.
From the RMSE index, the multivariate BP neural network model has the best prediction effect on the automobile sales of three power types, and the VAR model has the best fitting effect on the automobile sales of three power types. From the MAPE index, the fitting error of the VAR model for three types of power vehicles is small, while the BP neural network model and SVM model have good forecasting effects for three types of power vehicles.
Based on the above analysis, it is considered that the multivariate BP neural network model has the best prediction performance for the sales of three power types of vehicles, and the fitting MAPE and RMSE are only 0.922% and 0.138, respectively, and the prediction MAPE and RMSE are only 2.668% and 0.434, respectively. Therefore, the multivariate BP neural network model is selected to predict the sales of three power types of vehicles outside the sample.

3.3. Comparison and Analysis of Prediction Accuracy

3.3.1. Comparison with Existing Literature

In Table 9, some of the existing literature about automobile sales forecast is sorted out. Comparing Table 3 and Table 8, we can find that the prediction errors of the univariate Forecast Model and the multivariate BP neural network prediction model we selected are smaller than those in the literature in the table.

3.3.2. Comparison between Univariate Prediction Models and Multivariate Prediction Models

Comparing the errors in Table 3 and Table 8, it can be found that the maximum fitting MAPE and RMSE of the three univariate forecasting models for three types of automobile sales are 2.842% and 0.405, respectively. However, the maximum MAPE and RMSE of the multivariable forecasting model for three types of power vehicles are 1.807% and 0.345, respectively. The maximum prediction MAPE and RMSE of the univariate prediction model are 3.382% and 0.596, respectively. The maximum prediction MAPE and RMSE of the univariate prediction model are 4.863% and 0.693, respectively. On the whole, the univariate and multivariate prediction models selected in this paper perform well, and the univariate prediction model is better in synthesis.
Table 10 summarizes the main advantages and disadvantages of the univariate forecasting model and multivariate forecasting model. The reason why this paper puts forward two kinds of models is not to compare the forecasting effects of the univariate forecasting model and multivariate forecasting model, but to consider that most of the current literature only forecasts automobile sales from one perspective. This paper hopes to combine the advantages of the two models to determine univariate forecasting and multivariate forecasting individually, so as to enhance the scientific and rigorous research and provide a more comprehensive reference for automobile sales forecasting.

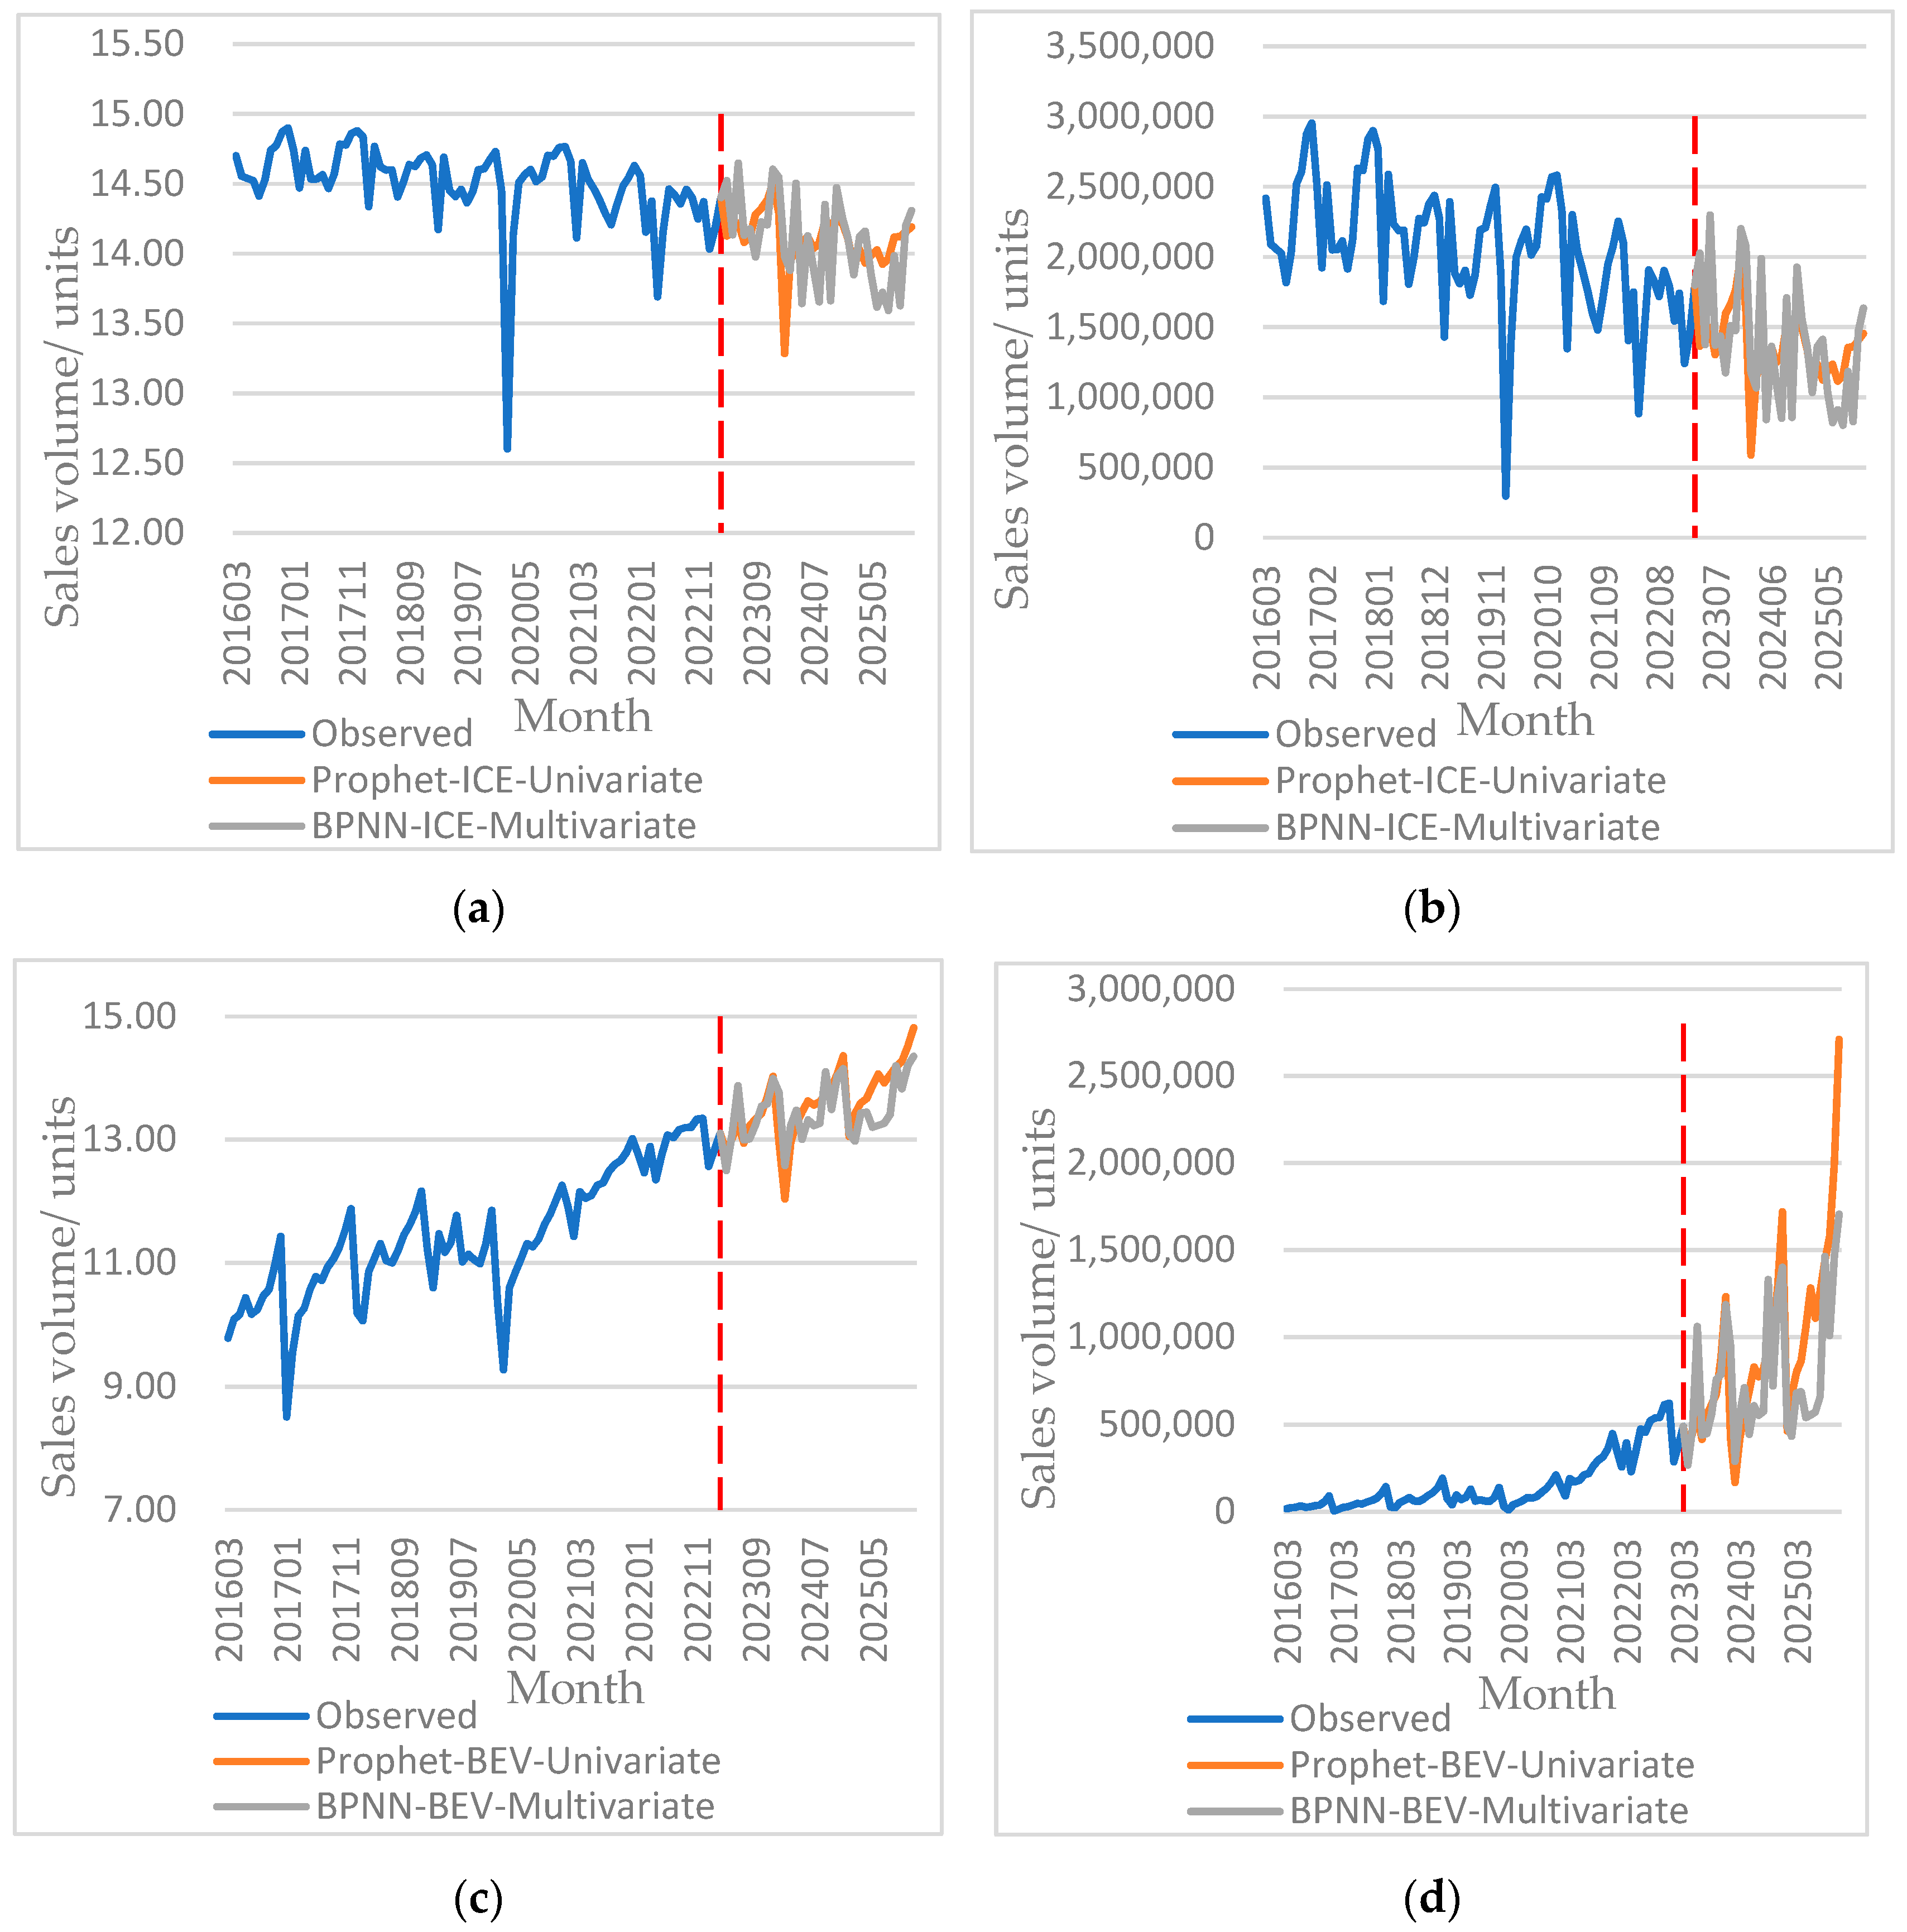
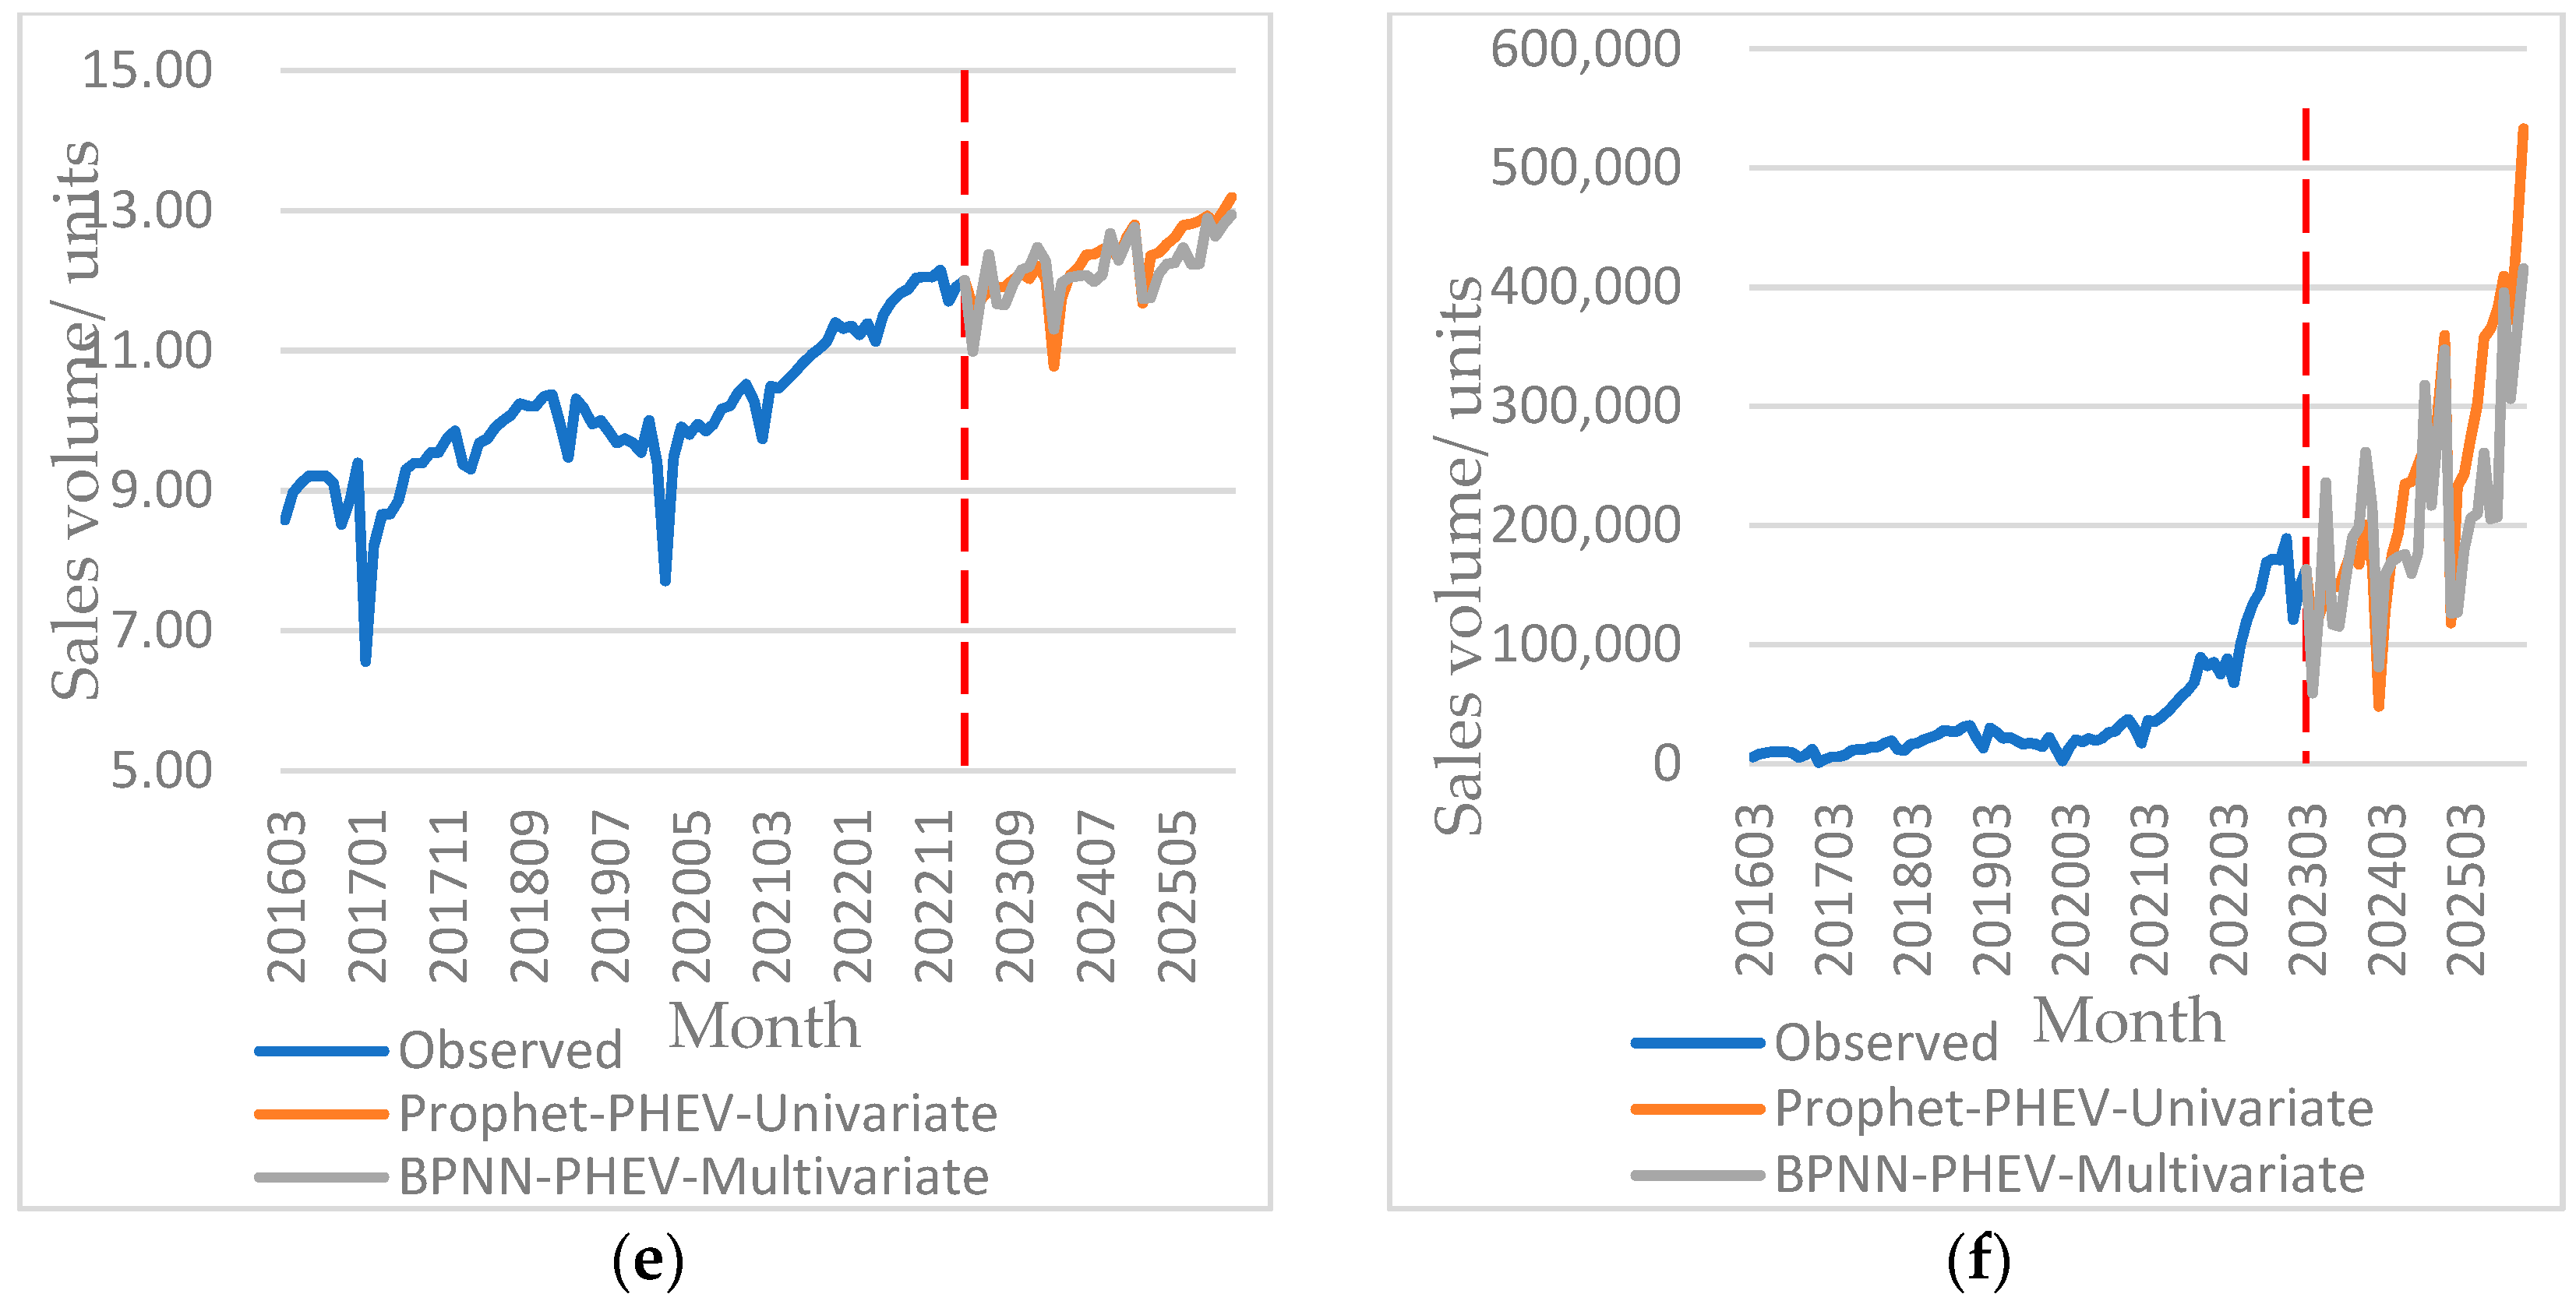
3.4. Extrasample Prediction Result

According to the above analysis, firstly, the sales of traditional fuel vehicles (ICEs), battery electric vehicles (BEVs) and plug-in hybrid vehicles (PHEVs) from April 2023 to December 2025 are predicted by the Prophet model. Among them, the default parameters of the Python platform fbprophet library are used for the out-of-sample prediction of traditional fuel vehicle sales, and the changepoint_range is set to 0.1 for the out-of-sample prediction of battery electric vehicle sales and plug-in hybrid vehicle sales, and the default values are used for other parameters.
Then, we predict the values of 14 influencing factors from April 2023 to December 2025 by using the Prophet model, and input the predicted values into the trained multivariate BP neural network prediction model. The univariate and multivariate predicted and restored values of traditional fuel vehicle sales logarithm, battery electric vehicle sales logarithm and plug-in hybrid vehicle sales logarithm from April 2023 to December 2025 are shown in Figure 13.
According to the forecast results in Figure 13, it can be found that the Forecast Model and the Multivariate BP Neural Network forecast model have the same forecast trend for the sales of three types of power vehicles.
In 2022, the National Development and Reform Commission and the National Energy Administration issued the 14th Five-Year Plan for Modern Energy System, and the 14th Five-Year Comprehensive Work Plan for Energy Conservation and Emission Reduction issued by the State Council pointed out that by 2025, the sales of new energy vehicles should account for about 20% of the total sales of new vehicles in that year, and China has achieved this goal more than three years ahead of schedule. According to the univariate forecast, by the end of 2025 and the beginning of 2026, the sales volume of new energy vehicles in China will reach 56.2%, while the multivariate forecast shows that this proportion will reach 49.0%. The International Energy Agency (IEA) and Bloomberg New Energy Finance (BNEF) have also published relevant outlooks [44], and compared our forecast results with them. The Global EV Outlook 2023 released by IEA points out that under the guidance of China, the sales of electric vehicles, including battery electric vehicles and plug-in hybrid vehicles, continue to grow. According to the Electric Vehicle Outlook 2023 published by BNEF, by 2026, the sales of electric vehicles in China will reach 52.0%. It can be seen that the prediction results of this paper are very close to the prospects of IEV and BNEF.
At present, the Great Wall and other traditional car giants have accelerated the layout of new energy sources, and BYD announced that it would stop producing fuel vehicles in 2022. The intensification of competition in the new energy field has also promoted the research and development and application of new energy vehicles. In the short term, traditional fuel vehicles will not be completely eliminated, but their market share is gradually declining. According to univariate and multivariate forecast results, by 2025, the sales share of traditional fuel vehicles will drop to 43.8% and 51.0%, respectively. In 2020, the State Council released “New Energy Vehicle Development Plan (2021–2035)”, pointing out that by 2035, battery electric vehicles will become the mainstream of sales. The forecast results of this paper are consistent with the national planning direction, and the sales volume of battery electric vehicles will maintain an upward trend. According to univariate and multivariate forecasts, by 2025, the market share of battery electric vehicles will reach 44.4% and 37.9%, respectively.
Compared with traditional fuel vehicles and battery electric vehicles, plug-in hybrid vehicles have certain advantages in fuel economy and cruising range. BYD, Great Wall and other car giants are shifting the main battlefield of new energy vehicle competition to the hybrid market, further promoting the maturity of hybrid technology. Univariate and multivariate forecasting results show that by 2025, the sales share of plug-in hybrid vehicles will rise to 11.8% and 11.1%, respectively, in the new car market.
It is not difficult to see from the forecast results that the new energy vehicles mainly based on electric energy will be the inevitable trend of the development of China’s automobile industry.
From a global perspective, traditional car giants in various countries are accelerating the transformation of electrification. For example, BMW in Germany has set the goal that 50% of the group’s sales will be battery electric vehicles by 2030. BYD plans to achieve the goal of global sales of 5 million vehicles by 2025. In addition, with the support of national policies, many new forces have emerged to build cars. Tesla in the United States has become the world’s largest battery electric vehicle company with battery electric vehicles. China’s Xpeng Motors, Leading Ideal and Nio Automobile have also taken advantage of the historic opportunity of the automobile industry reform to develop into the three giants of the new force of making cars. The global competition of new energy vehicles has started.

4. Conclusions

China’s automobile industry is characterized by unprecedented diversification, and its development is accompanied by strong uncertainty. The new consumption reform of automobiles brings certain challenges to the country, enterprises and consumers. In order to accurately judge the development potential of several mainstream power vehicles on the market at present, the forecasting effects of various statistical models and machine learning on automobile sales are compared from the perspective of univariate and multivariate. Among them, the Prophet model and BP neural network model have achieved high prediction accuracy, and the developed VAR multivariable BP neural network model fully considers the lag effect of various factors on automobile sales. Therefore, we forecast the sales volume of traditional fuel vehicles, battery electric vehicles and plug-in hybrid vehicles in China from April 2023–December 2025 with the Prophet model as a univariate forecasting model and the BP neural network as a multivariate forecasting model. According to the univariate forecast, by 2025, the proportion of traditional fuel vehicles, battery electric vehicles and plug-in hybrid vehicles will be 43.8%, 44.4% and 11.8%, respectively. Multivariate prediction shows that by 2025, the sales of these three types of cars will account for 51.0%, 37.9% and 11.1%, respectively.

5. Suggestions

According to the above conclusions and analysis, the following suggestions are put forward: (1) Local governments and relevant departments should strengthen the construction of supporting infrastructure for new energy vehicles to better meet the demands of consumers. (2) In order to maintain China’s competitive advantage in the global market, we should further enhance our independent innovation capability and increase investment in research and development of key core technologies, such as power batteries, operating systems and independent chips.
Although good results have been achieved for various types of cars, it is considered that there are some limitations in the same lag period of each influencing factor on car sales, and the heterogeneity of the lag effect of different factors on car sales can be considered in the future.

Author Contributions

Conceptualization, S.W. and Y.F.; methodology, M.Z. and Y.F.; software, D.D., Y.F. and M.Z.; project administration, D.D.; writing—original draft preparation, D.D., S.W., Y.F. and M.Z.; writing—review and editing, D.D., S.W., Y.F. and M.Z. All authors have read and agreed to the published version of the manuscript.

Funding

This research was funded by the project “Process Optimization and Data Governance Solution Research” of Shanghai MAHLE Thermal Systems Co., Ltd., (23H00706).

Data Availability Statement

Not applicable.

Conflicts of Interest

The authors declare no conflict of interest.

References

  1. Liu, L.Y.; Liu, S.F.; Wu, L.F.; Zhu, J.S.; Shang, G. Forecasting the development trend of new energy vehicles in China by an optimized fractional discrete grey power model. J. Clean Prod. 2022, 372, 13. [Google Scholar] [CrossRef]
  2. Ding, S.; Li, R.J. Forecasting the sales and stock of electric vehicles using a novel self-adaptive optimized grey model. Eng. Appl. Artif. Intell. 2021, 100, 13. [Google Scholar] [CrossRef]
  3. Lin, B.Q.; Wu, W. Why people want to buy electric vehicle: An empirical study in first-tier cities of China. Energy Policy 2018, 112, 233–241. [Google Scholar] [CrossRef]
  4. Huang, Y.L.; Qian, L.X. Consumer preferences for electric vehicles in lower tier cities of China: Evidences from south Jiangsu region. Transport. Res. Part D-Transport. Environ. 2018, 63, 482–497. [Google Scholar] [CrossRef]
  5. Chen, K.; Ren, C.R.; Gu, R.; Zhang, P.D. Exploring purchase intentions of new energy vehicles: From the perspective of frugality and the concept of “mianzi”. J. Clean Prod. 2019, 230, 700–708. [Google Scholar] [CrossRef]
  6. Zhao, M.; Sun, T.; Feng, Q. Capital allocation efficiency, technological innovation and vehicle carbon emissions: Evidence from a panel threshold model of Chinese new energy vehicles enterprises. Sci. Total Environ. 2021, 784, 11. [Google Scholar] [CrossRef] [PubMed]
  7. Egbue, O.; Long, S.; Samaranayake, V.A. Mass deployment of sustainable transportation: Evaluation of factors that influence electric vehicle adoption. Clean Technol. Environ. Policy 2017, 19, 1927–1939. [Google Scholar] [CrossRef]
  8. Wang, Z.H.; Zhao, C.Y.; Yin, J.H.; Zhang, B. Purchasing intentions of Chinese citizens on new energy vehicles: How should one respond to current preferential policy? J. Clean Prod. 2017, 161, 1000–1010. [Google Scholar] [CrossRef]
  9. Yang, Z.L.; Li, Q.; Yan, Y.M.; Shang, W.L.; Ochieng, W. Examining influence factors of Chinese electric vehicle market demand based on online reviews under moderating effect of subsidy policy. Appl. Energy 2022, 326, 120019. [Google Scholar] [CrossRef]
  10. Wang, N.; Tang, L.H.; Pan, H.Z. Analysis of public acceptance of electric vehicles: An empirical study in Shanghai. Technol. Forecast. Soc. Chang. 2018, 126, 284–291. [Google Scholar] [CrossRef]
  11. Baur, D.G.; Todorova, N. Automobile manufacturers, electric vehicles and the price of oil. Energy Econ. 2018, 74, 252–262. [Google Scholar] [CrossRef]
  12. Austmann, L.M.; Vigne, S.A. Does environmental awareness fuel the electric vehicle market? A twitter keyword analysis. Energy Econ. 2021, 101, 105337. [Google Scholar] [CrossRef]
  13. Ou, S.Q.; Lin, Z.H.; Xu, G.Q.; Hao, X.; Li, H.W.; Gao, Z.M.; He, X.; Przesmitzki, S.; Bouchard, J. The retailed gasoline price in china: Time-series analysis and future trend projection. Energy 2020, 191, 116544. [Google Scholar] [CrossRef]
  14. Zhuge, C.X.; Wei, B.R.; Shao, C.F.; Dong, C.J.; Meng, M.; Zhang, J. The potential influence of cost-related factors on the adoption of electric vehicle: An integrated micro-simulation approach. J. Clean Prod. 2020, 250, 119479. [Google Scholar] [CrossRef]
  15. Li, X.; Xiao, X.P.; Guo, H. A novel grey bass extended model considering price factors for the demand forecasting of European new energy vehicles. Neural Comput. Appl. 2022, 34, 11521–11537. [Google Scholar] [CrossRef]
  16. Hsieh, I.Y.L.; Kishimoto, P.N.; Green, W.H. Incorporating multiple uncertainties into projections of Chinese private car sales and stock. Transp. Res. Rec. 2018, 2672, 182–193. [Google Scholar] [CrossRef]
  17. Kumar, R.R.; Guha, P.; Chakraborty, A. Comparative assessment and selection of electric vehicle diffusion models: A global outlook. Energy 2022, 238, 16. [Google Scholar] [CrossRef]
  18. Rietmann, N.; Hugler, B.; Lieven, T. Forecasting the trajectory of electric vehicle sales and the consequences for worldwide CO2 emissions. J. Clean Prod. 2020, 261, 16. [Google Scholar] [CrossRef]
  19. Zhou, H.M.; Dang, Y.G.; Yang, Y.J.; Wang, J.J.; Yang, S.W. An optimized nonlinear time-varying grey Bernoulli model and its application in forecasting the stock and sales of electric vehicles. Energy 2023, 263, 14. [Google Scholar] [CrossRef]
  20. Pei, L.L.; Li, Q. Forecasting quarterly sales volume of the new energy vehicles industry in China using a data grouping approach-based nonlinear grey Bernoulli model. Sustainability 2019, 11, 1247. [Google Scholar] [CrossRef]
  21. Li, S.X.; Chen, H.; Zhang, G.F. Comparison of the short-term forecasting accuracy on battery electric vehicle between modified bass and Lotka-Volterra model: A case study of China. J. Adv. Transp. 2017, 2017, 7801837. [Google Scholar] [CrossRef]
  22. Zhang, M.Y.; Xu, H.Y.; Ma, N.; Pan, X.L. Intelligent vehicle sales prediction based on online public opinion and online search index. Sustainability 2022, 14, 10344. [Google Scholar] [CrossRef]
  23. Liu, B.C.; Song, C.Y.; Wang, Q.S.; Zhang, X.M.; Chen, J.L. Research on regional differences of China’s new energy vehicles promotion policies: A perspective of sales volume forecasting. Energy 2022, 248, 13. [Google Scholar] [CrossRef]
  24. Xia, Z.C.; Xue, S.; Wu, L.B.; Sun, J.X.; Chen, Y.J.; Zhang, R. Forexgboost: Passenger car sales prediction based on XGBoost. Distrib. Parallel Databases 2020, 38, 713–738. [Google Scholar] [CrossRef]
  25. Wu, M.F.; Chen, W. Forecast of electric vehicle sales in the world and China based on PCA-GRNN. Sustainability 2022, 14, 2206. [Google Scholar] [CrossRef]
  26. Liu, J.P.; Chen, L.J.; Luo, R.; Zhu, J.M. A combination model based on multi-angle feature extraction and sentiment analysis: Application to EVS sales forecasting. Expert Syst. Appl. 2023, 224, 13. [Google Scholar] [CrossRef]
  27. Ding, Y.; Wu, P.; Zhao, J.; Zhou, L.G. Forecasting product sales using text mining: A case study in new energy vehicle. Electron. Commer. Res. 2023, 33. [Google Scholar] [CrossRef]
  28. Sun, S.H.; Wang, W.C. Analysis on the market evolution of new energy vehicle based on population competition model. Transport. Res. Part D-Transport. Environ. 2018, 65, 36–50. [Google Scholar] [CrossRef]
  29. Guo, D.; Yan, W.; Gao, X.B.; Hao, Y.J.; Xu, Y.; Wenjuan, E.; Tan, X.C.; Zhang, T.Q. Forecast of passenger car market structure and environmental impact analysis in China. Sci. Total Environ. 2021, 772, 17. [Google Scholar] [CrossRef]
  30. Liu, Z.; Wang, X.H.; Zhang, Q.; Huang, C.Y. Empirical mode decomposition based hybrid ensemble model for electrical energy consumption forecasting of the cement grinding process. Measurement 2019, 138, 314–324. [Google Scholar] [CrossRef]
  31. Zhang, C.Q.; Liu, M.; Wang, D.Y.; Ni, A.N.; Xiao, G.N.; Lu, W.T. Linkage mechanism of public transport subsidy: Considering passenger ridership, cost, fare and service quality. Transp. Lett. 2022. [Google Scholar] [CrossRef]
  32. Chaturvedi, S.; Rajasekar, E.; Natarajan, S.; McCullen, N. A comparative assessment of SARIMA, LSTM RNN and Fb prophet models to forecast total and peak monthly energy demand for India. Energy Policy 2022, 168, 113097. [Google Scholar] [CrossRef]
  33. Guefano, S.; Tamba, J.G.; Azong, T.E.W.; Monkam, L. Forecast of electricity consumption in the Cameroonian residential sector by grey and vector autoregressive models. Energy 2021, 214, 118791. [Google Scholar] [CrossRef]
  34. Alashari, M.; El-Rayes, K.; Attalla, M.; Al-Ghzawi, M. Multivariate time series and regression models for forecasting annual maintenance costs of EPDM roofing systems. J. Build. Eng. 2022, 54, 104618. [Google Scholar] [CrossRef]
  35. Maqsood, H.; Maqsood, M.; Yasmin, S.; Mehmood, I.; Moon, J.; Rho, S. Analyzing the stock exchange markets of EU nations: A case study of brexit social media sentiment. Systems 2022, 10, 24. [Google Scholar] [CrossRef]
  36. Ahmed, Q.I.; Attar, H.; Amer, A.; Deif, M.A.; Solyman, A.A.A. Development of a hybrid support vector machine with grey wolf optimization algorithm for detection of the solar power plants anomalies. Systems 2023, 11, 237. [Google Scholar] [CrossRef]
  37. Guo, L.; Bai, L.F.; Liu, Y.X.; Yang, Y.Z.; Guo, X.H. Research on the impact of covid-19 on the spatiotemporal distribution of carbon dioxide emissions in China. Heliyon 2023, 9, e13963. [Google Scholar] [CrossRef]
  38. Ran, Q.Y.; Bu, F.B.; Razzaq, A.; Ge, W.F.; Peng, J.; Yang, X.D.; Xu, Y. When will China’s industrial carbon emissions peak? Evidence from machine learning. Environ. Sci. Pollut. Res. 2023, 30, 57960–57974. [Google Scholar] [CrossRef]
  39. Liu, Q.; Liu, J.; Gao, J.X.; Wang, J.J.; Han, J. An empirical study of early warning model on the number of coal mine accidents in China. Saf. Sci. 2020, 123, 104559. [Google Scholar] [CrossRef]
  40. Li, Y.; Huang, S.Y.; Miao, L.; Wu, Z. Simulation analysis of carbon peak path in China from a multi-scenario perspective: Evidence from random forest and back propagation neural network models. Environ. Sci. Pollut. Res. 2023, 30, 46711–46726. [Google Scholar] [CrossRef]
  41. Zhang, Y.; Zhong, M.; Geng, N.N.; Jiang, Y.J. Forecasting electric vehicles sales with univariate and multivariate time series models: The case of China. PLoS ONE 2017, 12, 15. [Google Scholar] [CrossRef] [PubMed]
  42. Ye, L.; Yang, D.L.; Dang, Y.G.; Wang, J.J. An enhanced multivariable dynamic time-delay discrete grey forecasting model for predicting China’s carbon emissions. Energy 2022, 249, 123681. [Google Scholar] [CrossRef]
  43. Liu, B.C.; Song, C.Y.; Liang, X.Q.; Lai, M.Z.; Yu, Z.C.; Ji, J. Regional differences in China’s electric vehicle sales forecasting: Under supply-demand policy scenarios. Energy Policy 2023, 177, 13. [Google Scholar] [CrossRef]
  44. Pelegov, D.V.; Chanaron, J.J. Electric car market analysis using open data: Sales, volatility assessment, and forecasting. Sustainability 2023, 15, 399. [Google Scholar] [CrossRef]
Figure 1. The research framework.
Systems 11 00431 g001
Figure 2. Annual sales of automobiles in China.
Systems 11 00431 g002
Figure 3. Fitting and prediction effect of univariate BP neural network model.
Systems 11 00431 g003
Figure 4. Fitting and prediction effect of quadratic exponential smoothing model.
Systems 11 00431 g004
Figure 5. Fitting and prediction effect of Prophet model.
Systems 11 00431 g005
Figure 6. Stability test of VAR (3) model.
Systems 11 00431 g006
Figure 7. Impulse response of traditional fuel vehicle sales.
Systems 11 00431 g007
Figure 8. Impulse response of battery electric vehicle sales.
Systems 11 00431 g008
Figure 9. Impulse response of plug-in hybrid vehicle sales.
Systems 11 00431 g009
Figure 10. Fitting and prediction effect of VAR (3) model.
Systems 11 00431 g010
Figure 11. Fitting and prediction effect of SVM model.
Systems 11 00431 g011
Figure 12. Fitting and prediction effect of multivariate BP neural network model.
Systems 11 00431 g012
Figure 13. Logarithmic prediction results and reduction values of vehicle sales with different power types. (a) Logarithmic prediction of traditional fuel vehicle sales; (b) Reduction value of logarithmic prediction of traditional fuel vehicle sales; (c) Logarithmic prediction of battery electric vehicle sales; (d) Reduction value of logarithmic prediction of battery electric vehicle sales; (e) Logarithmic prediction of plug-in hybrid vehicle sales; (f) Reduction value of logarithmic prediction of plug-in hybrid vehicle sales.
Systems 11 00431 g013aSystems 11 00431 g013b
Table 1. Influencing factors of vehicle sales.
VariableMeaningVariableMeaning
Y1Sales volume of traditional fuel vehicles
(units)
X7Average price of new energy vehicles
(10,000 CNY)
Y2Sales volume of battery electric vehicles
(units)
X8Patents granted for electric vehicles
(units)
Y3Sales volume of plug-in hybrid vehicles
(units)
X9Effective patents granted for power batteries
(units)
X1Consumer price index
(%)
X10Output of lithium-ion batteries
(million units)
X2Customs exports
(100 million USD)
X11Hydroelectric power generation
(100 million kWh)
X3Customs imports
(100 million USD)
X12Nuclear power generation
(100 million kWh)
X4Total value of imports
(1000 USD)
X13Employee index
(%)
X5Total export value
(1000 USD)
X14Highway passenger traffic
(ten thousand people)
X6Average price of traditional fuel vehicles
(10,000 CNY)
Table 2. Parameter settings of univariate BP neural network model.
Target SequenceNumber of PliesActivation Function of Each LayerNumber of NeuronsTraining TimesLearning RateLoss Function
Traditional fuel vehicle3‘relu’, ‘relu’, ‘linear’12 × 6 × 15000.0001MSE
Battery electric vehicle3‘relu’, ‘relu’, ‘linear’12 × 7 × 16000.0001MSE
Plug-in hybrid vehicle3‘relu’, ‘relu’, ‘linear’12 × 7 × 15000.0001MSE
Table 3. Fitting and prediction errors of univariate prediction models.
ModelError TypeEvaluating IndicatorICEBEVPHEV
BP Neural Network Fitting ErrorMAPE1.042%2.488%2.214%
RMSE0.2620.4050.329
Predicting ErrorMAPE0.956%1.921%2.591%
RMSE0.2400.2980.335
Quadratic Exponential Smoothing Fitting ErrorMAPE0.606%1.621%1.708%
RMSE0.1500.2760.241
Predicting ErrorMAPE1.296%1.816%1.412%
RMSE0.2340.2740.231
ProphetFitting ErrorMAPE0.688%1.715%2.842%
RMSE0.1420.2670.357
Predicting ErrorMAPE2.068%3.382%1.605%
RMSE0.3630.5960.296
Table 4. ADF test results.
VariableInspection TypeADF1% Critical Value5% Critical Value10% Critical ValueProbStationarity
LNY1(C, T, 0)−6.3515 −4.0925 −3.4744 −3.1645 0.0000 stationary
LNY2(C, T, 0)−4.8055 −4.0925 −3.4744 −3.1645 0.0011 stationary
LNY3(C, T, 0)−4.6803 −4.0925 −3.4744 −3.1645 0.0017 stationary
LNX1(C, T, 1)−6.6209 −4.0946 −3.4753 −3.1650 0.0000 stationary
LNX2(C, T, 0)−5.8395 −4.0925 −3.4744 −3.1645 0.0000 stationary
LNX3(C, T, 0)−5.1623 −4.0925 −3.4744 −3.1645 0.0003 stationary
LNX4(C, T, 0)−5.2278 −4.0925 −3.4744 −3.1645 0.0003 stationary
LNX5(C, T, 0)−5.3067 −4.0925 −3.4744 −3.1645 0.0002 stationary
LNX6(C, T, 0)−7.7677 −4.0925 −3.4744 −3.1645 0.0000 stationary
LNX7(C, T, 0)−8.2087 −4.0925 −3.4744 −3.1645 0.0000 stationary
LNX8(C, T, 0)−8.9109 −4.0925 −3.4744 −3.1645 0.0000 stationary
LNX9(C, T, 0)−4.2731 −4.0925 −3.4744 −3.1645 0.0059 stationary
LNX10(C, T, 5)−7.5827 −4.1032 −3.4794 −3.1674 0.0000 stationary
LNX11(C, T, 1)−5.4392 −4.0946 −3.4753 −3.1650 0.0001 stationary
LNX12(C, T, 0)−7.9333 −4.0925 −3.4744 −3.1645 0.0000 stationary
LNX13(C, T, 0)−4.1356 −4.0925 −3.4744 −3.1645 0.0088 stationary
LNX14(C, T, 0)−6.3515 −4.0925 −3.4744 −3.1645 0.0000 stationary
Table 5. Optimal lag order.
LagLogLLRFPEAICSCHQ
01109.297NA1.99 × 10−35−31.66079−31.11036−31.44242
11783.608996.80693.46 × 10−40−42.82922−32.92144−38.89847
22195.351405.77544.64 × 10−41−46.38698−27.12185−38.74386
33304.615546.5942 *8.68 × 10−49 *−70.16276 *−41.54030 *−58.80728 *
* indicates lag order selected by the criterion.
Table 6. Parameter estimation results of VAR (3) model.
Influencing
Factors
LNY1LNY2LNY3Influencing
Factors
LNY1LNY2LNY3Influencing
Factors
LNY1LNY2LNY3
LNX1 (−1)−0.63112.76718.913LNX7 (−1)−0.551−2.106−2.307LNX13 (−1)3.74313.676−1.277
LNX1 (−2)3.979−8.36810.437LNX7 (−2)−0.342−0.8840.000LNX13 (−2)−4.5862.20611.620
LNX1 (−3)7.13452.14454.138LNX7 (−3)0.1831.5220.118LNX13 (−3)3.2485.0351.930
LNX2 (−1)−3.0085.27214.088LNX8 (−1)0.0080.1810.440LNX14 (−1)0.105−2.728−2.396
LNX2 (−2)3.82712.09211.119LNX8 (−2)0.0880.3520.280LNX14 (−2)−0.2531.7930.745
LNX2 (−3)1.1513.4420.740LNX8 (−3)0.0370.2890.043LNX14 (−3)−0.3730.2740.061
LNX3 (−1)9.7105.2023.057LNX9 (−1)0.1540.1420.570LNY1 (−1)−0.502−0.263−0.054
LNX3 (−2)0.049−34.069−60.848LNX9 (−2)0.1760.5331.072LNY1 (−2)0.259−0.781−1.590
LNX3 (−3)−13.110−29.194−5.944LNX9 (−3)0.0880.2270.732LNY1 (−3)−0.006−0.6190.135
LNX4 (−1)2.084−6.401−16.612LNX10 (−1)0.388−0.4360.449LNY2 (−1)0.1830.198−0.078
LNX4 (−2)−5.447−13.362−13.635LNX10 (−2)−0.272−1.021−0.649LNY2 (−2)−0.025−0.2020.441
LNX4 (−3)−1.815−3.493−1.794LNX10 (−3)0.0441.3020.321LNY2 (−3)0.1180.4610.089
LNX5 (−1)−8.802−4.380−3.387LNX11 (−1)−0.1051.2800.911LNY3 (−1)−0.362−0.846−0.477
LNX5 (−2)0.62834.11760.329LNX11 (−2)0.133−1.581−1.070LNY3 (−2)−0.0540.3260.276
LNX5 (−3)12.73126.8986.157LNX11 (−3)0.7940.9480.718LNY3 (−3)0.1630.9330.736
LNX6 (−1)−0.1491.5261.468LNX12 (−1)0.2671.8060.429C−12.037−666.481−697.181
LNX6 (−2)−0.1690.6340.759LNX12 (−2)−0.763−5.404−2.570
LNX6 (−3)−0.245−0.906−0.932LNX12 (−3)−0.5352.621−1.327
Table 7. Parameter settings of univariate BP neural network model.
ParameterNumber of PliesActivation Function of Each LayerNumber of NeuronsTraining TimesLearning RateLoss Function
Value3‘relu’, ‘relu’, ‘linear’51 × 9 × 35000.0001MSE
Table 8. Fitting and prediction errors of multivariate prediction models.
ModelError TypeEvaluating IndicatorICEBEVPHEV
VARFitting ErrorMAPE0.145%0.894%1.014%
RMSE0.0270.1270.135
Predicting ErrorMAPE2.565%4.190%4.863%
RMSE0.4580.6930.682
SVMFitting ErrorMAPE0.533%1.488%1.807%
RMSE0.1470.3040.345
Predicting ErrorMAPE1.280%2.389%2.168%
RMSE0.3810.5980.512
BP Neural NetworkFitting ErrorMAPE0.321%1.088%1.357%
RMSE0.0680.1690.179
Predicting ErrorMAPE1.810%2.810%3.384%
RMSE0.3240.4820.496
Table 9. Research and comparison on prediction of vehicles.
Authors (Year)ModelsCasesPerformance
Liu et al. (2023) [43]GRA-DWT-BiLSTMThe electric vehicle sales in ChinaMAPE: 9.411%
Zhang, et al. (2022) [22]LSTMThe vehicle sales of NIOMAPE: 9.7718%
The vehicle sales of XPengMAPE: 5.899%
Liu et al. (2022) [1]DWT-BiLSTMThe electric vehicle sales in ChinaMAPE: 6.04%
Ding and Li (2021) [2]ESOGM (1, 1)Global electric vehicle salesMAPE: 6.92%
Pei and Li (2022) [20]DGA-based NGBM (1, 1)The quarterly sales of new energy vehicles in ChinaRMSE: 23,907.59
MAPE: 7.26%
Table 10. Advantages and disadvantages of univariate prediction models and multivariate prediction models.
Advantages and DisadvantagesUnivariate Prediction ModelsMultivariate Prediction Models
AdvantagesEffectively capture the trends and changing rules contained in the historical sales data of automobiles.Make full use of the relationship between automobile sales and various factors to improve the generalization ability of the automobile sales forecasting model.
DisadvantagesOnly one characteristic parameter is considered, and the information extracted is limited, which cannot reflect the influence of other variables in the system on automobile sales.It is difficult to define the system boundary, and too many influencing factors may affect the extraction of automobile sales trend information.
Disclaimer/Publisher’s Note: The statements, opinions and data contained in all publications are solely those of the individual author(s) and contributor(s) and not of MDPI and/or the editor(s). MDPI and/or the editor(s) disclaim responsibility for any injury to people or property resulting from any ideas, methods, instructions or products referred to in the content.

