
The Impacts of Payment Policy on Performance of Human Resource Market System: Agent-Based Modeling and Simulation of Growth-Oriented Firms


Abstract
:1. Introduction
2. Literature Review
2.1. Human Resources and Payment
2.2. Growth-Oriented Firms
2.3. Summary of the Literature and the Research Gap
3. Method and Data
3.1. Method
3.2. Data
4. Model Description
4.1. Model Assumptions
- Workers can only demonstrate their capabilities by moving from one job to another [6], i.e., changing jobs for a pay raise, due to deficient management capabilities at growth-oriented firms;
- Since firms are prone to salary competition for talent [7], workers will receive base pay and incentives from the new firm that exceeds their previous salary (still within the payment cap).
- Worker payment consists of base pay and incentives [58]; working years are associated with worker output, and higher output helps workers to attain better job opportunities;
- Workers can receive a pay raise at each post adjustment, but their payment does not exceed the payment cap (in this case, 10% of company profits); because the widening payment gap among workers may undermine productivity, increase attrition, or even harm corporate performance [59], the actual policy developments are also considered;
- The salary in this paper is based on the theoretical model of 3P1M, and the enterprise output follows the Matthew effect; in this paper, the workers are divided into senior and junior groups according to a ratio of 0.2:0.8, while the weight ratio of the two groups is set at 0.8:0.2 to measure the equilibrium output;
- The dismissal mechanism is developed; Peter’s principle states that when workers reach Peter’s plateau, a high level where they are no longer competent, more workers are needed to finish the work. Unfortunately, this is not the correct solution, because new workers will eventually reach Peter’s plateau as well, and the vicious circle will continue. Inevitably, this leads to an excessive number of workers compared with the actual working needs, thus reducing the organizational efficiency.
4.2. Agents and Variables
4.2.1. Worker Agents
- Exogenous variables
- : effort level; it is random within (0, 1) and remains constant throughout the experiment.
- : initial working years; it is a random integer within (0, 60), representing the working capability and practical experience.
- : significance attached to incentives by workers (the reverse is the significance attached to the firm value). The utility equation of the agent’s decision making is shown in Equation (1) with two major influence factors: the significance attached to the incentive and to the enterprise value. The firm value displays the future growth potential of the enterprise with the initial value set at 0.5 (see Section 6.2 for the impact analysis of different values of this variable); when the two factors are equally important, the equation takes the CDU model.
- : ratio of firms searched by workers at each time. We assume that workers will search for some companies and compare them and then select one to submit a resume to at each time step, and the initial value of the search ratio is 0.2 (see Section 6.2 for the impact analysis of different values of this variable).
- Endogenous variablesNext, we briefly introduce the endogenous variables and their value ranges. The specific change rules are illustrated in Section 4.3.1.
- : working years;f the agent is at work, the working years will increase with the time step.
- : whether worker i applies for firm j; it is binary. When worker i chooses to apply for a job at firm j, the value of is 1; otherwise, it is 0.
- : hired or not; it is binary. When the worker is on the job, the value of is 1; otherwise, the value of is 0.
4.2.2. Firm Agents
- Exogenous variables
- : the coefficient of incentives (or the incentive level) is heterogeneous. Once the agent is generated, the incentive level can be any value within (0, 1) and remains constant throughout the experiment.
- the initial pay for non-job-hopping workers (i.e., workers who were initially unemployed) is within (8000, 10,000). Such values are assigned randomly to firm agents and remain unchanged throughout the experiment.
- and are binary values. is 1, meaning that the firm selects RP1; otherwise, it represents RP2. Similarly, is 1 for DP1; otherwise, it is for DP2. During the experiment, firm agents are randomly assigned recruitment and dismissal plans, and the proportion of agents choosing different plans is adjusted by and (see the section on environmental subjects for their specific definitions).
- Endogenous variables
- denotes the average output of senior workers, i.e., the firm’s top 20% workers. denotes the average output of ordinary workers, i.e., those workers whose output is lower than that of the top 20% in the firm. denotes the output of the firm, calculated regarding Equation (6). According to the output formula in Equation (6), the above three variables’ ranges are .
- and denote the income level and profit level of the firm. is the sum of profits at each time step. When the firm has a negative profit in the current time step, it will dismiss workers according to the chosen dismissal plan; when the equity in the time step becomes negative, the enterprise goes bankrupt and exits the market, and a new enterprise will enter the market.
- is the list of workers at work in firm j in period t.
4.2.3. Environment Agent
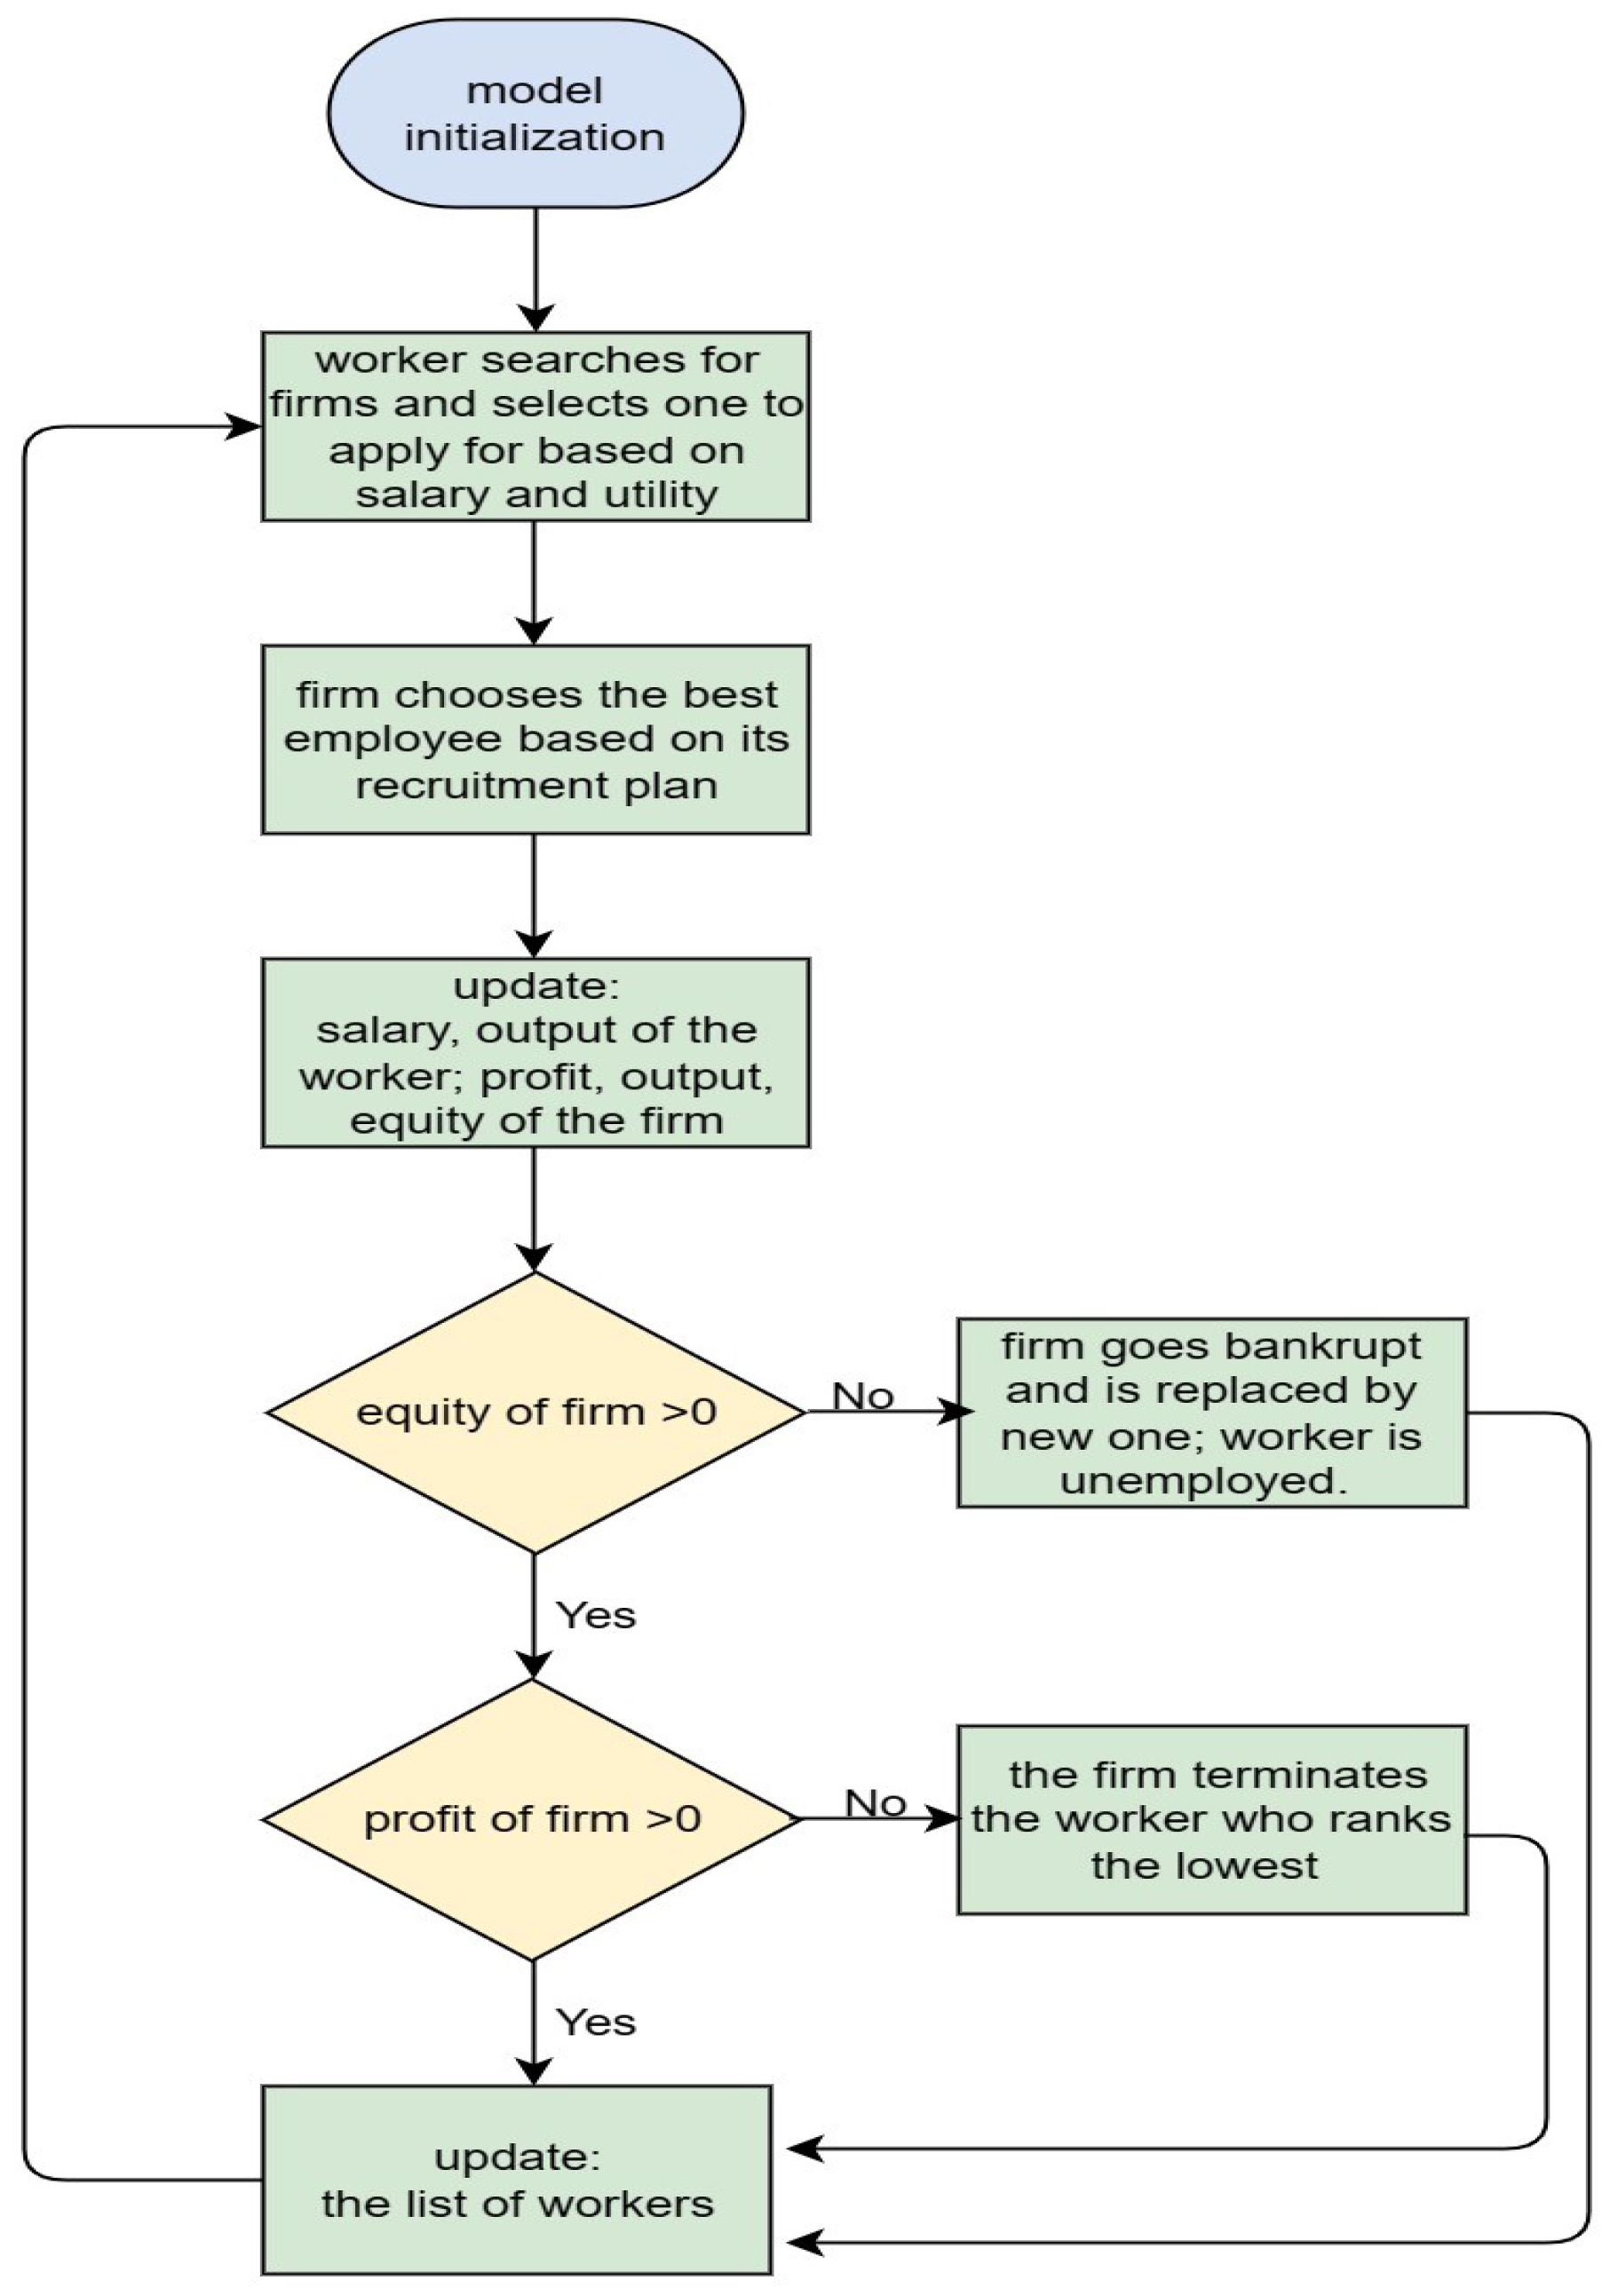
4.3. Agent Behavior
4.3.1. Worker Agents
- Selecting firms: in the initial stage, the status of all worker agents is “unemployed”. At each time step, the agent can search for firms and apply for positions in which they can maximize their utilities. The agent considers three factors to optimize the selection process of the firm.(i) The pay and incentive level of the target firm . When the agent is employed by the firm for the first time, he or she can receive only the initial payment level and will attain the incentive payment of the firm only after he or she changes employment. (ii) Personal utility: the agent’s utility depends on the payment incentive of the target firm and the equity of the target firm . We use the Cobb–Douglas utility function to assign weights (sum to one) to the two factors to express the importance that the agent attaches to them, as the distribution coefficient , as illustrated in Equation (1).The target firm’s assets reflect how well the firm is doing. (iii) Anticipated payment. The agent can obtain higher compensation based on their incentive level when they switch to another firm, but, at the same time, they are subject to the payment cap policy. Whether the agent i applies for a job at the firm j is expressed as follows:
- Updating yield level: When the worker agent successfully applies for a new job, his status will update to “employed”. The worker with an “employed” status updates his employment length one time step, as shown in the following formula:Meanwhile, the production level is updated, as shown in the following formula:With efforts remaining unchanged, an increasing employment length can also enhance the production level. The above description supports the idea that work experience can enhance capability. Meanwhile, considering that growth-oriented firms usually are closely related to the high-tech industry, the learning capability of the agent will slow down when reaching a certain level. Therefore, it is set as Equation (4) above shows.
- Updating payment or salary: According to the hypothesis, the worker agent can only attain higher pay by job hopping. The main reason is that the poor internal management of growing firms renders them incapable of evaluating their employees promptly and offering a raise accordingly. At the same time, talent competition is critical for firms. More capable workers are more likely to be paid more. Therefore, this paper assumes that the pay level of the agent after successfully applying for a new job is as follows:
4.3.2. Firm Agents
- Selecting worker: After the firm receives an application from a worker agent, it ranks the workers according to the recruitment plan and chooses the most suitable applicant. At the same time, the firm agent updates its status as per the following procedure.
- Updating output and revenue: The firm categorizes its employees into seniors and juniors according to the assumption based on the Matthew effect, as mentioned previously, and calculates the output of the firm as follows:After the production level of different firms is calculated, the income level is confirmed according to the proportion of its indexation level to the overall indexation level, as shown in the following:
- Updating profit and wealth: To better focus on the study of human resource management relevant to salary, we only consider the payment’s impact on the firm’s profit.We sum up the firm profit of each session, and this sum is the equity level:
- Dismissal mechanism: We discuss the mechanism that triggers the dismissal of employees. When a firm’s profit becomes negative, it means that the current income of the firm can no longer sustain its payment expenditure, and the firm will start to dismiss employees according to DP1 or DP2. Considering that growing firms may expand in a disorderly manner—that is, to attract talent, they continue to offer high salaries—we set a threshold for bankruptcy. When is negative, the firm goes bankrupt and exits the market. Because the industry to which the growing firms belong is developing rapidly, the exiting firms will be replaced by new ones quickly. Therefore, the number of firms in the market remains unchanged, as there are always new firms replacing those exiting the market.
- Hiring or firing: In general, the decision-making practices of the firms or the listed conditions of firm employees are subject to the influence of the following factors and are expressed as
4.3.3. Environment Agents
5. Simulation Experiment Design
5.1. Benchmark Case
5.2. Description of Experiment Design
6. Results and Discussion
6.1. Simulation Results Analysis
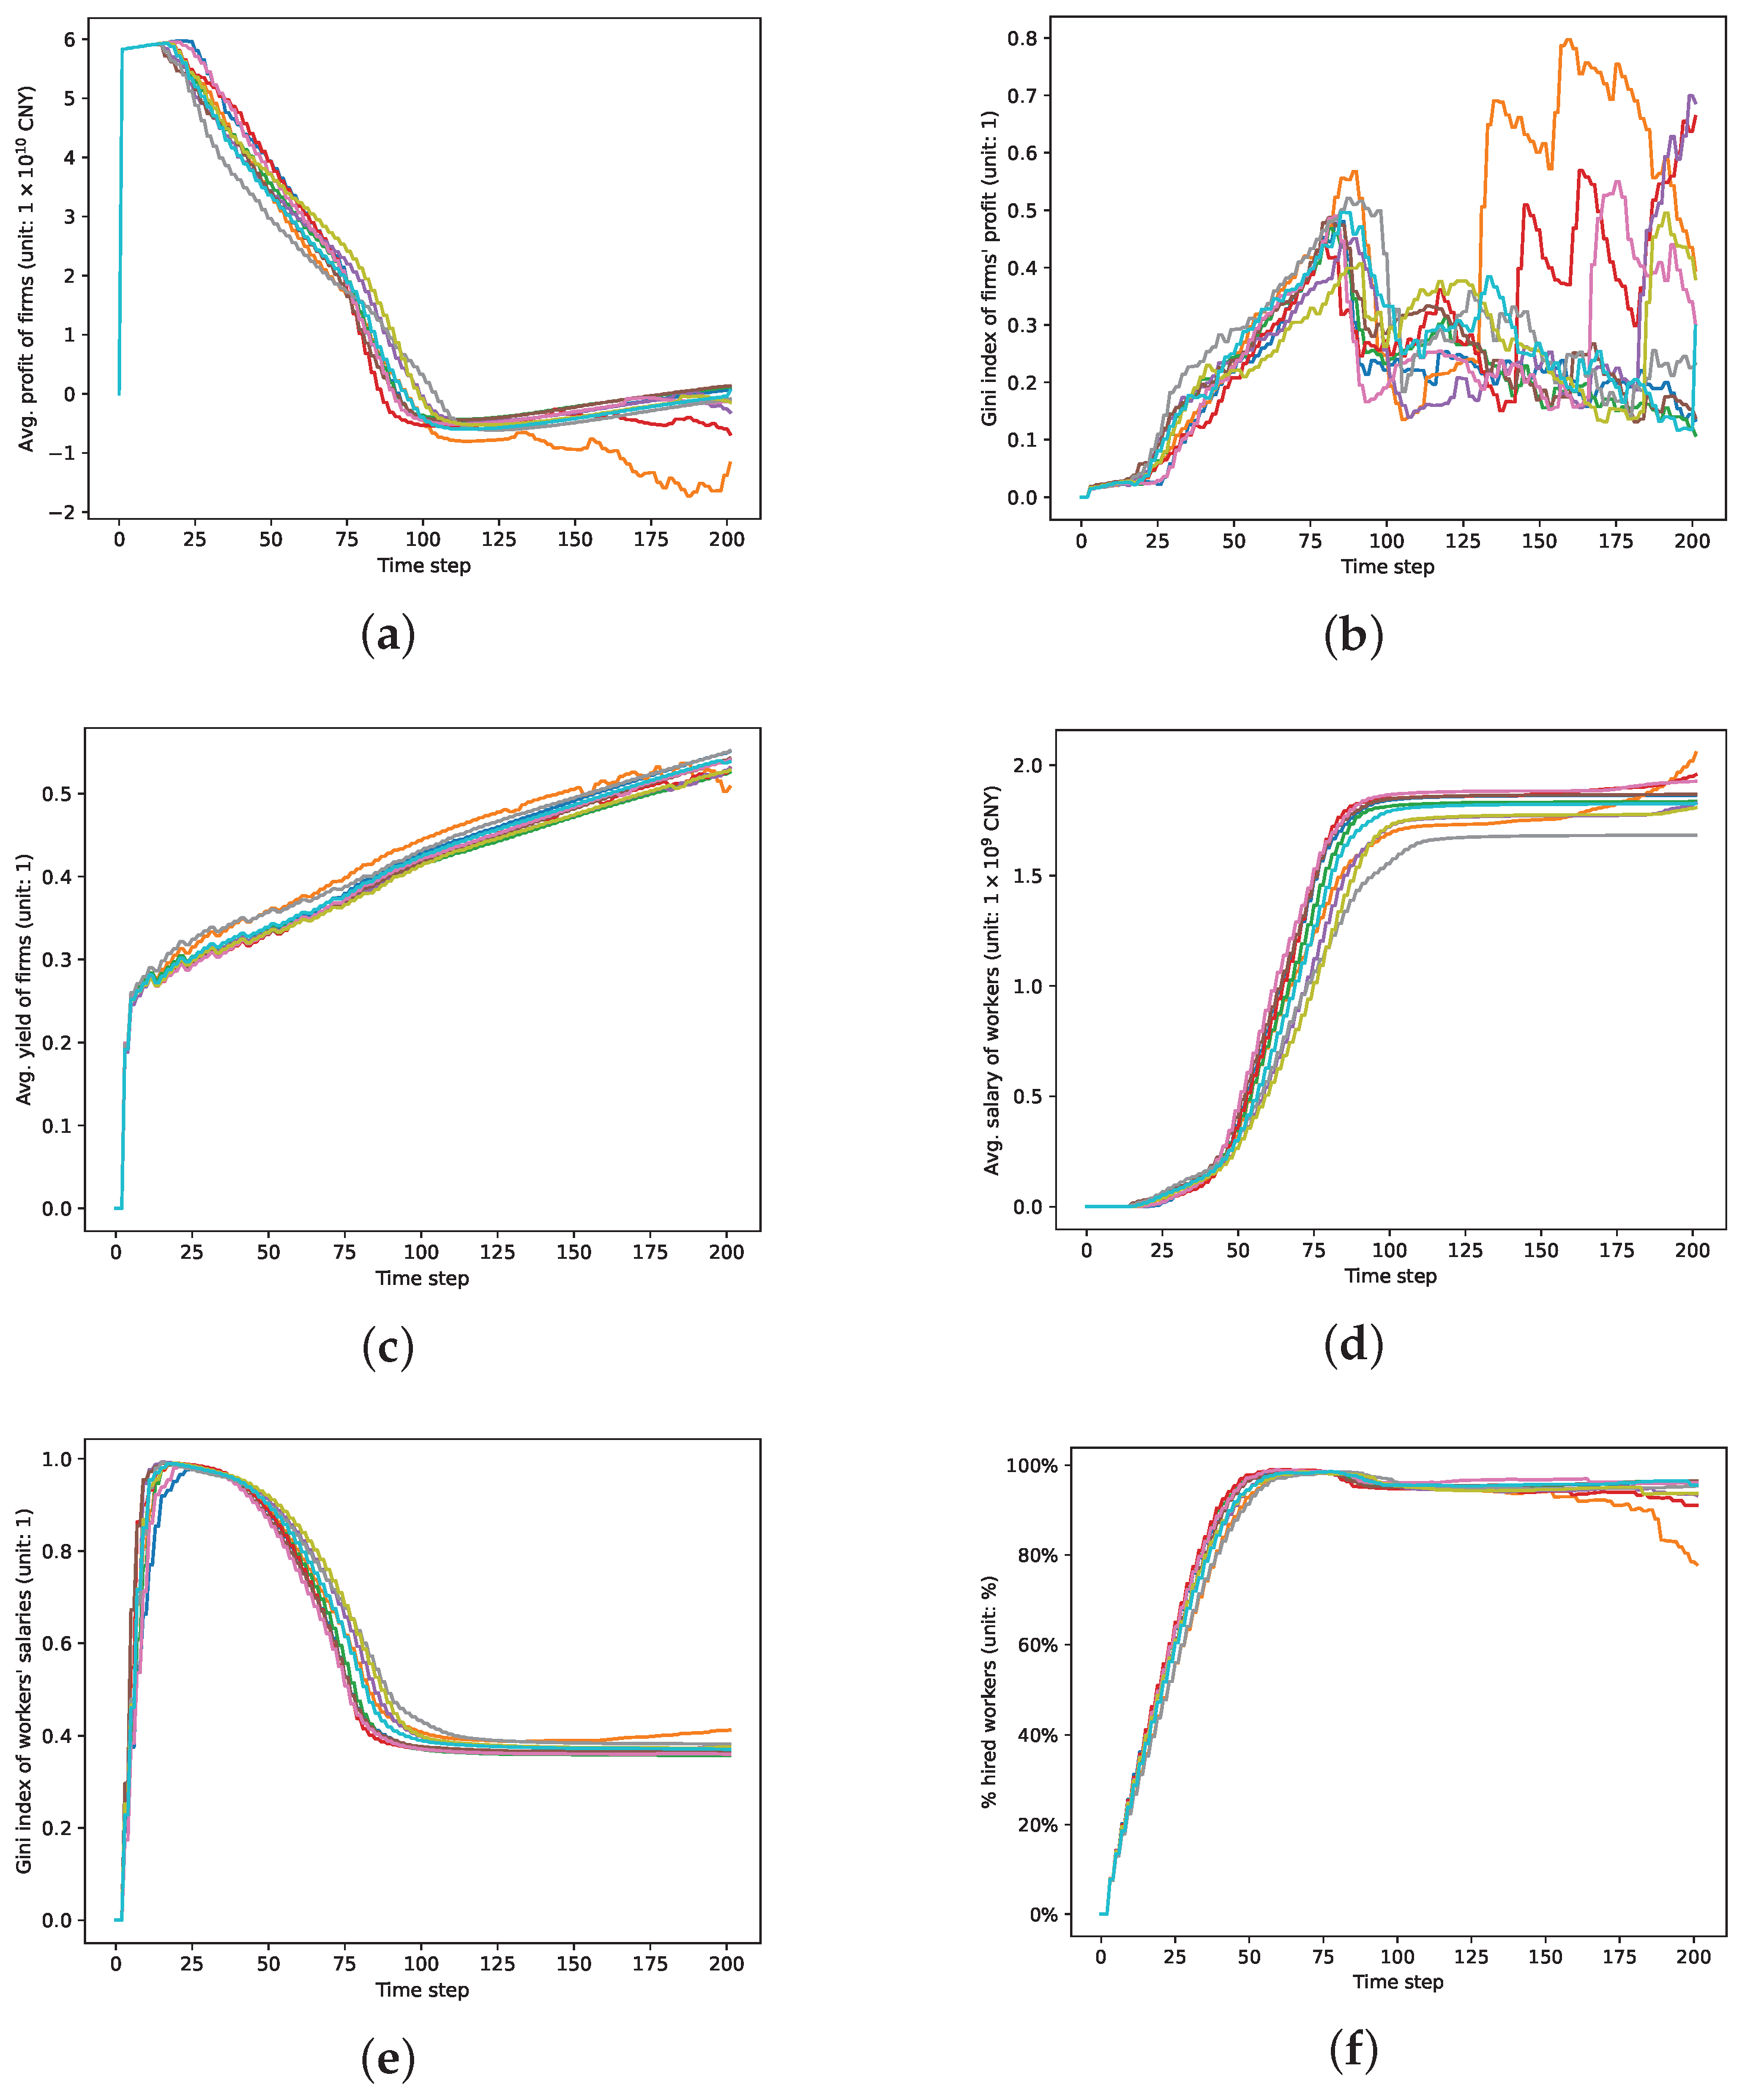
- In Figure 3a, the average profit of the firm falls first and then increases in general, with a relatively rapid descending rate within the decline interval and a gentle ascending rate in the rising interval. With the progression of the time steps, the graph shows a clear trend of fluctuation. The figure reflects the impact of changes in the average pay of workers. The sharp increase in average pay leads to a sharp reduction in firm profit margins and even results in a negative average profit. The payment cap policy suppresses the rapid growth of workers’ salaries while offering firms opportunities for stable development. With the expansion of the market volume, the growth in average profit gradually recovers. Meanwhile, we also notice subsequent fluctuations, which could possibly be due to the fact that particular firms cannot afford the payment costs and thus register a negative profit and incur an overall profit decrease.
- Figure 3b shows that the Gini coefficient of the firm’s profit first rises and then decreases, followed by violent fluctuations. The simulation results reveal two points that are different from the indexes of other simulations. Firstly, although different simulations exhibit similar trends, they do not precisely converge, especially after fluctuations occur. Secondly, the trends of fluctuations in different simulations vary from each other. We believe that such results occur because some enterprises might go bankrupt in different simulation environments, but this situation does not emerge in every experiment, and its timing also differs.
- Figure 3c reveals that the firm’s average outputs frequently fluctuate in the early stages, first decreasing gently and then increasing. Then, they undergo a stable increase stage and later a fluctuating increase. The overall upward trend aligns with the firm’s development and setting. Frequent job changes by workers may cause temporary fluctuations in the early stage. Moreover, as the salary cap policy takes effect, the fluctuations become even less noticeable.
- As shown in Figure 3d, the average employee pay rises rapidly at first, stabilizes for a while, and then starts to rise again. This might be due to employees receiving low wages at the beginning of the simulation. With the accumulation of work experience, they gain “wage bargaining power,” and the average pay increases exponentially. Because the market’s growth rate can no longer keep up with the pay increase, the salary cap policy slows the ascending trend of the average pay. However, in general, continuous market growth will raise the threshold of workers’ salary caps, and the average salary will rise.
- Figure 3e shows that the Gini coefficient of workers’ compensation decreases first, then flattens out, and finally stabilizes at a certain value. With an increase in newly hired employees, the difference in payment gradually narrows. The Gini coefficient tends to stabilize after reaching a certain level. This is probably because the payment level depends on workers’ efficiency (level of proficiency), and thus the difference typically remains unchanged.
- In Figure 3f, the employment rate of workers in the simulation shows a rapid increase. It approaches 1 and then declines slightly and registers a downward trend after a relatively stable period. In the early stages of industry development, firms’ demand for workers is enormous. Only the firms with enough workers can achieve high output, and so the employment rate increases rapidly during the early stages. When it reaches a certain level, there might be a situation in which the firm’s profits in a single period are negative and it may have to lay off workers. Thus, the employment rate decreases slightly in this period because former employees cannot find new jobs immediately. During a period in which average salaries and average profits are relatively stable, the employment rate also remains relatively stable. Possible reasons for this are that the payment cap policy contributes to a stable level of average profit and there are fewer firms registering negative profits and conducting layoffs in multiple periods (including layoffs over multiple periods by a single firm and layoffs in a single period by multiple firms).
- In the early stages of market development, workers have recently entered the market, and their salaries are all at the base level. At this time, the number of employees that firms are able to attract is limited, and only firms with enough employees can engage in production activities, make a profit, and obtain a relatively high income. In such conditions, the salaries of workers generally cannot reach the salary cap threshold.
- The results of firms’ efforts to recruit are evident. Workers who have already been employed will move to another firm that offers higher salaries, resulting in a rapid increase in the payment level in the graph. However, this places a burden on firms’ operations. As the overall market conditions improve, the firms’ average profit declines due to skyrocketing payment costs.
6.2. Analysis of Experimental Results
- The factor (the distribution of emphasis on incentive payment and emphasis on firm’s value) does not have a significant impact.The reason is that the number of firms is relatively small, while the market size is large in the simulation. Therefore, the development of most firms is smooth; thus, the importance of corporate value is insignificant. Additionally, it could be the case that the increase in the firm’s value will not impact the actual salaries that employees receive after joining the firm. To attain a higher salary, workers still need to switch between different firms. Therefore, the corporate value of a firm will only temporarily affect those who seek a new job.
- The non-significance of might be related to the configuration of the model. Regardless of the number of firms that a worker searches in a single period, she or he can only apply for one position, which could directly cause the non-significance of .
- There is a reason for the non-significance of the index. Different recruitment plans may impact the rise in average pay. However, there are two plans that can be used to dismiss an employee: choosing the employee who produces the lowest output in relation to the unit payment or simply the one with the lowest output. Both plans may point to the same candidate. In this case, choosing a different plan does not have a significant impact on the various indexes of firms and workers. We also observe that , the intersection effect between and , is not significant either.
6.3. The Payment Cap Policy and Insights of Results
- First, the experiment showed that a payment cap policy significantly affected company management. Notably, this policy had a bearing on the turning points and output indicators after a certain trend. A simulation experiment was also carried out with no such policy, and the result showed that companies without a payment cap policy obtained significantly reduced profits at large, a situation directly caused by the rapid increase in employee salary. These companies were highly likely to declare bankruptcy, which entails a loss of jobs and no income for employees. From this perspective, the importance of the payment cap policy should not be underestimated. Pan et al. (2020) showed that the pay gap between senior executives and ordinary employees negatively impacted enterprises’ innovation efficiency [4]. This is of similar significance to our research conclusion. The payment cap policy is also a means to reduce the wage gap. The policy also benefits the survival and development of growth-oriented enterprises.
- Second, the experiment showed that a company’s recruitment plan presented a significant influence on its average profit, profit Gini, average output, average salary, and payment Gini, but it was not so impactful on the employment rate. This is consistent with the conclusions of Aslam et al. (2023) [64], which pointed out that compensation, recruitment, and selection positively impact small and medium-sized enterprises’ performance, such as labor productivity and product innovation. However, the dismissal plan had no significant influence on these indicators. This indicated that the recruitment plan was more important for the company than the dismissal plan in terms of company development and the social status of employees. In addition, the recruitment plan was critical not only to corporate management but also to the salary levels of employees.
- Third, the worker Gini coefficient decreased at the beginning, and it then became stable. It was noted that along with the development of the industry and the growth of an individual company, the salary gap between employees was dwindling and was not narrowed to zero. Instead, it could be kept at a stable level. The payment gap, however, continued to exist as employees had different working abilities. As the industry prospers, the salary for the same position in different companies will nearly be the same [8]. In other words, when the industry grows to a certain scale, employees with the same working ability will obtain equal pay regardless of the company that they work for.
- As can be seen from the above conclusions, payment and recruitment policies are very important for the development of growth-oriented enterprises. Therefore, for policymakers, appropriate payment cap policies should be introduced to help growth-oriented enterprises to successfully overcome the difficulties of early development, caused by the pressure of payment, to ensure that more firms can survive in the market. For entrepreneurs, on the one hand, they should start with internal salary management and adjust the salary gap and excessive salary payment appropriately for the firm’s long-term development. On the other hand, we should pay attention to the selection of recruitment strategies and the importance of recruitment for HRM. Finally, investors who wish to invest in growth-oriented enterprises should pay attention not only to the profits and assets but also to the HRM strategies of the enterprise, so that they can identify the inherent potential or detect crises in advance.
- Furthermore, the conclusions of this research are in line with reality, which indicates the practicability of the model. Growth-oriented companies seek talent in the initial stage, which will result in a rapid increase in employee salary and a decrease in company profit. When the company grows to a certain level, the adoption of the payment cap policy ensures the company’s profit space, better operational performance, and better human resource management. The employee salary will also increase slightly. The variation in the employee salary’s Gini coefficient could account for the equal pay of employees with similar working abilities.
7. Conclusions and Future Research
Author Contributions
Funding
Institutional Review Board Statement
Informed Consent Statement
Data Availability Statement
Acknowledgments
Conflicts of Interest
Abbreviations
| HRM | Human Resource Management |
| RP | Recruitment Plan |
| DP | Dismissal Plan |
References
- Cornely, P.B.; Anderson, O.W. Health Services in the United States: A Growth Enterprise Since 1875. J. Public Health Policy 1986, 7, 556. [Google Scholar] [CrossRef]
- Gerhart, B.; Feng, J. The Resource-Based View of the Firm, Human Resources, and Human Capital: Progress and Prospects. J. Manag. 2021, 47, 1796–1819. [Google Scholar] [CrossRef]
- Li, R.; Du, Y.F.; Tang, H.J.; Boadu, F.; Xue, M. MNEs’ Subsidiary HRM Practices and Firm Innovative Performance: A Tacit Knowledge Approach. Sustainability 2019, 11, 1388. [Google Scholar] [CrossRef] [Green Version]
- Pan, X.; Wan, X.; Wang, H.; Li, Y. The Correlation Analysis between Salary Gap and Enterprise Innovation Efficiency Based on the Entrepreneur Psychology. Front. Psychol. 2020, 11, 1749. [Google Scholar] [CrossRef] [PubMed]
- Fotopoulos, G. Knowledge Spillovers, Entrepreneurial Ecosystems and the Geography of High Growth Firms. Entrep. Theory Pract. 2022, 104225872211117. [Google Scholar] [CrossRef]
- Flovik, S.; Moudnib, R.A.; Vassilakopoulou, P. Determinants of Blockchain Technology Introduction in Organizations: An Empirical Study among Experienced Practitioners. Procedia Comput. Sci. 2021, 181, 664–670. [Google Scholar] [CrossRef]
- Zhou, N.; Park, S.H. Growth or profit? Strategic orientations and long-term performance in China. Strategic Manag. J. 2020, 41, 2050–2071. [Google Scholar] [CrossRef]
- Hung, C.C.; Lim, E.P. On Aggregating Salaries of Occupations From Job Post and Review Data. IEEE Access 2021, 9, 43422–43433. [Google Scholar] [CrossRef]
- Pulka, B.M.; Ramli, A.; Mohamad, A. Entrepreneurial competencies, entrepreneurial orientation, entrepreneurial network, government business support and SMEs performance. The moderating role of the external environment. J. Small Bus. Enterp. Dev. 2021, 28, 586–618. [Google Scholar] [CrossRef]
- Soltis, S.M.; Brass, D.J.; Lepak, D.P. Social Resource Management: Integrating Social Network Theory and Human Resource Management. Acad. Manag. Ann. 2018, 12, 537–573. [Google Scholar] [CrossRef]
- Delery, J.E.; Roumpi, D. Strategic human resource management, human capital and competitive advantage: Is the field going in circles? Hum. Resour. Manag. J. 2017, 27, 1–21. [Google Scholar] [CrossRef] [Green Version]
- Otmakhova, Y.S.; Devyatkin, D.A.; Tikhomirov, I.A. Methods for Evaluation of the Region’s Needs for Human Resources based on Statistics and Patent Landscapes. Econ. Reg. 2022, 18, 569–580. [Google Scholar] [CrossRef]
- Pirrolas, O.A.C.; Correia, P.M.A.R. Human Resources Churning. Encyclopedia 2023, 3, 582–589. [Google Scholar] [CrossRef]
- Babkin, I.; Pulyaeva, V.; Ivanova, I.; Veys, Y.; Makhmudova, G. Developing a System for Monitoring Human Resource Risks in a Digital Economy. Risks 2023, 11, 82. [Google Scholar] [CrossRef]
- Dossinger, K.; Wanberg, C.R.; Choi, Y.; Leslie, L.M. The beauty premium: The role of organizational sponsorship in the relationship between physical attractiveness and early career salaries. J. Vocat. Behav. 2019, 112, 109–121. [Google Scholar] [CrossRef]
- Balogh, G.; Sipos, N. Is it worth for bachelor graduates to diversify study programme for master level? Int. J. Educ. Manag. 2020, 34, 1387–1401. [Google Scholar] [CrossRef]
- Salas-Velasco, M. The Reform of Curricula in the Spanish University System: How Well Matched Are New Bachelor’s Degrees to Jobs. Systems 2023, 11, 200. [Google Scholar] [CrossRef]
- Xu, T.; Zhu, H.; Zhu, C.; Li, P.; Xiong, H. Measuring the Popularity of Job Skills in Recruitment Market: A Multi-Criteria Approach. Proc. AAAI Conf. Artif. Intell. 2018, 32. [Google Scholar] [CrossRef]
- Kehoe, R.R.; Collins, C.J. Human resource management and unit performance in knowledge-intensive work. J. Appl. Psychol. 2017, 102, 1222–1236. [Google Scholar] [CrossRef]
- Sharma, M.; Luthra, S.; Joshi, S.; Kumar, A. Analysing the impact of sustainable human resource management practices and industry 4.0 technologies adoption on employability skills. Int. J. Manpower 2022, 43, 463–485. [Google Scholar] [CrossRef]
- Säve-Söderbergh, J. Gender gaps in salary negotiations: Salary requests and starting salaries in the field. J. Econ. Behav. Organ. 2019, 161, 35–51. [Google Scholar] [CrossRef]
- Hernandez, M.; Avery, D.R.; Volpone, S.D.; Kaiser, C.R. Bargaining while Black: The role of race in salary negotiations. J. Appl. Psychol. 2019, 104, 581–592. [Google Scholar] [CrossRef] [PubMed]
- Wang, X.; Tao, Z.; Liang, L.; Gou, Q. An analysis of salary mechanisms in the sharing economy: The interaction between streamers and unions. Int. J. Prod. Econ. 2019, 214, 106–124. [Google Scholar] [CrossRef]
- Gerhart, B.; Fang, M. Pay for (individual) performance: Issues, claims, evidence and the role of sorting effects. Hum. Resour. Manag. Rev. 2014, 24, 41–52. [Google Scholar] [CrossRef]
- Gerhart, B. Incentives and Pay for Performance in the Workplace. Adv. Motiv. Sci. 2017, 4, 91–140. [Google Scholar] [CrossRef]
- Meng, Q.; Zhu, H.; Xiao, K.; Xiong, H. Intelligent Salary Benchmarking for Talent Recruitment: A Holistic Matrix Factorization Approach. In Proceedings of the 2018 IEEE International Conference on Data Mining (ICDM), Singapore, 17–20 November 2018. [Google Scholar] [CrossRef]
- Zaid, A.A.; Jaaron, A.A.; Bon, A.T. The impact of green human resource management and green supply chain management practices on sustainable performance: An empirical study. J. Clean. Prod. 2018, 204, 965–979. [Google Scholar] [CrossRef]
- Dong, G. The empirical analysis on the demand of salary factors for knowledge staffs of SMES. J. Comput. Methods Sci. Eng. 2022, 22, 1591–1596. [Google Scholar] [CrossRef]
- Yang, R.; Niu, P. Framework Design of Science and Technology Venture Capital Salary Management System Driven by Blockchain Technology. Mob. Inf. Syst. 2022, 2022, 6784385. [Google Scholar] [CrossRef]
- Mishra, H.; Venkatesan, M. Blockchain in human resource management of organizations: An empirical assessment to gauge HR and non-HR perspective. J. Organ. Chang. Manag. 2021, 34, 525–542. [Google Scholar] [CrossRef]
- Zhang, Y.; Xu, S.; Zhang, L.; Yang, M. Big data and human resource management research: An integrative review and new directions for future research. J. Bus. Res. 2021, 133, 34–50. [Google Scholar] [CrossRef]
- Kovshova, T.; Trifonov, P.; Ramirez-Asis, E. Improving the Efficiency of Intellectualisation Processes in Enterprise Management Systems. Systems 2023, 11, 266. [Google Scholar] [CrossRef]
- Li, C.; Zhang, Y.; Niu, X.; Chen, F.; Zhou, H. Does Artificial Intelligence Promote or Inhibit On-the-Job Learning? Human Reactions to AI at Work. Systems 2023, 11, 114. [Google Scholar] [CrossRef]
- Wang, P.; Liao, W.; Zhao, Z.; Miu, F. Prediction of Factors Influencing the Starting Salary of College Graduates Based on Machine Learning. Wirel. Commun. Mob. Com. 2022, 2022, 7845545. [Google Scholar] [CrossRef]
- Koponen, I.T. Agent-Based Modeling of Consensus Group Formation with Complex Webs of Beliefs. Systems 2022, 10, 212. [Google Scholar] [CrossRef]
- Liao, J.; Welsch, H.; Stoica, M. Organizational Absorptive Capacity and Responsiveness: An Empirical Investigation of Growth–Oriented SMEs. Entrep. Theory Pract. 2003, 28, 63–86. [Google Scholar] [CrossRef]
- Hansen, B.; Hamilton, R.T. Factors distinguishing small firm growers and non-growers. Int. Small Bus. J. Res. Entrep. 2011, 29, 278–294. [Google Scholar] [CrossRef]
- Gherghina, Ș.C.; Botezatu, M.A.; Hosszu, A.; Simionescu, L.N. Small and Medium-Sized Enterprises (SMEs): The Engine of Economic Growth through Investments and Innovation. Sustainability 2020, 12, 347. [Google Scholar] [CrossRef] [Green Version]
- Fuller, R.L.; Russ-Eft, D.F. Organizational responsiveness of Russian and American growth-oriented small and medium enterprises (SMEs). Hum. Resour. Dev. Int. 2010, 13, 317–339. [Google Scholar] [CrossRef]
- ZuÑiga-Collazos, A.; Lozada, N.; Perdomo-Charry, G. Effect of absorption capacity acquired on organisational performance. Int. J. Innov. Manag. 2019, 24, 2050048. [Google Scholar] [CrossRef]
- Theodorakopoulos, N.; Figueira, C. What Can Situated Learning Theory Tell Us About Leading to Develop Organizational Learning Capabilities for Entrepreneurial Performance? Lessons from a Knowledge-Intensive Small Firm. Thunderbird Int. Bus. Rev. 2012, 54, 859–873. [Google Scholar] [CrossRef]
- Cassia, L.; Minola, T. Hyper-growth of SMEs. Int. J. Entrep. Behav. Res. 2012, 18, 179–197. [Google Scholar] [CrossRef]
- Batrancea, L.M. Determinants of Economic Growth across the European Union: A Panel Data Analysis on Small and Medium Enterprises. Sustainability 2022, 14, 4797. [Google Scholar] [CrossRef]
- Liu, J.; Zhou, H.; Chen, F.; Yu, J. The coevolution of innovation ecosystems and the strategic growth paths of knowledge-intensive enterprises: The case of China’s integrated circuit design industry. J. Bus. Res. 2022, 144, 428–439. [Google Scholar] [CrossRef]
- Audretsch, D.B.; Belitski, M. Knowledge complexity and firm performance: Evidence from the European SMEs. J. Knowl. Manag. 2021, 25, 693–713. [Google Scholar] [CrossRef]
- Vos, J.F.; Boonstra, A. The influence of cultural values on Enterprise System adoption, towards a culture–Enterprise System alignment theory. Int. J. Inf. Manag. 2022, 63, 102453. [Google Scholar] [CrossRef]
- Pirzada, Z.; Mahar, S.A.; Diou, N.; Memon, T.; Shah, W. Talent Management: Association in Problems of it. Int. J. Manag. 2021, 12, 1210–1218. [Google Scholar]
- Clegg, B.; Little, P.; Govette, S.; Logue, J. Transformation of a small-to-medium-sized enterprise to a multi-organisation product-service solution provider. Int. J. Prod. Econ. 2017, 192, 81–91. [Google Scholar] [CrossRef] [Green Version]
- Xiang, D.; Zhang, Y.; Worthington, A.C. Determinants of the Use of Fintech Finance Among Chinese Small and Medium-Sized Enterprises. IEEE Trans. Eng. Manag. 2021, 68, 1590–1604. [Google Scholar] [CrossRef]
- Macpherson, A.; Holt, R. Knowledge, learning and small firm growth: A systematic review of the evidence. Res. Pol. 2007, 36, 172–192. [Google Scholar] [CrossRef]
- Otmakhova, Y.; Devyatkin, D. Priorities of Human Resources Policy in the Context of Digitalization and the COVID-19 Pandemic. In Digital Transformation in Industry; Springer: Berlin/Heidelberg, Germany, 2022; pp. 481–492. [Google Scholar] [CrossRef]
- de la Paz, J.V.B.; Rodríguez-Picón, L.A.; Morales-Rocha, V.; Torres-Argüelles, S.V. A Systematic Review of Risk Management Methodologies for Complex Organizations in Industry 4.0 and 5.0. Systems 2023, 11, 218. [Google Scholar] [CrossRef]
- Schepers, J.; Vandekerkhof, P.; Dillen, Y. The Impact of the COVID-19 Crisis on Growth-Oriented SMEs: Building Entrepreneurial Resilience. Sustainability 2021, 13, 9296. [Google Scholar] [CrossRef]
- Abdelshafie, A.; Rupnik, B.; Kramberger, T. Simulated Global Empty Containers Repositioning Using Agent-Based Modelling. Systems 2023, 11, 130. [Google Scholar] [CrossRef]
- Tian, C.; Xiao, T.; Shang, J. Channel differentiation strategy in a dual-channel supply chain considering free riding behavior. Eur. J. Oper. Res. 2022, 301, 473–485. [Google Scholar] [CrossRef]
- Railsback, S.F.; Grimm, V. Agent-Based and Individual-Based Modeling. A Practical Introduction. In OEconomia; Princeton University Press: Princeton, NJ, USA, 2019; pp. 407–413. [Google Scholar] [CrossRef]
- Trivedi, A.; Sreenivas, N.K.; Rao, S. Modeling the Spread and Control of COVID-19. Systems 2021, 9, 53. [Google Scholar] [CrossRef]
- Chen, F. Salesforce Incentives, Market Information, and Production/Inventory Planning. Manag. Sci. 2005, 51, 60–75. [Google Scholar] [CrossRef] [Green Version]
- Chen, T.; Huang, G.; Olanipekun, A. Simulating the Evolution Mechanism of Inner Innovation in Large-Scale Construction Enterprise with an Improved NK Model. Sustainability 2018, 10, 4221. [Google Scholar] [CrossRef] [Green Version]
- Hitka, M.; Kucharčíková, A.; Štarchoň, P.; Balážová, Ž.; Lukáč, M.; Stacho, Z. Knowledge and Human Capital as Sustainable Competitive Advantage in Human Resource Management. Sustainability 2019, 11, 4985. [Google Scholar] [CrossRef] [Green Version]
- Guest, D.E. Human resource management and employee well-being: Towards a new analytic framework. Hum. Resour. Manag. J. 2017, 27, 22–38. [Google Scholar] [CrossRef] [Green Version]
- Xing, X.; Ye, A. Spatial-Temporal Differentiation and Spatial Interaction Effect Analysis of Residents’ Consumption Capacity and Consumption Upgrading in China. Systems 2023, 11, 219. [Google Scholar] [CrossRef]
- Gherghina, Ș.C.; Botezatu, M.A.; Simionescu, L.N. Exploring the Impact of Electronic Commerce on Employment Rate: Panel Data Evidence from European Union Countries. J. Theor. Appl. Electron. Commer. Res. 2021, 16, 3157–3183. [Google Scholar] [CrossRef]
- Aslam, M.; Shafi, I.; Ahmed, J.; de Marin, M.S.G.; Flores, E.S.; Gutiérrez, M.A.R.; Ashraf, I. Impact of Innovation-Oriented Human Resource on Small and Medium Enterprises’ Performance. Sustainability 2023, 15, 6273. [Google Scholar] [CrossRef]


| Agent | Variable | Category | Type | Description | Initial | Range/Unit |
|---|---|---|---|---|---|---|
| Worker | XV, Unchanged | float | Effort level | random | ||
| XV, Unchanged | int | Initial working years | random | |||
| XV, Unchanged | float | Significance attached to incentives by workers (reverse is the significance attached to the firm value) | 0.5 | |||
| XV, Unchanged | float | Ratio of firms searched by workers each time | 0.2 | |||
| NV | int | Working years, increasing monthly when at work | Month | |||
| NV | float | payment | yuan | |||
| NV | float | output | ||||
| NV, DV | bool | Whether worker i applies to firm j | ||||
| NV | bool | Hired or not | ||||
| Firm | XV, Unchanged | float | Level of incentive | random | ||
| XV, Unchanged | float | Initial payment for non-job-hopping workers | random | (8000, 10,000) | ||
| XV, Unchanged | bool | Choose RP1 or not | ||||
| XV, Unchanged | bool | Choose DP1 or not | ||||
| NV | float | Average output of senior workers: the top 20% workers in the firm | ||||
| NV | float | Average output of ordinary workers: those workers whose output level is lower than the top 20% | ||||
| NV | float | Firm revenue | yuan | |||
| NV | float | Firm profit | yuan | |||
| NV | float | Equity | yuan | |||
| NV, DV | list of workers | Worker list at the current time step | ||||
| Environment | t | int | Time | 200 | ||
| XV, Changing | float | Industrial gross value | 58,151 | 100,000,000 yuan | ||
| XV, Unchanged | float | Proportion of all firms choosing RP1 | 0.5 | |||
| XV, Unchanged | float | Proportion of all firms choosing DP1 | 0.5 |
| Input XV | Default Value | Value |
|---|---|---|
| 0.5 | Exp1 = {0.1, 0.3, 0.5, 0.7, 0.9} | |
| 0.2 | Exp2 = {0.1, 0.2, 0.3, 0.6, 0.8} | |
| percent_RH | 0.5 | Exp3 = {0, 0.25, 0.5, 0.75, 1} |
| percent_FH | 0.5 | Exp3 = {0, 0.25, 0.5, 0.75, 1} |
| percent_RH | percent_FH | avg_profit | gini_profit | avg_yield | avg_salary | gini_salary | percent_hired | |||
|---|---|---|---|---|---|---|---|---|---|---|
| 0 | 0.1 | 0.1 | 0 | 0 | 8.39 × 10 | 0.027939 | 0.621319 | 2.24 × 10 | 0.313706 | 0.9976 |
| 1 | 0.1 | 0.2 | 0.25 | 0.5 | 5 × 10 | 0.430967 | 0.621537 | 4 × 10 | 0.31987 | 0.47048 |
| 2 | 0.1 | 0.3 | 0.5 | 0.75 | −1.6 × 10 | 0.411932 | 0.663965 | 3.44× 10 | 0.353351 | 0.5332 |
| 3 | 0.1 | 0.6 | 0.75 | 1 | 2.49 × 10 | 0.093138 | 0.720269 | 1.46 × 10 | 0.452569 | 0.9007 |
| 4 | 0.1 | 0.8 | 1 | 0.25 | 2.2 × 10 | 0.045547 | 0.740577 | 5.1 × 10 | 0.482506 | 0.97158 |
| 5 | 0.3 | 0.1 | 0.25 | 0.25 | 7.13 × 10 | 0.410708 | 0.635418 | 3.58 × 10 | 0.318594 | 0.59938 |
| 6 | 0.3 | 0.2 | 0.5 | 1 | 4.38 × 10 | 0.114265 | 0.684246 | 2.13 × 10 | 0.356604 | 0.88972 |
| 7 | 0.3 | 0.3 | 1 | 0 | 3.56 × 10 | 0.304474 | 0.730233 | 9.74 × 10 | 0.540827 | 0.58168 |
| 8 | 0.3 | 0.6 | 0 | 0.75 | 7.35 × 10 | 0.031434 | 0.612464 | 2.23 × 10 | 0.324342 | 0.99916 |
| 9 | 0.3 | 0.8 | 0.75 | 0.5 | −1.5 × 10 | 0.361681 | 0.693714 | 2.53 × 10 | 0.437841 | 0.55692 |
| 10 | 0.5 | 0.1 | 0.5 | 0.5 | 1.96 × 10 | 0.432355 | 0.657213 | 3.5 × 10 | 0.337972 | 0.57874 |
| 11 | 0.5 | 0.2 | 1 | 0.75 | 1.39 × 10 | 0.344672 | 0.723607 | 8.92 × 10 | 0.561117 | 0.60622 |
| 12 | 0.5 | 0.3 | 0.75 | 0.25 | −3.9 × 10 | 0.500436 | 0.667578 | 3.27 × 10 | 0.403866 | 0.32234 |
| 13 | 0.5 | 0.6 | 0.25 | 0 | −8.4 × 10 | 0.490868 | 0.623951 | 3.95 × 10 | 0.312689 | 0.51456 |
| 14 | 0.5 | 0.8 | 0 | 1 | 7.33 × 10 | 0.030636 | 0.611351 | 2.22 × 10 | 0.324083 | 0.99996 |
| 15 | 0.7 | 0.1 | 0.75 | 0.75 | −1.4 × 10 | 0.271831 | 0.700462 | 2.21 × 10 | 0.44766 | 0.73492 |
| 16 | 0.7 | 0.2 | 0 | 0.25 | 7.7 × 10 | 0.0299 | 0.613062 | 2.24 × 10 | 0.320585 | 0.99734 |
| 17 | 0.7 | 0.3 | 0.25 | 1 | 2.16 × 10 | 0.21401 | 0.64452 | 2.76 × 10 | 0.329188 | 0.7904 |
| 18 | 0.7 | 0.6 | 1 | 0.5 | 1.6 × 10 | 0.404587 | 0.703279 | 1.38 × 10 | 0.453787 | 0.19522 |
| 19 | 0.7 | 0.8 | 0.5 | 0 | 2.75× 10 | 0.638787 | 0.622425 | 4.22 × 10 | 0.311246 | 0.37052 |
| 20 | 0.9 | 0.1 | 1 | 1 | 1.27 × 10 | 0.252744 | 0.719015 | 4.89 × 10 | 0.564013 | 0.97836 |
| 21 | 0.9 | 0.2 | 0.75 | 0 | −5.7 × 10 | 0.543475 | 0.643587 | 3.53 × 10 | 0.38322 | 0.3159 |
| 22 | 0.9 | 0.3 | 0 | 0.5 | 7.5 × 10 | 0.030237 | 0.614366 | 2.23 × 10 | 0.323111 | 0.9984 |
| 23 | 0.9 | 0.6 | 0.5 | 0.25 | 2.56 × 10 | 0.62329 | 0.62374 | 4.22 × 10 | 0.314919 | 0.3693 |
| 24 | 0.9 | 0.8 | 0.25 | 0.75 | 3.55 × 10 | 0.405524 | 0.628465 | 3.77 × 10 | 0.315356 | 0.5439 |
| Source | DOF | avg_profit | gini_profit | avg_yield | |||||||||
|---|---|---|---|---|---|---|---|---|---|---|---|---|---|
| Source | DOF | S | MS | F Ratio | p Value | S | MS | F Ratio | p Value | S | MS | F Ratio | p Value |
| 4 | 7.20 × 10 | 1.80 × 10 | 1.108 | 0.4618 | 0.107 | 0.027 | 0.932 | 0.5266 | 0.003 | 0.001 | 1.149 | 0.4482 | |
| 4 | 2.43 × 10 | 6.07 × 10 | 0.374 | 0.8182 | 0.007 | 0.002 | 0.059 | 0.9910 | 0 | 0 | 0.168 | 0.9436 | |
| 4 | 1.86 × 10 | 4.66 × 10 | 28.650 | 0.0033 | 0.528 | 0.132 | 4.588 | 0.0846 | 0.038 | 0.010 | 16.675 | 0.0092 | |
| 4 | 1.47 × 10 | 3.68 × 10 | 2.267 | 0.2237 | 0.185 | 0.046 | 1.609 | 0.3280 | 0.002 | 0.001 | 0.955 | 0.5172 | |
| 4 | 8.94 × 10 | 2.23 × 10 | 1.375 | 0.3825 | 0.017 | 0.004 | 0.147 | 0.9550 | 0 | 0 | 0.048 | 0.9939 | |
| e | 4 | 6.50 × 10 | 1.63 × 10 | 0.115 | 0.029 | 0.002 | 0.001 | ||||||
| Source | DOF | avg_salary | gini_salary | percent_hired | |||||||||
| Source | DOF | S | MS | F Ratio | pValue | S | MS | F Ratio | pValue | S | MS | F Ratio | pValue |
| 4 | 1.25 × 10 | 3.14 × 10 | 0.811 | 0.5781 | 0.001 | 0 | 0.668 | 0.6471 | 0.109 | 0.027 | 0.462 | 0.7633 | |
| 4 | 2.06 × 10 | 5.14 × 10 | 0.133 | 0.9620 | 0.002 | 0.001 | 1.022 | 0.4917 | 0.091 | 0.023 | 0.386 | 0.8106 | |
| 4 | 2.52 × 10 | 6.29 × 10 | 16.256 | 0.0097 | 0.154 | 0.039 | 69.109 | 0.0006 | 0.705 | 0.176 | 2.979 | 0.1578 | |
| 4 | 4.05 × 10 | 1.01 × 10 | 2.615 | 0.1872 | 0.006 | 0.002 | 2.686 | 0.1809 | 0.420 | 0.105 | 1.777 | 0.2957 | |
| 4 | 1.89 × 10 | 4.72 × 10 | 0.122 | 0.9671 | 0.003 | 0.001 | 1.561 | 0.3384 | 0.072 | 0.018 | 0.304 | 0.8621 | |
| e | 4 | 1.55 × 10 | 3.87 × 10 | 0.002 | 0.001 | 0.237 | 0.059 |
Disclaimer/Publisher’s Note: The statements, opinions and data contained in all publications are solely those of the individual author(s) and contributor(s) and not of MDPI and/or the editor(s). MDPI and/or the editor(s) disclaim responsibility for any injury to people or property resulting from any ideas, methods, instructions or products referred to in the content. |
© 2023 by the authors. Licensee MDPI, Basel, Switzerland. This article is an open access article distributed under the terms and conditions of the Creative Commons Attribution (CC BY) license (https://creativecommons.org/licenses/by/4.0/).
Share and Cite
Yang, J.; Dong, J.; Song, Q.; Otmakhova, Y.S.; He, Z. The Impacts of Payment Policy on Performance of Human Resource Market System: Agent-Based Modeling and Simulation of Growth-Oriented Firms. Systems 2023, 11, 298. https://doi.org/10.3390/systems11060298
Yang J, Dong J, Song Q, Otmakhova YS, He Z. The Impacts of Payment Policy on Performance of Human Resource Market System: Agent-Based Modeling and Simulation of Growth-Oriented Firms. Systems. 2023; 11(6):298. https://doi.org/10.3390/systems11060298
Chicago/Turabian StyleYang, Jian, Jichang Dong, Qi Song, Yulia S. Otmakhova, and Zhou He. 2023. "The Impacts of Payment Policy on Performance of Human Resource Market System: Agent-Based Modeling and Simulation of Growth-Oriented Firms" Systems 11, no. 6: 298. https://doi.org/10.3390/systems11060298