1. Introduction
Social media plays an increasingly crucial role today. Companies use social media to amplify their exposure, while some political figures leverage it to shape their image and influence citizens’ preferences. Clear evidence exists that social media sites (SMSs) impact political engagement, as evidenced in the 2008 U.S. presidential election, when the Obama campaign successfully recruited campaign volunteers from across the country using my.barackobama.com [
1]. Another notable example is Donald Trump’s effective use of Twitter to campaign, transforming himself from a businessman into the President of the United States. Despite losing the subsequent election, Trump gained substantial popularity and a loyal following through social media. To these followers, Trump’s words are highly trustworthy. These phenomena underscore the vital role of social media in information diffusion and political movements [
2]. There has been a lot of research on social media in recent years. Since 1988, scholars began to emphasize the concept and functions of social media and social network platform. Ref. [
3] elaborates the concept of social network and identified the main formal methods of social network research in his previous research. Ref. [
4] then states that social network analysis (SNA) is a concept that can be applied in free market economy, geography, and transportation networks. Ref. [
5] proposes to use different theories when we analyze social network communication; he believes that the combined research will help us to better understand social network communication. Some scholars carry out a series of research on Twitter, which is a popular social network platform in today’s society. Ref. [
6] focuses on the use of social media and considers Twitter as a media site for sharing news. Ref. [
7] also suggests that Twitter plays an important role in the dissemination of health information. Some scholars analyze the development trend of social networking platforms; for example, Ref. [
8] finds that there is a positive relationship between socialization and political activities, and he thinks that the positive relationship will influence people’s voting intentions. Ref. [
9] also finds that popular and well-known brands will create many connections among individual Twitter users. This paper will address how social media disseminates political information, influences users’ thoughts and behaviors, and characterizes social media communication in political news. These questions will be elaborated in the following chapters by analyzing the information diffusion of the G20 summit on Twitter.
In this study, we will utilize social network analysis (SNA) to better comprehend the connections and relationships between people, events, and people–event interactions. Through SNA, we will explore how Twitter hashtags and retweets influence people’s ideas and behaviors concerning political issues. We will further investigate the impact of online news media, specifically Twitter, on political engagement using the “G20 Summit” as a case study. While interest in SNA has grown in recent years, most studies have focused on the structured analysis of various topics, paying more attention to the theoretical aspects of social media networks. However, there has been limited focus on the connection between information diffusion management on social network platforms, especially regarding political affairs.
In previous research, scholars have focused on the evolution of social network analysis and the development of social media theory. Some of them discuss the use of social media in public life, and some compare the difference between Twitter and other social networking platforms. Some experts examine the key factors in information diffusion and try to find out how social media platforms influence people’s behavior. However, previous research has not thoroughly investigated the roles of online news media in the diffusion of political information. To address these gaps, this study will combine theories and political events to advance the understanding of information diffusion management, particularly focusing on key factors contributing to the diffusion of political affairs on Twitter. The research will employ both structured analysis and content analysis methods to depict social networks on Twitter using graphs and graph metrics, and to describe the similarities and differences among various factors.
The significance of this study lies in its capacity to:
Identify key factors contributing to political information diffusion on SMSs using structured analysis, which will assist decision-makers in effectively managing information diffusion related to political issues.
Use content analysis to compare the similarities and differences of structured and semantic distribution of the subgroup “#g20,” thereby uncovering the characteristics and rules of political information diffusion.
In the era of COVID-19, it is imperative for the government to understand how to manage information diffusion by the public. The study aims to share insights into health communication management that could serve as a reference for government departments.
In summary, while earlier studies have primarily examined Twitter features from the standpoint of individual impact and information flow, there has been little research on the interaction between news media and political events and information diffusion management. Our study seeks to address this gap by investigating the connections between news media, political events, and information management, identifying potential variables (key media, key opinion leaders, time) that may significantly impact the diffusion of political affairs. Additionally, the study will compare the similarities and differences between the “Australian G20” and the “Russian G20” to reveal noteworthy findings. The purpose of our study is not only to validate previous research findings, but also to compare different aspects and identify similarities and differences in structured and content analysis on online news media. The research findings will provide insights and recommendations for political and health communication management.
2. Literature Review
Before conducting a literature review of social network analysis, let us familiarize ourselves with common terminologies used in this field. Social network researchers have developed a host of network metrics to quantify social networks. These measurements are classified into two types: node-level metrics and network-level metrics.
As illustrated in
Table 1 below, the basic node-level metrics include out-degree (only applicable for directed networks), in-degree (only defined for undirected networks), reciprocity (mutual following of accounts), betweenness centrality (a measure of a node’s influence on the flow of information in a graph), and closeness centrality (a measure of centrality in a network). Each of these indicators offers a unique perspective on a given node’s position within a network and the role it plays therein.
Regarding network-level metrics, some concepts discussed in Twitter network analysis include latency (the time it takes for data to reach its destination), jitter (variation in delay), packet loss (data packets dropped during transmission), throughput (amount of data passed through the network), packet duplication (data packets duplicated somewhere in the network), and packet reordering (data packets arrive at their destination in the wrong order).
2.1. Social Network Analysis and Twitter
Since 1988, the author of [
3] has been writing about the evolution of social network analysis, examining its origins in classical sociology and its contemporary manifestation in social science and mathematical work. According to his study, the concept of a social network provides a compelling model for social structure, and a number of key formal methods of social network research can be identified. Social network analysis has been applied in studies of kinship structure, social mobility, science citations, contacts among deviant group members, corporate dominance, international trade exploitation, class structure, and many other topics. Ref. [
4] then stated that social network analysis (SNA) is not a formal theory in sociology but rather a strategy for investigating social structures. It is a concept that can be applied in a variety of domains, including the free market economy, geography, and transportation networks.
Due to the widespread use of social media sites (SMSs) such as Facebook and Twitter, online news media platforms have grown to become some of the most popular internet services worldwide [
10]. The use of social media has led to people becoming more informed and participating in public life [
11]. Meanwhile, Twitter has been investigated as a news-sharing media site, with experts emphasizing the propensity of users with a significant number of followers to generate larger cascades of retweets in the future if they have previously succeeded in doing so [
6]. The edges in a Twitter network, similar to those in other social network platforms, can indicate numerous types of connections, such as partnerships, kinship, friendship, citations, transactions, and similar interests. These connections are either represented by directed or undirected edges. Directed edges have a clear origin and destination, while undirected edges represent a reciprocal interaction that does not have a clear origin or destination [
12]. According to [
13], Twitter usage is not limited to isolated cases, but is frequently integrated as part of a larger social media strategy. Twitter serves more as a news and information-sharing platform than a social networking platform [
14]. Twitter also plays a vital role in terms of health information diffusion. Ref. [
7] found that links, emojis, pictures, and tweet length significantly affect the tweets’ diffusion, whereas sentiment and videos did not show any significant influence on the diffusion of tweets.
Regarding the relationship between political information diffusion and Twitter, in 2012, Peter conducted a subgroup-level Twitter network study and combined Twitter with political information diffusion. Peter revealed that contacts on Twitter between reporters and politicians are no longer driven by the religious or ideological identities of parties and media. Finding and disseminating news is the driving force behind the Twitter network of politicians and journalists [
15]. In “Twitter and political campaigning”, [
5] suggests that we need to combine various theories to better understand social network communication. For example, if we utilize the theory of political science, it can help us understand the political context of political communication with social media and the role of election systems for social media campaigning. Ref. [
16] further revealed that interactions with politicians on social media sites (SMSs) boost candidates’ perceived likeability and, consequently, faith in government. Some experts went on to say that emotion plays a crucial role in the message spread via social media sites (SMSs), and that emotion-eliciting political communication has the ability to reach large audiences and affect individuals’ opinions and behavior [
17].
In recent years, individual users have become more and more active on social network platforms such as Twitter and Facebook. Ref. [
9] concluded that people have more widely communicated their opinions and emotions with other users on these online social media sites. Meanwhile, Ref. [
8] further discovered that the propensity to share information, the intensity of use, and privacy concerns all have a positive effect on sociability on online social networking sites. Furthermore, there is a considerable positive association between socialization and political activity, which influences voting intentions. In 2022, Himelboim found that low-graph-density Twitter topic-networks have a large number of people who lack any connections at all, and these topic-networks are often related to brands and celebrities. Thus, Ref. [
18] proposes that individuals rarely engage with others who tweet about the topic, and tweets from many isolates are often associated with popular subjects and well-known brands.
In conclusion, we can see that the social network theory is becoming more complex, and based on theoretical research, more and more users’ behaviors and interactions have been analyzed. With the development of social media theory, many experts began to study users’ behavior on social media and the interaction between social media and political issues. Based on the previous studies listed here, in this paper, we will analyze the G20 summit using social network analysis.
2.2. Data Analysis by NodeXL
In this paper, we decided to use NodeXL to extract key information from Twitter, and some knowledge and research outcomes by NodeXL will be summarized here.
In 1996, Ref. [
19] proposed that data mining and knowledge discovery in databases are key research topics with broad applicability. They also discussed many types of data mining approaches, such as generalization, characterization, classification, clustering, association, evolution, pattern matching, data visualization, and meta-rule-guided mining. Then, in 2013, Ref. [
20] explored the usage of NodeXL, which is a free Excel 2007/2010 template, for researching networks within the familiar environment of the Excel spreadsheet, which motivated our research. NodeXL’s purpose is to make network data analysis easier by converting edge lists and incidence matrices into useful visualizations that might aid in the discovery of insights [
21]. Several articles have also sought to develop a community understanding of how to choose and use various Twitter application programming interfaces (APIs) for research purposes [
22].
In recent years, some scholars have also recommended and used NodeXL for social network analysis. For example, Michael thought NodeXL is a very useful social network analysis tool to help researchers analyze the political talks on Twitter. Furthermore, Ref. [
23] believed that NodeXL is an excellent tool for collecting, analyzing, visualizing, and reporting on the patterns of social media. With a network map visualized, key people, groups, and bridges in the social network platform will be highlighted.
NodeXL has also been used to mine and analyze users’ opinions, thus helping politicians and the public better interact, so as to create better social policy. In 2020, Ref. [
24] revealed that sentiment analysis and opinion mining are popular fields of research in data mining, and Rahevar elaborated on different elements of sentiment analysis, including important ideas, categorization, process, importance, obstacles, and applications. The polarity of opinion is identified through experimental analysis, and citizens’ sentiments will assist the government in refining its policies and working for the benefit of the public [
25]. Ref. [
26] further examined how politicians interact with each other on social media by using NodeXL, and he indicates that mayors form ties with high-profile counterparts from the same political party who represent larger cities and possess more followers. Mayors who share the same political party affiliation and have a closer geographical distance are more likely to form ties with each other.
We intend to use NodeXL to collect data linked to the “#g20” hashtag, and we also used DiscoverText, a data extraction service, as an additional tool to acquire specific information from official Twitter accounts. Furthermore, we drew on earlier research to obtain practical expertise using NodeXL.
In NodeXL, for example, the in-degree value can be used as a signal to communicate information in multiple ways, with a higher value indicating that a certain node has formed more connections. While our research yielded useful insights, it also revealed limitations in our data analysis. The data mining capabilities of the version of NodeXL we used, in particular, did not contain capacity for sorting data by date, which prohibited us from analyzing the evolution of cascading effects over time.
2.3. Variables Definition
Based on our discussion above, we predict that the in-degree value has a positive correlation with information coverage and diffusion speed. We defined our independent variables (IVs) and dependent variables (DVs) as follows to succinctly explain these complex interactions in a simplified manner, which can be refereed to
Table 2:
The research framework for this paper draws from concepts proposed by [
27], who found that most tweets/retweets came from ordinary users, and the number of tweets/retweets decreased as the source shifted from media users to personal users. Most importantly, elite users (excluding organizations and celebrities) were more likely to closely follow their peers and retweet each other. In 2020, Ref. [
28] conducted research using retweets to model information diffusion in the United States and test the geographic distribution of information flows on different topics. In the study, the results show that people outside the affected areas expressed more negative sentiment towards the disaster than people in the affected areas. Meanwhile, retweet density follows the distance decay rule and the decay rate differs across topics.
With respect to the heterogeneity of social networks, as mentioned by [
29], we aim to identify the differences and similarities between the structure distribution and semantic distribution of the “#g20” data, and to explore the implications of social network heterogeneity.
Ref. [
30] tested the functions of key opinion leaders on the Twitter online discussion network in 2020; in the study, the key opinion leaders are identified based on their in-degree and out-degree links and are ranked within the network by their betweenness centrality values. According to the study, key opinion leaders play a crucial role in spreading information in an efficient manner, and the conversation starter and influencer were observed to play a crucial role in spreading information in an online discussion network. In this paper, we aim to discern the role of key opinion leaders in the process of political information diffusion on Twitter. We question whether key opinion leaders will spread political messages more effectively than individual users (i.e., will key opinion leaders play a more important role)? In addition to this, we will compare the features of the distribution of #g20 tweets from the perspectives of structural and semantic analysis. Based on our findings and the review of previous research, we believe that people who have mutual ties are more likely to share information [
31]. Furthermore, we expect that the frequency of retweeting will be related to the reciprocity of a Twitter account’s relationships, and that significant media outlets’ focus on the key term “G20 Summit” will diminish over time.
According to [
32], graph-based structural analysis for video summarization is different from traditional methods of video representation. Through graph-based structural analysis, different types of shot transitions are more easily detected, and structural difference analysis of graphs is performed to detect the video shot boundaries. Thus, we assume that the structural distribution will be different from the semantic distribution of the same tweets on Twitter. To test the difference between structural distribution and semantic distribution of the same tweets on Twitter, we will apply two different analysis methods after data collection.
Therefore, we propose two hypotheses and one research question to better understand political information diffusion on Twitter.
H1: The frequency of retweeting will increase with the increase of the reciprocity ratio (mutual friends’ ratio) of a Twitter account.
H2: Key opinion leaders play a more important role than individual users in the dissemination of political information on Twitter.
RQ1: How do the structural distribution of “#g20” tweets differ from the semantic distribution of the same tweets on Twitter?
3. Methodology
We will utilize social network analysis (SNA) and graph theory to explore specific social relationships in terms of networks composed of vertices (or nodes) and edges, aiming to understand the dynamic relationships and diffusion patterns among probable critical components [
33]. In this study, we collect an appropriate volume of data using NodeXL and DiscoverText for data mining, then conduct structural and content analyses on the collected data.
In our proposal, we plan to use a mixed-methods approach to assess the spread of the “G20 Summit”, with a larger emphasis on deductive reasoning. The aim of this research is to establish the links between Twitter and the dissemination of the “G20 Summit”, and to identify the factors that influence the dispersion of political issues on online news media. We will collect data using the snowball sampling method through NodeXL and DiscoverText, then use NodeXL to analyze the valid data from both structural and content perspectives. For visual representation, the relationships will be illustrated using graphs and metrics.
3.1. Data Collection
We will use Twitter as a platform to investigate the concept of “influence” in this study, given the public availability of data and the plainly observable linkages. To this end, we will extract data from Twitter using the social network analysis applications NodeXL and DiscoverText, perform the necessary social network analysis, and visualize the data sets. The study will be conducted in two stages:
In the first stage, we will clarify the identities of relevant official Twitter accounts of the “G20” Summit, such as “@G20Australia”, “@G20rus”, and “#g20”. These accounts were specifically selected as representatives of the G20 summit, and we will use them as our focus. In the second stage, we will collect data on hashtag “#g20” using NodeXL’s user search function, limiting the number of tweets to 18,457 dues to NodeXL’s constraints. We will also employ a snowball sampling strategy to collect 202 recent tweets supplied by “@G20Australia” (from 14 November 2014 to 21 November 2014) and 202 tweets delivered by “@G20rus” (from 20 July 2013 to 24 December 2013). Subsequently, the data will be transferred into NodeXL for analysis.
3.2. Data Analysis and Visualization
After collecting the data, we will employ two distinct analysis methods: structured analysis and content analysis.
In structured analysis, we will use measures such as the number of followers and following, and whether Twitter accounts are mutual followers, to identify prominent opinion leaders and assess the validity of our hypotheses H1 and H2.
We will examine each node’s in-degree to estimate the number of common friends and the number of mentions, using these data to draw conclusions about the influence of prominent opinion leaders in political conversations on Twitter.
Before performing a content analysis, we will first use NodeXL to collect tweets, including original tweets, replies, mentions, and self-loops, and then discard operational words such as RTs (reply tweets) and MTs (mention tweets), as well as other non-English languages. This will involve keyword and cluster analysis, with an emphasis not only on the number of comments and domain linkages, but also on the differences and similarities between subgroups of “word pairs” after clustering by computing general metrics.
In terms of structure analysis, we will create an in-degree graph to reflect the contributions of various actors to information dissemination. NodeXL will be used to study the distribution of nodes and edges, and it will display each selected edge that could indicate the contribution points to information dispersion. Additionally, we will use NodeXL to analyze specific hashtag terms and word pairs (“#g20”) that appeared in the relevant official Twitter accounts in order to answer the research question (RQ1) and draw a conclusion.
4. Results
4.1. Structured Analysis
The term “g20” was commonly used in the context of the G20 Summit. We utilized NodeXL and DiscoverText to gather tweets bearing the hashtag “#g20”, as well as historical tweets from the official Twitter accounts “@G20Australia” and “@G20rus” to compile data for this study. Data mining techniques were employed to extract 20,000 tweets associated with “#g20” from Twitter, along with over 200 historical tweets from the aforementioned official Twitter accounts. The next section will offer an overview of the fundamental metrics associated with the hashtag “#g20”, as depicted in the table below.
Table 3 was constructed using NodeXL with the imported nodes and edges. We opted for a directed graph type because we were interested in exploring the effects of various interactions on information dissemination. In real-world networks, individual connections possess a direction, such as when one person is acquainted with another who does not know them. Similarly, on Twitter, a user can follow others who do not follow them back. Therefore, the directed graph type is ideal for this research as it allows us to capture this directionality in interactions and information flow.
In our research, we treated edges associated with the hashtag “#g20” as directed edges to evaluate the information flow between individuals with different types of relationships. Our Hypothesis H1 posits that Twitter users who follow each other have reciprocal relationships, symbolized by these edges. However, upon closer examination, we found that edges with duplicates constituted only 28.8% of the total, signifying a relatively low reciprocity rate. This characteristic has been previously documented in online news media studies. Furthermore, by clustering based on in-degree, we could visually segment the #g20 data into distinct subgroups, facilitating further exploration and analysis of information diffusion within these clusters.
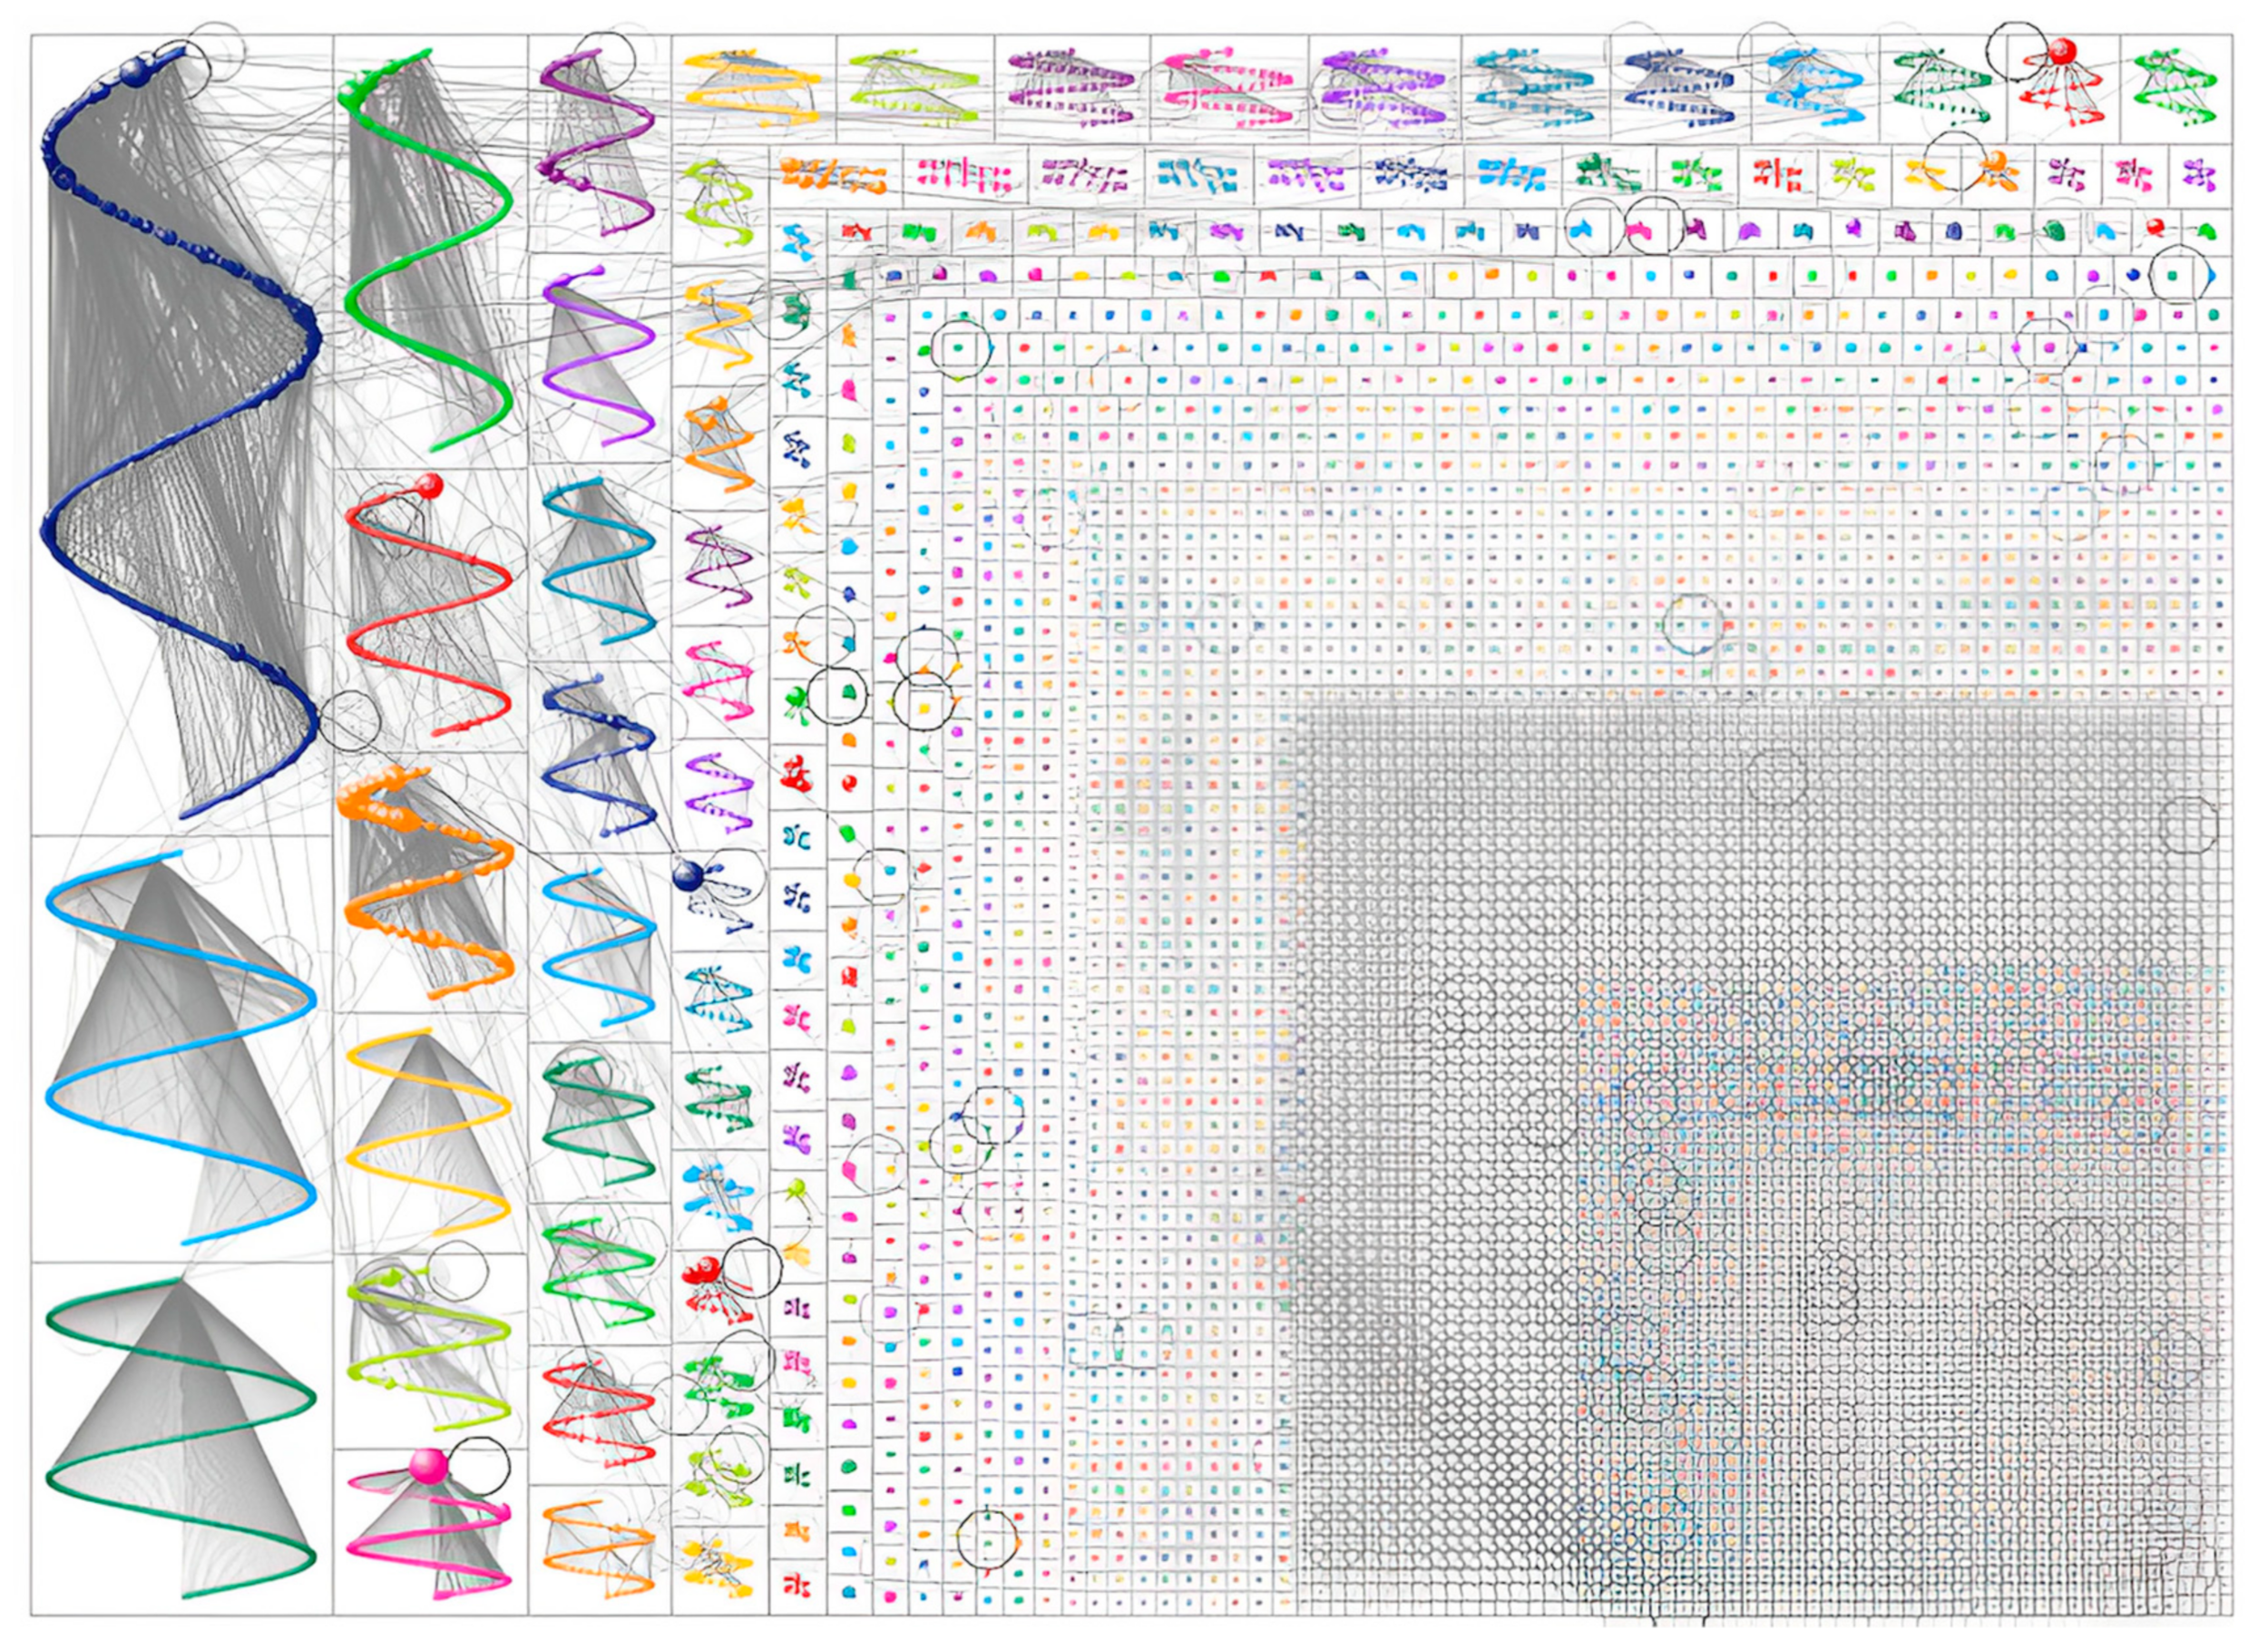
As depicted in
Figure 1, the graph of the hashtag “#g20” presented here was constructed utilizing clustering and is displayed in a horizontal sinusoidal formation. The size of the nodes corresponds to the value of each node’s in-degree index, with larger nodes indicating a higher in-degree value. The wave-like clustering reveals the numerous connections within different groups. The groups were formed based on the semantic distribution of these connections.
The in-degree graphic representation of the graph of the hashtag “#g20” illustrates a directed network of approximately 20,000 tweets utilizing “#g20” on Twitter. We generated 4723 subgroups from the data using structured analysis. To better understand the distribution of information flow associated with “#g20”, we selected the top 20 subgroups and examined their metrics to ascertain if the distribution followed a power law pattern. The top 20 subgroups have 3949 vertices, accounting for 30.17% of the total vertices, as depicted in the table below. Furthermore, within these subgroups, the edge ratio is 41.16%, while the self-loop ratio, measuring the degree of information flow within the subgroup, is 7.4%.
Table 4 contains a row called “Total”, which summarizes the top 20 subgroups. It shows that the total number of vertices in these subgroups is 13,099, the total number of edges is 18,234, and the total number of self-loops is 5397.
Our analysis suggests that information diffusion within the “#g20” network on Twitter seems to follow a power law pattern. However, this can also be interpreted through the lens of [
34]’s “long tail” concept, first articulated in the business field in 2004. Given a large enough distribution channel, the theory posits that a high number of niche products or low-demand items can collectively make up a market share that rivals or exceeds that of more popular or mainstream items. The data analysis supports the conclusion that the top 20 subgroups of “#g20” occupy a significant portion of the total vertices and edges in the context of information distribution on social media. Still, the remaining subgroups present opportunities for information diffusion. Individual users are becoming increasingly significant in online news media and information diffusion, as this trend demonstrates. Although established news institutions continue to wield considerable influence, individuals are increasingly important in information diffusion. This demonstrates the potential for a vast number of individual users to play a crucial role in the long-term diffusion of information.
Key opinion leaders play an essential role in information distribution on Twitter, but the influence of individual users on social media has been rapidly increasing in recent years. Engaged individual users will have greater opportunities to expose themselves and emerge as significant opinion leaders due to social media platforms such as Twitter [
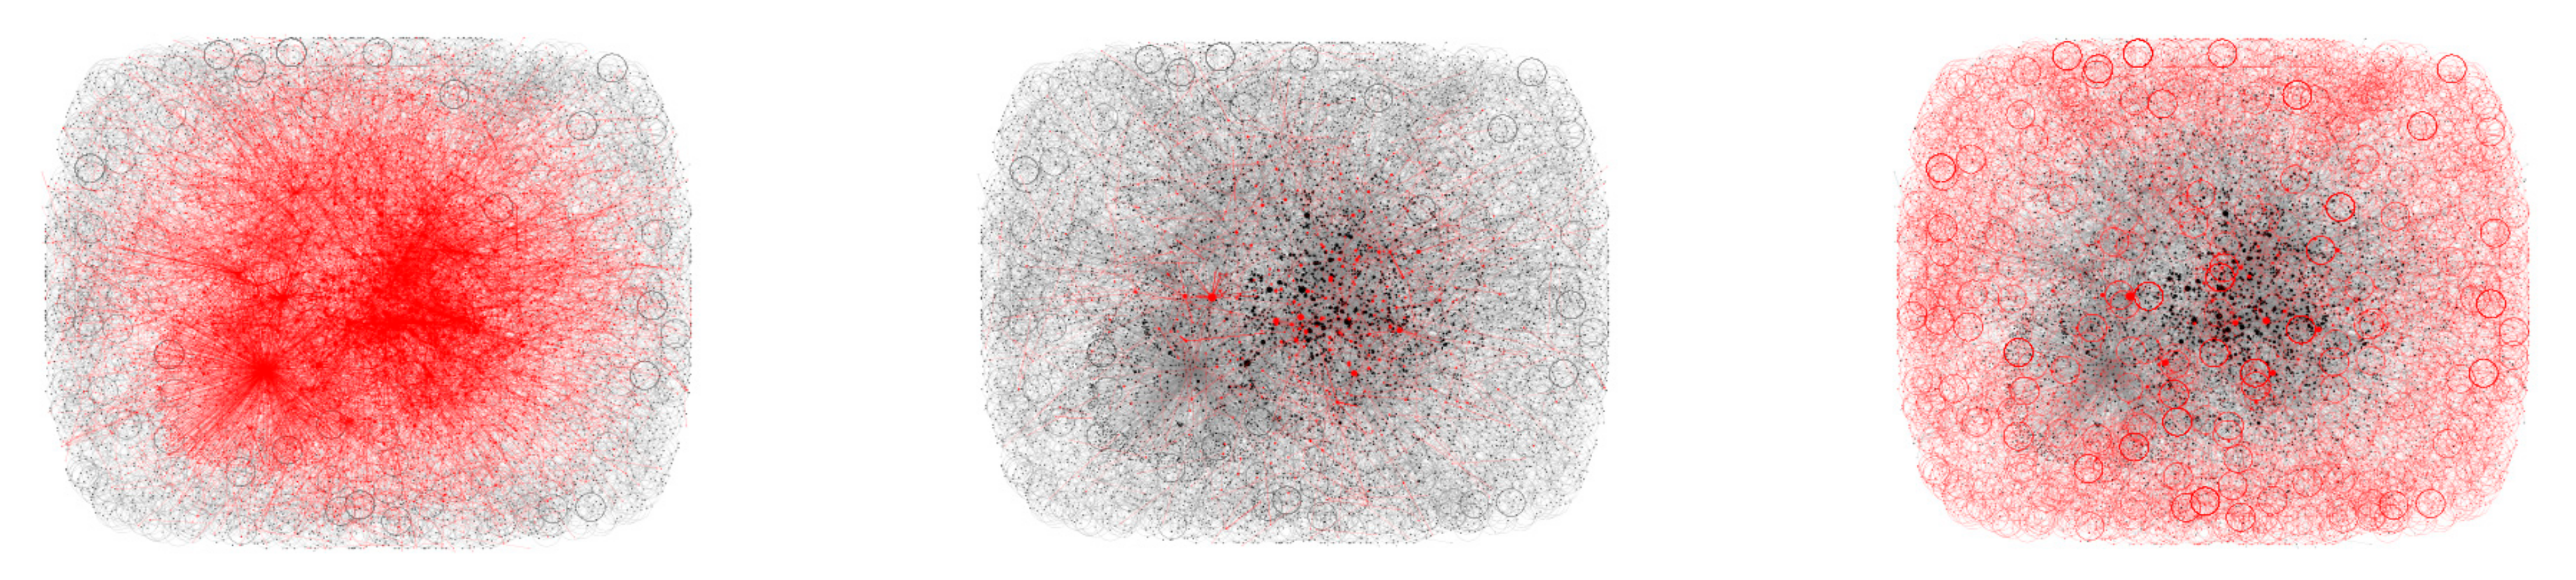
35]. As for
Figure 2, the graph at issue comprises three subgraphs, each reflecting a different type of information flow. The left subgraph represents the “mention” group, the middle signifies the “replies-to” group, and the right denotes the “self-loop” group. A mention occurs when an individual includes another Twitter user’s handle in their tweet to draw attention to that user or engage them in the conversation. The mention group subgraph illustrates the connections generated when people mention others in their “#g20” tweets. The replies-to group reflects direct contact between users in the context of a shared tweet about “#g20”, such as when one user replies to another user’s tweet. The self-loop group consists of tweets that are shared without referencing other users or engaging in direct dialogue. All three subgraphs depict various forms of interactions on the hashtag “#g20”, allowing us to observe the nature of information flow and discussion dynamics.
According to
Table 5, within the 20,000 edges, the “mention”, “replies to” and “self-loop” groups for “#g20” number 12,312, 5397, and 648, respectively. “Mention” tweets account for approximately 66.7% of all tweets, which is more than double the amount of “replies to” and “self-loop” tweets combined.
Table 5 also shows that mentions are a common and effective method for propagating news on social media. The reciprocity ratio, or the proportion of mutual followers, has also been confirmed as a strong predictor of the frequency of retweets (H1). According to the long tail theory, individual users will become increasingly important in the long-term distribution of political news on social media.
In conclusion, both hypotheses are accepted. The frequency of retweeting will increase as the reciprocity ratio of a Twitter account increases, and key opinion leaders will play a more significant role than individual users in spreading political information on Twitter.
4.2. Content Analysis
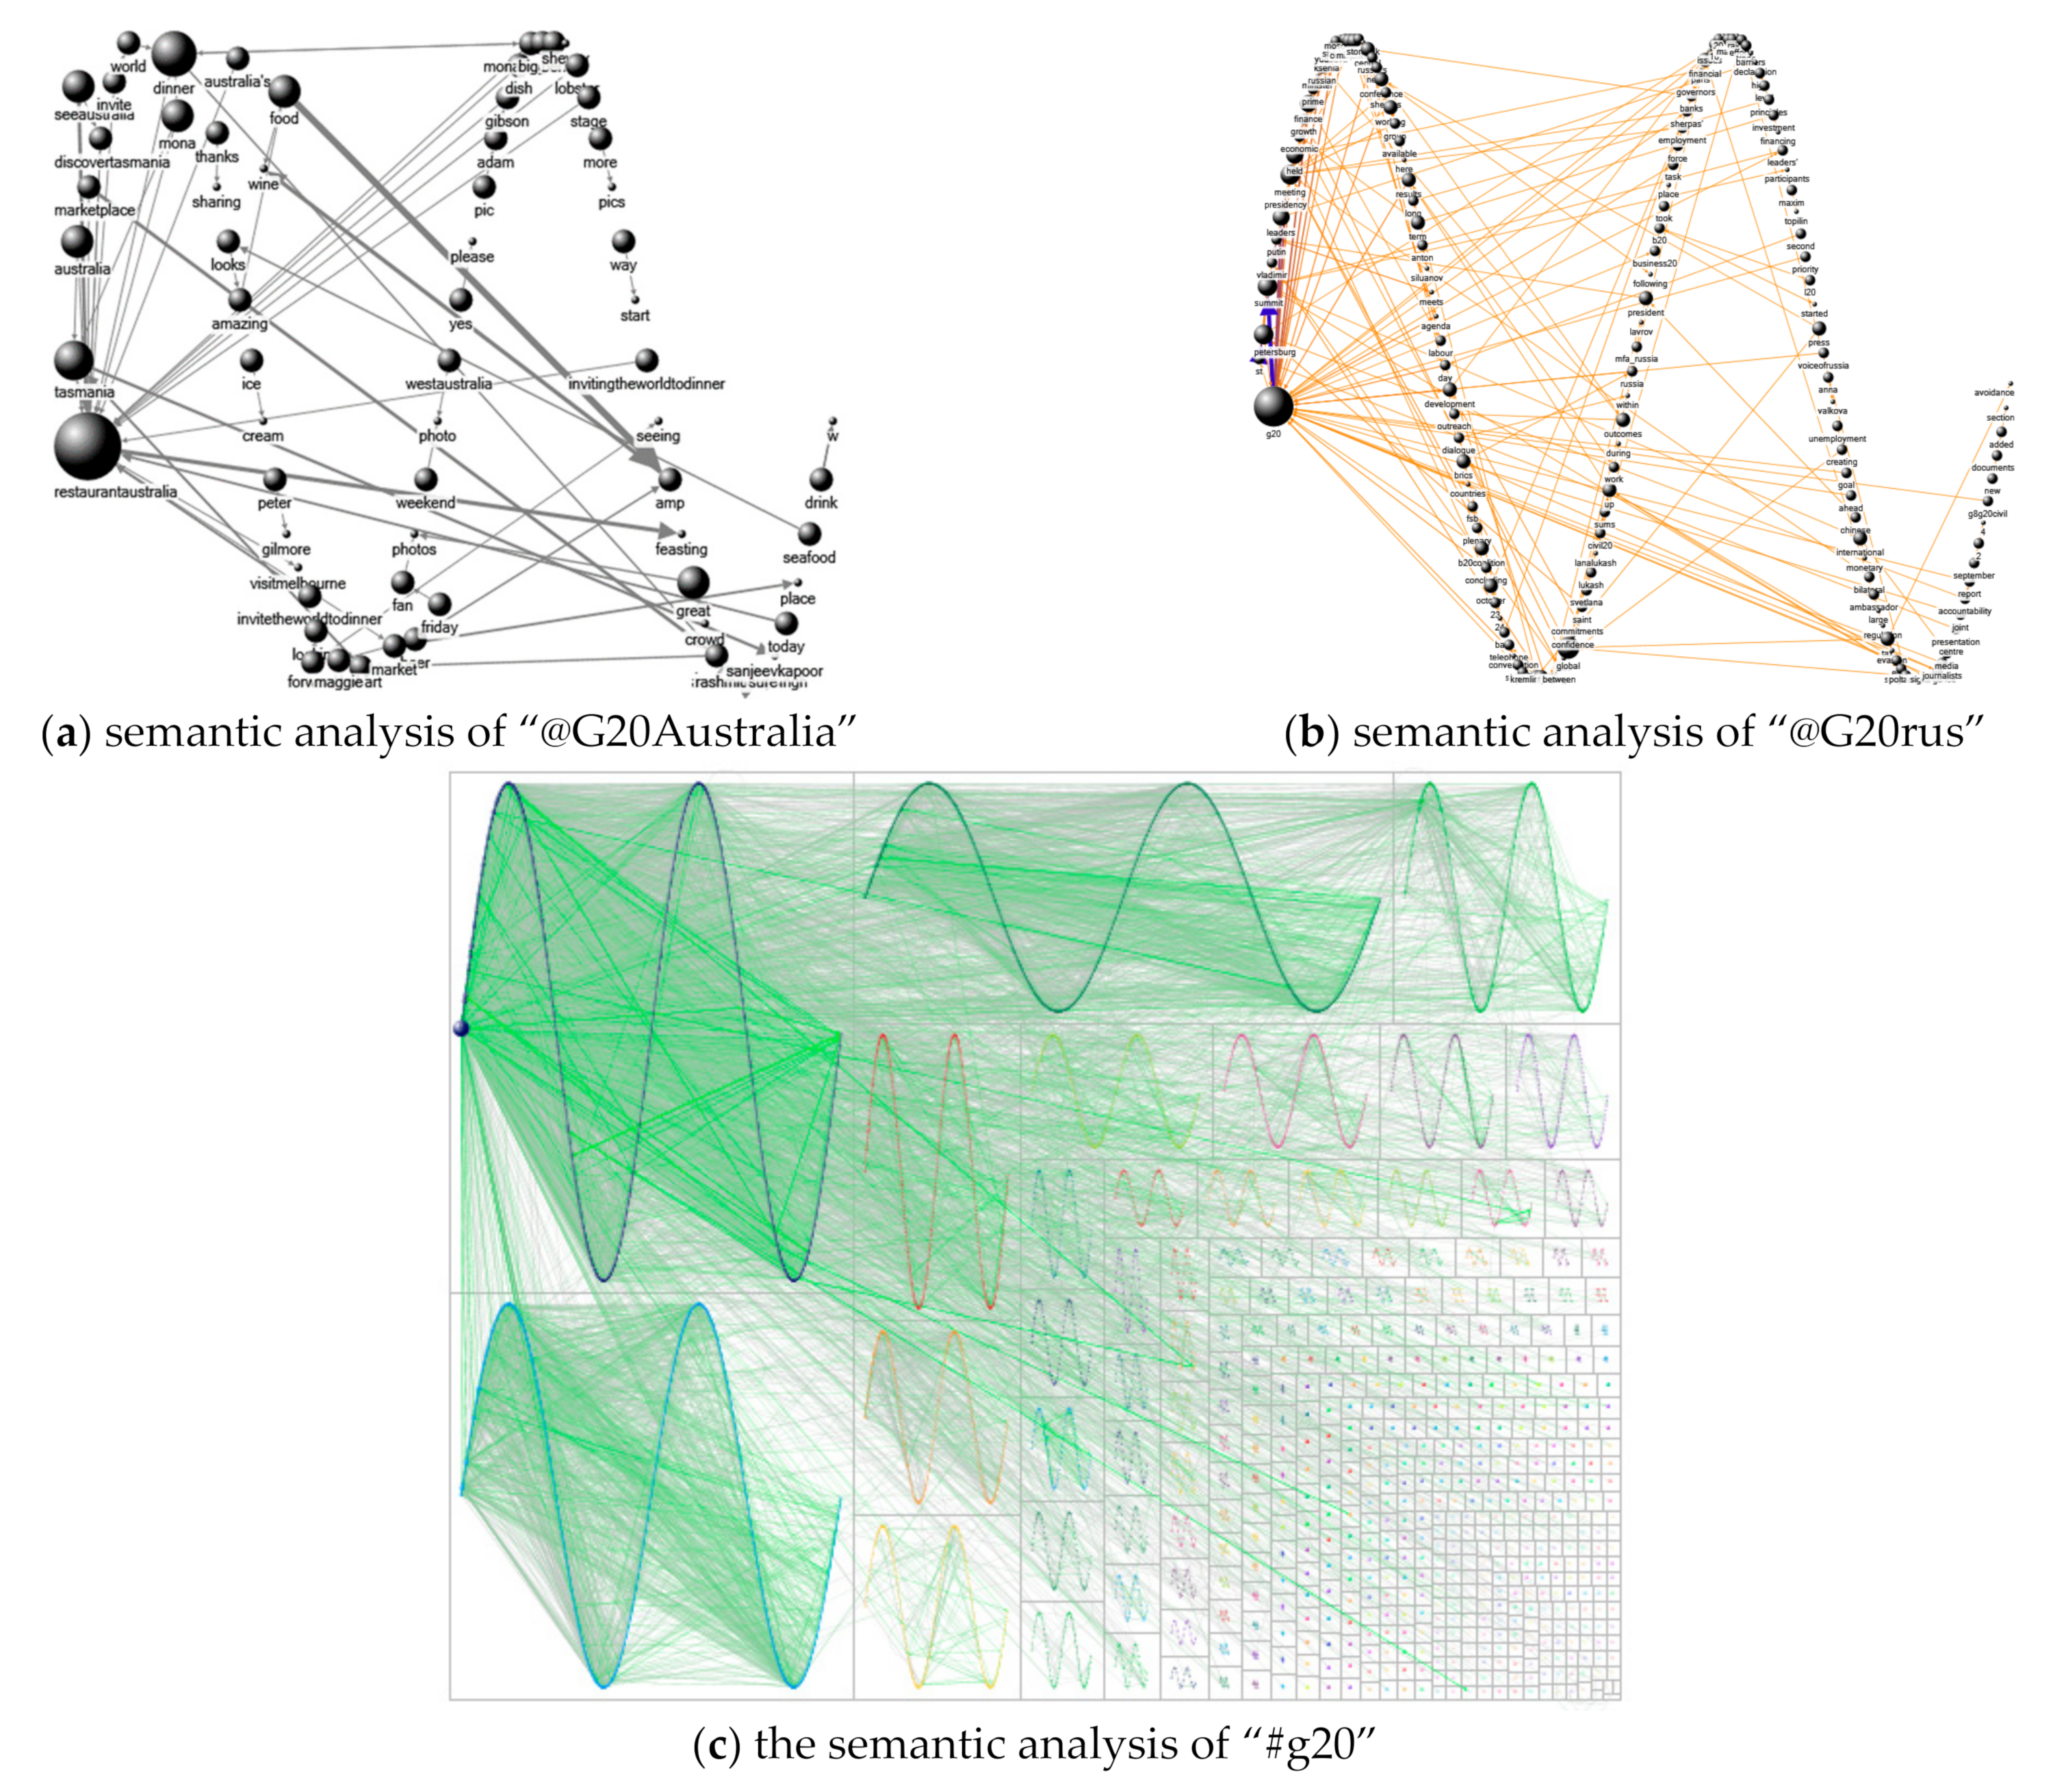
Figure 3 presents a clustering of word pairs for the Twitter handles “@G20Australia” and “@G20rus”, generated with NodeXL. The graphs depict a semantic analysis of the Twitter accounts “@G20Australia”, “@G20rus”, and “#g20”, created using NodeXL. The size of each node in the graph is determined by its in-degree value. A larger node size corresponds to a higher in-degree value, which measures the number of incoming edges.
Figure 3a represents the semantic analysis of “@G20Australia”,
Figure 3b shows the semantic analysis of “@G20rus”, and
Figure 3c illustrates the semantic analysis of “#g20”. These figures offer an understanding of the various topics and issues being discussed within each handle and allow for a comparative analysis of the conversation dynamics across the handles.
Regarding the word pairs used, this depiction clearly highlights the similarities and differences between the two handles. The number of topics appears to be positively correlated with the number of word pair edges. Compared to the structured analysis of “#g20” displayed in
Figure 1, the content analysis of “#g20” seems to contain fewer subgroups. This observation is further supported by data from the top 20 semantic “#g20” subgroups reported in
Table 4. According to the analysis, semantic subgroups comprise 9911 nodes (76% of nodes generated in structured analysis) and 14,111 edges (77% of edges generated in structured analysis). The top vertices ratio of semantic “#g20” is calculated to be 76.86%, which is substantially higher than the 30.13% (top vertices ratio of structured analysis), and the top edges ratio is 86.21%, which is significantly greater than the 41.16% in structured analysis. These results suggest that content analysis of “#g20” is more effective in identifying major themes within the dataset, and the subgroup is more concentrated in terms of nodes and edges.
The metrics generated by semantic word pairs in the hashtag “#g20” are displayed in
Table 6 below. This differs from
Table 2, which examined the structure of “#g20”. For the semantic analysis of “#g20”, the total number of vertices is 9911, and the total number of edges is 14,111. Additionally, the semantic analysis of “#g20” only includes 32 “self-loops”, so this will not be further compared as a variable. G1–G20 represent a breakdown of the primary themes mentioned in the “#g20” dataset and correspond to the top 20 subgroups selected based on their in-degree.
According to the studies mentioned above, a fundamental distinction between the structural and semantic distributions of “#g20” is that the latter is highly concentrated and homogeneous. This suggests that the use of Twitter hashtags, such as “#g20”, allows for the more effective dissemination of clear messages. Moreover, the semantic distribution of “#g20” does not seem to follow the long tail theory, which posits that a large number of niche products can account for a market share equal to or greater than that of the relatively few current bestsellers and blockbusters.
As previously discussed, the semantic distribution of most tweets on Twitter adheres to the long tail theory; however, “#g20” tweets do not. As a result, we predict that the hashtag of political issues will exhibit a different semantic distribution. We plan to investigate further in subsequent research projects and analyze more similar political topics to arrive at a final conclusion on whether the hashtag of political issues will follow the same rule as standard tweets on Twitter.
5. Discussion
The rapid rise of social media in recent years has underscored the significant role it plays in people’s lives. With the popularity of these platforms, more individuals are expressing their views and spreading information online, thereby increasing their exposure and influence over the social media audience. This study aims to better understand the characteristics of information diffusion on Twitter and other social media platforms, particularly concerning political information, using social network analysis and data visualization.
Three critical features of information diffusion on Twitter have been identified through this study. These characteristics can serve as valuable references for future information management. Although Twitter is not accessible in China, there are similar social media platforms, such as Weibo and WeChat Moments. By applying the findings from this paper, we believe that information can be better identified and managed in daily life.
The two hypotheses proposed earlier in this paper have been supported and accepted.
First, the frequency of retweeting will increase with the mutual friends’ ratio of a Twitter account. Compared to strangers, mutual friends typically maintain closer contact, leading to more efficient information diffusion and recognition. This finding is in line with [
19]’s proposal, arguing that the activity effect becomes stronger as social networks densify. In addition to mutual friends, this study discovered that a high reciprocity ratio enhances interaction frequency, thus boosting information diffusion efficiency.
Second, key opinion leaders play a more significant role than individual users in disseminating political information on Twitter. As Ref. [
36] demonstrated, the authority and influence of key opinion leaders ensure high communication effectiveness. Their positive narratives can guide the sentiments of ordinary users while achieving information diffusion. Furthermore, we observed that individual users are becoming increasingly vital in online news media and information diffusion. For instance, during the early stages of the COVID-19 pandemic, the disclosures by Li Wenliang (the doctor who first reported COVID-19 in China) brought attention to the virus and encouraged preventative measures. Although Li Wenliang was a comparatively unknown figure, his voice was amplified in the social media era, an occurrence previously unthinkable. His revelations sparked a wave of skepticism about the government’s reporting on COVID-19 and swiftly spread fear about the virus on social media platforms. However, the government, with the help of key opinion leaders such as Zhong Nanshan and Zhang Wenhong, managed to spread knowledge about COVID-19, reducing public fear and restoring trust in the government through their professional expertise.
Third, regarding the difference between the structural and semantic distributions of “#g20” tweets on Twitter, our data visualization confirms that political issue hashtags exhibit a distinct semantic distribution compared to most tweets on Twitter. The results are also in line with [
32], which suggests that structural analysis is different from traditional methods. As discussed earlier, the semantic distribution of most tweets on Twitter follows the long tail theory. Whether this rule applies directly to Weibo or other Chinese social media platforms requires further research and analysis. However, given the functional similarities between Weibo and Twitter, this paper leans toward the assumption that Twitter’s hashtag rules also apply to Weibo. Previous research on gene editing has highlighted differences between Twitter and Weibo. For instance, a broader range of topics were discussed on Twitter, focusing on diverse areas, while topics on Weibo primarily centered around the International Summit [
37].
In light of the rapid spread of COVID-19, some information diffusion was uncontrolled during the pandemic, with deliberate rumor-spreading and occasional public questioning of government credibility. The findings in this paper can provide guidance for managing information diffusion, especially for political issues and health information.
6. Conclusions
In conclusion, this paper demonstrates that the role of individuals is becoming increasingly significant in the landscape of online news media. While major news organizations and media outlets continue to play vital roles in information diffusion, the long-tail theory suggests that a large number of independent users are beginning to contribute significantly to information diffusion, potentially playing a crucial role in the future. On online news media platforms, the reciprocity ratio positively correlates with the frequency of retweeting, and mentions have proven to be a particularly effective strategy for news sharing. Building bilateral relationships using online media platforms can also enhance the chances of information diffusion. Organizations and governments should pay more attention to the purpose of hashtags, as they can help to manage information about specific topics effectively. Given the widespread nature of COVID-19, governments can also use the findings of this paper to better manage health communication dissemination by using hashtags and collaborating with professional key opinion leaders.
6.1. Theoretical Implication
This paper employs social network analysis (SNA) and NodeXL to investigate and assess the spread of the “G20 Summit”, with the aim of establishing connections between Twitter and the dissemination of the “G20 Summit.” It also identifies factors that might influence the spread of political issues on online social media networks. The study findings confirm that the semantic distribution of tweets on Twitter follows the long tail theory. This paper verifies that using the hashtag “#” on Twitter enables more effective message delivery, and that “mention” is a prevalent and successful method for sharing news; the use of “mention” on Twitter attracts people to specific topics. Our content analysis reveals that users with mutual friendships have a higher frequency of retweets, which also promotes news distribution. Furthermore, we anticipate that individual users will play an increasingly crucial role in the future, especially in the distribution of political news, even though key opinion leaders continue to play a substantial role in current society.
In this study, we also propose that the hashtag of political topics will exhibit a different semantic distribution that does not follow the long tail theory; however, we did not conduct further social network analysis to confirm this hypothesis. We plan to test this hypothesis in future research projects and analyze more political issues in recent years. The research findings also suggest some practical implications for social media platforms. Although we only analyze Twitter data using NodeXL, the rules and conclusions of Twitter might be applicable to other social media platforms such as Weibo, Facebook, and WeChat. In practice, governments and businesses can use hashtags to deliver more effective messages online, and if you want to draw someone’s attention to a webpage, you can mention them in the same way you would on Twitter. Moreover, our research suggests that if you wish to increase your communication frequency with someone, you should establish a mutual friendship by following each other. With the advancement of social media and the internet, individual users are likely to enjoy rapid development in the future, and everyone has the potential to become “a big player” online.
6.2. Practical Implication
In practice, our research results can be used to help the government promote information diffusion. During COVID-19 or other emergencies, the government can refer to our research results and cooperate with key opinion leaders to improve the publicity effect. Especially during the COVID-19 pandemic, ordinary people are not aware of the novel coronavirus, so they are afraid of the pandemic and cannot return to normal life. There are also many discussions on various social media, but the information sources are complex, and it is difficult for ordinary people to discern the authenticity of them. By setting up official social media accounts on Weibo or Twitter, the government can invite medical experts such as Zhong Nanshan and Zhang Wenhong to spread medical and health knowledge on official social media accounts. Such measures will greatly enhance people’s confidence in information diffusion and help the government manage the diffusion of health information.
For companies, our research results can provide suggestions for brand marketing. In modern society, many companies operate their own social media accounts, and some news and corporate activities are also published on social media platforms. According to our research results, when companies publish information on social media, they can establish a bilateral relationship with the audience, such as becoming mutual friends or responding to users’ inquiries in a timely manner. In addition, the “mention” function is also a very important tool to remind each other, thus enhancing the interaction between users and corporate brands, and increasing the stickiness of consumers.
In addition, individuals are playing an increasingly important role on social media platforms, with a large amount of user-generated content (UGC) appearing on social media platforms. According to our research, although personal social media accounts are not as influential as key opinion leaders, it is expected that individuals will play an increasingly important role on social media platforms in the future. However, this phenomenon may raise new issues, such as how to ensure the authenticity and effectiveness of information when political information is disseminated through personal social media accounts. As another example, due to the fragmentation of information and freedom of speech, some information on personal social media accounts may be irrational or violent. Thus, how should the government effectively manage the spread of political information on personal social media? This will be one of interesting topics we hope to study in the future.
6.3. Limitation and Future Research
This research has several limitations, as follows:
We propose that the hashtag of political issues will not follow the same rule as regular tweets on Twitter, but we did not analyze enough political subjects.
The external validity of the study is limited because it only examined a small number of political topics; more research on other subjects is necessary to establish stronger generalization.
The limited sample size of this study (fewer than 20,000 edges) reveals the limits of NodeXL’s functionalities. The study was unable to examine the impact of information diffusion cascades.
There is much more to be discovered in the realm of social networks and online news media, and these discoveries need to be updated and broadened as society and technology evolve.
In the future, we will examine more political issues and information related to COVID-19 in order to differentiate between political issues and health information tweets. We aim to use R studio or Python to access more data and analyze more edges, which will lead to improved validity and generalization.
Author Contributions
Conceptualization, X.Z. and Y.P.; methodology, Y.W.; software, Y.W.; validation, X.Z., Y.P. and Y.W.; formal analysis, X.Z.; investigation, X.Z.; resources, X.Z.; data curation, X.Z.; writing—original draft preparation, X.Z.; writing—review and editing, C.X.; visualization, C.X.; supervision, Y.S.; project administration, X.Z.; funding acquisition, X.Z. All authors have read and agreed to the published version of the manuscript.
Funding
Beijing the Great Wall scholars training program (project number: CIT&TCD20180314); Project Supported by the National Social Science Foundation in the later stage (project number: 19FGLB025); Supported by the Zhiyuan Science Foundation of BIPT (No. 2023009).
Data Availability Statement
The data presented in this study are available on request from the corresponding author.
Conflicts of Interest
The authors declare no conflict of interest.
References
- Dickinson, T. The machinery of hope. Roll. Stone 2008, 1048, 36–42. [Google Scholar]
- Raoof, J.K.; Zaman, H.B.; Ahmad, A.; Al-Qaraghuli, A. Using social network systems as a tool for political change. Int. J. Phys. Sci. 2013, 8, 1143–1148. [Google Scholar]
- Scott, J. Trend report social network analysis. Sociology 1988, 22, 109–127. [Google Scholar] [CrossRef]
- Otte, E.; Rousseau, R. Social network analysis: A powerful strategy, also for the information sciences. J. Inf. Sci. 2002, 28, 441–453. [Google Scholar] [CrossRef]
- Vergeer, M. Twitter and political campaigning. Sociol. Compass 2015, 9, 745–760. [Google Scholar] [CrossRef]
- Bakshy, E.; Karrer, B.; Adamic, L.A. Social influence and the diffusion of user-created content. In Proceedings of the 10th ACM Conference on Electronic Commerce, Stanford, CA, USA, 6–10 July 2009; pp. 325–334. [Google Scholar]
- Hönings, H.; Knapp, D.; Nguyễn, B.C.; Richter, D.; Williams, K.; Dorsch, I.; Fietkiewicz, K.J. Health information diffusion on Twitter: The content and design of WHO tweets matter. Health Inf. Libr. J. 2022, 39, 22–35. [Google Scholar] [CrossRef]
- Kizgin, H.; Jamal, A.; Rana, N.; Dwivedi, Y.; Weerakkody, V. The impact of social networking sites on socialization and political engagement: Role of acculturation. Technol. Forecast. Soc. Chang. 2019, 145, 503–512. [Google Scholar] [CrossRef]
- Can, U.; Alatas, B. A new direction in social network analysis: Online social network analysis problems and applications. Phys. A Stat. Mech. Its Appl. 2019, 535, 122372. [Google Scholar] [CrossRef]
- Li, X.; Xie, Q.; Jiang, J.; Zhou, Y.; Huang, L. Identifying and monitoring the development trends of emerging technologies using patent analysis and Twitter data mining: The case of perovskite solar cell technology. Technol. Forecast. Soc. Chang. 2020, 146, 687–705. [Google Scholar] [CrossRef]
- Bennett, W.L. Changing citizenship in the digital age. In Civic Life Online: Learning How Digital Media Can Engage Youth; Bennett, W.L., Ed.; The MIT Press: Cambridge, MA, USA, 2008; pp. 1–24. [Google Scholar]
- Lu, S.; Liang, P.; Yang, Y.; Li, K. Recruitment of the pre-motor area in human inductive reasoning: An fMRI study. Cogn. Syst. Res. 2010, 11, 74–80. [Google Scholar] [CrossRef]
- Panagiotopoulos, P.; Sams, S. An Overview Study of Twitter in the UK Local Government. 2012. Available online: https://bura.brunel.ac.uk/bitstream/2438/6471/2/tGov2012%20An%20Overview%20Study%20of%20Twitter%20in%20the%20UK%20Local%20Government.pdf (accessed on 30 May 2022).
- Kwak, H.; Lee, C.; Park, H.; Moon, S. What is Twitter, a social network or a news media? In Proceedings of the 19th International Conference on World Wide Web, Raleigh, NC, USA, 26–30 April 2010; pp. 591–600. [Google Scholar]
- Verweij, P. Twitter links between politicians and journalists. J. Pract. 2012, 6, 680–691. [Google Scholar] [CrossRef] [Green Version]
- Starke, C.; Marcinkowski, F.; Wintterlin, F. Social networking sites, personalization, and trust in government: Empirical evidence for a mediation model. Soc. Media+ Soc. 2020, 6, 2056305120913885. [Google Scholar] [CrossRef]
- Zerback, T.; Wirz, D.S. Appraisal patterns as predictors of emotional expressions and shares on political social networking sites. Stud. Commun. Sci. 2021, 21, 27–45. [Google Scholar] [CrossRef]
- Himelboim, I.; Smith, M.A.; Rainie, L.; Shneiderman, B.; Espina, C. Classifying Twitter topic-networks using social network analysis. Soc. Media+ Soc. 2017, 3, 2056305117691545. [Google Scholar] [CrossRef] [Green Version]
- Chen, M.S.; Han, J.; Yu, P.S. Data mining: An overview from a database perspective. IEEE Trans. Knowl. Data Eng. 1996, 8, 866–883. [Google Scholar] [CrossRef] [Green Version]
- Smith, M.A. NodeXL: Simple network analysis for social media. In Proceedings of the 2013 International Conference on Collaboration Technologies and Systems (CTS), San Diego, CA, USA, 20–24 May 2013; pp. 89–93. [Google Scholar] [CrossRef]
- Smith, M.A.; Shneiderman, B.; Milic-Frayling, N.; Mendes Rodrigues, E.; Barash, V.; Dunne, C. Analyzing (social media) networks with NodeXL. In Proceedings of the Fourth International Conference on Communities and Technologies, University Park, PA, USA, 25–27 June 2009; pp. 255–264. [Google Scholar]
- Zhao, W.X.; Jiang, J.; Weng, J.; He, J.; Lim, E.P.; Yan, H.; Li, X. Comparing twitter and traditional media using topic models. In Advances in Information Retrieval: 33rd European Conference on IR Research, ECIR 2011, Dublin, Ireland, 18–21 April 2011; Proceedings 33; Springer: Berlin/Heidelberg, Germany, 2011; pp. 338–349. [Google Scholar]
- Ahmed, W.; Lugovic, S. Social media analytics: Analysis and visualisation of news diffusion using NodeXL. Online Inf. Rev. 2018, 43, 149–160. [Google Scholar] [CrossRef] [Green Version]
- Rahevar, M.; Parmar, M.; Karangiya, R. Impact of Demonetization in India using Opinion Mining over Twitter Data. Int. J. Sci. Res. Comput. Sci. Eng. Inf. Technol. 2020. [Google Scholar] [CrossRef]
- Liao, S.; Wang, J.; Yu, R.; Sato, K.; Cheng, Z. CNN for situations understanding based on sentiment analysis of twitter data. Procedia Comput. Sci. 2017, 111, 376–381. [Google Scholar] [CrossRef]
- Wukich, C. Connecting mayors: The content and formation of twitter information networks. Urban Aff. Rev. 2022, 58, 33–67. [Google Scholar] [CrossRef]
- Wu, S.; Hofman, J.M.; Mason, W.A.; Watts, D.J. Who says what to whom on twitter. In Proceedings of the 20th International Conference on World Wide Web, Hyderabad, India, 28 March–1 April 2011; pp. 705–714. [Google Scholar]
- Xu, J.; Qiang, Y. Analysing information diffusion in natural hazards using retweets—A case study of 2018 Winter Storm Diego. Ann. GIS 2022, 28, 213–227. [Google Scholar] [CrossRef]
- Uchino, B.N.; Holt-Lunstad, J.; Smith, T.W.; Bloor, L. Heterogeneity in social networks: A comparison of different models linking relationships to psychological outcomes. J. Soc. Clin. Psychol. 2004, 23, 123–139. [Google Scholar] [CrossRef]
- Rehman, A.U.; Jiang, A.; Rehman, A.; Paul, A.; Din, S.; Sadiq, M.T. Identification and role of opinion leaders in information diffusion for online discussion network. J. Ambient. Intell. Humaniz. Comput. 2020, 1–13. [Google Scholar] [CrossRef]
- Murphy, D.M.; Nourani, V.; Lee, D.R. Chatting at church: Information diffusion through religious networks. Rev. Econ. Stat. 2022, 104, 449–464. [Google Scholar] [CrossRef]
- Chai, C.; Lu, G.; Wang, R.; Lyu, C.; Lyu, L.; Zhang, P.; Liu, H. Graph-based structural difference analysis for video summarization. Inf. Sci. 2021, 577, 483–509. [Google Scholar] [CrossRef]
- D’Andrea, A.; Ferri, F.; Grifoni, P. An Overview of Methods for Virtual Social Networks Analysis; Springer: London, UK, 2010; pp. 3–25. [Google Scholar]
- Anderson, C. The long tail. Wired 2004, 10, 12. [Google Scholar]
- Han, K.K.; Misra, S. Characteristics of the opinion leader: A new dimension. J. Advert. 1990, 19, 53–60. [Google Scholar] [CrossRef]
- Gu, X.; Chen, F.; Yang, X.; Chen, H.; Wang, Y.; Hou, J.; Long, R.; Wang, Y. Evolutionary trend and network structure characteristics of publicity information dissemination about waste separation by different opinion leaders. Resour. Conserv. Recycl. 2023, 194, 106991. [Google Scholar] [CrossRef]
- Ji, J.; Robbins, M.; Featherstone, J.D.; Calabrese, C.; Barnett, G.A. Comparison of public discussions of gene editing on social media between the United States and China. PLoS ONE 2022, 17, e0267406. [Google Scholar] [CrossRef]
| Disclaimer/Publisher’s Note: The statements, opinions and data contained in all publications are solely those of the individual author(s) and contributor(s) and not of MDPI and/or the editor(s). MDPI and/or the editor(s) disclaim responsibility for any injury to people or property resulting from any ideas, methods, instructions or products referred to in the content. |
© 2023 by the authors. Licensee MDPI, Basel, Switzerland. This article is an open access article distributed under the terms and conditions of the Creative Commons Attribution (CC BY) license (https://creativecommons.org/licenses/by/4.0/).


