
Preparedness Indicator System for Education 4.0 with FUCOM and Rough Sets

 , , , ,
  , , , ,

Abstract
:1. Introduction
2. Preliminaries
2.1. Rough Set Theory
2.2. Full Consistency Method
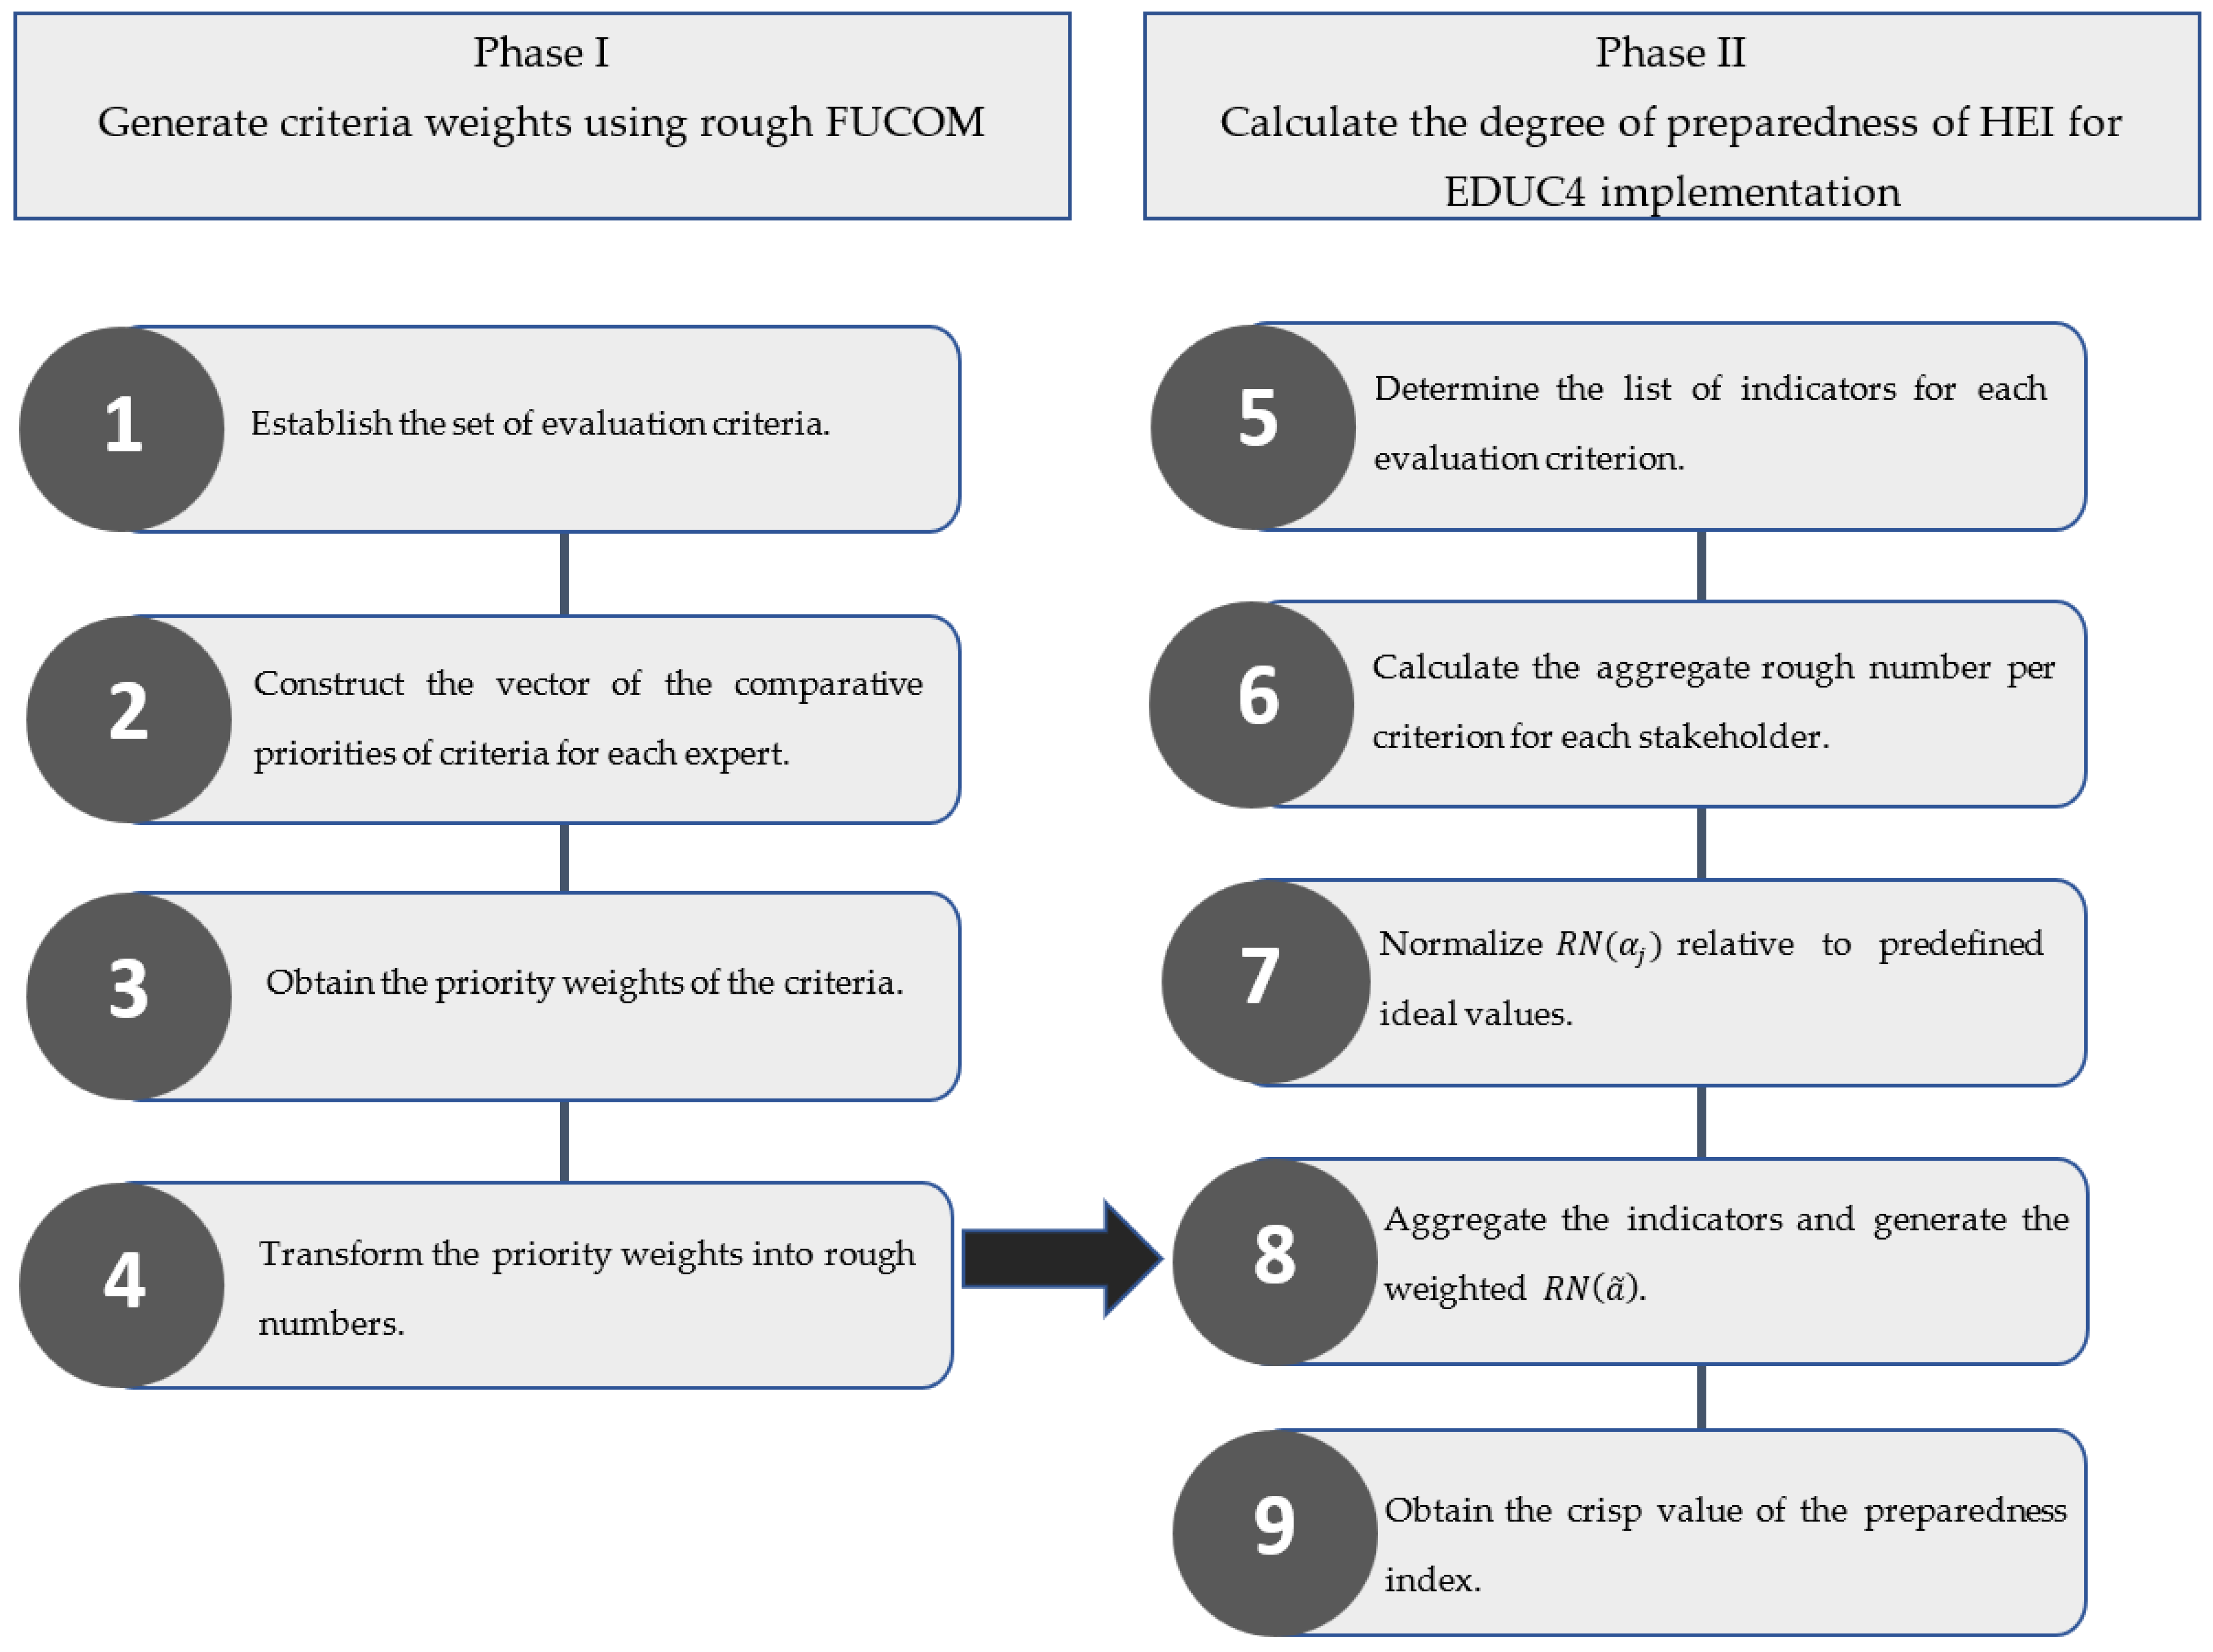
3. Development of the Proposed EDUC4 Preparedness Indicator System
3.1. Case Study Background
3.2. Application of the Proposed Methodology
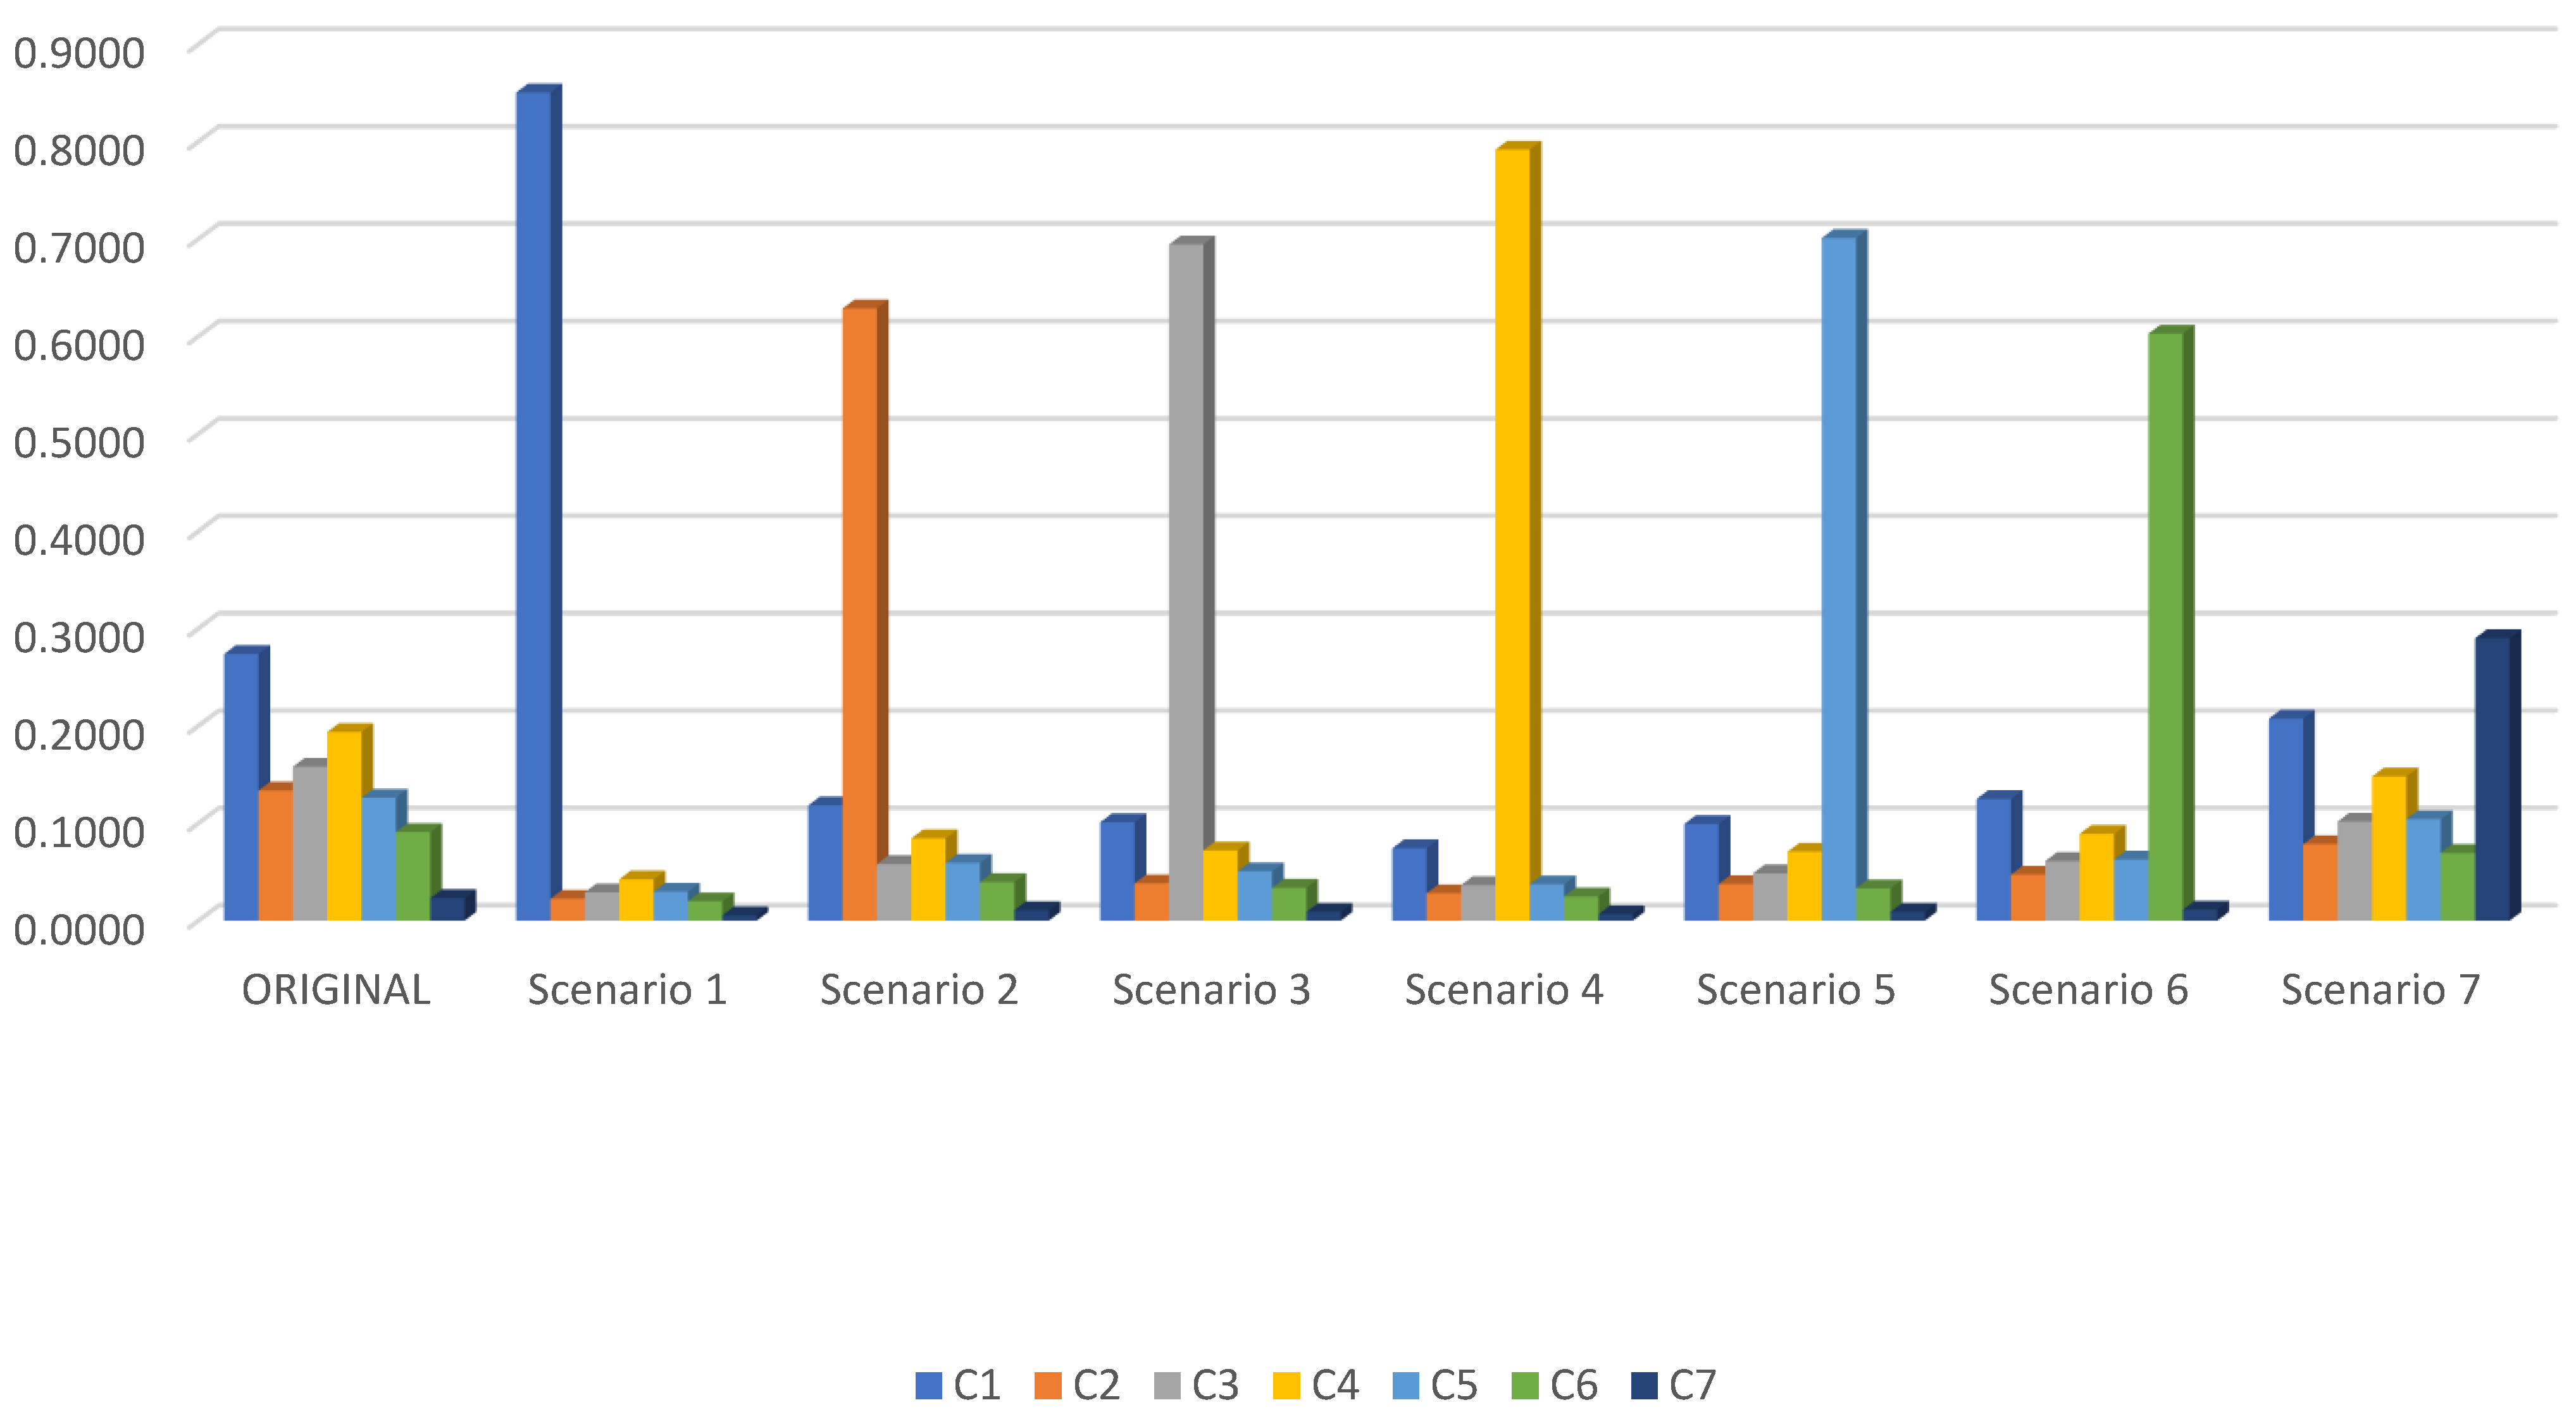
4. Sensitivity and Comparative Analysis
5. Results and Discussion
6. Conclusions
Author Contributions
Funding
Institutional Review Board Statement
Informed Consent Statement
Data Availability Statement
Conflicts of Interest
Appendix A

| Mapping of Components | ||||||||||||
|---|---|---|---|---|---|---|---|---|---|---|---|---|
| Criterion | A1 | A2 | A3 | A4 | A5 | A6 | A7 | A8 | A9 | |||
| C1 | Human resources | |||||||||||
| C11 | Percentage of educators who attended relevant EDUC4 training and seminars | X | X | X | X | X | X | X | ||||
| C12 | Degree of educators’ utilization of innovative pedagogical approaches (e.g., problem-based, project-based, game-based, and action-oriented) | X | X | X | X | X | X | X | X | X | ||
| C13 | Degree of educators’ utilization of innovative assessment methods | X | X | X | X | X | X | X | X | X | ||
| C14 | Percentage of educators who utilize digital technologies for effective teaching and learning process | X | X | X | X | X | X | X | X | X | ||
| C15 | Degree of the utilization of hybrid teaching modality | X | X | X | X | X | X | X | X | X | ||
| C16 | Degree of educators’ competence in designing digital educational materials (e.g., audio clips, video content/presentations, digital portfolios, social networking, and websites) for learning enhancement | X | X | X | X | X | X | X | X | X | ||
| C2 | Infrastructure | |||||||||||
| C21 | ICT Infrastructure | |||||||||||
| C211 | Computer units to student ratio | X | X | X | X | X | X | X | X | |||
| C212 | Peripherals: number of printers, document scanners, opaque projectors, projectors, or smart TVs | X | X | X | X | X | X | X | ||||
| C213 | Availability of a Local Area Network (LAN) | X | X | X | X | X | X | X | X | |||
| C214 | Availability of a university website | X | X | X | X | X | X | |||||
| C215 | Number of teleconferencing and videoconferencing equipment | X | X | X | X | X | X | X | X | X | ||
| C216 | Number of 3D printers | X | X | X | X | X | X | X | X | |||
| C22 | Infrastructure for online learning | |||||||||||
| C221 | Internet connectivity on the campus | |||||||||||
| C2211 | Average Internet speed | X | X | X | X | X | X | X | X | X | ||
| C2212 | Availability of free Wi-Fi | X | X | X | X | X | X | X | X | X | ||
| C222 | Internet connectivity at home | |||||||||||
| C2221 | Provision of connectivity kits to students | X | X | X | X | X | X | X | X | X | ||
| C2222 | Average Internet speed | X | X | X | X | X | X | X | X | X | ||
| C2223 | University subscriptions to web conference platforms (e.g., Zoom, MS Teams, etc.) | X | X | X | X | X | X | X | X | X | ||
| C2224 | Existence of learning management systems | X | X | X | X | X | X | X | X | X | ||
| C2225 | Percentage of programs utilizing massive open online courses (MOOCs) | X | X | X | X | X | X | X | X | X | ||
| C23 | Other infrastructure relevant to EDUC4 implementation | |||||||||||
| C231 | Number of educational technology laboratories supportive of a flipped classroom approach, hybrid learning format, augmented and virtual reality learning spaces, etc. | X | X | X | X | X | X | X | X | X | ||
| C232 | Number of 21st-century cyber-physical systems for education (e.g., student monitoring devices embedded with sensors that communicate with smartphones and servers, smart classrooms (example: RFID-based door access control, interactive boards, AI service chatbot, etc.), and communication systems for emergencies) | X | X | X | X | X | X | X | X | X | ||
| C233 | Number of campus-learning centers to provide global exposure and partnership development for learners (e.g., fabrication laboratory, discussion rooms, etc.) | X | X | X | X | X | X | X | X | X | ||
| C234 | Number of interactive whiteboards | X | X | X | X | X | X | X | X | X | ||
| C235 | Number of infrastructures for connected classrooms (e.g., touchscreen devices, bring your own device such as smartphones, etc.) | X | X | X | X | X | X | X | X | X | ||
| C24 | Science Laboratories | |||||||||||
| C241 | Physics-related laboratories towards EDUC4 | |||||||||||
| C2411 | Number of AR–VR systems in physics-related laboratories | X | X | X | X | X | X | X | X | X | ||
| C2412 | Number of software subscriptions in physics-related laboratories | X | X | X | X | X | X | X | X | X | ||
| C242 | Chemistry-related laboratory towards EDUC4 implementation | |||||||||||
| C2421 | Number of AR–VR systems in chemistry-related laboratories | X | X | X | X | X | X | X | X | X | ||
| C2422 | Number of software subscriptions to chemistry-related laboratories | X | X | X | X | X | X | X | X | X | ||
| C243 | Biology-related laboratory towards EDUC4 implementation | |||||||||||
| C2431 | Number of AR–VR systems in biology-related laboratories | X | X | X | X | X | X | X | X | X | ||
| C2432 | Number of software subscriptions to biology-related laboratories | X | X | X | X | X | X | X | X | X | ||
| C25 | Library 4.0 | |||||||||||
| C251 | Number of computers in the physical library | X | X | X | X | X | X | X | X | X | ||
| C252 | Library automation software | |||||||||||
| C2521 | Availability of computerized cataloguing and classification | X | X | X | X | X | X | X | X | |||
| C2522 | Availability of Book to Desk (B2D) or desk booking utility | X | X | X | X | X | X | X | X | |||
| C2523 | Availability of mobile work list alerts and push information for academics | X | X | X | X | X | X | X | X | X | ||
| C253 | Number of library consortia | X | X | X | X | X | X | X | ||||
| C254 | Availability of library website | X | X | X | X | X | X | X | X | |||
| C255 | Library e-resources | |||||||||||
| C2551 | Degree of ease of access to library e-resources | X | X | X | X | X | X | X | X | |||
| C2552 | Degree of ease of finding relevant information | X | X | X | X | X | X | X | X | |||
| C2553 | Number of titles available | X | X | X | X | X | X | X | X | |||
| C2554 | Availability of full access to back issues | X | X | X | X | X | X | X | X | |||
| C2555 | Download speed | X | X | X | X | X | X | X | X | |||
| C2556 | Availability of access from home | X | X | X | X | X | X | X | X | |||
| C256 | Free Wi-Fi | X | X | X | X | X | X | X | X | X | ||
| C3 | Financial | |||||||||||
| C31 | Faculty capability enhancement | |||||||||||
| C311 | Budget allocated for educators to attend relevant training and seminars for EDUC4 | X | X | X | X | X | X | X | ||||
| C312 | Budget allocated for necessary equipment and materials (e.g., laptop) to be used by faculty | X | X | X | X | X | X | X | ||||
| C32 | Technology and infrastructure alignment | |||||||||||
| C321 | Proportion of annual budget allocated for equipment (e.g., hardware and software) supportive of EDUC4 implementation | X | X | X | X | X | X | X | X | X | ||
| C322 | Proportion of annual budget allocated for maintenance on a per-student basis | X | X | X | X | X | X | X | X | |||
| C323 | Proportion of annual budget allocated for data protection and safety on a per-student basis | X | X | X | X | X | X | X | X | |||
| C33 | Physical facilities and supplies | |||||||||||
| C331 | Proportion of annual budget allocated for facility construction and conversion (e.g., rooms, laboratories) to comply with EDUC4 standards | X | X | X | X | X | X | X | X | X | ||
| C332 | Proportion of annual budget allocated for office supplies and teaching materials necessary for EDUC4 | X | X | X | X | X | X | X | X | X | ||
| C333 | Proportion of annual budget allocated for maintaining EDUC4 facilities (e.g., rooms, laboratories) | X | X | X | X | X | X | X | X | X | ||
| C4 | Linkages | |||||||||||
| C41 | Education and training | |||||||||||
| C411 | Average number of hours required for on-the-job training | X | X | X | X | |||||||
| C412 | Number of training, seminars, and conferences conducted by guest lecturers from the industry | X | X | X | X | X | X | X | X | |||
| C413 | Number of university–industry collaborations/partnerships for the on-the-job training | X | X | X | X | X | X | X | X | |||
| C414 | Number of part-time lecturers from industry teaching at the university | X | X | X | X | X | X | |||||
| C415 | Number of educators working in consultancy for industry | X | X | X | X | X | ||||||
| C416 | Number of cooperative research projects with industry | X | X | X | X | X | X | X | X | X | ||
| C417 | Percentage of industry’s involvement in the system of determining the final proficiency rating of interns | X | X | X | X | X | ||||||
| C418 | Percentage of interns hired by the partner industries/institutions | X | X | X | X | |||||||
| C419 | Number of industry-funded laboratories in the university | X | X | X | X | X | X | X | X | X | ||
| C42 | Collaboration | |||||||||||
| C421 | Degree of partnerships with the local community across all aspects of education—from curricula and academics to infrastructure, research, study experience, and practicum | X | X | X | X | X | X | X | X | X | ||
| C422 | Availability of initiatives for developing curriculum and faculty partnerships with international universities | X | X | X | X | X | X | X | X | X | ||
| C423 | Existence of an internationalization office that fosters partnerships with international students and alumni | X | X | X | X | X | X | X | X | |||
| C424 | Existence of a community extension office | X | X | X | X | X | X | X | ||||
| C425 | Degree of partnerships with industry across all aspects of education—from curricula and academics to infrastructure, research, study experience, and practicum | X | X | X | X | X | X | X | X | X | ||
| C426 | Number of endorsement requests from industries intended for employment | X | X | X | X | X | X | |||||
| C5 | Educational management | |||||||||||
| C51 | Educational leaders’ commitment | |||||||||||
| C511 | Degree of involvement of the educational leaders (i.e., University President, Deans, and area chairpersons) in implementing EDUC4 activities | X | X | X | X | X | X | X | ||||
| C512 | Existence of a policy for the evaluation of the EDUC4 implementation | X | X | X | X | X | X | X | X | |||
| C513 | Number of EDUC4-related "quality issues" reviewed in educational leaders’ meetings | X | X | X | X | X | X | X | X | X | ||
| C514 | Number of EDUC4 strategic plans implemented by the top management | X | X | X | X | X | X | X | X | X | ||
| C52 | Relationship with stakeholders | |||||||||||
| C521 | Availability of the annual conduct of stakeholders’ meeting | X | X | X | X | |||||||
| C522 | Amount of stakeholders’ feedback used as a basis for improving EDUC4-related services in the university | X | X | X | X | X | ||||||
| C53 | Management support toward EDUC4 implementation | |||||||||||
| C531 | Inclusion of EDUC4 concepts in the university’s Vision, Mission, Goals, and Objectives | X | X | X | X | X | X | X | X | X | ||
| C532 | Existence of an office that monitors and evaluates EDUC4 integration in the delivery of the university core functions | X | X | X | X | X | X | X | X | X | ||
| C533 | Existence of a policy regarding hybrid teaching modality | X | X | X | X | X | X | X | X | X | ||
| C6 | Learners | |||||||||||
| C61 | Learners’ experience | |||||||||||
| C611 | Degree of the curriculum showing a strong linkage to real-world learning methods | X | X | X | X | X | X | X | X | X | ||
| C612 | Availability of flexible learning programs as options for students with various needs | X | X | X | X | X | X | X | X | X | ||
| C613 | Existence of a technology-driven feedback system so students can participate in the curriculum design | X | X | X | X | X | X | X | X | X | ||
| C614 | Extent of utilization of digital media-based collaboration and peer-to-peer learning tools for social learning and life development in the instructional delivery | X | X | X | X | X | X | X | X | X | ||
| C615 | Extent of learning opportunities that cater to varied levels of students’ capabilities until mastery of competency is attained | X | X | X | X | X | X | X | X | X | ||
| C616 | Degree of students’ utilization of digital technologies in interpreting and analyzing data | X | X | X | X | X | X | X | X | X | ||
| C62 | Teaching and learning experiences | |||||||||||
| C621 | Extent to which the delivery of instruction is through varied strategies, including individualized teaching, gamification and simulation, problem- and inquiry-based teaching and learning, and augmented and virtual reality | X | X | X | X | X | X | X | X | X | ||
| C622 | Availability of digital enablers (e.g., 3D printing and robotics) to enrich students’ creativity | X | X | X | X | X | X | X | X | X | ||
| C623 | Percentage of students exposed to participatory learning through field experiences | X | X | X | X | X | X | X | X | X | ||
| C624 | Utilization of flexible assignments to accommodate multiple learning styles | X | X | X | X | X | X | X | X | X | ||
| C625 | Availability of resources that make learning available at any time in any place | X | X | X | X | X | X | X | X | X | ||
| C63 | Students and curriculum design | |||||||||||
| C631 | Extent of the curriculum promoting the development of soft skills such as adaptability, learn-to-learn communication, social and cultural awareness, creativity, curiosity, empathy, initiative, leadership, critical thinking and analytical thinking, persistence, responsibility, problem solving, and teamwork | X | X | X | X | X | X | X | X | X | ||
| C632 | Extent of the curriculum promoting the development of hard skills such as digital technologies design, people management, quality management, technological resource management, risk management, time management, financial management, computational thinking, and creative problem solving | X | X | X | X | X | X | X | X | X | ||
| C633 | Extent of the design of the curriculum reflecting the use of the following technological drivers utilized in the delivery of instruction: cloud computing, artificial intelligence, Internet of Things, digital games, augmented reality, 5G networks, social networks, and other educational software | X | X | X | X | X | X | X | X | X | ||
| C634 | Degree of students’ use of the following EDUC4 tools in the teaching–learning process: cloud computing, artificial intelligence, Internet of Things, digital games, augmented reality, 5G networks, social networks, and other educational software | X | X | X | X | X | X | X | X | X | ||
| C635 | Extent of the curriculum emphasizing teaching digital citizenship (e.g., technology ethics, social, ethical, and legal responsibilities in the utilization of technological tools and resources, etc.) | X | X | X | X | X | X | X | X | X | ||
| C64 | Technology-based monitoring system of students’ performance | |||||||||||
| C641 | Extent of use of technology-based assessment tools (e.g., Kahoot, Quizlet) in checking content attainment | X | X | X | X | X | X | X | X | X | ||
| C642 | Availability of a digital media board for students to view individual feedback on performance in the industry | X | X | X | X | X | X | X | X | X | ||
| C65 | Student services | |||||||||||
| C651 | Availability of an online system booking for school services such as health, guidance counseling, and library use, among others | X | X | X | X | X | X | X | X | X | ||
| C7 | Health and environment | |||||||||||
| C71 | Screen viewing | |||||||||||
| C711 | Average number of screen-viewing hours daily | X | X | X | X | X | X | X | ||||
| C72 | Physical risk | |||||||||||
| C721 | Frequency of health-related effects experienced due to prolonged screen viewing for the last two (2) months (i.e., dry eyes, digital eye strain, fatigue, posture, etc.). | X | X | X | X | X | X | X | ||||
| C73 | Emotional risk | |||||||||||
| C731 | Did you feel any of the following (e.g., stress, loneliness, depression, anxiety, and impaired socializing skills) in relation to prolonged screen viewing? | X | X | X | X | X | X | X | ||||
| C74 | Cognitive risk | |||||||||||
| C741 | Did you feel any of the following (e.g., weakened emotional judgment, delayed learning, lower score in thinking and language tests) in relation to prolonged screen viewing? | X | X | X | X | X | X | X | ||||
| C75 | Time constraint for material preparation | |||||||||||
| C751 | Average amount of time needed to prepare digital educational materials per topic in a course | X | X | X | X | X | X | X | ||||
| C76 | Classroom layout | |||||||||||
| C761 | Percentage of physical classrooms with flexible seating arrangements that allow both independent and collaborative workstations | X | X | X | X | X | X | X | X | X | ||
| C762 | Degree of learning conduciveness of physical classrooms | X | X | X | X | X | X | X | ||||
| C77 | E-waste management | |||||||||||
| C771 | Existence of policy on e-waste management | X | X | X | ||||||||
| C772 | Degree of implementation of the policy related to e-waste management | X | X | X | ||||||||
| C773 | Annual volume of e-waste generated | X | X | |||||||||
| C774 | Annual volume of e-waste under circularity initiatives (e.g., reuse, reduce, recycle, recovery, redesign, and remanufacturing) | X | X | |||||||||
| Measurement Scale | Sampling Plan | Stakeholder | Ideal Value | Actual Score | Normalized Score | |
| C11 | % | Actual data | Human resource office | [1.0000, 1.0000] | [0.9000, 0.9000] | [0.9000, 0.9000] |
| C12 | 7-point Likert scale | At least 30% of the faculty members, randomly selected | Faculty | [7.0000, 7.0000] | [5.1132, 5.7347] | [0.7305, 0.8192] |
| C13 | 7-point Likert scale | At least 30% of the faculty members, randomly selected | Faculty | [7.0000, 7.0000] | [4.8478, 5.6295] | [0.6925, 0.8042] |
| C14 | % | Actual data | Deans | [1.0000, 1.0000] | [0.5719, 0.9534] | [0.5719, 0.9534] |
| C15 | 7-point Likert scale | At least 30% of the faculty members, randomly selected | Faculty | [7.0000, 7.0000] | [4.7111, 5.6821] | [0.6730, 0.8117] |
| C16 | 7-point Likert scale | At least 30% of the faculty members, randomly selected | Faculty | [7.0000, 7.0000] | [4.5590, 6.0973] | [0.6513, 0.8710] |
| C21 | Measurement scale | Sampling plan | Stakeholder | Ideal value | Actual score | Normalized score |
| C211 | ratio (%) | Actual data | Deans | [0.2000, 0.2000] | [0.0063, 0.0184] | [0.0316, 0.0922] |
| C212 | units per 100 students | Actual data | Deans | [1.3013, 1.3013] | [0.1650, 0.3651] | [0.1268, 0.2806] |
| units per 100 students | Actual data | Deans | [1.3013, 1.3013] | [0.0875, 0.2876] | [0.0673, 0.2210] | |
| units per 100 students | Actual data | Deans | [1.3013, 1.3013] | [0.0132, 0.0821] | [0.0101, 0.0631] | |
| units per 100 students | Actual data | Deans | [1.3013, 1.3013] | [0.1069, 0.2742] | [0.0821, 0.2107] | |
| units per 100 students | Actual data | Deans | [1.3013, 1.3013] | [0.7689, 1.2466] | [0.5909, 0.9579] | |
| C213 | 0 = No, 1 = Yes | Actual data | IT manager | [1.0000, 1.0000] | [1.0000, 1.0000] | [1.0000, 1.0000] |
| C214 | 0 = No, 1 = Yes | Actual data | IT manager | [1.0000, 1.0000] | [1.0000, 1.0000] | [1.0000, 1.0000] |
| C215 | units per 100 students | Actual data | Deans | [18.0000, 18.0000] | [0.0449, 0.3594] | [0.0025, 0.0200] |
| C216 | units per 100 students | Actual data | Deans | [1.1774, 1.1774] | [0.0310, 0.2789] | [0.0263, 0.2368] |
| C22 | Measurement scale | Sampling plan | Stakeholder | Ideal value | Actual score | Normalized score |
| C221 | average of the section component ratings | Actual data | [10.5000, 25.5000] | [6.5000, 10.5000] | [0.2549, 1.0000] | |
| C2211 | Mbps | Actual data | IT manager | [20.0000, 50.0000] | [12.0000, 20.0000] | [0.2400, 1.0000] |
| C2212 | 0 = Not available, 1 = Available | Actual data | IT manager | [1.0000, 1.0000] | [1.0000, 1.0000] | [1.0000, 1.0000] |
| C222 | average of the section component ratings | Actual data | ||||
| C2221 | 0 = No, 1 = Yes | Actual data | IT manager | [1.0000, 1.0000] | [1.0000, 1.0000] | [1.0000, 1.0000] |
| C2222 | Mbps | Actual data | IT manager | [20.0000, 50.0000] | [8.0000, 15.0000] | [0.1600, 0.7500] |
| C223 | 0 = No, 1 = Yes | Actual data | IT manager | [1.0000, 1.0000] | [1.0000, 1.0000] | [1.0000, 1.0000] |
| C224 | 0 = No, 1 = Yes | Actual data | IT manager | [1.0000, 1.0000] | [1.0000, 1.0000] | [1.0000, 1.0000] |
| C225 | % | Actual data | Registrar | [0.2000, 0.2000] | [0.0000, 0.0000] | [0.0000, 0.0000] |
| C23 | Measurement scale | Sampling plan | Stakeholder | Ideal value | Actual score | Normalized score |
| C231 | actual count | Actual data | Deans | [18.0000, 18.0000] | [0.4967, 2.4267] | [0.0276, 0.1348] |
| C232 | actual count | Actual data | Deans | [12.0000, 12.0000] | [0.1700, 1.0600] | [0.0142, 0.0883] |
| C233 | actual count | Actual data | Vice-President for Administration | [10.0000, 10.0000] | [4.0000, 4.0000] | [0.4000, 0.4000] |
| C234 | actual count per classroom | Actual data | Deans | [1.0000, 1.0000] | [0.4359, 0.5000] | [0.4359, 0.5000] |
| C235 | actual count per student | Actual data | Deans | [1.0000, 1.0000] | [1.0000, 1.0000] | [1.0000, 1.0000] |
| C24 | Measurement scale | Sampling plan | Stakeholder | Ideal value | Actual score | Normalized score |
| C2411 | actual count per laboratory | Actual data | Deans | [26.0000, 26.0000] | [0.0000, 0.0000] | [0.0000, 0.0000] |
| C2412 | actual count per laboratory | Actual data | Deans | [1.0000, 1.0000] | [0.0000, 0.0000] | [0.0000, 0.0000] |
| C2421 | actual count per laboratory | Actual data | Deans | [26.0000, 26.0000] | [0.0000, 0.0000] | [0.0000, 0.0000] |
| C2422 | actual count per laboratory | Actual data | Deans | [1.0000, 1.0000] | [0.0000, 0.0000] | [0.0000, 0.0000] |
| C2431 | actual count per laboratory | Actual data | Deans | [26.0000, 26.0000] | [0.0000, 0.0000] | [0.0000, 0.0000] |
| C2432 | actual count per laboratory | Actual data | Deans | [1.0000, 1.0000] | [0.0000, 0.0000] | [0.0000, 0.0000] |
| C25 | Measurement scale | Sampling plan | Stakeholder | Ideal value | Actual score | Normalized score |
| C251 | actual count | Actual data | Librarians | [645.5000, 645.5000] | [48.0000, 48.0000] | [0.0744, 0.0744] |
| C2521 | 0 = No, 1 = Yes | Actual data | Librarians | [1.0000, 1.0000] | [1.0000, 1.0000] | [1.0000, 1.0000] |
| C2522 | 0 = No, 1 = Yes | Actual data | Librarians | [1.0000, 1.0000] | [1.0000, 1.0000] | [1.0000, 1.0000] |
| C2523 | 0 = No, 1 = Yes | Actual data | Librarians | [1.0000, 1.0000] | [1.0000, 1.0000] | [1.0000, 1.0000] |
| C253 | actual count | Actual data | Librarians | [15.0000, 15.0000] | [1.0000, 1.0000] | [0.0667, 0.0667] |
| C254 | 0 = No, 1 = Yes | Actual data | Librarians | [1.0000, 1.0000] | [1.0000, 1.0000] | [1.0000, 1.0000] |
| C2551 | range of values within [0,10], where 0 represents an absence | Actual data | Librarians | [10.0000, 10.0000] | [6.0000, 6.0000] | [0.6000, 0.6000] |
| C2552 | range of values within [0,10], where 0 represents an absence | Actual data | Librarians | [10.0000, 10.0000] | [6.0000, 6.0000] | [0.6000, 0.6000] |
| C2553 | actual count | Actual data | Librarians | [96,825.0000, 96,825.0000] | [16,335.0000, 16,335.0000] | [0.1687, 0.1687] |
| C2554 | range of values within [0,10], where 0 represents an absence | Actual data | Librarians | [10.0000, 10.0000] | [7.0000, 7.0000] | [0.7000, 0.7000] |
| C2555 | Mbps | Actual data | IT manager | [25.0000, 50.0000] | [15.0000, 40.0000] | [0.3000, 1.6000] |
| C2556 | range of values within [0,10], where 0 represents an absence | Actual data | IT manager | [1.0000, 1.0000] | [1.0000, 1.0000] | [1.0000, 1.0000] |
| C256 | 0 = No, 1 = Yes | Actual data | IT manager | [1.0000, 1.0000] | [1.0000, 1.0000] | [1.0000, 1.0000] |
| C31 | Measurement scale | Sampling plan | Stakeholder | Ideal value | Actual score | Normalized score |
| C311 | Php per faculty member | Actual data | Accounting/Finance office | [70,000, 70,000] | 15,000, 20,000 | [0.2143, 0.2857] |
| C312 | Php per faculty member | Actual data | Accounting/Finance office | [30,000, 30,000] | 30,000, 30,000 | [1.0000, 1.0000] |
| C32 | Measurement scale | Sampling plan | Stakeholder | Ideal value | Actual score | Normalized score |
| C321 | Php per student | Actual data | Accounting/Finance office | [1549.19, 1549.19] | [464.7560, 464.7560] | [0.3000, 0.3000] |
| C322 | Php per student | Actual data | Accounting/Finance office | [774.59, 774.59] | [77.4593, 77.4593] | [0.1000, 0.1000] |
| C323 | Php per student | Actual data | Accounting/Finance office | [100.000, 100.000] | [0.0000, 0.0000] | [0.0000, 0.0000] |
| C33 | Measurement scale | Sampling plan | Stakeholder | Ideal value | Actual score | Normalized score |
| C331 | Php per student | Actual data | Accounting/Finance office | [500.000, 500.000] | [309.8373, 309.8373] | [0.6197, 0.6197] |
| C332 | Php per student | Actual data | Accounting/Finance office | [100.000, 100.000] | [77.4593, 77.4593] | [0.7746, 0.7746] |
| C333 | Php per student | Actual data | Accounting/Finance office | [250.000, 250.000] | [154.9187, 154.9187] | [0.6197, 0.6197] |
| C41 | Measurement scale | Sampling plan | Stakeholder | Ideal value | Actual score | Normalized score |
| C411 | no. of hours | Actual data | OJT coordinators | [1000, 1000] | 720, 1440 | [0.7200, 1.4400] |
| C412 | actual count | Actual data | Deans | [3.0000, 5.0000] | [1.3600, 2.2533] | [0.2720, 0.7511] |
| C413 | actual count | Actual data | OJT coordinators | [30.000, 100.000] | [21.5000, 62.5000] | [0.2150, 2.0833] |
| C414 | actual count | Actual data | Human resource office | [50.0000, 50.0000] | [40.0000, 50.0000] | [0.8000, 1.0000] |
| C415 | actual count | Actual data | Faculty | [60.0000, 60.0000] | [2.2133, 9.2967] | [0.0369, 0.1549] |
| C416 | actual count | Actual data | R&D office/research centers | [25.0000, 25.0000] | [0.5000, 1.5000] | [0.0200, 0.0600] |
| C417 | % | Actual data | OJT coordinators | [0.5000, 0.5000] | [0.5000, 0.5000] | [1.0000, 1.0000] |
| C418 | % | Actual data | Human resource office | [0.3000, 0.3000] | [0.8000, 0.8000] | [2.6667, 2.6667] |
| C419 | actual count | Actual data | R&D office | [5.0000, 5.0000] | [0.5000, 1.5000] | [0.1000, 0.3000] |
| C42 | Measurement scale | Sampling plan | Stakeholder | Ideal value | Actual score | Normalized score |
| C421 | 7-point Likert scale | Actual data | Deans | [7.0000, 7.0000] | [5.0400, 5.3600] | [0.7200, 0.7657] |
| C422 | 0 = No, 1 = Yes | Actual data | Deans | [1.0000, 1.0000] | [0.0640, 0.3760] | [0.0640, 0.3760] |
| C423 | 0 = No, 1 = Yes | Actual data | Internationalization office | [1.0000, 1.0000] | [1.0000, 1.0000] | [1.0000, 1.0000] |
| C424 | 0 = No, 1 = Yes | Actual data | Community extension office | [1.0000, 1.0000] | [1.0000, 1.0000] | [1.0000, 1.0000] |
| C425 | 7-point Likert scale | Actual data | SAO & OJT coordinators | [7.0000, 7.0000] | [5.2600, 6.0000] | [0.7514, 0.8571] |
| C426 | actual count | Actual data | Human resource office | [60.0000, 60.0000] | [30.0000, 30.0000] | [0.5000, 0.5000] |
| C51 | Measurement scale | Sampling plan | Stakeholder | Ideal value | Actual score | Normalized score |
| C511 | 7-point Likert scale | At least 60% of educational leaders | Educational leaders (e.g., Presidents, Vice-Presidents, Campus directors, Deans) | [7.0000, 7.0000] | [5.0000, 5.0000] | [0.7143, 0.7143] |
| C512 | 0 = No, 1 = Yes | Actual data | Vice-President for Academics | [1.0000, 1.0000] | [0.0000, 0.0000] | [0.0000, 0.0000] |
| C513 | actual count | Actual data | Secretary of the top management | [12.000, 20.000] | [4.0000, 4.0000] | [0.2000, 0.3333] |
| C514 | actual count | Actual data | Vice-President for Academics | [8.0000, 16.0000] | [2.0000, 2.0000] | [0.1250, 0.2500] |
| C52 | Measurement scale | Sampling plan | Stakeholder | Ideal value | Actual score | Normalized score |
| C521 | 0 = No, 1 = Yes | Actual data | Campus administrator | [1.0000, 1.0000] | [1.0000, 1.0000] | [1.0000, 1.0000] |
| C522 | percentage | Actual data | Campus administrator | [1.0000, 1.0000] | [0.0000, 0.0000] | [0.0000, 0.0000] |
| C53 | Measurement scale | Sampling plan | Stakeholder | Ideal value | Actual score | Normalized score |
| C531 | 7-point Likert scale | Actual data | Evaluator | [7.0000, 7.0000] | [4.8889, 5.7778] | [0.6984, 0.8254] |
| C532 | 0 = No, 1 = Yes | Actual data | Vice-President for Academics | [1.0000, 1.0000] | [1.0000, 1.0000] | [1.0000, 1.0000] |
| C533 | 0 = No, 1 = Yes | Actual data | Vice-President for Academics | [1.0000, 1.0000] | [1.0000, 1.0000] | [1.0000, 1.0000] |
| C61 | Measurement scale | Sampling plan | Stakeholder | Ideal value | Actual score | Normalized score |
| C611 | 7-point Likert scale | Actual data | Deans | [7.0000, 7.0000] | [4.7467, 5.6400] | [0.6781, 0.8057] |
| C612 | 0 = No, 1 = Yes | Actual data | Deans | [1.0000, 1.0000] | [0.6400, 0.9600] | [0.6400, 0.9600] |
| C613 | 0 = No, 1 = Yes | Actual data | Deans | [1.0000, 1.0000] | [0.1600, 0.6400] | [0.1600, 0.6400] |
| C614 | 7-point Likert scale | Actual data | Deans | [7.0000, 7.0000] | [3.6400, 3.9600] | [0.5200, 0.5657] |
| C615 | 7-point Likert scale | Actual data | Deans | [7.0000, 7.0000] | [3.6400, 3.9600] | [0.5200, 0.5657] |
| C616 | 7-point Likert scale | At least 100 students (randomly selected) | Students | [7.0000, 7.0000] | [3.6031, 5.2566] | [0.5147, 0.7509] |
| C62 | Measurement scale | Sampling plan | Stakeholder | Ideal value | Actual score | Normalized score |
| C621 | 0 = No, 1 = Yes | Actual data | Deans | [1.0000, 1.0000] | [1.0000, 1.0000] | [1.0000, 1.0000] |
| C622 | 0 = No, 1 = Yes | Actual data | Deans | [1.0000, 1.0000] | [0.1600, 0.6400] | [0.1600, 0.6400] |
| C623 | % | At least 100 students (randomly selected) | Students | [0.0000, 0.0000] | ||
| C624 | 0 = No, 1 = Yes | Actual data | Deans | [1.0000, 1.0000] | [1.0000, 1.0000] | [1.0000, 1.0000] |
| C625 | 0 = No, 1 = Yes | Actual data | Students | [1.0000, 1.0000] | [0.8051, 0.9894] | [0.8051, 0.9894] |
| C63 | Measurement scale | Sampling plan | Stakeholder | Ideal value | Actual score | Normalized score |
| C631 | 7-point Likert scale | Actual data | Deans | [7.0000, 7.0000] | [5.3600, 5.8400] | [0.7657, 0.8343] |
| C632 | 7-point Likert scale | Actual data | Deans | [7.0000, 7.0000] | [4.6500, 5.3800] | [0.6643, 0.7686] |
| C633 | 7-point Likert scale | Actual data | Deans | [7.0000, 7.0000] | [3.9200, 5.2533] | [0.5600, 0.7505] |
| C634 | 7-point Likert scale | At least 100 students (randomly selected) | Students | [7.0000, 7.0000] | [3.1612, 5.1524] | [0.4516, 0.7361] |
| C635 | 7-point Likert scale | At least 100 students (randomly selected) | Students | [7.0000, 7.0000] | [4.0401, 5.8469] | [0.5772, 0.8353] |
| C64 | Measurement scale | Sampling plan | Stakeholder | Ideal value | Actual score | Normalized score |
| C641 | 7-point Likert scale | At least 30% of the faculty members, randomly selected | Faculty | [7.0000, 7.0000] | [3.1119, 5.7462] | [0.4446, 0.8209] |
| C642 | 0 = No, 1 = Yes | Actual data | College deans | [1.0000, 1.0000] | [0.0000, 0.0000] | [0.0000, 0.0000] |
| C65 | Measurement scale | Sampling plan | Stakeholder | Ideal value | Actual score | Normalized score |
| C651 | 7-point Likert scale | At least 100 students (randomly selected) | Students | [7.0000, 7.0000] | [3.6364, 5.5601] | [0.5195, 0.7943] |
| C71 | Measurement scale | Sampling plan | Stakeholder | Ideal value | Actual score | Normalized score |
| C711 | no. of hours | At least 100 students (randomly selected) | Students | [3.0000, 5.0000] | [4.0633, 9.6543] | [0.3107, 1.2305] |
| C72 | Measurement scale | Sampling plan | Stakeholder | Ideal value | Actual score | Normalized score |
| C721 | no. of occurrence | At least 100 students (randomly selected) | Students | [0.0000, 0.0000] | [1.4437, 15.9766] | [0.0000, 0.0000] |
| C73 | Measurement scale | Sampling plan | Stakeholder | Ideal value | Actual score | Normalized score |
| C731 | 0 = No, 1 = Yes | At least 100 students (randomly selected) | Students | [0.0000, 0.0000] | [0.5574, 0.9613] | [0.0000, 0.0000] |
| C74 | Measurement scale | Sampling plan | Stakeholder | Ideal value | Actual score | Normalized score |
| C741 | 0 = No, 1 = Yes | At least 100 students (randomly selected) | Students | [0.0000, 0.0000] | [0.5574, 9.6543] | [0.0000, 0.0000] |
| C75 | Measurement scale | Sampling plan | Stakeholder | Ideal value | Actual score | Normalized score |
| C751 | no. of hours | At least 30% of the faculty members, randomly selected | Faculty | [3.0000, 3.0000] | [2.5680, 16.2045] | [0.1851, 1.1682] |
| C76 | Measurement scale | Sampling plan | Stakeholder | Ideal value | Actual score | Normalized score |
| C761 | % | At least 30% of the faculty members, randomly selected | Faculty | [0.6000, 0.6000] | [0.4770, 0.9218] | [0.7950, 1.5364] |
| C762 | 7-point Likert scale | At least 30% of the faculty members, randomly selected | Faculty | [7.0000, 7.0000] | [4.9295, 6.4249] | [0.7042, 0.9178] |
| C77 | Measurement scale | Sampling plan | Stakeholder | Ideal value | Actual score | Normalized score |
| C771 | 0 = No, 1 = Yes | Actual data | Campus administrator | [1.0000, 1.0000] | [0.0000, 0.0000] | [0.0000, 0.0000] |
| C772 | 7-point Likert scale | Actual data | Campus administrator | [7.000, 7.000] | [0.0000, 0.0000] | [0.0000, 0.0000] |
| C773 | kilogram | Actual data | Campus administrator | [30.000, 50.000] | [320.00, 350.00] | [0.0857, 0.1563] |
| C774 | kilogram | Actual data | Campus administrator | [250.000, 270.000] | [0.0000, 0.0000] | [0.0000, 0.0000] |
References
- Mo, J.; Beckett, R.C. Transdisciplinary system of systems development in the trend to X4.0. In Transdisciplinary Engineering for Complex Socio-Technical Systems–Real-life Applications; IOS Press: Amsterdam, The Netherlands, 2020; pp. 3–12. [Google Scholar]
- Miranda, J.; Navarrete, C.; Noguez, J.; Molina-Espinosa, J.M.; Ramírez-Montoya, M.S.; Navarro-Tuch, S.A.; Bustamante-Bello, M.-R.; Rosas-Fernández, J.-B.; Molina, A. The core components of education 4.0 in higher education: Three case studies in engineering education. Comput. Electr. Eng. 2021, 93, 107278. [Google Scholar] [CrossRef]
- Ramírez-Montoya, M.S.; Loaiza-Aguirre, M.I.; Zúñiga-Ojeda, A.; Portuguez-Castro, M. Characterization of the Teaching Profile within the Framework of Education 4.0. Future Internet 2021, 13, 91. [Google Scholar] [CrossRef]
- Gonzales, G.; Costan, F.; Suladay, D.; Gonzales, R.; Enriquez, L.; Costan, E.; Atibing, N.M.; Aro, J.L.; Evangelista, S.S.; Maturan, F.; et al. Fermatean fuzzy DEMATEL and MMDE algorithm for modelling the barriers of implementing education 4.0: Insights from the Philippines. Appl. Sci. 2022, 12, 689. [Google Scholar] [CrossRef]
- Gueye, M.L.; Exposito, E. University 4.0: The industry 4.0 paradigm applied to education. In Proceedings of the IX Congreso Nacional de Tecnologías en la Educación, Miami, FL, USA, 23–24 September 2022. [Google Scholar]
- Kunnari, I.; Jussila, J.; Le, H.A.; Nguyen, L.N.; Hoang, A.Q.; Le, M.H.; Ha, X.V.; Nguyen, H.T.; Ho, H.N.; Nguyen, T.T. Utilizing Design Factory Principles towards Education 4.0-Developing Innovation Spaces in Vietnam. J. Tech. Educ. Sci. 2022, 70A, 77–92. [Google Scholar] [CrossRef]
- Costan, E.; Gonzales, G.; Gonzales, R.; Enriquez, L.; Costan, F.; Suladay, D.; Atibing, N.M.; Aro, J.L.; Evangelista, S.S.; Maturan, F.; et al. Education 4.0 in developing economies: A systematic literature review of implementation barriers and future research agenda. Sustainability 2021, 13, 12763. [Google Scholar] [CrossRef]
- Seufert, C.; Oberdörfer, S.; Roth, A.; Grafe, S.; Lugrin, J.L.; Latoschik, M.E. Classroom management competency enhancement for student teachers using a fully immersive virtual classroom. Comput. Educ. 2022, 179, 104410. [Google Scholar] [CrossRef]
- González-Pérez, L.I.; Ramírez-Montoya, M.S. Components of Education 4.0 in 21st century skills frameworks: Systematic review. Sustainability 2022, 14, 1493. [Google Scholar] [CrossRef]
- Jamaludin, R.; McKAY, E.; Ledger, S. Are we ready for Education 4.0 within ASEAN higher education institutions? Thriving for knowledge, industry and humanity in a dynamic higher education ecosystem? J. Appl. Res. High. Educ. 2020, 12, 1161–1173. [Google Scholar] [CrossRef]
- Bongomin, O.; Gilibrays Ocen, G.; Oyondi Nganyi, E.; Musinguzi, A.; Omara, T. Exponential disruptive technologies and the required skills of industry 4.0. J. Eng. 2020, 2020, 4280156. [Google Scholar] [CrossRef] [Green Version]
- Srivani, V.; Hariharasudan, A.; Nawaz, N.; Ratajczak, S. Impact of education 4.0 among engineering students for learning English language. PLoS ONE 2022, 17, e0261717. [Google Scholar] [CrossRef]
- Tapsir, S.H.B.; Puteh, M. Framing Malaysian Higher Education 4.0: Future-Proof Talents; Ministry of Higher Education Malaysia: Putrajaya, Malaysia, 2018.
- Buasuwan, P. Rethinking Thai higher education for Thailand 4.0. Asian Educ. Dev. Stud. 2018, 7, 157–173. [Google Scholar] [CrossRef] [Green Version]
- Chang, F.; Das, D. Smart nation Singapore: Developing policies for a citizen-oriented smart city initiative. In Developing National Urban Policies: Ways forward to Green and Smart Cities; Springer: Singapore, 2020; pp. 425–440. [Google Scholar]
- Senyo, P.K.; Effah, J.; Osabutey, E.L. Digital platformisation as public sector transformation strategy: A case of Ghana’s paperless port. Technol. Forecast. Soc. Change 2021, 162, 120387. [Google Scholar] [CrossRef]
- Dzandza, P.E. Digitizing the intellectual output of Ghanaian universities. Collect. Curation 2020, 39, 69–75. [Google Scholar] [CrossRef]
- Eswaran, M.; Bahubalendruni, M.R. Challenges and opportunities on AR/VR technologies for manufacturing systems in the context of industry 4.0: A state of the art review. J. Manuf. Syst. 2022, 65, 260–278. [Google Scholar] [CrossRef]
- Ciolacu, M.I.; Binder, L.; Popp, H. Enabling IoT in Education 4.0 with biosensors from wearables and artificial intelligence. In Proceedings of the 2019 IEEE 25th International Symposium for Design and Technology in Electronic Packaging (SIITME), Cluj-Napoca, Romania, 23–26 October 2019; pp. 17–24. [Google Scholar]
- Butt, R.; Siddiqui, H.; Soomro, R.A.; Asad, M.M. Integration of Industrial Revolution 4.0 and IOTs in academia: A state-of-the-art review on the concept of Education 4.0 in Pakistan. Interact. Technol. Smart Educ. 2020, 17, 337–354. [Google Scholar] [CrossRef]
- Lieu Tran, T.B.; Törngren, M.; Nguyen, H.D.; Paulen, R.; Gleason, N.W.; Duong, T.H. Trends in preparing cyber-physical systems engineers. Cyber Phys. Syst. 2019, 5, 65–91. [Google Scholar] [CrossRef]
- Stachová, K.; Papula, J.; Stacho, Z.; Kohnová, L. External partnerships in employee education and development as the key to facing industry 4.0 challenges. Sustainability 2019, 11, 345. [Google Scholar] [CrossRef] [Green Version]
- Giesenbauer, B.; Müller-Christ, G. University 4.0: Promoting the transformation of higher education institutions toward sustainable development. Sustainability 2020, 12, 3371. [Google Scholar] [CrossRef] [Green Version]
- Mourtzis, D.; Angelopoulos, J.; Dimitrakopoulos, G. Design and development of a flexible manufacturing cell in the concept of learning factory paradigm for the education of generation 4.0 engineers. Procedia Manuf. 2020, 45, 361–366. [Google Scholar] [CrossRef]
- Ellahi, R.M.; Khan, M.U.A.; Shah, A. Redesigning Curriculum in line with Industry 4.0. Procedia Comput. Sci. 2019, 151, 699–708. [Google Scholar] [CrossRef]
- Findler, F.; Schönherr, N.; Lozano, R.; Reider, D.; Martinuzzi, A. The impacts of higher education institutions on sustainable development: A review and conceptualization. Int. J. Sustain. High. Educ. 2019, 20, 23–38. [Google Scholar] [CrossRef] [Green Version]
- Freidenfelds, D.; Kalnins, S.N.; Gusca, J. What does environmentally sustainable higher education institution mean? Energy Procedia 2018, 147, 42–47. [Google Scholar] [CrossRef]
- Manasia, L.; Ianos, M.G.; Chicioreanu, T.D. Pre-service teacher preparedness for fostering education for sustainable development: An empirical analysis of central dimensions of teaching readiness. Sustainability 2020, 12, 166. [Google Scholar] [CrossRef] [Green Version]
- Setiawan, T.H.; Salim, G.H.; Wimala, M.; Van Roy, A.F.; Adianto, Y.L.D. Development of knowledge and attitude measurement tools in disaster preparedness schools. Int. J. Disaster Manag. 2020, 3, 53–62. [Google Scholar] [CrossRef]
- Ramli, N.F.; Talib, O.; Hassan, S.A.; Manaf, U.K.A. Development and validation of an instrument to measure STEM teachers’ instructional preparedness. Asian J. Univ. Educ. 2020, 16, 193–206. [Google Scholar] [CrossRef]
- Coman, C.; Țîru, L.G.; Meseșan-Schmitz, L.; Stanciu, C.; Bularca, M.C. Online teaching and learning in higher education during the coronavirus pandemic: Students’ perspective. Sustainability 2020, 12, 10367. [Google Scholar] [CrossRef]
- Duncheon, J.C. Making sense of college readiness in a low-performing urban high school: Perspectives of high-achieving first generation youth. Urban Educ. 2021, 56, 1360–1387. [Google Scholar] [CrossRef]
- Ashaari, M.A.; Singh, K.S.D.; Abbasi, G.A.; Amran, A.; Liebana-Cabanillas, F.J. Big data analytics capability for improved performance of higher education institutions in the Era of IR 4.0: A multi-analytical SEM & ANN perspective. Technol. Forecast. Soc. Change 2021, 173, 121119. [Google Scholar]
- Mattah, P.A.D.; Kwarteng, A.J.; Mensah, J. Indicators of service quality and satisfaction among graduating students of a higher education institution (HEI) in Ghana. High. Educ. Eval. Dev. 2018, 12, 36–52. [Google Scholar] [CrossRef] [Green Version]
- Pamučar, D.; Stević, Ž.; Sremac, S. A new model for determining weight coefficients of criteria in MCDM models: Full consistency method (FUCOM). Symmetry 2018, 10, 393. [Google Scholar] [CrossRef] [Green Version]
- Ocampo, L. Full consistency method (FUCOM) and weighted sum under fuzzy information for evaluating the sustainability of farm tourism sites. Soft Comput. 2022, 26, 12481–12508. [Google Scholar] [CrossRef]
- Pawlak, Z. Rough sets. Int. J. Comput. Inf. Sci. 1982, 11, 341–356. [Google Scholar] [CrossRef]
- Pawlak, Z. Rough set theory and its applications to data analysis. Cybern. Syst. 1998, 29, 661–688. [Google Scholar] [CrossRef]
- Pathan, M.S.; Jianbiao, Z.; John, D.; Nag, A.; Dev, S. Identifying stroke indicators using rough sets. IEEE Access 2020, 8, 210318–210327. [Google Scholar] [CrossRef]
- Rajesh, R. Sustainability performance predictions in supply chains: Grey and rough set theoretical approaches. Ann. Oper. Res. 2022, 310, 171–200. [Google Scholar] [CrossRef]
- Gao, S.; Sun, H.; Zhao, L.; Wang, R.; Xu, M.; Cao, G. Dynamic assessment of island ecological environment sustainability under urbanization based on rough set, synthetic index and catastrophe progression analysis theories. Ocean Coast. Manag. 2019, 178, 104790. [Google Scholar] [CrossRef]
- Wang, J.J.; Cao, X.D. System analysis of potential accidents on mountain road based on rough set and quantitative theory. KSCE J. Civ. Eng. 2021, 25, 1031–1042. [Google Scholar] [CrossRef]
- Zhang, Q.; Xie, Q.; Wang, G. A survey on rough set theory and its applications. CAAI Trans. Intell. Technol. 2016, 1, 323–333. [Google Scholar] [CrossRef]
- Cao, J.; Zhang, X.; Zhang, C.; Feng, J. Improved convolutional neural network combined with rough set theory for data aggregation algorithm. J. Ambient Intell. Humaniz. Comput. 2020, 11, 647–654. [Google Scholar] [CrossRef]
- Hossain, T.M.; Watada, J.; Aziz, I.A.; Hermana, M. Machine learning in electrofacies classification and subsurface lithology interpretation: A rough set theory approach. Appl. Sci. 2020, 10, 5940. [Google Scholar] [CrossRef]
- Peng, X.; Wen, J.; Li, Z.; Yang, G.; Zhou, C.; Reid, A.; Hepburn, D.M.; Judd, M.D.; Siew, W.H. Rough set theory applied to pattern recognition of Partial Discharge in noise affected cable data. IEEE Trans. Dielectr. Electr. Insul. 2017, 24, 147–156. [Google Scholar] [CrossRef] [Green Version]
- Zhao, J.; Liang, J.M.; Dong, Z.N.; Tang, D.Y.; Liu, Z. Accelerating information entropy-based feature selection using rough set theory with classified nested equivalence classes. Pattern Recognit. 2020, 107, 107517. [Google Scholar] [CrossRef]
- Zhang, X.; Li, J.; Li, W. A new mechanism of rule acquisition based on covering rough sets. Appl. Intell. 2022, 52, 12369–12381. [Google Scholar] [CrossRef] [PubMed]
- Antosz, K.; Jasiulewicz-Kaczmarek, M.; Paśko, Ł.; Zhang, C.; Wang, S. Application of machine learning and rough set theory in lean maintenance decision support system development. Eksploat. I Niezawodn. 2021, 23, 695–708. [Google Scholar] [CrossRef]
- Stević, Ž.; Pamučar, D.; Subotić, M.; Antuchevičiene, J.; Zavadskas, E.K. The location selection for roundabout construction using Rough BWM-Rough WASPAS approach based on a new Rough Hamy aggregator. Sustainability 2018, 10, 2817. [Google Scholar] [CrossRef] [Green Version]
- Pamučar, D.; Macura, D.; Tavana, M.; Božanić, D.; Knežević, N. An integrated rough group multicriteria decision-making model for the ex-ante prioritization of infrastructure projects: The Serbian railways case. Socio Econ. Plan. Sci. 2022, 79, 101098. [Google Scholar] [CrossRef]
- Pamučar, D.; Deveci, M.; Canıtez, F.; Bozanic, D. A fuzzy Full Consistency Method-Dombi-Bonferroni model for prioritizing transportation demand management measures. Appl. Soft Comput. 2020, 87, 105952. [Google Scholar] [CrossRef]
- Ocampo, L.; Aro, J.L.; Evangelista, S.S.; Maturan, F.; Atibing, N.M.; Yamagishi, K.; Selerio, E., Jr. Synthesis of strategies in post-COVID-19 public sector supply chains under an intuitionistic fuzzy environment. Socio-Econ. Plan. Sci. 2023, 85, 101340. [Google Scholar] [CrossRef]
- Böyükaslan, A.; Ecer, F. Determination of drivers for investing in cryptocurrencies through a fuzzy full consistency method-Bonferroni (FUCOM-F’B) framework. Technol. Soc. 2021, 67, 101745. [Google Scholar] [CrossRef]
- Badi, I.; Kridish, M. Landfill site selection using a novel FUCOM-CODAS model: A case study in Libya. Sci. Afr. 2020, 9, e00537. [Google Scholar] [CrossRef]
- Bonfield, C.A.; Salter, M.; Longmuir, A.; Benson, M.; Adachi, C. Transformation or evolution?: Education 4.0, teaching and learning in the digital age. High. Educ. Pedagog. 2020, 5, 223–246. [Google Scholar] [CrossRef]
- Chituc, C.M. A Framework for Education 4.0 in Digital Education Ecosystems. In Proceedings of the Smart and Sustainable Collaborative Networks 4.0: 22nd IFIP WG 5.5 Working Conference on Virtual Enterprises, PRO-VE 2021, Saint-Étienne, France, 22–24 November 2021; Volume 22, pp. 702–709. [Google Scholar]
- Venkatesh, V.; Thong, J.Y.; Xu, X. Consumer acceptance and use of information technology: Extending the unified theory of acceptance and use of technology. MIS Q. 2012, 36, 157–178. [Google Scholar] [CrossRef] [Green Version]
- Lawrence, J.E.; Tar, U.A. Factors that influence teachers’ adoption and integration of ICT in teaching/learning process. Educ. Media Int. 2018, 55, 79–105. [Google Scholar] [CrossRef]
- Gonzales, R.; Almacen, R.M.; Gonzales, G.; Costan, F.; Suladay, D.; Enriquez, L.; Costan, E.; Atibing, N.M.; Aro, J.L.; Evangelista, S.S.; et al. Priority Roles of Stakeholders for Overcoming the Barriers to Implementing Education 4.0: An Integrated Fermatean Fuzzy Entropy-Based CRITIC-CODAS-SORT Approach. Complexity 2022, 2022, 7436256. [Google Scholar] [CrossRef]


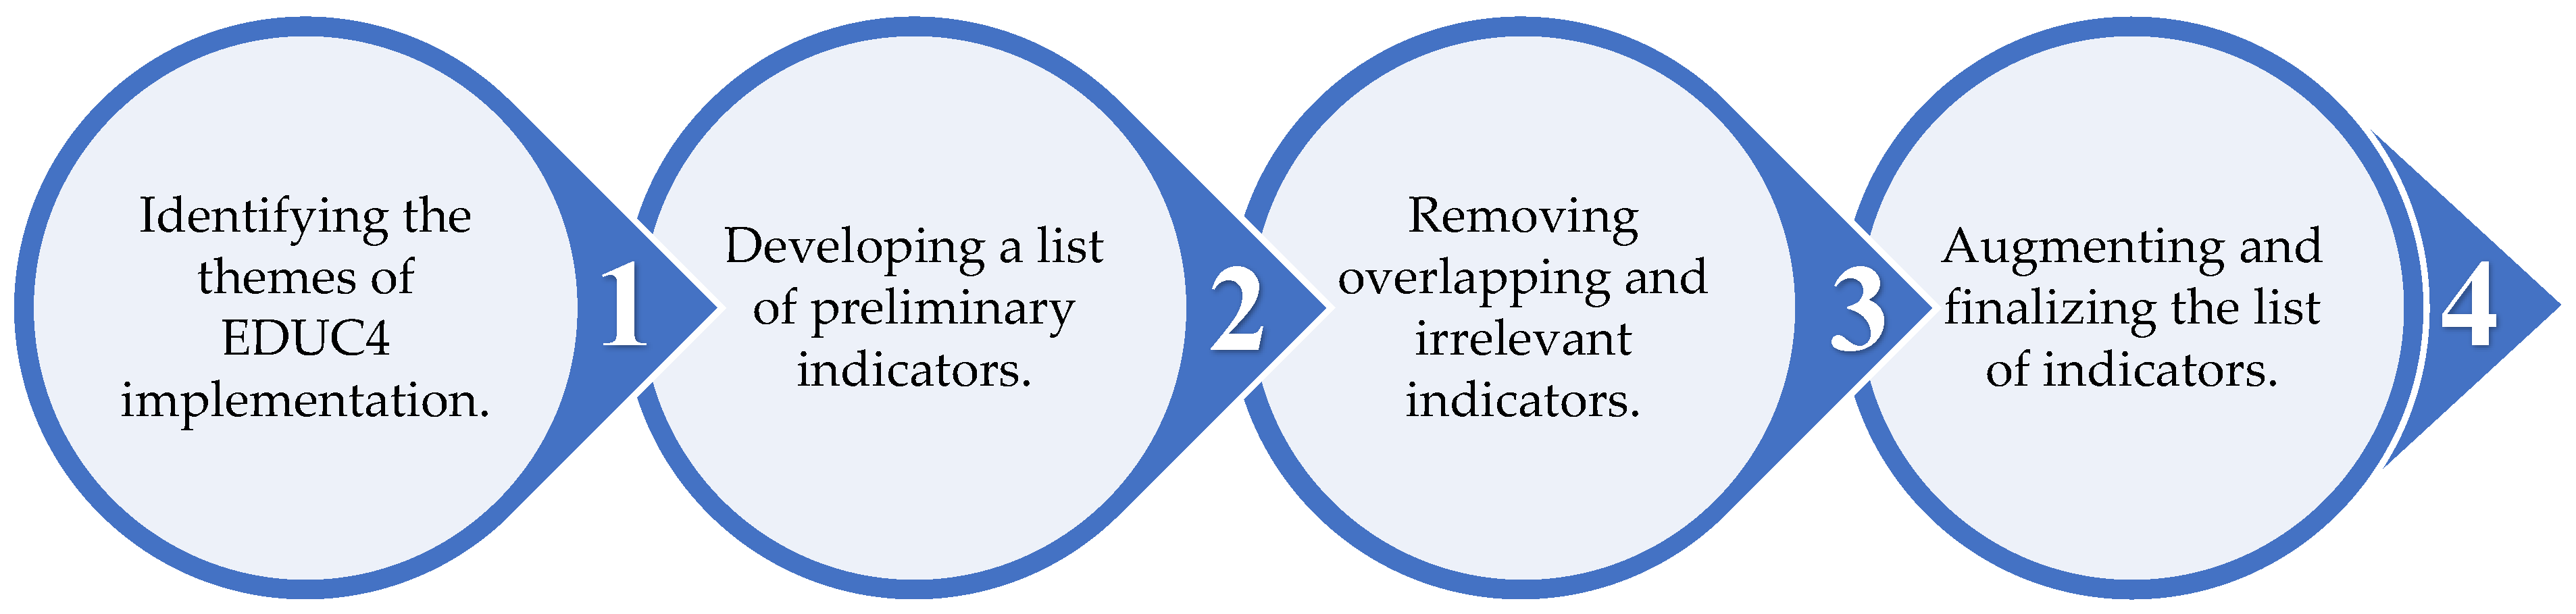
| Code | Criterion Description | No. of Indicators after Step 2 (A) | No. of Indicators after Step 3 (B) | No. of Indicators after Step 4 (C) | Final Indicators (A) − (B) + (C) | ||
|---|---|---|---|---|---|---|---|
| C1 | Human resources | 22 | 16 | 0 | 6 | ||
| C2 | Infrastructure | ||||||
| C21 | ICT infrastructure | 6 | 0 | 0 | 6 | ||
| C22 | Infrastructure for online learning | 7 | 0 | 0 | 7 | ||
| C23 | Other infrastructure relevant to EDUC4 implementation | 5 | 0 | 0 | 5 | ||
| C24 | Science laboratories | 6 | 0 | 0 | 6 | ||
| C25 | Library 4.0 | 13 | 0 | 0 | 13 | ||
| C3 | Financial | ||||||
| C31 | Faculty capability enhancement | 2 | 0 | 0 | 2 | ||
| C32 | Technology and infrastructure alignment | 3 | 0 | 0 | 3 | ||
| C33 | Physical facilities and supplies | 2 | 0 | 1 | 3 | ||
| C4 | Linkages | ||||||
| C41 | Education and training | 8 | 0 | 1 | 9 | ||
| C42 | Collaboration | 7 | 1 | 0 | 6 | ||
| C5 | Educational management | ||||||
| C51 | Educational leaders’ commitment | 6 | 2 | 0 | 4 | ||
| C52 | Relationship with stakeholders | 5 | 3 | 0 | 2 | ||
| C53 | Management support toward EDUC4 implementation | 7 | 4 | 0 | 3 | ||
| C6 | Learners | ||||||
| C61 | Learners’ experience | 6 | 0 | 0 | 6 | ||
| C62 | Teaching and learning experience | 5 | 0 | 0 | 5 | ||
| C63 | Students and curriculum design | 4 | 0 | 1 | 5 | ||
| C64 | Technology-based monitoring of the system of student performance | 3 | 1 | 0 | 2 | ||
| C65 | Student service | 1 | 0 | 0 | 1 | ||
| C7 | Health and Environment | ||||||
| C71 | Screen viewing | 1 | 0 | 0 | 1 | ||
| C72 | Physical risk | 1 | 0 | 0 | 1 | ||
| C73 | Emotional risk | 1 | 0 | 0 | 1 | ||
| C74 | Cognitive risk | 1 | 0 | 0 | 1 | ||
| C75 | Time constraints for material preparation | 1 | 0 | 0 | 1 | ||
| C76 | Classroom layout | 6 | 4 | 0 | 2 | ||
| C77 | E-waste management | 0 | 0 | 4 | 4 | ||
| TOTAL | 129 | 31 | 7 | 105 | |||
| Criteria | Rough Weights |
|---|---|
| Human resources | [0.1167, 0.1545] |
| Infrastructure | [0.1545, 0.1684] |
| Financial | [0.1409, 0.1680] |
| Linkages | [0.1106, 0.1680] |
| Educational management | [0.1091, 0.1466] |
| Learners | [0.1191, 0.1540] |
| Health and environment | [0.1063, 0.1568] |
| Criteria | Rough Preparedness Index | Normalized Crisp Preparedness Index |
|---|---|---|
| Human resource | [0.6991, 0.8589] | 0.2500 |
| Infrastructure | [0.2654, 0.2667] | 0.1169 |
| Financial | [0.3434, 0.3545] | 0.1393 |
| Linkages | [0.4968, 0.7411] | 0.1790 |
| Educational management | [0.3515, 0.4011] | 0.1122 |
| Learners | [0.4976, 0.6891] | 0.1817 |
| Health and Environment | [0.0635, 0.1624] | 0.0205 |
| Scenario 1 | Scenario 2 | Scenario 3 | Scenario 4 | Scenario 5 | Scenario 6 | Scenario 7 | |
|---|---|---|---|---|---|---|---|
| C1 | [0.7000, 0.7000] | [0.0500, 0.0500] | [0.0500, 0.0500] | [0.0500, 0.0500] | [0.0500, 0.0500] | [0.0500, 0.0500] | [0.0500, 0.0500] |
| C2 | [0.0500, 0.0500] | [0.7000, 0.7000] | [0.0500, 0.0500] | [0.0500, 0.0500] | [0.0500, 0.0500] | [0.0500, 0.0500] | [0.0500, 0.0500] |
| C3 | [0.0500, 0.0500] | [0.0500, 0.0500] | [0.7000, 0.7000] | [0.0500, 0.0500] | [0.0500, 0.0500] | [0.0500, 0.0500] | [0.0500, 0.0500] |
| C4 | [0.0500, 0.0500] | [0.0500, 0.0500] | [0.0500, 0.0500] | [0.7000, 0.7000] | [0.0500, 0.0500] | [0.0500, 0.0500] | [0.0500, 0.0500] |
| C5 | [0.0500, 0.0500] | [0.0500, 0.0500] | [0.0500, 0.0500] | [0.0500, 0.0500] | [0.7000, 0.7000] | [0.0500, 0.0500] | [0.0500, 0.0500] |
| C6 | [0.0500, 0.0500] | [0.0500, 0.0500] | [0.0500, 0.0500] | [0.0500, 0.0500] | [0.0500, 0.0500] | [0.7000, 0.7000] | [0.0500, 0.0500] |
| C7 | [0.0500, 0.0500] | [0.0500, 0.0500] | [0.0500, 0.0500] | [0.0500, 0.0500] | [0.0500, 0.0500] | [0.0500, 0.0500] | [0.7000, 0.7000] |
Disclaimer/Publisher’s Note: The statements, opinions and data contained in all publications are solely those of the individual author(s) and contributor(s) and not of MDPI and/or the editor(s). MDPI and/or the editor(s) disclaim responsibility for any injury to people or property resulting from any ideas, methods, instructions or products referred to in the content. |
© 2023 by the authors. Licensee MDPI, Basel, Switzerland. This article is an open access article distributed under the terms and conditions of the Creative Commons Attribution (CC BY) license (https://creativecommons.org/licenses/by/4.0/).
Share and Cite
Almacen, R.M.; Castilla, D.; Gonzales, G.; Gonzales, R.; Costan, F.; Costan, E.; Enriquez, L.; Batoon, J.; Villarosa, R.; Aro, J.L.; et al. Preparedness Indicator System for Education 4.0 with FUCOM and Rough Sets. Systems 2023, 11, 288. https://doi.org/10.3390/systems11060288
Almacen RM, Castilla D, Gonzales G, Gonzales R, Costan F, Costan E, Enriquez L, Batoon J, Villarosa R, Aro JL, et al. Preparedness Indicator System for Education 4.0 with FUCOM and Rough Sets. Systems. 2023; 11(6):288. https://doi.org/10.3390/systems11060288
Chicago/Turabian StyleAlmacen, Rose Mary, Delfa Castilla, Gamaliel Gonzales, Roselyn Gonzales, Felix Costan, Emily Costan, Lynne Enriquez, Jannen Batoon, Rica Villarosa, Joerabell Lourdes Aro, and et al. 2023. "Preparedness Indicator System for Education 4.0 with FUCOM and Rough Sets" Systems 11, no. 6: 288. https://doi.org/10.3390/systems11060288