Article

An Assessment of the Effects of Food Districts on Sustainable Management of Land: The Case of Lombardia, Italy

CREA—Council for Agricultural Research and Economics—Research Centre for Policies and Bioeconomy, 00198 Rome, Italy
*
Authors to whom correspondence should be addressed.
Systems 2023, 11(6), 283; https://doi.org/10.3390/systems11060283
Submission received: 2 May 2023 / Revised: 26 May 2023 / Accepted: 29 May 2023 / Published: 1 June 2023

Abstract

:
The article aims to analyze whether a larger diffusion of institutional–private co-operation in farming systems, such as Italian food districts (FDs), is helpful in pursuing goals of sustainable land use in agriculture. The paper focuses on the case of Lombardia in Italy, a region where this form of public–private partnership is widespread throughout the regional territory. Combining differences-in-differences (DiD) and propensity score matching (PSM) methods to reduce the estimation bias, we assessed and quantified a “district effect” on the sustainable management of lands. Specifically, using several land-use and land-use change proxies as outcome measures, we verified whether there are significant differences in such outcomes between two different groups of municipalities: those involved in FDs and those not. Our analysis shows that there is an “FD effect” on the persistence of agricultural activity and, although this does not necessarily translate into more landscape diversity, it can at least counteract detrimental tendencies such as the loss of natural elements, the loss of landscape diversity due to intensive farming, and land abandonment.

1. Introduction

Over the last decades, both the common agricultural policy (CAP) and national policies have progressively moved towards supporting governance instruments for local food systems, aiming to encourage co-operation among economic operators and other public and private stakeholders, such as in the case of the leader approach [1]. This shift primary objective is to help individual firms to achieve common systemic goals at the territorial level, since the scale, scope, and complexity of the economic and social transformation necessary to reach higher sustainability levels of productive systems requires strict co-ordination between economic and institutional operators.
In this paper, we empirically investigate to what extent the Italian food districts 1 (FDs), as a contractual form of aggregation at the local level, are able to trigger effective change in the agrifood system by encouraging changes in land uses and, more in general, a switch to sustainable production models. Although FDs have a clear legal connotation in Italy, in this paper, we used the term more generally, indicating different types of agricultural organized and normative systems. Indeed, all these systems share the objectives of enhancement of local agriculture, increasing territorial development, and increasing the role of food in the local economy.
The literature exploring land use and its changes at the FD level is relatively scarce, especially in Europe. Understanding development patterns and drivers of changes is relevant to avoiding land overexploitation and preserving food security. This literature focuses on determinants of land-cover changes, mainly to understand the causes of detrimental patterns and to provide advice for addressing them [2,3,4,5]. In the Global North, the territorial dimension enters the scientific debate prominently in the context of rural development and the urban–rural relationships, and focuses on the loss of ecosystem services and supply chain disruptions [6,7].
This paper aims to check whether contractual forms of institutional–private co-operation, such as FDs, can improve the diversity of land use in territories, as it is directly related to the sustainability of agricultural systems all over its three dimensions: economic, social, and environmental [8]. The paper focuses on the case study of Lombardia, a region in the north of Italy where agriculture is highly integrated into the agri-food value chain but where there are also rural territories where agriculture struggles to survive. These two faces of the local agri-food system have made FDs widespread all over the regional territory, from the Po valley to the mountains nearby the national borders, as they enhance efficiency in co-ordinating the supply chain actors involved in local (and national) development, and, at the same time, they provide an institutional framework within which farmers can organize their activities and market relationships. FDs can be considered as flexible tools to allow adaptations according to the local specificities and needs of the territorial actors.
The study estimates a “district effect” on the sustainability of land use in the investigated area. Land-use diversification can be seen as a proxy of sustainable farm activity as it improves biodiversity, but also make farms’ income more stable and less dependent on market fluctuations, at both the area and the individual farm levels. The assessment was carried out by using quasi-experimental methods based on counterfactual modelling. The “district effect” was calculated as differences regarding several indicators of sustainable use of land between the group of municipalities which are included in FDs (namely, the treated group) and municipalities not included in FDs (the untreated group). To our knowledge, this is an innovative approach for at least three reasons: (1) we work at the municipality level, which is quite relevant to catch a “district effect” since it is municipalities that are aggregated into FDs; (2) we used all the land-use indicators available at this level of analysis units; and (3) as a result of data availability, we could compare the performances of the area covered by FD before and after their legal settlement. The combination of these three aspects makes our results solid and convincing in isolating a “district effect” as a sort of catalyst in enhancing sustainable development in the area studied.
The rest of the paper is organized as follows: Section 2 is devoted to the background analysis of the role of districts, and FDs in particular, in economic, social, and environmental sustainability. Section 3 introduces the methodology and the data set presenting the variables used in the model which is based on a combination of the propensity score matching (PSM) model and a differences-in-differences (DiD) method to estimate the average effect on the treated group (ATT). We used this mixed methodology t to solve the sample selection bias, considering both observable and unobservable variables, and to assess the causal impact of FDs as an organized form of local production and supply. The main results are presented and discussed in Section 4, while Section 5 concludes, also highlighting some policy implications of the relevance of the FD organization at the local and regional level.

2. Background

2.1. Why Food Districts?

The growing interest in the integrated planning of food production by central and local institutions comes from the recognition that co-operation arrangements can offer relevant opportunities to overcome the limits of the pulverization of agricultural productions and facilitate endogenous innovation processes in a territory [9,10]. Territorial governance is generally seen as a critical factor in achieving adequate levels of sustainability, allowing for the co-ordination of social learning with external actors, public authorities, or other sectors within and outside territories [11]. More in general, the multi-level governance involving local institutions, socio-economic actors, and local productive systems is considered a crucial aspect in reaching a higher rate of efficiency in the protection of territories, rural development, and sustainability, pursuing both a long-term approach and agricultural multifunctionality [12,13,14,15].
Therefore, in order to foster the adoption of production models that can increase the achievement of sustainability goals through local productive activities, policies have encouraged specific typologies of networks that are based on partnerships among public, private, and the so-called third sector (e.g., bringing together economic operators with local administrations, research institutions, non-profit organizations, natural reserves and natural parks, territorial management organizations, etc.), to better address the more general interests and promote investments consistently with the overall management of the territory in which they operate [16,17].
The organization of the agri-food sector has been dominated by a wide range of hybrid forms of interaction among independent firms, and many network contracts and arrangements are used to recompose in a single process some or all the single phases in which firms are specialized. In such a framework, FDs can be seen as a recent co-operation instrument that can bring benefits to adopting sustainable territorial strategies.
FDs can be defined as the legal recognition of an agglomeration of firms, which are generally small and medium in size, located in a limited and historically determined territory. Over the years, there have been several regulatory sources and public incentives to push the creation of FDs.
Literature on FDs and similar institutions operating in the agri-food sector and rural areas 2 is extensive. It originated and developed in France and, subsequently, from the 1970s on, extended to many other European countries, especially Italy, where social and economic—and later, environmental—conditions were particularly favorable. Since then, the interest in districts has grown, considering the district model in opposition to the vertical integration of the Fordist model, prevalent hitherto, that has been showing cracks in turnovers, organizational capacities, and overall efficiency [18,19]. It is interesting to note that the theoretical and analytical construction and discourse on the district model, since its beginning, has been based on their capacity to keep together an economic, social, and environmental dimension of development, even before the multidimensionality of sustainable development was recognized. Another relevant consideration that has always accompanied the analysis of districts is that their multidimensional features are adaptable to both traditional and more conservative districts and to innovative high-tech ones, both big and small in size, to different categories of specialization, such as food, social, touristic, deep rural, and peri-urban, ultimately showing an excellent ductility and versatility [19].
The decline of the productivism paradigm in agriculture and the rising of the multifunctional approach to the primary activity and farm organization, generously supported by the new European Union (EU) common policies, has re-launched the so-called European model of agriculture based on the small-size family farm, often part-time and producing a differentiated outcome. Such a model has improved the economic, social, and environmental role of farms within the territory, supported by a network of external economies, by the common sharing of knowledge and experiences, long-lasting personal connections, as well as working (sometimes informal) connections, all having effects on the transaction costs [20,21].
FDs arise from a direct agreement between the Ministry of Agriculture and district partnership (often in the form of a consortium company), representing the precondition to access public support, which can be received following a collective request by the members of the FDs. The goal is to use this financial support for investments and innovations, ensuring sustainable growth for the applicants and the community.

2.2. Districts and Sustainability

The territorial nature of organizational forms such as FDs enhances the pursuit of sustainable goals through the support of the economic, social, and environmental actors at the local level, who are also the primary beneficiaries of the effects of the collective action on sustainability [22]. Through a decentralized decision process, the territorial dimension represents one of the main qualifying elements of FDs. Participation and collective consultation among institutional and local actors are essential for adjusting the use of financial resources according to local diversity [23]. Given that it is an integrated strategy, local public institutions, together with the local economic and social actors, are called for interventions able to respond effectively to specific issues, including those regarding sustainable development [24].
From the analysis of the links between sustainability and districts, it seems there are several win–win relationships, especially when considering them compared to the well-studied links between agriculture activity and sustainability, based mostly on trade-offs [25]. This is partly due to the nature of the districts, representing a place for institutional relationships and empowerment, but also for more informal interactions between stakeholders and all the territorial actors [26]. Such a “fertile ground” helps to overcome the traditional trade-offs and create and enhance connections between sustainability goals and district strategies. Potentially, this is also favored by a context open to technological and social innovation, improving evolutionary processes, and strengthening relationships among the different actors [10].
The literature review shows that FDs bring with them a certain level of sensitiveness to the issue of sustainability [26,27,28], partly because of their nature and organization, given the common background they share with the long-studied industrial districts, as institutions where communities are directly involved in the local development process [18]. Another specific issue of districts is their intermediate institutional level between micro and macro, which sets them halfway between the single economic operator and the institution ruling the sectorial and territorial policies. Such a specific dimension allows districts to have a key role in local and national governance interactions. In the case of FDs, they have a higher dependency on public support than industrial districts, not only for the economic but also for the social and environmental dimensions. This makes FDs as vulnerable as many other segments of the agri-food system. One element favoring the generally positive relationship between districts and sustainable goals is the high and continuous level of innovation and training. This connection makes districts more open to win–win strategies and makes linkages between goals and the three sustainability dimensions more effective.
FDs fall within the range of territorially embedded agri-food systems, which are based upon the distinctive features of the territory and integrated with other activities such as nature and landscape conservation, tourism, care, and education [23], from which they stand out for being based on public–private governance as a basis for community involvement. Table 1 shows, at a glance, the peculiarities of the district paradigm in relation to other territorial integrated approaches. Being institutional subjects, FDs feature more structured interactions between actors inside and outside the agri-food sector. Such an institutional nature based on a multi-actor approach makes them somehow able to encompass all the other approaches.

3. Materials and Methods

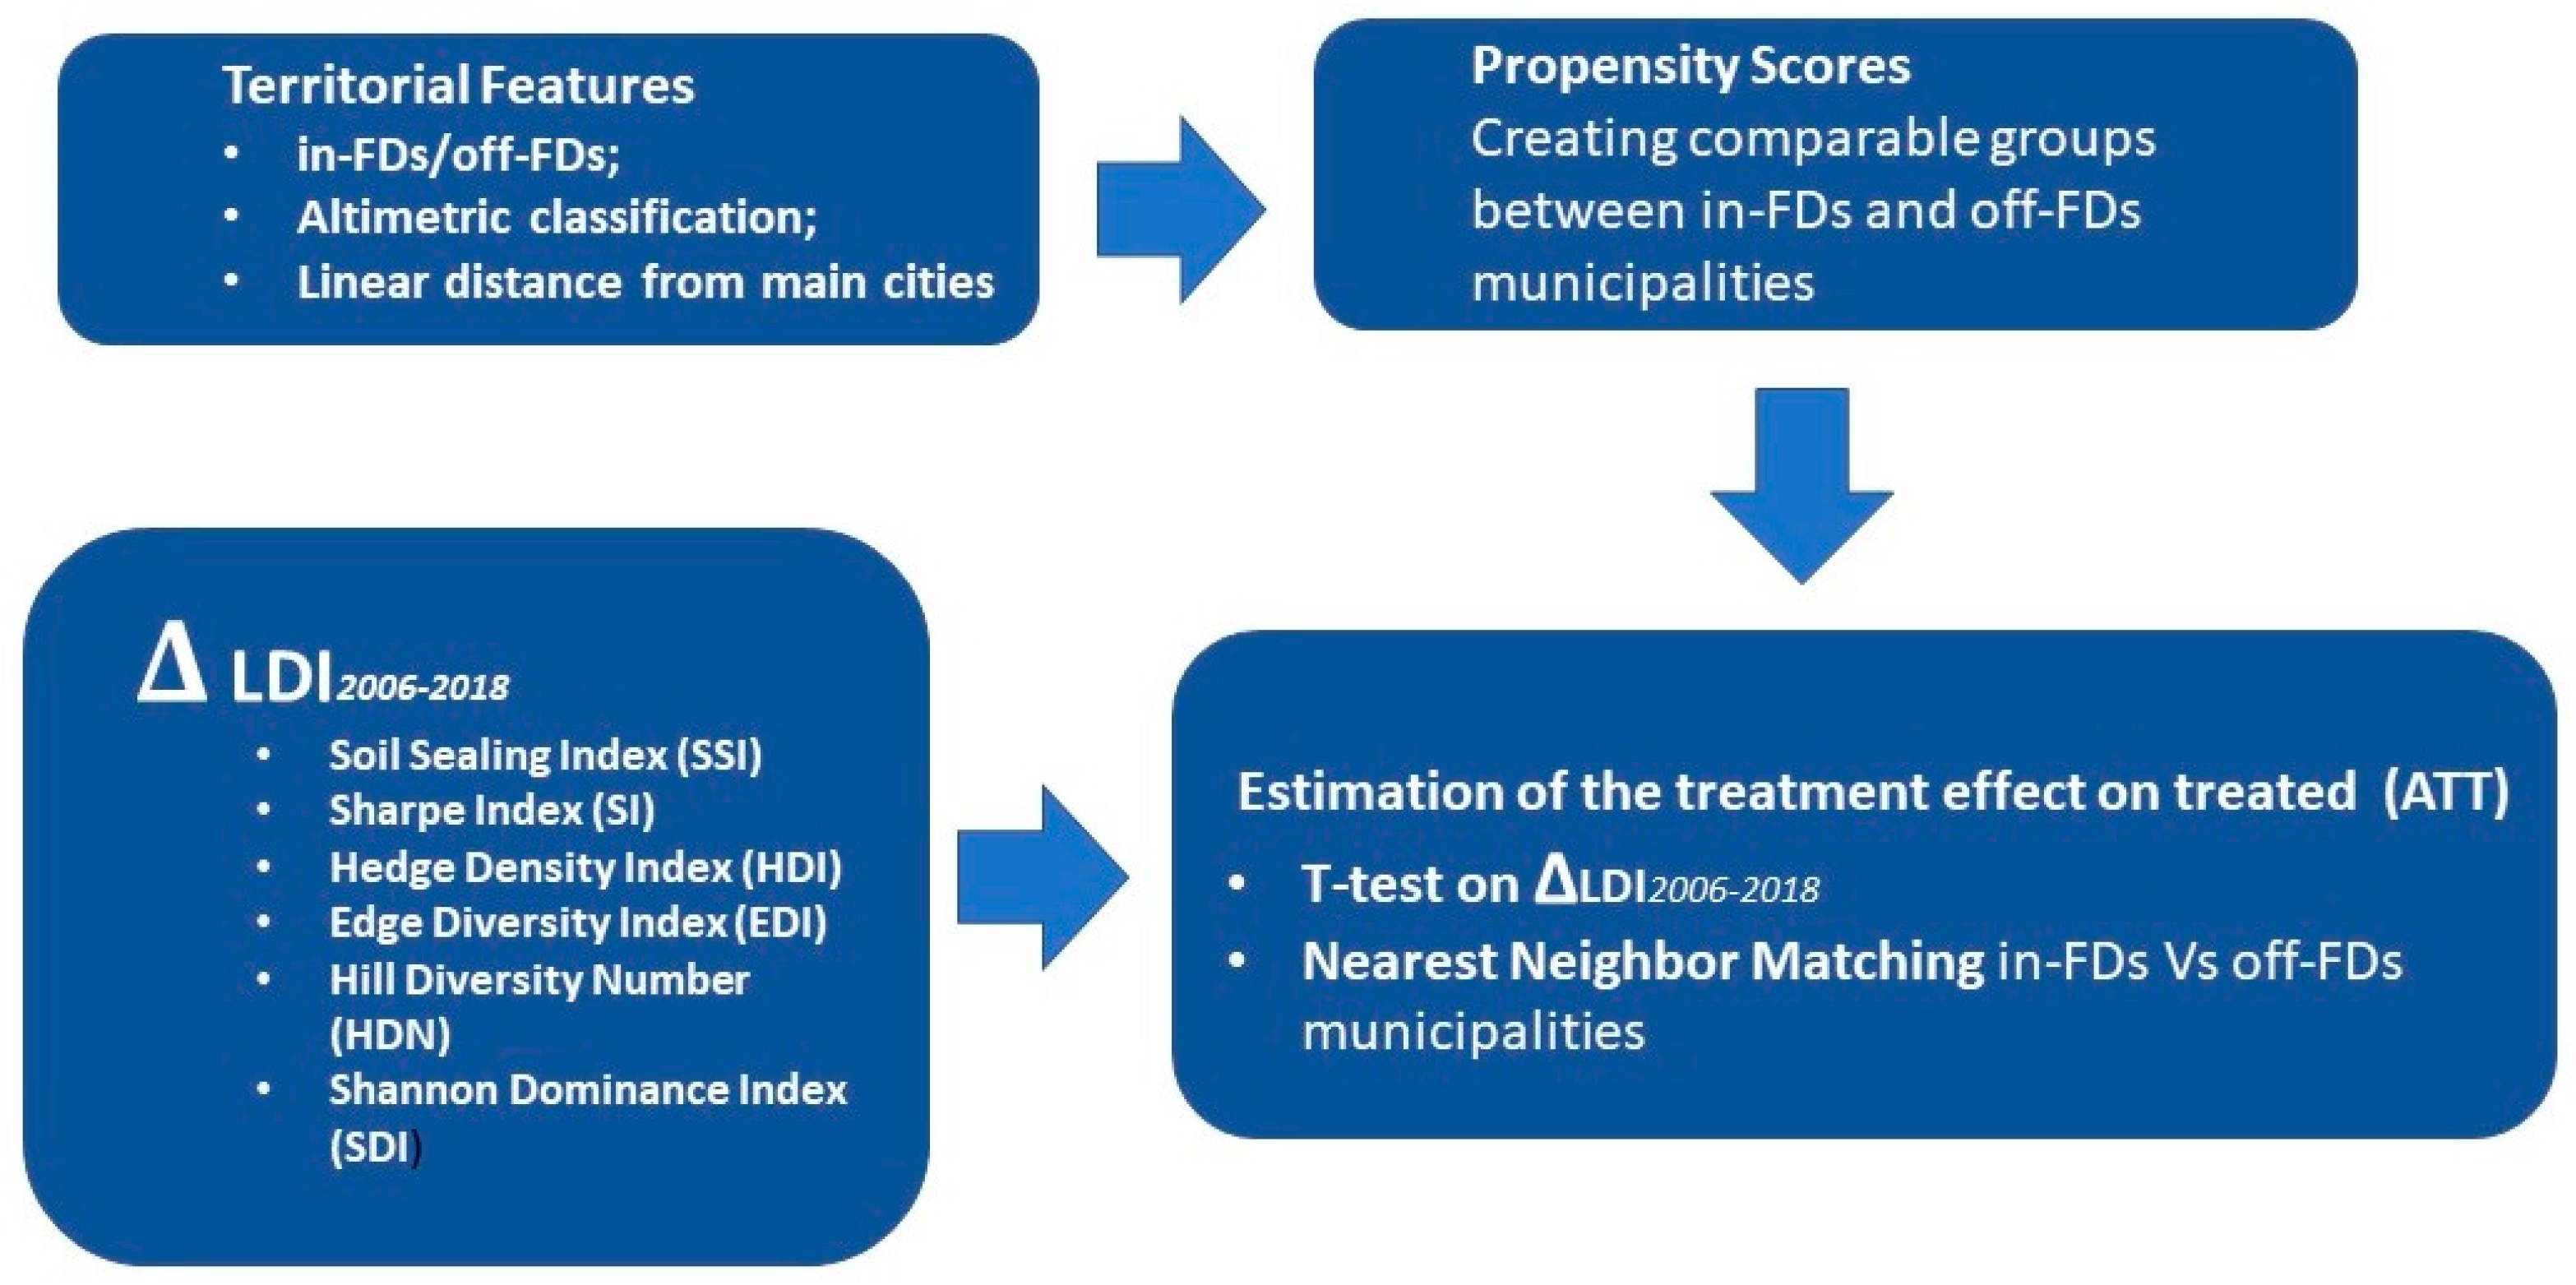
3.1. Research Design

This study aims to investigate whether being in an FD positively affects sustainable land management at the municipal level. Using data on land use, we have calculated several sustainability indices to estimate the impact of being part of an FD, comparing the municipalities involved in FDs (in-FD) with those not (off-FD), using a quasi-experimental approach 3. Under certain assumptions, therefore, land use at the municipal level has been estimated by assuming being part of an FD as an ATT.
In general, matching procedures identify a valid comparison group, for which it can be assumed that there are no systematic differences between comparison units in terms of observed and unobserved characteristics which could also influence the outcomes. Specifically, assessing the causal impact of being in an FD on land use could be flawed by the endogeneity bias resulting from municipalities’ self-selection into FDs [31,32,33]. Indeed, by selecting individuals, groups, or data for analysis without a proper randomization procedure, we cannot ensure that the sample obtained is representative of the population in some characteristics influencing the result measure. Hence, if we do not consider such differences, we might mistakenly associate the estimated differences in the outcome caused by these characteristics as treatment effect (in our case, being on-FD).
To overcome such an issue, we relied on a procedure that combines a PSM model with a DiD method. This methodological choice was based on the consideration that, if selection into treatment can be fully captured by observables, matching techniques such as PSM represent a valid empirical strategy to compare the outcome value of a treated unit (in-FD) with the outcome value of a control unit (off-FD) [34]. PSM compares treated and untreated groups as similarly as possible in the observable characteristics, keeping as the only difference whether they are treated or not. The individual characteristics that distinguish treated from untreated groups are combined in such a way as to make the two groups similar. The similarity between subjects is based on estimated treatment probabilities, i.e., the so-called propensity scores. The propensity score range is divided into intervals (or strata) such that, within each interval, the treated units and the untreated units have the same average propensity score value. Following from that, observations with the closest score values are matched. Finally, PSM estimates the effects of ATT, net of the effects which could be derived from the heterogeneity in the observable characteristics of the two groups compared.
However, PSM does not solve the bias derived from unobservable variables, which could characterize the treated and the control groups differently. Specifically, suppose there is no extensive information on observable characteristics. In that case, some unobservable confounders that could potentially affect both the decision to become an FD member, and the outcome of interest are omitted. Thus, we combined the procedure of PSM analysis with the DiD analysis, as the latter method allows us to account for such unobserved characteristics’ presence.
The DiD approach compares the changes in outcomes over time between a treated population (in-FD)’s municipalities and a population that is not (off-FD). This method relies on the key assumption that, if outcomes for both participants and non-participants in FD are tracked over a period of time, such tracking would provide a good basis for identifying the FD effect [35]. Indeed, with double differences, the observed changes over time for non-participants provide counterfactual evidence for participants, assuming that unobserved heterogeneity is present and is time-invariant. The treatment effect (in our case, being in-FDs) is determined by taking the difference in outcomes (second differences) across treatment and control units before and after the program intervention, for the purposes of this paper discerned by the year of establishment of the FDs (first differences).
However, as anticipated, DiD assumes that outcome trends are similar in the control and treatment groups before the intervention and that the only factors explaining differences in outcomes between the two groups are constant over time, except for the treatment itself. Therefore, as DiD attributes any difference in trends between the treatment and the control group to the intervention, any other factor affecting the difference between the two groups is not accounted for in the estimation.
In summary, the empirical methodology consisted of the following steps (Figure 1). First, we calculated several land diversity indices (LDIs) used as outcome variables. LDIs include land use and land-use changes in the territorial areas under study.
Subsequently, according to the DiD procedure, LDIs and their variation in 2006–2018 (ΔLDI = LDI2018–LDI2006) are calculated for each municipality. Year 2006 was set as the reference year before the establishment of FDs, while 2018 was set as the reference year after. The analysis was conducted only on FDs that were active for at least five years before 2018. We then calculated the outcome variables considering the changes in the sustainability indices’ levels for 2006 and 2018, so that ΔLDIs were used as outcome measures. These outcomes (first differences) are then compared between FD participants and non-participants using PSM as a comparing method (second differences).

3.2. The Outcome Variables

The first analytical step has been devoted to the identification and definition of the indices of sustainable land management used as outcome variables. Sustainable agriculture is generally difficult to measure due to its complex mix of environmental, social, and economic characteristics. A “land use” approach focusing on diversity of agrarian landscape and variety in land-use destinations has the advantage of proxying sustainability elements that are related to a variegate landscape (biodiversity, multifunctionality, amenity, etc.) [36,37] and linking them to policies affecting productive choices on the territory [38,39]. The choice of the indices to be used as outcome variables has been made by taking into consideration their suitability in describing complexity and fragmentation in landscapes. Above all, the choice fell on ecology landscape indices as land cover is the only publicly available information that could allow temporal comparisons on sustainability-related territorial features at infra-municipal scale over a sufficient time span.
For the construction of the indices, we used Qgis v 3.4, a Geographic Information System (GIS) software, which allows data management on a spatial basis.
This study looks at land-use sustainability from an evolutionary perspective by adopting a “before–after” approach, thus determining variations that occurred in the period of 2006–2018, an interval conveniently chosen to accommodate the establishment of FDs (2009), on a set of indices deemed to be relevant for the paper: to highlight whether FDs have any impact on fundamental interactions between nature and production.
The first index is the soil sealing index (SSI), which measures municipalities’ share of sealed land, as provided by the Italian Institute for Environmental Protection and Research [40]. The indicator estimates the increase in soil consumption by impervious materials due to urban development and construction (e.g., buildings, constructions, and laying of entirely or partially impermeable artificial material, such as asphalt, metal, glass, plastic, or concrete). This provides an indication of the soil sealing rate, that is, land-use changes from natural or cropped to artificial (urban) land use 4.
Sealed soils loose several of their ecological functions, leading to altered environmental quality and reduced ecosystem services [41] and adversely affecting urban climate and runoff [42,43,44]. The growth of impervious areas can be thus seen as an indicator of land degradation [45].
The annual indicator is presented as hectares of the total yearly sealed land over the total surface of each municipality. Then, the differences between the two annual indicators (SSI2006 and SSI2018) are calculated and used as the outcome variable in the model.
Land-use and land-cover change data were obtained from Lombardia’s DUSAF 5 [46], a multi-temporal, CLC-based, and freely accessible geographic database of land-use types. It has been used to calculate the landscape metrics at the municipality level.
The Sharpe Index (SI) describes the transformation in agricultural land use that occurred over time in the analyzed area and then applied to individual agricultural land classes. The index takes a positive or negative value depending on whether there is an increase in the same type of use or a reduction in the class. Formally:
S I = ( p k 2     p k 1 t 2     t 1 ) S
where: pk1 = area of the single land-use class in year t1 (2006) expressed in hectares; pk2 = area of the single land-use class in year t2 (2018) expressed in hectares; and S = total surface of municipality expressed in squared kilometers.
The SI shows the overall agricultural area variations in the analyzed period at the municipality level and the variation in the composition of the farmland that occurred in each municipality. The latter shows whether the area for crops considered more favorable to the environment (e.g., permanent crops, woodlands, and extensive arable crops) has increased or not, bringing environmental benefits in the analyzed territories. Specifically, land-use change from annual to perennial crops is generally considered environmentally beneficial for several reasons, such as protecting against soil erosion, conserving water and nutrients, storing more carbon below ground, and building better pest tolerance [47].
Another outcome variable we used in the model is the presence of hedges in the area to proxy farmland management for biodiversity. The hedge density index (HDI) was calculated as the ratio of the length in linear meters of the hedges (HL) present in the area to the total agricultural area of each municipality, in hectares. The bigger it is, the greater the discontinuity of the landscape. The formula is as follows:
H D I i t = H L t o t a l   m u n i c i p a l i t y   a g r i c u l t u r e
HDI values have been calculated separately for the years considered in the analysis (2006 and 2018) to assess its variation.
Δ H D I 2018 2006 = Δ H L 2018 2006 M u n i c i p a l   A r e a  
Linear landscape elements such as hedges may provide habitats and enhance habitat connectivity for different organisms. One reason for the recent species loss is the increasing area of arable fields, involving rapid habitat changes within a year, and the destruction of stable semi-natural habitats such as hedgerows [48]. In agriculture, landscape hedges can increase the habitat connectivity among forest habitats, providing corridors and habitat patches for forest species or refuges for open-habitat species [49,50].
The edge diversity index (EDI) is used to measure landscape diversity changes in FDs. It reports landscape fragmentation as the ratio between the total perimeter of a given land use (class i) in meters on the entire area expressed in hectares of the same land (use class i). The higher its value, the more fragmented the landscape.
E D I i t = t o t a l   p e r i m e t e r   c l a s s i t     t o t a l   a r e a   c l a s s i t
Therefore, its variation in the time span considered is given by:
Δ E D I 2018 2006 = Δ T o t a l   P e r i m e t e r   C l a s s i , 2018 2006 Δ T o t a l   A r e a   C l a s s   i , 2018 2006
The landscape diversity is inversely proportional to intensive agricultural activities. Besides the ecological and social values, more diverse ecosystems appear more productive and stable than more homogeneous landscapes, also affecting the economic component of sustainability. Landscape structural heterogeneity is critical for agroecosystem stability and profitability, as shown in the studies on the relations between crop productivity and landscape diversity [51,52].
Finally, two other indices were calculated to proxy landscape diversity. Amongst the most popular metrics used to quantify landscape composition, Hill’s index describes the richness of landscape diversity, and Shannon’s predominance index emphasizes the evenness component.
The Hill diversity number (HDN) reports the amount of land use contributing to the diversity of a given landscape. The higher it is, the more diverse the landscape is. Both general and agricultural HDNs were measured, considering all land and agricultural uses. In formula:
H D N i = e   ( n i N )     log ( n i N )
where: ni = share of the i land-use class expressed in hectares; and N = total surface of municipality expressed in hectares.
Δ H D N 2018 2006
The Shannon dominance index (SDI) reports the degree of predominance of one type of land use over all other types, allowing for evaluating the area’s landscape simplification. The SDI is calculated such that the higher it is, the lower the complexity of the landscape. Two different SDIs were calculated to take into account all land uses (including urban) and just agricultural land use. The formula is the following:
S D I = log   ( n i ) +   ( n i N )   log ( n i N )
where: ni = the area for the specific class of land use (hectares); and N = the total area (hectares); with Δ S D I 2018 2006 describing its changes in the time span.

3.3. The Study Area

The study was conducted in the Italian region of Lombardia, a densely populated region in the north-west of Italy. It is studied here for three main reasons: the high human and economic pressure on natural resources, the intensive agricultural activity, especially in the plains, and the wide diffusion of FDs (Figure 2). FDs operate within a specific socio-economic and territorial context, on one hand, in the river Po valley at the foothill of the Alps, characterized by a high degree of urbanization, together with a large share of specialized arable land, and, on the other, in mountain areas that have experienced depopulation and land abandonment.
High immigration rates and economic growth have caused a fast-growing urban–rural expansion, mainly through land conversions from farmland and forest land into built-up areas. The sealing rate of its territory is among the highest in Italy. In 2020, about 800 hectares of regional land were transformed from agricultural or natural lands to sealed areas [40]. Services and industries are the main economic activities, contributing to about 73.3% and 18.8% of the regional value added (VA), respectively, while agricultural value added contributes only 1% [53].
Lombardia has recognized, due to a specific regional law, 17 FDs, divided into three categories:
-
Rural districts: local production systems characterized by a homogeneous historical and territorial identity resulting from the integration of agricultural and other local activities, as well as the production of goods or services linked to traditions and natural and territorial vocations;
-
Quality agri-food districts: local production systems characterized by a significant economic presence of agrifood business, often enjoying some geographical denomination or listed as typical products of the region;
-
Supply chain districts: highly sector-oriented specialized production systems characterized by solid integration among operators and with a significant economic representativeness at the sectorial and regional levels.
Three bio-districts 6 (Bio-distretto della Val Camonica, Bio-distretto della Valtellina, and Bio-distretto Sociale di Bergamo) are also active in the region. Although not yet acknowledged by regional regulations, the three bio-districts adhere to a private disciplinary drawn up by the Italian Association of Organic Farming (AIAB) and have already led some meaningful initiatives to develop the local supply chains.
Ten districts out of twenty were selected for the analysis. Supply chain districts were discarded because it was impossible to link them to any municipality, as they are based on sectors instead of territories. The analysis also excluded one FD and two bio-districts because their establishment date is too close to the upper time limit of the analysis (2018). Two more FDs have been discarded because it was impossible to determine their territory of reference. The remaining 10 FDs entered the analysis, as illustrated in Figure 2.
Among the tasks assigned to FDs by regional legislation, safeguarding territories and landscapes through agri-food activities is particularly relevant. Other tasks are related to the promotion of local agricultural products, the development of the supply chains through logistic support and co-operation, and the enhancement of the environmental performances of local farming systems. Moreover, they are entitled to act on behalf of the members in some administrative areas (e.g., the planning and management of the EU and national financial support).
The management of urban–rural and mountain–lowland conflicts, as well as possible integrations, are also part of the goals of FDs, not just because most of them lay over the urban–rural fringe surrounding Lombardia’s main cities but also because relationships with urban areas shape market strategies, supply chain logistics, and consumers’ involvement. Nevertheless, this specific function must deal with detrimental tendencies such as expanding rural areas, intensifying agricultural activities, and expanding secondary woodlands. Conflicts reverberate first and foremost on land use and result in agricultural soil loss in urban areas. In contrast, in rural areas, there is a loss of diversity in the landscape mosaic due to both sealing and the abandonment of agricultural activities. Moreover, specific land uses are connected to ecosystem services [55]. The preservation of agricultural spaces, especially those that are more extensive, is entirely within the remit of districts.
In the districts’ partnerships, the inclusion of local administration should guarantee that conflicts are appropriately addressed by planning and local policies (e.g., green public procurement) and by integrating different tools with those deployed at higher territorial levels.

3.4. The Matching Procedure

As mentioned above, the comparison procedure between the two groups was carried out in a mixed way. First, DiD approach was used to calculate the differences in the indices between 2006 and 2018 and a t-test was used to estimate the ATT by means of the first differences reported between the in-FD municipalities and those off-FD. The STATA software, SE 17 version, was used to apply these methods.
The PSM procedure was also used to improve the estimations and check for possible sample selection bias due to heterogeneity of the municipalities. In this case, we first ran the logistic regression model to estimate the propensity score of municipalities, using as dependent variable the participation of municipalities that are on-FD (1 = in-FD, 0 = off-FD). The propensity score was then used to create comparable groups between in-FD and off-FD municipalities.
For the similarity between groups, two variables were used as proxies of the municipality heterogeneities in the economic and environmental characteristics. The first variable measures the distance of each municipality from the nearest provincial capital 7. The proximity of the municipality to metropolitan cities affects both the probability of municipalities being involved in agricultural and rural districts and the outcome measures, as it has crucial effects on the agricultural and natural use of the land due to the high competition between agricultural and urban uses, as well as affecting the local agri-food system at large. This variable was calculated as the mean of the linear distance between the centroid of each municipality and the centroids of each provincial capital. We also used the altimetric classification (mountain, hill, and plain) of municipalities [56] as independent variable in the logistic regression, to take into account the difference in land-use opportunities and landscape diversity between municipalities.
We used nearest neighborhood matching (NNM) as a matching algorithm, the most common form of matching applied [57,58]. It involves running through the list of treated units and selecting the closest eligible control unit to be paired with each treated unit.
Figure 3 shows the municipalities used in the PSM procedure, indicating the treated groups with borderlines and the scoring points with different color graduations. The municipalities not included in the comparison are in white.

4. Results and Discussion

Table 2 and Table 3 report the results of the two matching procedures. In the Table 2, the results derived from the application of the DiD approach are displayed: the first differences (before and after the establishment of FDs) for the treated and the control groups and the second differences (ATT estimations), showing the two-sample Student’s test for continuous variables to detect the statistical significance of differences between the means. Table 3 reports the results of the mixed procedures, where the ATT was estimated by comparing treated and untreated groups according to the PSM method.
The total Sharpe index indicates the annual change of agricultural area over the total municipality areas. In both the matching procedures, we have estimated a positive ATT, highlighting an average expansion of agricultural land in the municipalities included in the districts. In particular, the farming area has decreased in the municipalities out of FDs, while in the FDs, it has increased. Moreover, the increase concerns the permanent crops, as shown by the positive ATT in the “Sharpe index permanent crops”. In this regard, it is worth highlighting that many previous studies presented empirical evidence on the role of perennial crops as a valuable component of local sustainability. For instance, perennial crops (and especially tree crops) generally accumulate soil organic carbon (SOC) through time [59,60] and are, therefore, essential in climate change mitigation strategies.
The ATT of “Sharpe index wood arboriculture”, estimated with the t-test comparing the procedure, is negative but not significant. At the same time, it was significant and positive in the matching procedure performed with the PSM method. Arboriculture contributes to the health of the biological ecosystems, specifically in enhancing landscape diversity and increasing farmland suitability to preserve various species of animals (e.g., hares) in intensive agricultural areas [61]. The presence of trees and well-maintained grass can also contribute to the health of the social ecosystem in urban communities, transforming lands into pleasant, welcoming, well-used spaces [62]. Likewise, woods and forests produce social and environmental benefits and marketable timber outputs. These non-market benefits include open access, non-priced recreation, landscape amenity, biodiversity, carbon sequestration, pollution absorption, water supply and quality, and protection of archaeological artefacts [63]. However, looking at the “Sharpe index of woods”, our results show a negative ATT, as the changes in the period analyzed were favorable to the areas outside the district.
Woodland patches and hedgerows are essential components of the agri-ecosystem [64,65]. As shown in Table 1, the hedge density index in municipalities outside the districts decreased in the analyzed period, suggesting a decline of farms, trees, and hedgerows, primarily due to agricultural intensification, which has driven the creation of larger, more simplified field systems. A positive ATT, on the other hand, highlights a different trend related to the treated group.
The variation of the edge diversity index between 2006 and 2018 has been negative both for in-FD and off-FD municipalities. In this case, the habitat pattern became less fragmented throughout the regional territory. However, the reduction was less drastic in district areas, as the positive ATT shows.
Regarding soil consumption, i.e., the phenomenon associated with the urban occupation of originally agricultural, natural, or semi-natural surfaces, Table 1 shows that both treated and untreated groups experienced an increase in the percentage of annual soil consumption in the analyzed period. However, the index has averagely increased more in the treated group, highlighting the inability of districts to curb the increase in the artificial cover of land linked to settlement dynamics.

5. Conclusions

The FD was widely conceived as an innovative tool of territorial organization, which could also increase the multifunctional role of the primary sector and improve the environmental performance of food production in a sustainable way. Despite the importance of this issue, there are very few studies, and even less about Italy, which attempt to measure the actual FDs’ contribution in improving the environmental sustainability of local productions.
The present study offers detailed insights into the territorial effects connected to the presence of FDs. The grouping of the municipalities based on distance from the main urban areas and altimetry suggests that those effects cannot be considered separately by other territorial features and outside an urban–rural relationship.
In such a framework, our analysis seems to prove that there is an “FD effect” on the persistence of agriculture that, although it does not necessarily translate into landscape diversity, can at least counteract detrimental tendencies such as the loss of natural elements, landscape diversity due to extensive farming, and even land abandonment. Such a slowing action, however, manifests itself, above all, in preventing woodlands from invading agricultural areas, since there is no significant FD effect on agricultural soil loss, probably because most FDs are in highly urbanized areas. This finding suggests a failure of the integration of FD strategies with urban planning.
Although unsuitable for determining a causal link between FDs’ actions and effects on land management, the results provide insights for further studies. Spatial analysis tools could fit the purpose by considering interactions between socio-economic features and land management within the districts and possible spillovers to neighboring areas.
Despite limitations, this paper offers useful insights for policy recommendations, as its results pledge to ensure a greater territorial integration of interventions for the sustainability of agro-food systems that could be pursued with appropriate policies in the framework of CAP 2023–2027. Besides providing the governance for territorial co-operation in the framework of rural development measures, FDs could also foster integration between the first and the second pillar of EU CAP—for instance, eco-schemes with a landscape conservation approach (e.g., in Italy, the eco-scheme 5-Measure for pollinators and eco-scheme 3-Safeguard for olive trees of particular landscape value) with rural development measures to support agro-environmental and climate actions in view of landscape-level benefits. It is, nevertheless, necessary that policies from higher administrative levels (EU, and national) do co-ordinate with local institutions in favor of specific programming measures, to maximize effectiveness. This could be the case for overcoming conflicts in the rural–urban fringe that can hinder the implementation of agro-environmental policies. This kind of policy should be more effectively addressed at the local level, through multi-governance, participatory approaches that could be managed by FDs, which could assume a leading role in policy management. In that view, they are a valuable tool available to bring the issues of landscape protection and sustainable agriculture into the community-led local development discourse.

Author Contributions

Conceptualization, F.C., R.H. and A.S.; methodology, F.C.; data curation, A.S.; investigation, F.C., R.H. and A.S.; writing—original draft preparation, R.H.; writing—review and editing F.C., R.H. and A.S. All authors have read and agreed to the published version of the manuscript.

Funding

This research received no external funding.

Data Availability Statement

Not applicable.

Acknowledgments

Many thanks to the readers and the anonymous reviewers who helped us finetune the text of the paper.

Conflicts of Interest

The authors declare no conflict of interest.

Notes

1
In Italian: Distretto del Cibo.
2
We refer to the so-called agri-food districts, the rural districts, and the bio-districts, all operating around the production of food (or organic food) in rural or peri-urban areas. Territorial and multi-actor approaches to agriculture have been recognized by a specific regulation (legislative decree no. 22801). Recently it has been emended by law n. 205/2017 establishing FDs and further specifying the type of districts that could be acknowledged by introducing the Bio-districts and the “urban and peri-urban” districts.
3
It is an empirical approach used to estimate the impact of an intervention on a target population without randomly assigning members of that population to experimental conditions.
4
The data source is the soil consumption database provided by ISPRA (2022).
5
DUSAF is the Italian acronym for Destinazione d’Uso del Suolo Agricolo e Forestale (Agricultural and Forest Soil Use Destination).
6
Bio-districts are defined as rural areas where different actors work together for the sustainable management of local resources, based on the principles and models of organic farming [54]. Bio-districts fall into the categories provided for by the law n. 205/2017 and are specifically ruled by the new national law on organic farming (n. 23/2022).
7
A city or town where administrative authorities responsible for each FD seat (Provincia).

References

  1. Toccaceli, D. Agricultural districts in the Italian regions: Looking toward 2020. Agric. Econ. 2015, 3, 1. [Google Scholar] [CrossRef]
  2. Serneels, S.; Lambin, E.F. Proximate causes of land-use change in Narok district, Kenya: A spatial statistical model. Agric. Ecosyst. Environ. 2001, 85, 65–81. [Google Scholar] [CrossRef]
  3. Yalew, S.G.; Mul, M.L.; van Griensven, A.; Teferi, E.; Priess, J.; Schweitzer, C.; Van Der Zaag, P. Land-use change modelling in the upper blue Nile basin. Environments 2016, 3, 21. [Google Scholar] [CrossRef]
  4. Tewabe, D.; Fentahun, T. Assessing land use and land cover change detection using remote sensing in the Lake Tana Basin, Northwest Ethiopia. Cogent Environ. Sci. 2020, 6, 309–332. [Google Scholar] [CrossRef]
  5. Hailu, A.; Mammo, S.; Kidane, M. Dynamics of land use, land cover change trend and its drivers in Jimma Geneti District, Western Ethiopia. Land Use Policy 2020, 99, 105011. [Google Scholar] [CrossRef]
  6. Fanfani, D.; Duží, B.; Mancino, M.; Rovai, M. Multiple evaluation of urban and peri-urban agriculture and its relation to spatial planning: The case of Prato territory (Italy). Sustain. City Soc. 2002, 79, 103636. [Google Scholar] [CrossRef]
  7. López-Estébanez, N.; Yacamán-Ochoa, C.; Mata-Olmo, R. The Multifunctionality and Territoriality of Peri-Urban Agri-Food Systems: The Metropolitan Region of Madrid, Spain. Land 2002, 11, 588. [Google Scholar] [CrossRef]
  8. Shaikh Shamim, H.; Lin, Z. Impact of land use change on ecosystem services: A review. Environ. Dev. 2020, 34, 100527. [Google Scholar] [CrossRef]
  9. Belmin, R.; François Casabianca, F.; Meynard, J.M. Contribution of Transition Theory to the Study of Geographical Indications. Environ. Innov. Soc. Transit. 2018, 27, 32–47. [Google Scholar] [CrossRef]
  10. Shongwe, M.I.; Bezuidenhout, C.N.; Sibomana, M.S.; Workneh, T.S.; Bodhanya, S.; Dlamini, V.V. Developing a Systematic Diagnostic Model for Integrated Agricultural Supply and Processing System. Systems 2019, 7, 5. [Google Scholar] [CrossRef]
  11. Quiñones Ruiz, X.F.; Nigmann, T.; Schreiber, C.; Neilson, J. Collective Action Milieus and Governance Structures of Protected Geographical Indications for Coffee in Colombia, Thailand and Indonesia. Int. J. Commons 2020, 14, 329–343. [Google Scholar] [CrossRef]
  12. Edelmann, H.; Quiñones-Ruiz, X.; Penker, M.; Scaramuzzi, S.; Broscha, K.; Jeanneaux, P.; Belletti, G.; Marescotti, A. Social Learning in Food Quality Governance-Evidences from Geographical Indications Amendments. Int. J. Commons 2020, 14, 108–122. [Google Scholar] [CrossRef]
  13. Traversac, J.B. Cooperation and Governance in Wine Territories: A New Institutional Economic Analysis. In Territorial Governance, Local Development, Rural Areas and Agrofood Systems; Torre, A., Traversac, J.B., Eds.; Springer: Berlin/Heidelberg, Germany, 2012; pp. 159–183. [Google Scholar]
  14. Chappuis, J.M.; Sans, P. Actors’ Coordination: Governance Structures and Institutions in Supply Chains of Protected Designation of Origin. In The Socioeconomics of Origin Labelled Products in Agro-Food Supply Chains: Spatial, Institutional and Co-Ordination Aspects; Sylvander, B., Barjolle, D., Arfini, F., Eds.; Series Actes et Communications; INRA: Paris, France, 2000; Volume 17. [Google Scholar]
  15. Henke, R.; Cimino, O.; Vanni, F. The role of diversification in the revenue composition of Italian farms. Ital. Rev. Agric. Econ. 2022, 77, 25–38. [Google Scholar] [CrossRef]
  16. Beers, P.J.; Geerling-Eiff, F. Networks as Policy Instruments for Innovation. J. Agric. Educ. Ext. 2014, 20, 363–379. [Google Scholar] [CrossRef]
  17. Hermans, F.; Klerkx, L.; Roep, D. Structural Conditions for Collaboration and Learning in Innovation Networks: Using an Innovation System Performance Lens to Analyse Agricultural Knowledge Systems. J. Agric. Educ. Ext. 2015, 21, 35–54. [Google Scholar] [CrossRef]
  18. Becattini, G. Industrial sectors and industrial districts: Tools for industrial analysis. Eur. Plan. Stud. 2002, 10, 825–846. [Google Scholar] [CrossRef]
  19. Consiglio Italiano per le Scienze Sociali (CSS). Tendenze e Politiche dello Sviluppo Locale in Italia; Libro Bianco; Marsilio: Venezia, Italy, 2005. [Google Scholar]
  20. Fabiani, G. (Ed.) Letture Territoriali dello Sviluppo Agricolo; Franco Angeli: Milano, Italy, 1991. [Google Scholar]
  21. Pilati, L. I Sistemi Agricoli Nelle Interdipendenze Territoriali, Progetto RAISA; Edizioni Osiride: Rovereto, Italy, 1996. [Google Scholar]
  22. Donati, M.; Mancini, M.C.; Menozzi, D. Il distretto del Prosciutto di Parma tra tipicità e sostenibilità. Econ. Dirit. Agroaliment. 2012, 17, 133–159. [Google Scholar]
  23. Lamine, C.; Renting, H.; Rossi, A.; Wiskerke, J.S.C.; Brunori, G. Agri-Food systems and territorial development: Innovations, new dynamics and changing governance mechanisms. In Farming Systems Research into the 21st Century: The New Dynamic; Springer: Dordrecht, The Netherlands, 2012; pp. 229–256. [Google Scholar] [CrossRef]
  24. Lamine, C.; Garçon, L.; Brunori, G. Territorial agrifood systems: A Franco-Italian contribution to the debates over alternative food networks in rural areas. J. Rural Stud. 2019, 68, 159–170. [Google Scholar] [CrossRef]
  25. Zezza, A.; Henke, R.; Lai, M.; Petriccione, G.; Solazzo, R.; Sturla, A.; Vagnozzi, A.; Vanino, S.; Viganò, L.; Smit, A.B.; et al. RESEARCH for AGRI Committee—Policy Support for Productivity vs. Sustainability in EU Agriculture: Towards Viable Farming and Green Growth: Study; European Parliament: Strasbourg, France, 2017; Available online: http://www.europarl.europa.eu/RegData/etudes/STUD/2017/585905/IPOL_STU(2017)585905_EN.pdf (accessed on 24 April 2023).
  26. Wezel, A.; Brives, H.; Casagrande, M.; Clément, C.; Dufour, A.; Vandenbroucke, P. Agroecology territories: Places for sustainable agricultural and food systems and biodiversity conservation. Agroecol. Sustain. Food Syst. 2016, 40, 132–144. [Google Scholar] [CrossRef]
  27. Swagemakers, P.; Domínguez García, M.D.; Milone, P.; Ventura, F.; Wiskerke, J.S.C. Exploring cooperative place-based approaches to restorative agriculture. J. Rural Stud. 2019, 68, 191–199. [Google Scholar] [CrossRef]
  28. González-Romero, G.; Silva-Pérez, R.; Cánovas-García, F. Territorialised Agrifood Systems and Sustainability: Methodological Approach on the Spanish State Scale. Sustainability 2022, 14, 11900. [Google Scholar] [CrossRef]
  29. Michel-Villarreal, R.; Hingley, M.; Canavari, M.; Bregoli, I. Sustainability in Alternative Food Networks: A Systematic Literature Review. Sustainability 2019, 11, 859. [Google Scholar] [CrossRef]
  30. CIRAD-SAR. Systèmes Agroalimentaires Localisés: Organisations, Innovations et Développement Local; Rapport ATP; CIRAD-SAR: Montpellier, France, 1996. [Google Scholar]
  31. Cortes, C.; Mohri, M.; Riley, M.; Rostamizadeh, A. Sample Selection Bias Correction Theory. In Proceedings of the Algorithmic Learning Theory: 19th International Conference, ALT 2008, Budapest, Hungary, 13–16 October 2008. [Google Scholar] [CrossRef]
  32. Abadie, A.; Imbens, G.W. Bias-corrected matching estimators for average treatment effects. J. Bus. Econ. Stat. 2011, 29, 1–11. [Google Scholar] [CrossRef]
  33. Huang, J.; Gretton, A.; Borgwardt, K.; Schölkopf, B.; Smola, A. Correcting sample selection bias by unlabeled data. In Advances in Neural Information Processing Systems in Advances in Neural Information Processing Systems, Proceedings of the 2006 Conference (NIPS 2006), Vancouver, BC, Canada, 4–7 December 2006; Schölkopf, B., Platt, B., Hoffman, T., Eds.; MIT Press: Boston, MA, USA, 2007. [Google Scholar] [CrossRef]
  34. Gertler, P.J.; Martinez, S.; Premand, P.; Rawlings, L.B.; Vermeersch, C.M. Impact Evaluation in Practice, 2nd ed.; World Bank: Washinton, DC, USA, 2016. [Google Scholar] [CrossRef]
  35. Khandker, S.R.; Koolwal, G.B.; Samad, H.A. Handbook on Impact Evaluation: Quantitative Methods ad Practices; World Bank: Washinton, DC, USA, 2010. [Google Scholar]
  36. Benton, T.G.; Vickery, J.A.; Wilson, J.D. Farmland biodiversity: Is habitat heterogeneity the key? Trends Ecol. Evol. 2003, 18, 182–188. [Google Scholar] [CrossRef]
  37. Kuchma, T.; Tarariko, O.; Syrotenko, O. Landscape diversity indexes application for agricultural land use optimization. Procedia Technol. 2013, 8, 566–569. [Google Scholar] [CrossRef]
  38. Surya, B.; Ahmad, D.N.A.; Sakti, H.H.; Sahban, H. Land use change, spatial interaction, and sustainable development in the metropolitan urban areas, South Sulawesi Province, Indonesia. Land 2020, 9, 95. [Google Scholar] [CrossRef]
  39. Uuemaa, E.; Antrop, M.; Roosaare, J.; Marja, R.; Mander, Ü. Landscape metrics and indices: An overview of their use in landscape research. Living Rev. Landsc. Res. 2009, 3, 1–28. [Google Scholar] [CrossRef]
  40. ISPRA—Consumo del Suolo. Available online: https://www.isprambiente.gov.it/it/attivita/suolo-e-territorio/suolo/il-consumo-di-suolo/i-dati-sul-consumo-di-suolo (accessed on 22 April 2023).
  41. Couch, C.; Petschel-Held, G.; Leontidou, L. Urban Sprawl in Europe: Landscape, Land-Use Change and Policy; Blackwell: London, UK, 2007. [Google Scholar]
  42. Johnson, M.P. Environmental impacts of urban sprawl: A survey of the literature and proposed research agenda. Environ. Plan. A 2001, 33, 717–735. [Google Scholar] [CrossRef]
  43. Genske, D.D. Urban Land—Degradation, Investigation, Remediation; Springer: Berlin/Heidelberg, Germany, 2003. [Google Scholar]
  44. Hough, M. Cities and Natural Process; Routledge: Abingdon-on-Thames, UK, 2004. [Google Scholar]
  45. Salvati, L.; Bajocco, L.; Ceccarelli, T.; Zitti, M.; Perini, L. Towards a process-based evaluation of land vulnerability to soil degradation in Italy. Ecol. Indic. 2011, 11, 1216–1227. [Google Scholar] [CrossRef]
  46. DUSAF. Uso e Copertura del Suolo in Regione Lombardia. Available online: https://www.regione.lombardia.it/wps/portal/istituzionale/HP/DettaglioServizio/servizi-e-informazioni/Enti-e-Operatori/Territorio/sistema-informativo-territoriale-sit/uso-suolo-dusaf/uso-suolo-dusaf (accessed on 22 April 2023).
  47. Zhang, Y.; Li, Y.; Jiang, L.; Tian, C.; Li, J.; Xiao, Z. Potential of perennial crop on environmental sustainability of agriculture. Procedia Environ. Sci. 2011, 10, 1141–1147. [Google Scholar] [CrossRef]
  48. Burel, F.; Butet, A.; Delettre, Y.R.; De La Peña, N.M. Differential response of selected taxa to landscape context and agricultural intensification. Landsc. Urban Plan. 2004, 67, 195–204. [Google Scholar] [CrossRef]
  49. Michel, N.; Burel, F.; Butet, A. How does landscape use influence small mammal diversity, abundance and biomass in hedgerow networks of farming landscapes? Acta Oecologica 2006, 30, 11–20. [Google Scholar] [CrossRef]
  50. Batáry, P.; Holzschuh, A.; Orci, K.M.; Samu, F.; Tscharntke, T. Responses of plant, insect and spider biodiversity to local and landscape scale management intensity in cereal crops and grasslands. Agric. Ecosyst. Environ. 2012, 146, 130–136. [Google Scholar] [CrossRef]
  51. Nelson, K.S.; Burchfield, E.K. Landscape complexity and US crop production. Nat. Food 2021, 2, 330–338. [Google Scholar] [CrossRef] [PubMed]
  52. Zymaroieva, A.; Zhukov, O.; Fedoniuk, T.; Pinkina, T.; Hurelia, V. The relationship between landscape diversity and crops productivity: Landscape scale study. J. Landsc. Ecol. 2021, 14, 39–58. [Google Scholar] [CrossRef]
  53. ISTAT. Conti e Aggregate Economici Territoriali. Available online: http://dati.istat.it/Index.aspx?QueryId=11451 (accessed on 22 April 2023).
  54. Hasan, S.; Shi, W.; Zhu, X. Impact of land use land cover changes on ecosystem service value—A case study of Guangdong, Hong Kong, and Macao in South China. PLoS ONE 2020, 15, e0231259. [Google Scholar] [CrossRef] [PubMed]
  55. Stotten, R.; Bui, S.; Pugliese, P.; Schermer, M.; Lamine, C. Organic Values-Based Supply Chains as a Tool for Territorial Development: A Comparative Analysis of Three European Organic Regions. Int. J. Sociol. Agric. Food 2011, 24, 135–154. [Google Scholar] [CrossRef]
  56. ISTAT. Basi Territoriali. Available online: https://www.istat.it/it/archivio/104317#accordions (accessed on 22 April 2023).
  57. Thoemmes, F.J.; Kim, E.S. A Systematic Review of Propensity Score Methods in the Social Sciences. Multivar. Behav. Res. 2011, 46, 90–118. [Google Scholar] [CrossRef]
  58. Zakrison, T.L.; Austin, P.C.; McCredie, V.A. A systematic review of propensity score methods in the acute care surgery literature: Avoiding the pitfalls and proposing a set of reporting guidelines. Eur. J. Trauma Emerg. Surg. 2018, 44, 385–395. [Google Scholar] [CrossRef]
  59. Ledo, A.; Smith, P.; Zerihun, A.; Whitaker, J.; Vicente-Vicente, J.L.; Qin, Z.; McNamara, N.P.; Zinn, Y.L.; Llorente, M.; Liebig, M.; et al. Changes in soil organic carbon under perennial crops. Glob. Chang. Biol. 2020, 26, 4158–4168. [Google Scholar] [CrossRef]
  60. Laganiere, J.; Angers, D.A.; Pare, D. Carbon accumulation in agricultural soils after afforestation: A meta-analysis. Glob. Chang. Biol. 2010, 16, 439–453. [Google Scholar] [CrossRef]
  61. Cardarelli, E.; Meriggi, A.; Brangi, A.; Vidus-Rosin, A. Effects of arboriculture stands on European hare Lepus europaeus spring habitat use in an agricultural area of northern Italy. Acta Theriol. 2011, 56, 229–238. [Google Scholar] [CrossRef]
  62. Kuo, F.E. The role of arboriculture in a healthy social ecology. J. Arboric. 2003, 29, 148–155. [Google Scholar] [CrossRef]
  63. Willis, K.G.; Garrod, G.; Scarpa, R.; Powe, N.; Lovett, A.; Bateman, I.J.; Hanley, N.; Macmillan, D.C. The Social and Environmental Benefits of Forests in Great Britain; Social & Environmental Benefits of Forestry Phase 2; Forestry Commission: Edinburgh, UK, 2003; pp. 2–4.
  64. Montgomery, I.; Caruso, T.; Reid, N. Hedgerows as Ecosystems: Service Delivery, Management, and Restoration. Annu. Rev. Ecol. Evol. Syst. 2020, 51, 81–102. [Google Scholar] [CrossRef]
  65. Garcia-Feced, C.; Weissteiner, C.J.; Baraldi, A.; Paracchini, M.L.; Maes, J. Semi-natural vegetation in agricultural land: European map and links to ecosystem service supply. Agron. Sustain. Dev. 2015, 35, 273–283. [Google Scholar] [CrossRef]
Figure 1. Flow chart of methodological steps.
Systems 11 00283 g001
Figure 2. Distribution of the food districts and bio-districts focused on by the present study in the Lombardia region.
Systems 11 00283 g002
Figure 3. Matched municipalities.
Systems 11 00283 g003
Table 1. Territorial approaches to sustainable food systems.
Territorial
Approach to Food System
DefinitionOrganizationTerritorial Extension
Alternative food networks [29]Any food-provisioning practice which is different from the mainstream food systemsFormal/
informal
Undefined
Localized agro-food systems [30]Production and service organizations (agricultural and agri-food production units, marketing, services, gastronomic enterprises, etc.) linked by their characteristics and operational ways to a specific territoryFormal/
informal
Undefined
Agroecology
territories [26]
Territories where (a) a transition
toward sustainable agriculture based on agro-ecological practices exists, (b) biodiversity and resource conservation is considered, (c) territory-linked embedded food systems exist, and (d) stakeholders support the transition toward sustainable agricultural and food systems
Formal/
informal
Defined/undefined
Food districtsStrategic tool aimed at fostering sustainable territorial development, cohesion, and social inclusion, favouring the integration of activities characterized by territorial proximity.FormalDefined
Table 2. Differences-in-differences (DID) results.
Outcome VariablesTreatedControlsATTStatistical Significance 1
SI total0.24−0.040.28***
SI arable crops0.010.000.01***
SI permanent crops0.390.05−0.34***
SI wood arboriculture0.00−0.010.00
SI woods and forests0.060.16−0.10***
EDI−176.47−360.80184.33***
HDI0.66−0.010.67***
HDN total−0.62−0.38−0.24***
HDN agriculture0.180.27−0.08
SSI0.730.590.14***
SDI total0.130.110.01
SDI agriculture0.150.060.10*
1 Significant level: *** p < 0.01 and * p < 0.1.
Table 3. Differences-in-differences (DID) with nearest neighborhood matching (NNM) results.
Outcome VariablesTreatedControlsATTStatistical Significance 1
SI total0.24−0.030.26***
SI arable crops0.010.010.00**
SI permanent crops0.390.030.36***
SI wood arboriculture0.00−0.020.01*
SI woods and forests0.060.15−0.09***
EDI−176.47−326.69150.21**
HDI0.19−0.080.26
HDN total−0.62−0.46−0.16*
HDN agriculture0.180.21−0.02
SSI0.730.540.19***
SDI total0.130.110.01
SDI agriculture0.150.060.10**
1 Significant level: *** p < 0.01, ** p < 0.05, and * p < 0.1.
Disclaimer/Publisher’s Note: The statements, opinions and data contained in all publications are solely those of the individual author(s) and contributor(s) and not of MDPI and/or the editor(s). MDPI and/or the editor(s) disclaim responsibility for any injury to people or property resulting from any ideas, methods, instructions or products referred to in the content.

