
Assessing the Determinants of Corporate Risk-Taking Using Machine Learning Algorithms

Abstract
:1. Introduction
2. Literature Review
3. Research Methodology
3.1. Sample and Data
3.2. Variable Definitions
3.3. Methodology
3.4. Model Predictive Performance
3.5. SHapley Additive exPlanations (SHAP) Method
4. Results
4.1. Model Predictive Performance Comparison
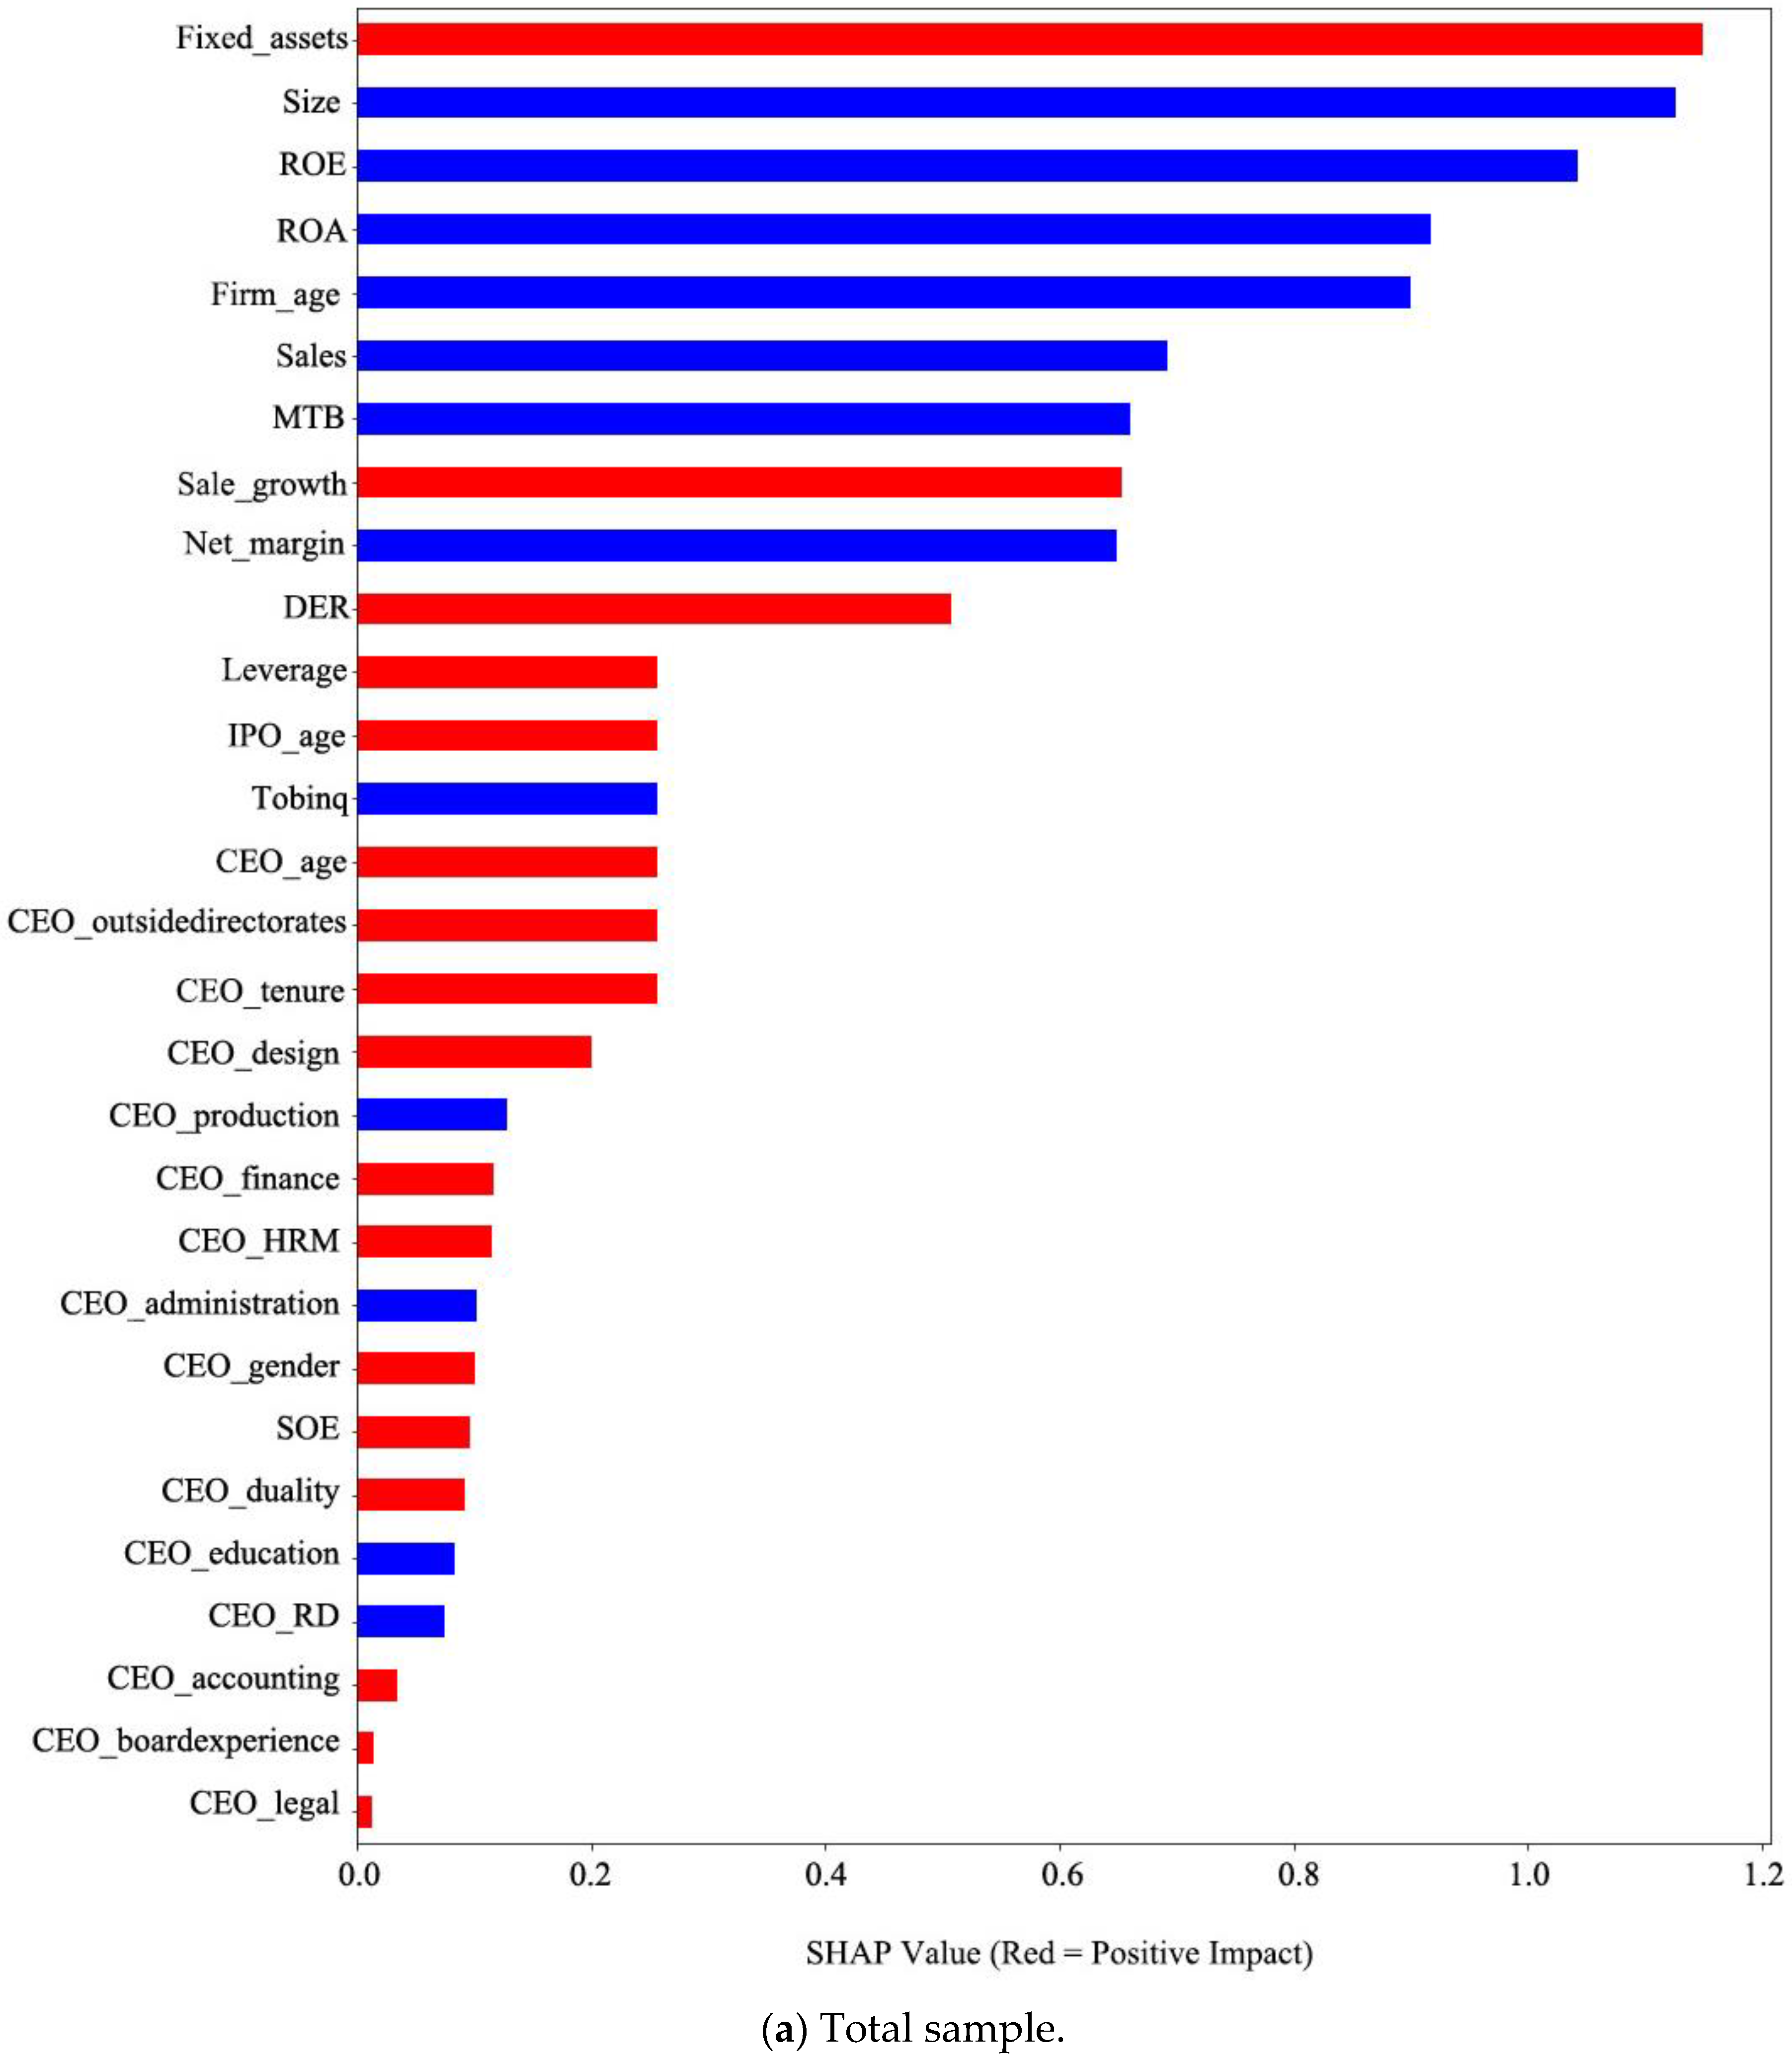
4.2. Which Variables Matter?
4.3. The Variable Effects on Corporate Risk-taking
4.3.1. Total Sample
4.3.2. Large and Small Enterprises
4.3.3. Robustness Tests
5. Discussion and Conclusions
5.1. Theoretical Implications
5.2. Practical Implications
5.3. Limitations and Recommendations
Author Contributions
Funding
Data Availability Statement
Acknowledgments
Conflicts of Interest
Appendix A

| Variable | Definition |
|---|---|
| Risk_taking | The three-year standard deviation of adjusted return on assets (AdjROA), which is the ratio of earnings before interest and taxes (EBIT) to total assets (Asset) adjusted for the firm’s industry and yearly averages. |
| Firm basic characteristics | |
| Firm_age | The number of years between founding and the year of observation. |
| IPO_age | The number of years since the IPO date. |
| Size | The natural logarithm of total assets. |
| SOE | Takes the value of 1 if the firm’s actual controller belongs to government and 0 if otherwise. |
| Fixed_assets | Fixed assets are divided by total assets. |
| Sale_growth | The annual growth of sales from t−1 to t. |
| DER | The ratio of total debt to total equity. |
| Leverage | The percentage of total debt to total assets. |
| Firm performance | |
| ROA | Net income/Total assets. |
| ROE | Net income/Total equity. |
| Net_margin | Net profit/Total revenue. |
| Tobinq | The percentage of the market value to the book value of total assets. |
| MTB | The ratio of the market value to the book value of equity. |
| Sales | The natural logarithm of total sales. |
| CEO characteristics | |
| CEO_gender | 1 for female CEOs and 0 for male CEOs. |
| CEO_age | Age of the CEO. |
| CEO_duality | 1 if the CEO also serves as chairman and 0 if otherwise. |
| CEO_education | If the CEO holds a postgraduate degree, CEO_education = 1, and 0 if otherwise. |
| CEO_tenure | The natural logarithm of CEO tenure. |
| CEO_boardexperience | It is 1 if the CEO is also a director and 0 if otherwise. |
| CEO_outsidedirectorates | The total number of outside directorates a CEO holds or has held on other firm boards. |
| CEO_production | 1 if the CEO has production career experience and 0 if otherwise. |
| CEO_RD | 1 if the CEO has R&D career experience and 0 if otherwise. |
| CEO_design | 1 if the CEO has design career experience and 0 if otherwise |
| CEO_HRM | CEO_HRM = 1 for CEOs who have career experience in the human resource management area and 0 if otherwise. |
| CEO_administration | CEO_administration = 1 for CEOs who have administration career experience and 0 if otherwise. |
| CEO_finance | 1 if the CEO has finance career experience and 0 if otherwise. |
| CEO_accounting | CEO_accounting = 1 if the CEO has accounting career experience and 0 if otherwise. |
| CEO_legal | 1 if the CEO has career experience in the legal area and 0 if otherwise. |
Appendix B
| Variable | Number | Mean | S.D. | Median |
|---|---|---|---|---|
| Risk_taking | 15,774 | 4.8582 | 10.0107 | 2.1180 |
| Firm_age | 15,774 | 17.3617 | 5.5258 | 17 |
| IPO_age | 15,774 | 8.9710 | 6.8454 | 7 |
| Size | 15,774 | 12.7666 | 1.2053 | 12.6045 |
| SOE | 15,774 | 0.0884 | 0.2839 | 0 |
| Fixed_assets | 15,774 | 0.2089 | 0.1552 | 0.1775 |
| Sale_growth | 15,774 | 0.1988 | 0.4106 | 0.1262 |
| DER | 15,774 | 1.0105 | 1.1126 | 0.6493 |
| Leverage | 15,774 | 0.4036 | 0.2082 | 0.3937 |
| ROA | 15,774 | 0.0403 | 0.0568 | 0.0395 |
| ROE | 15,774 | 0.0609 | 0.1196 | 0.0684 |
| Net_margin | 15,774 | 0.0803 | 0.1494 | 0.0759 |
| Tobinq | 15,774 | 2.0838 | 1.2827 | 1.6595 |
| MTB | 15,774 | 3.7561 | 3.0469 | 2.8444 |
| Sales | 15,774 | 12.0757 | 1.3690 | 11.9620 |
| CEO_gender | 15,774 | 0.0688 | 0.2532 | 0 |
| CEO_age | 15,774 | 49.3281 | 6.4256 | 49 |
| CEO_duality | 15,774 | 0.2973 | 0.4571 | 0 |
| CEO_education | 15,774 | 0.4562 | 0.4981 | 0 |
| CEO_tenure | 15,774 | 3.7679 | 3.3586 | 3 |
| CEO_boardexperience | 15,774 | 1.0153 | 0.1745 | 1 |
| CEO_outsidedirectorates | 15,774 | 1.9769 | 3.3095 | 1 |
| CEO_production | 15,774 | 0.1310 | 0.3374 | 0 |
| CEO_RD | 15,774 | 0.2704 | 0.4442 | 0 |
| CEO_design | 15,774 | 0.0330 | 0.1787 | 0 |
| CEO_HRM | 15,774 | 0.0209 | 0.1429 | 0 |
| CEO_administration | 15,774 | 0.9970 | 0.0551 | 1 |
| CEO_finance | 15,774 | 0.1144 | 0.3183 | 0 |
| CEO_accounting | 15,774 | 0.0959 | 0.2945 | 0 |
| CEO_legal | 15,774 | 0.0079 | 0.0887 | 0 |
Appendix C
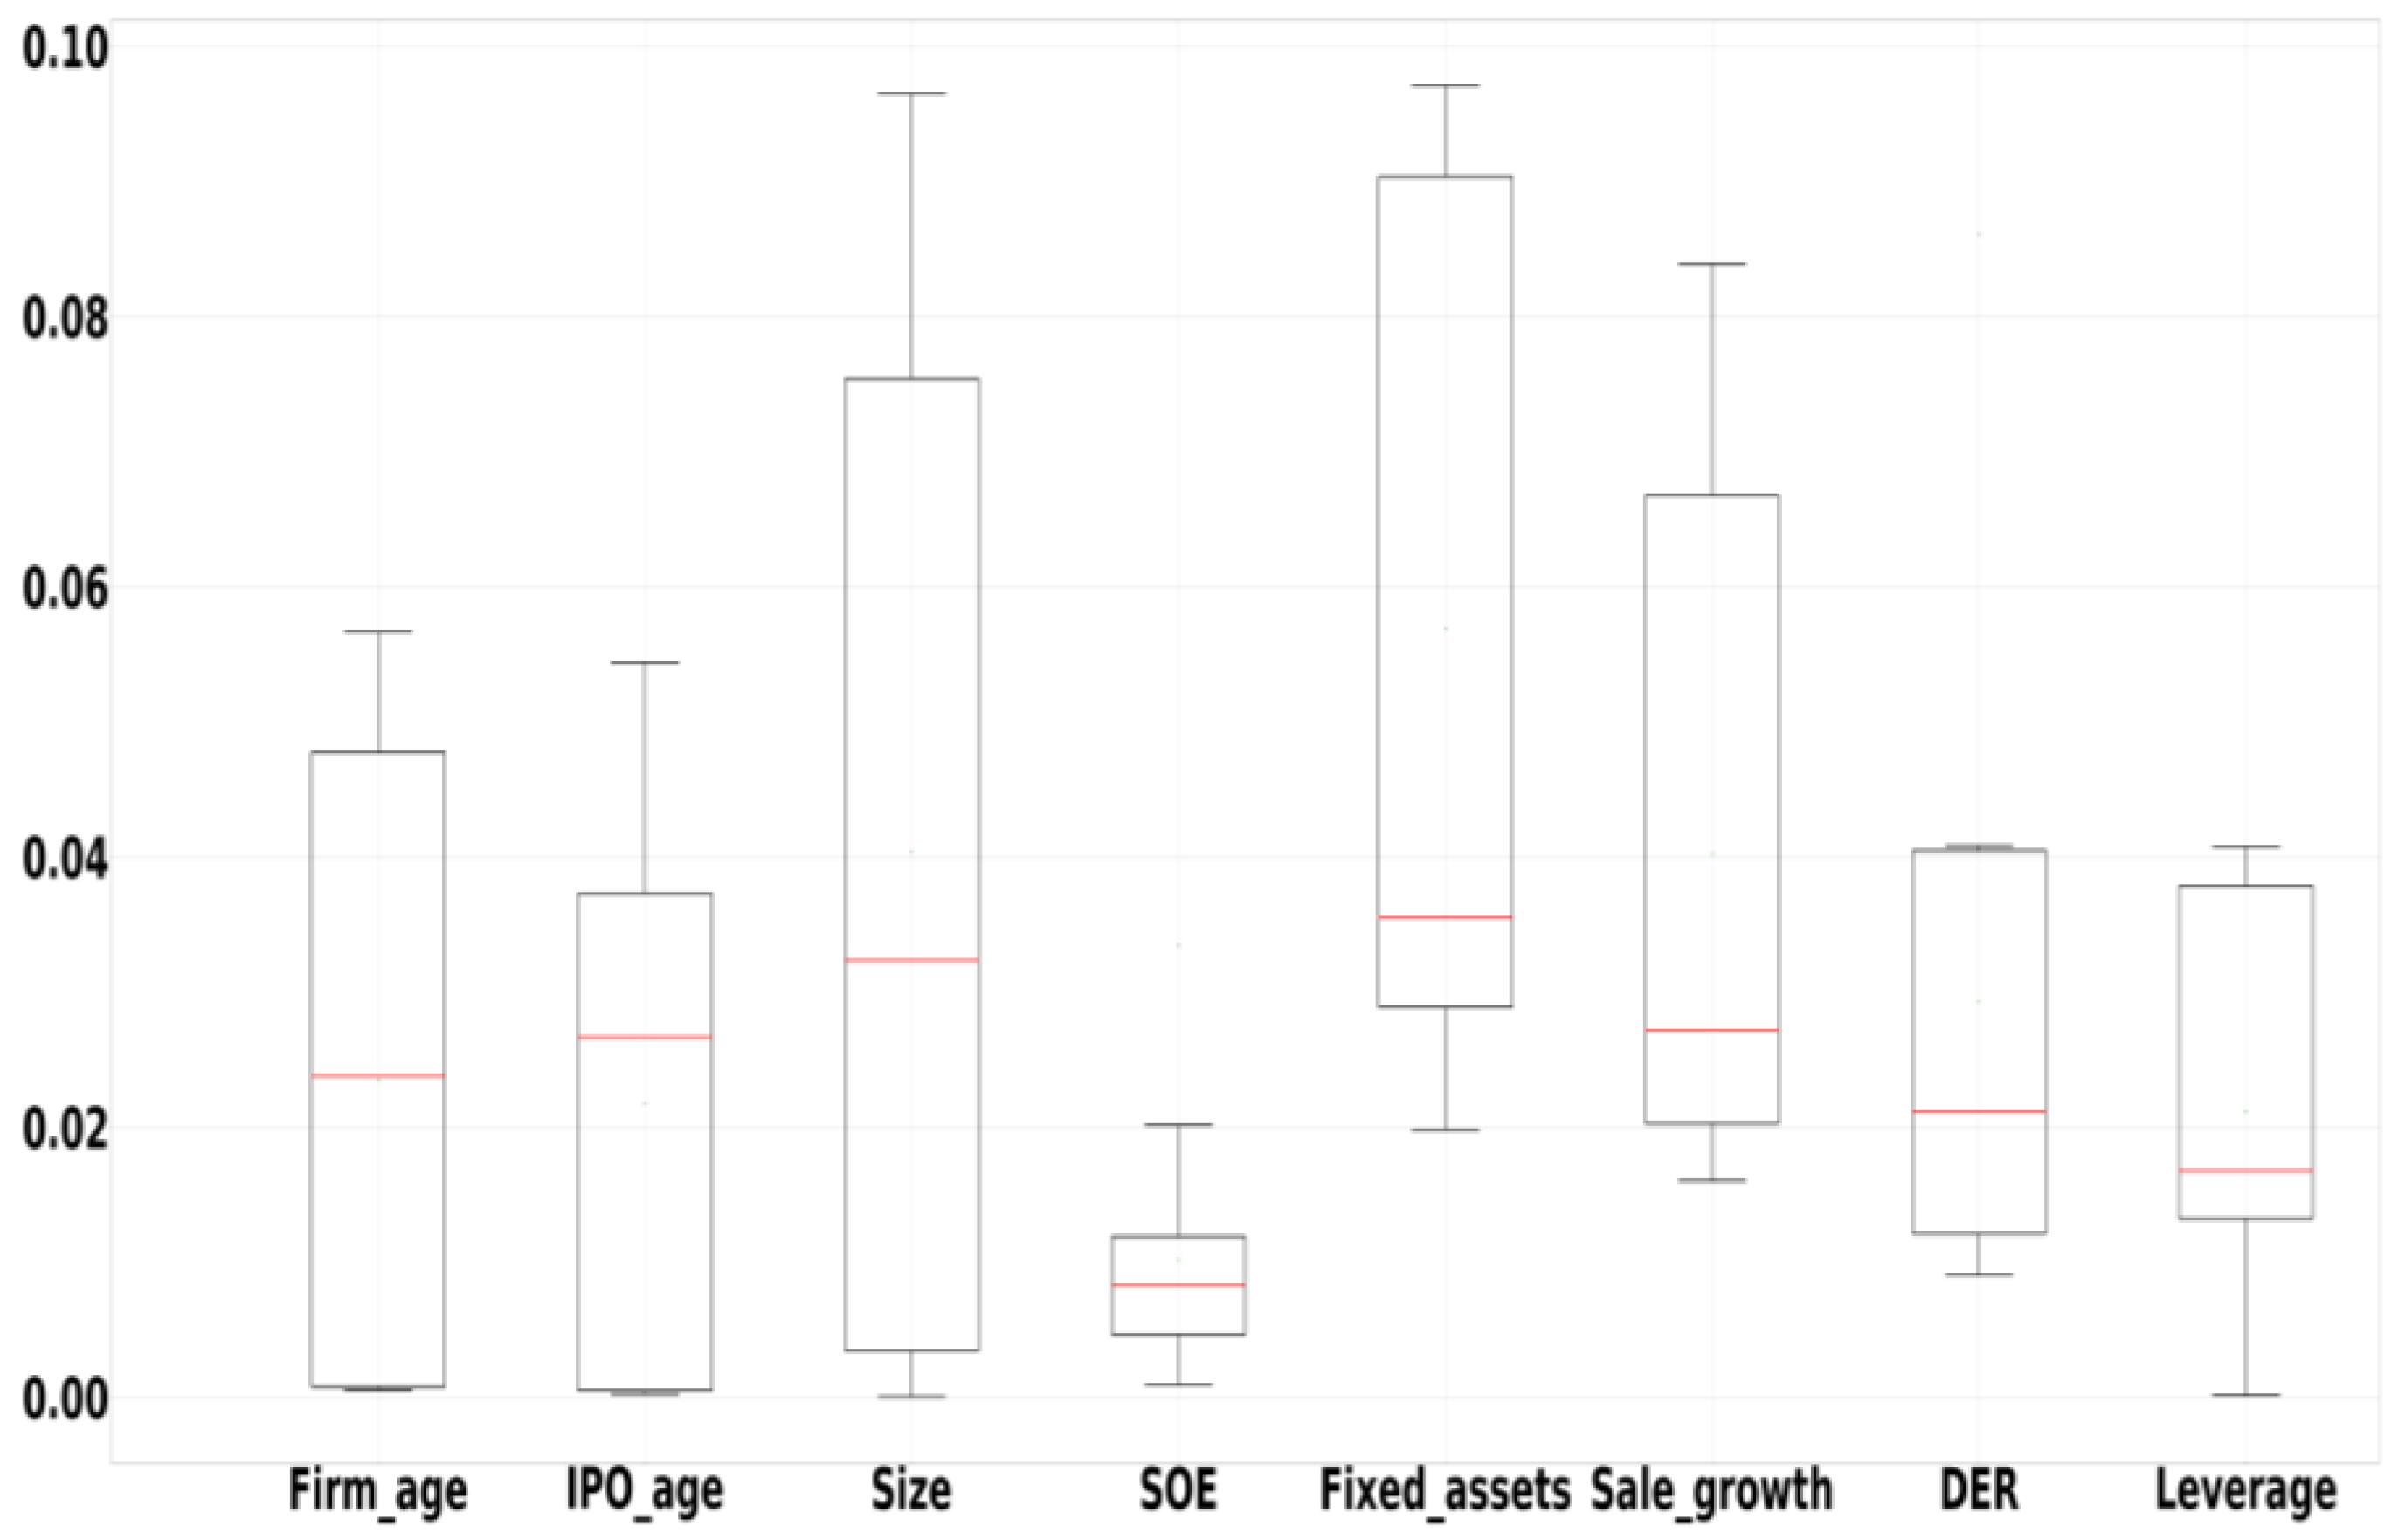
| Panel A: Relative importance of firm basic characteristics variables. | ||||||||||
| Variables | Linear Regression | Ridge | Lasso | Elastic Net | Bayesian Ridge | Extra Tree | Random Forest | XGBoost | Gradient Boost | LightGBM |
| Firm_age | 0.073 | 0.063 | 0.050 | 0.079 | 0.133 | 5.184 | 5.221 | 2.373 | 2.650 | 4.350 |
| IPO_age | 0.058 | 0.032 | 0.018 | 0.033 | 0.102 | 3.737 | 3.708 | 2.659 | 3.451 | 5.433 |
| Size | 0.482 | 0.020 | 0.000 | 0.230 | 0.452 | 7.186 | 7.253 | 3.227 | 9.641 | 7.815 |
| SOE | 1.090 | 0.958 | 0.821 | 1.279 | 2.009 | 0.476 | 0.447 | 3.344 | 0.088 | 0.177 |
| Fixed_assets | 1.975 | 2.677 | 2.523 | 3.491 | 3.087 | 9.005 | 9.051 | 3.542 | 8.073 | 9.705 |
| Sale_growth | 1.596 | 1.793 | 1.776 | 2.248 | 2.708 | 7.164 | 7.140 | 2.891 | 2.375 | 8.386 |
| DER | 0.899 | 1.034 | 1.064 | 1.351 | 1.865 | 4.078 | 4.020 | 3.107 | 2.108 | 8.602 |
| Leverage | 0.010 | 1.722 | 1.671 | 1.506 | 3.562 | 3.995 | 4.017 | 1.150 | 1.484 | 0.020 |
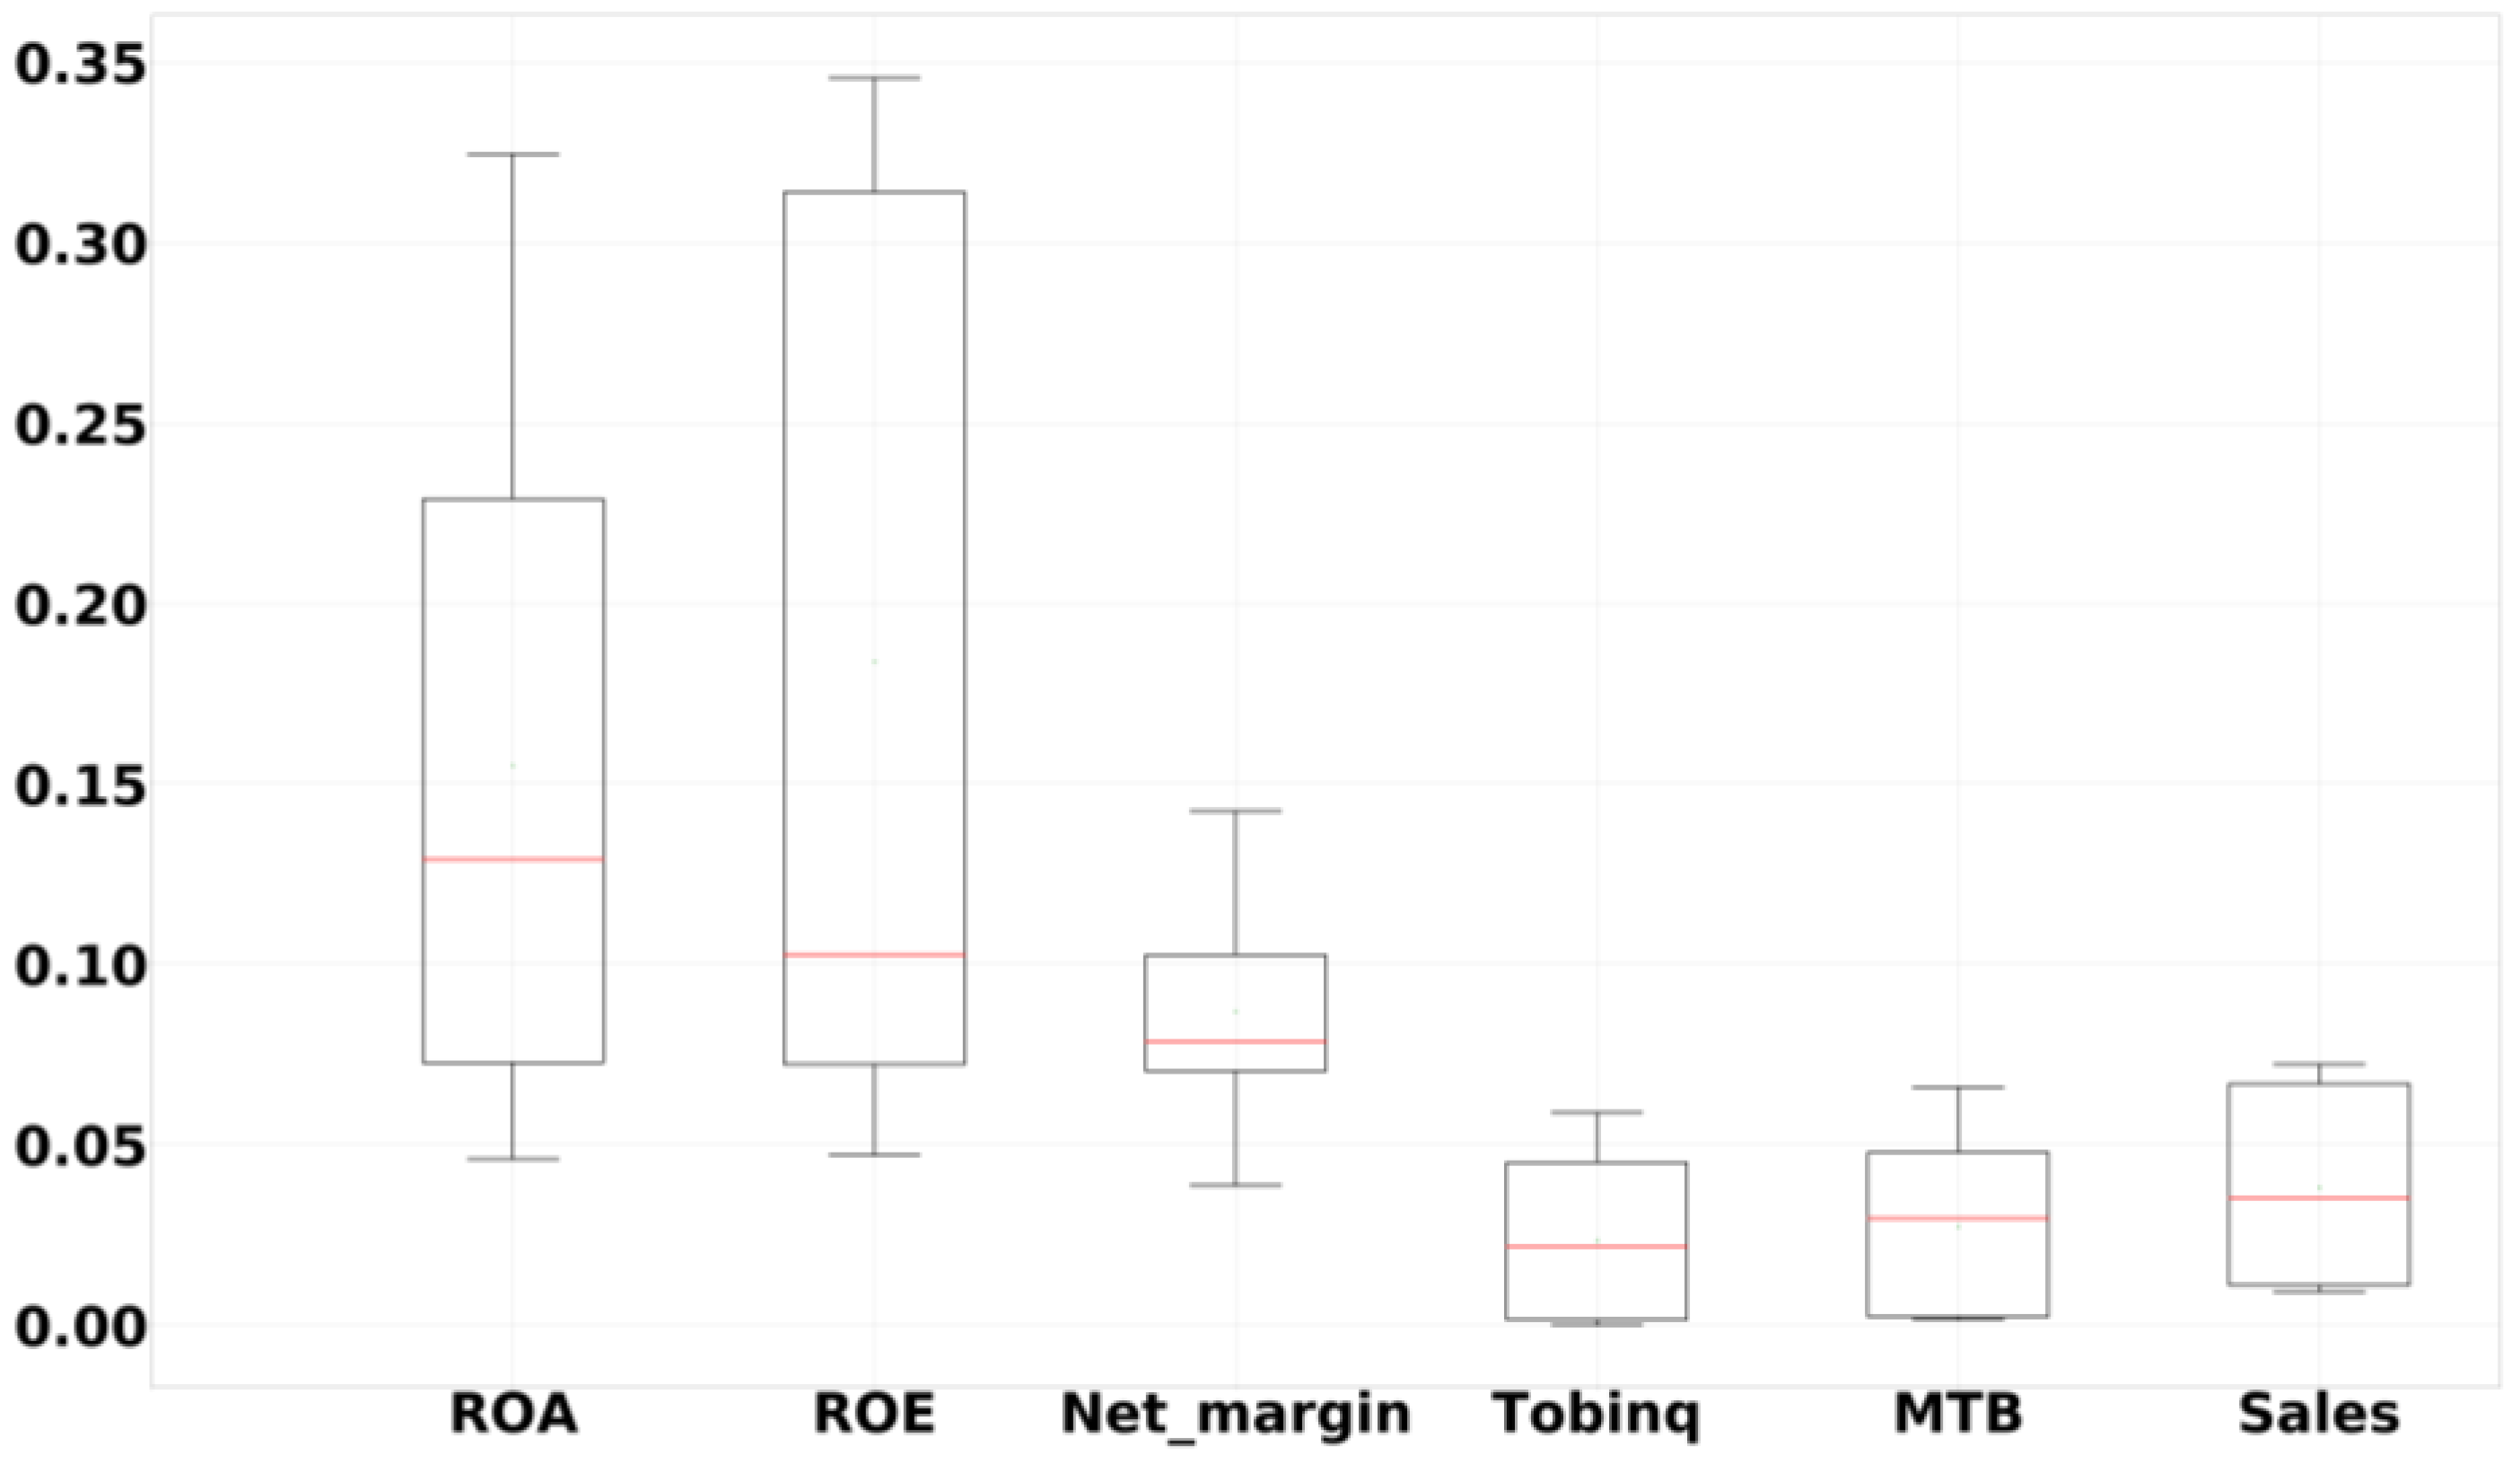
| Panel B: Relative importance of firm performance variables. | ||||||||||
| Variables | Linear Regression | Ridge | Lasso | Elastic Net | Bayesian Ridge | Extra Tree | Random Forest | XGBoost | Gradient Boost | LightGBM |
| ROA | 32.362 | 22.170 | 23.623 | 7.987 | 4.603 | 13.111 | 12.901 | 7.360 | 32.451 | 7.028 |
| ROE | 28.472 | 31.525 | 32.897 | 34.568 | 31.252 | 7.457 | 7.590 | 4.704 | 10.265 | 6.535 |
| Net_margin | 10.534 | 9.984 | 9.518 | 11.284 | 14.244 | 6.963 | 7.117 | 3.864 | 7.856 | 6.791 |
| Tobinq | 0.202 | 0.088 | 0.000 | 0.066 | 0.401 | 4.542 | 4.476 | 2.618 | 2.165 | 5.532 |
| MTB | 0.205 | 0.188 | 0.150 | 0.264 | 0.457 | 4.801 | 4.777 | 2.956 | 3.601 | 6.240 |
| Sales | 1.202 | 0.978 | 0.926 | 1.009 | 1.700 | 6.684 | 6.691 | 3.501 | 5.100 | 7.224 |
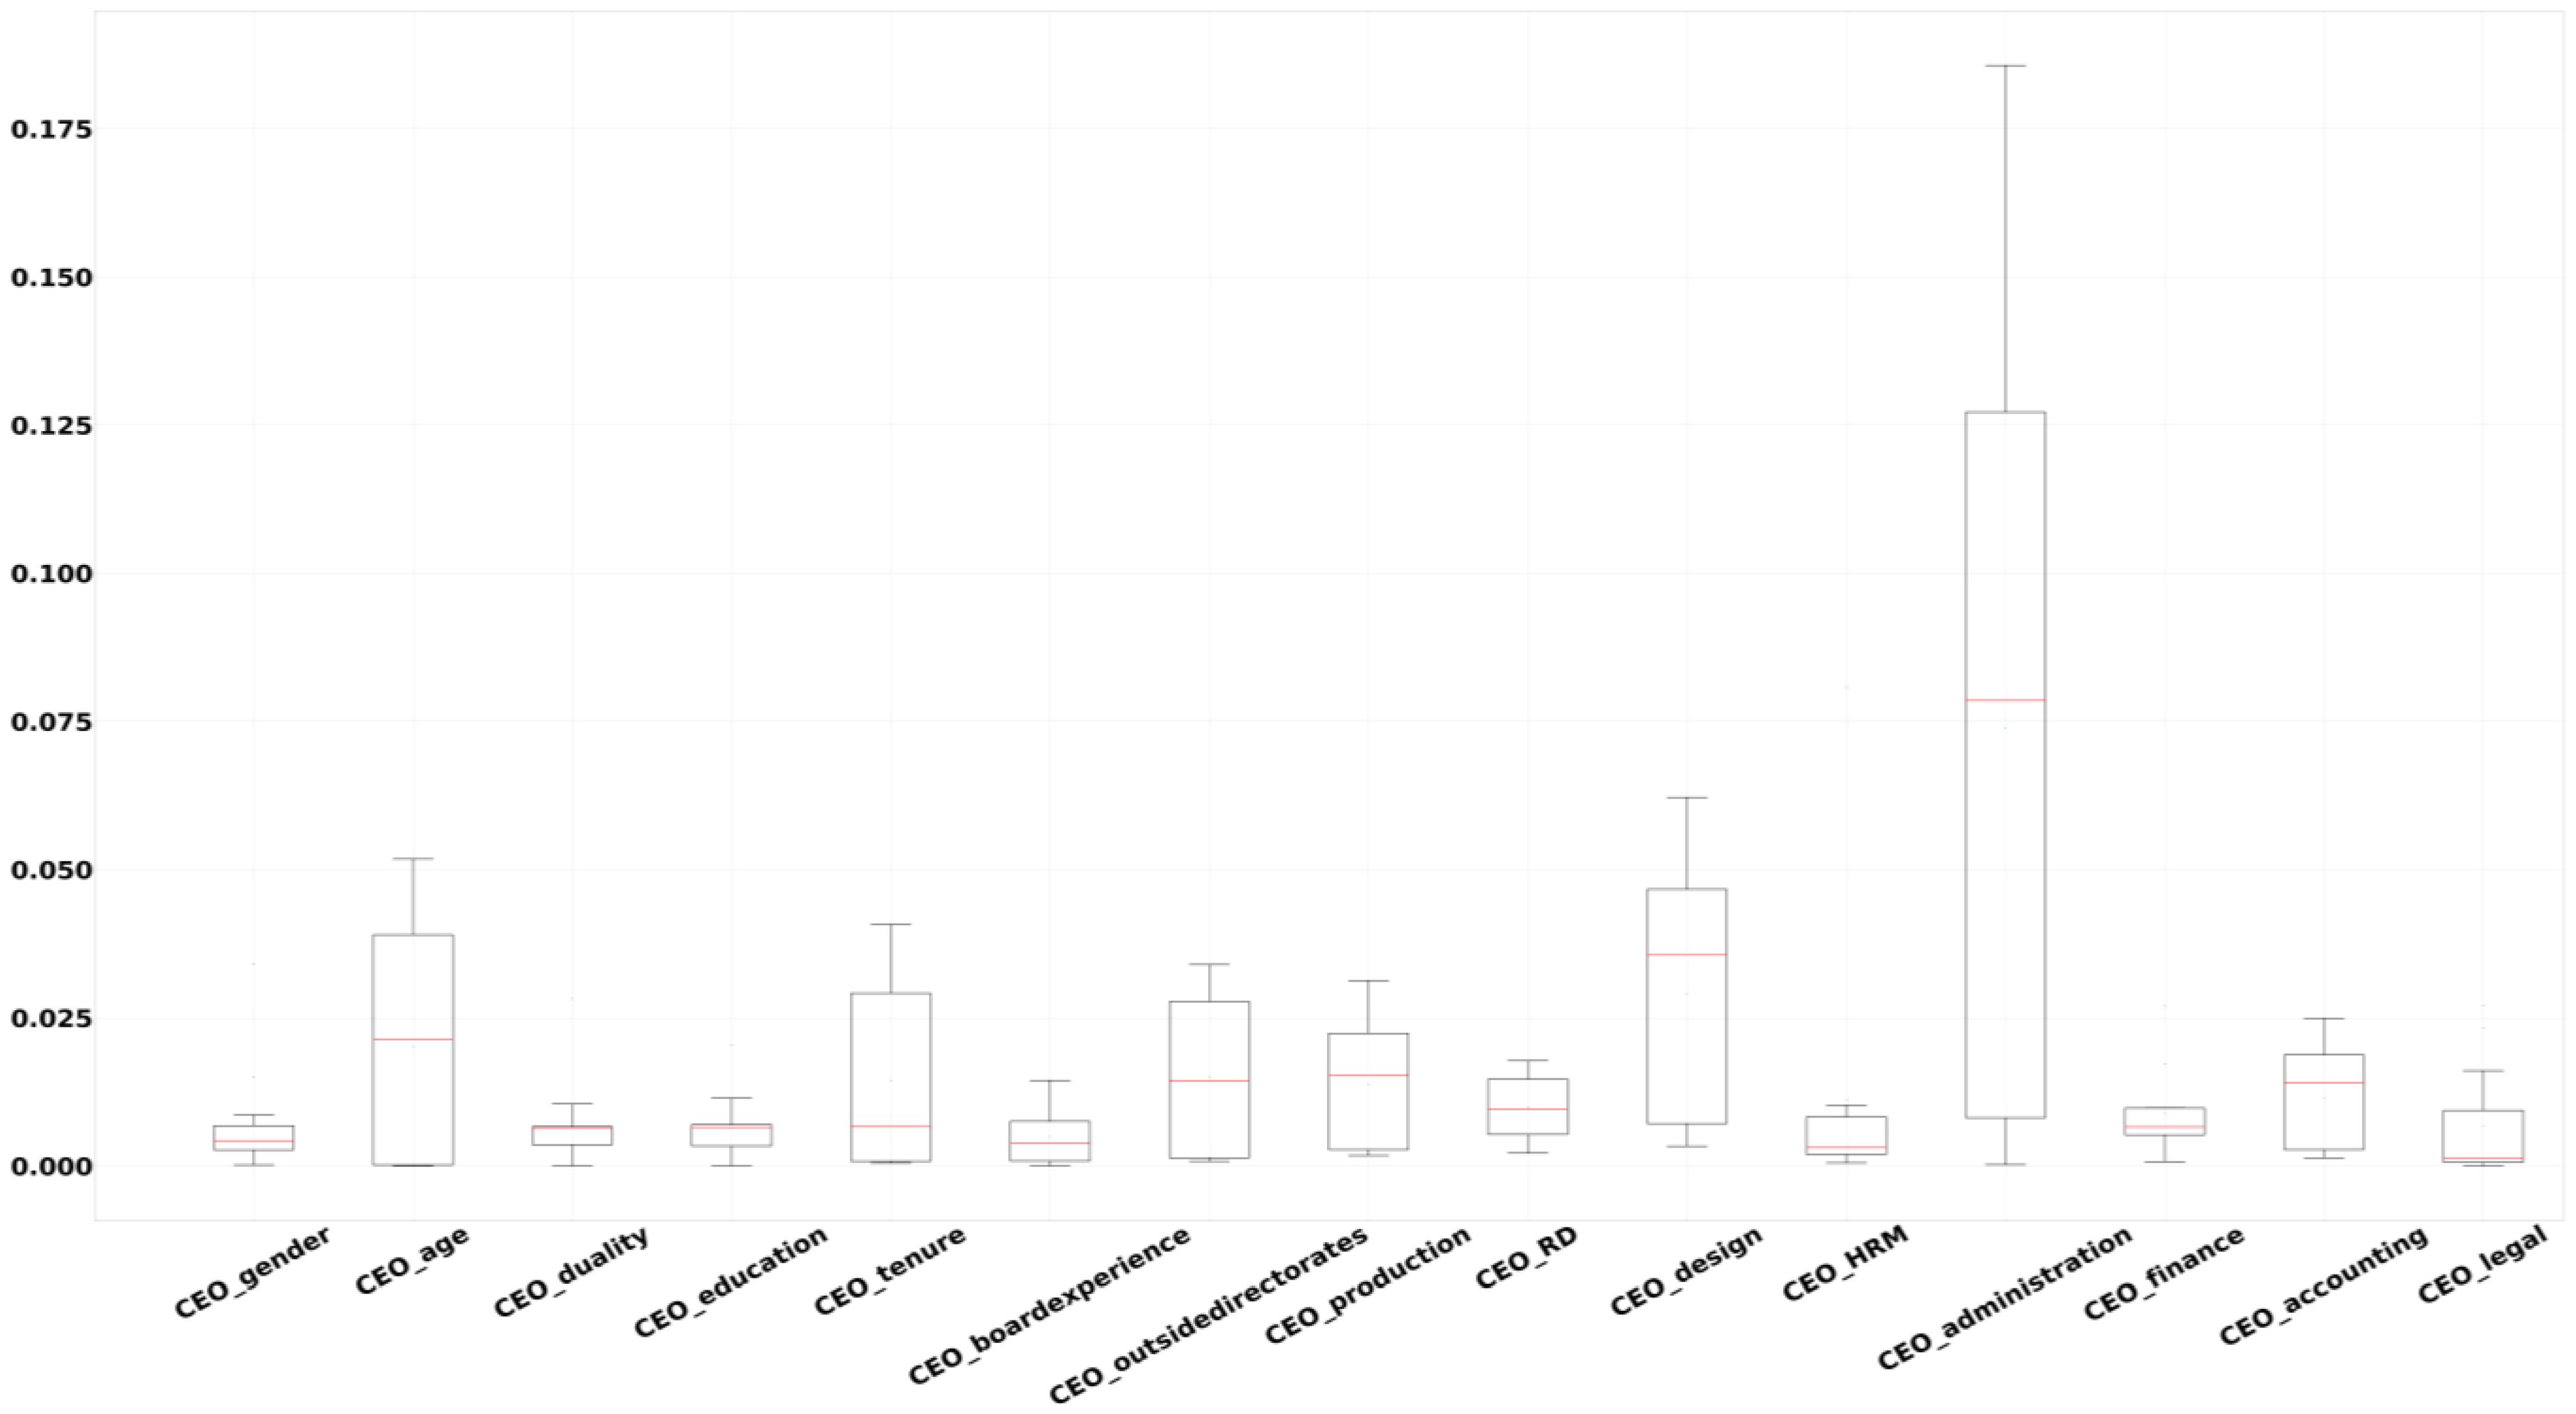
| Panel C: Relative importance of CEO characteristics variables. | ||||||||||
| Variables | Linear Regression | Ridge | Lasso | Elastic Net | Bayesian Ridge | Extra Tree | Random Forest | XGBoost | Gradient Boost | LightGBM |
| CEO_gender | 0.860 | 0.330 | 0.209 | 0.427 | 1.498 | 0.488 | 0.502 | 3.415 | 0.019 | 0.079 |
| CEO_age | 0.023 | 0.011 | 0.003 | 0.013 | 0.042 | 3.905 | 3.896 | 2.761 | 2.129 | 5.177 |
| CEO_duality | 0.380 | 0.334 | 0.218 | 0.383 | 0.651 | 0.665 | 0.657 | 2.822 | 0.000 | 1.043 |
| CEO_education | 0.361 | 0.310 | 0.251 | 0.402 | 0.672 | 0.659 | 0.654 | 2.036 | 0.000 | 1.142 |
| CEO_tenure | 0.076 | 0.062 | 0.052 | 0.085 | 0.142 | 2.898 | 2.927 | 1.860 | 0.660 | 4.075 |
| CEO_boardexperience | 0.781 | 0.580 | 0.380 | 0.722 | 1.446 | 0.119 | 0.109 | 1.309 | 0.000 | 0.000 |
| CEO_outsidedirectorates | 0.080 | 0.120 | 0.107 | 0.151 | 0.150 | 2.766 | 2.788 | 3.395 | 1.443 | 2.972 |
| CEO_production | 1.760 | 2.268 | 2.215 | 2.948 | 3.126 | 0.202 | 0.208 | 1.520 | 0.461 | 0.177 |
| CEO_RD | 0.959 | 1.287 | 1.237 | 1.640 | 1.682 | 0.511 | 0.499 | 1.775 | 0.214 | 0.551 |
| CEO_design | 3.556 | 4.276 | 4.178 | 5.538 | 6.220 | 0.641 | 0.644 | 5.058 | 0.831 | 0.335 |
| CEO_HRM | 0.162 | 0.266 | 0.052 | 0.307 | 0.230 | 1.025 | 0.980 | 8.073 | 0.498 | 0.079 |
| CEO_administration | 7.851 | 14.198 | 13.823 | 18.569 | 10.651 | 0.754 | 0.754 | 11.615 | 2.151 | 0.020 |
| CEO_finance | 0.979 | 0.743 | 0.656 | 0.970 | 1.722 | 0.530 | 0.525 | 2.701 | 0.075 | 0.335 |
| CEO_accounting | 1.404 | 1.715 | 1.581 | 2.181 | 2.493 | 0.315 | 0.310 | 2.033 | 0.135 | 0.177 |
| CEO_legal | 1.607 | 0.268 | 0.000 | 0.268 | 2.703 | 0.140 | 0.138 | 2.332 | 0.076 | 0.000 |
References
- Cucculelli, M.; Ermini, B. New product introduction and product tenure: What effects on firm growth? Res. Policy 2012, 41, 808–821. [Google Scholar] [CrossRef]
- Low, A. Managerial risk-taking behavior and equity-based compensation. J. Financ. Econ. 2009, 92, 470–490. [Google Scholar] [CrossRef]
- Jiraporn, P.; Chatjuthamard, P.; Tong, S.; Kim, Y.S. Does corporate governance influence corporate risk-taking? Evidence from the Institutional Shareholders Services (ISS). Financ. Res. Lett. 2015, 13, 105–112. [Google Scholar] [CrossRef]
- Kini, O.; Williams, R. Tournament incentives, firm risk, and corporate policies. J. Financ. Econ. 2012, 103, 350–376. [Google Scholar] [CrossRef]
- Boubakri, N.; Cosset, J.C.; Saffar, W. The role of state and foreign owners in corporate risk-taking: Evidence from privatization. J. Financ. Econ. 2013, 108, 641–658. [Google Scholar] [CrossRef]
- Zhu, W.; Yang, J. State ownership, cross-border acquisition, and risk-taking: Evidence from China’s banking industry. J. Bank Financ. 2016, 71, 133–153. [Google Scholar] [CrossRef]
- Cho, E.; Okafor, C.; Ujah, N.; Zhang, L. Executives’ gender-diversity, education, and firm’s bankruptcy risk: Evidence from China. J. Behav. Exp. Financ. 2021, 30, 100500. [Google Scholar] [CrossRef]
- Faccio, M.; Marchica, M.T.; Mura, R. CEO gender, corporate risk-taking, and the efficiency of capital allocation. J. Corp. Financ. 2016, 39, 193–209. [Google Scholar] [CrossRef]
- Ho, P.H.; Huang, C.W.; Lin, C.Y.; Yen, J.F. CEO overconfidence and financial crisis: Evidence from bank lending and leverage. J. Financ. Econ. 2016, 120, 194–209. [Google Scholar] [CrossRef]
- Lee, J.Y.; Ha, Y.J.; Wei, Y.; Sarala, R.M. CEO Narcissism and Global Performance Variance in Multinational Enterprises: The Roles of Foreign Direct Investment Risk-Taking and Business Group Affiliation. BRIT J. Manag. 2023, 34, 512–535. [Google Scholar] [CrossRef]
- Acharya, V.V.; Amihud, Y.; Litov, L. Creditor rights and corporate risk-taking. J. Financ. Econ. 2011, 102, 150–166. [Google Scholar] [CrossRef]
- John, K.; Litov, L.; Yeung, B. Corporate governance and risk-taking. J. Financ. 2008, 63, 1679–1728. [Google Scholar] [CrossRef]
- Beltratti, A.; Stulz, R.M. The credit crisis around the globe: Why did some banks perform better? J. Financ. Econ. 2012, 105, 1–17. [Google Scholar] [CrossRef]
- Lee, E.J.; Chae, J.; Lee, Y.K. Family ownership and risk taking. Financ. Res. Lett. 2018, 25, 69–75. [Google Scholar] [CrossRef]
- Adams, R.B.; Funk, P. Beyond the glass ceiling: Does gender matter? Manag. Sci. 2012, 58, 219–235. [Google Scholar] [CrossRef]
- Sah, N.B. Cash is queen: Female CEOs’ propensity to hoard cash. J. Behav. Exp. Financ. 2021, 29, 100412. [Google Scholar] [CrossRef]
- Bhagat, S.; Bolton, B.; Lu, J. Size, leverage, and risk-taking of financial institutions. J. Bank Financ. 2015, 59, 520–537. [Google Scholar] [CrossRef]
- Fan, Y.; Boateng, A.; Ly, K.C.; Jiang, Y. Are bonds blind? Board-CEO social networks and firm risk. J. Corp. Financ. 2021, 68, 101922. [Google Scholar] [CrossRef]
- Shrestha, Y.R.; He, V.F.; Puranam, P.; von Krogh, G. Algorithm supported induction for building theory: How can we use prediction models to theorize? Organ Sci. 2021, 32, 856–880. [Google Scholar] [CrossRef]
- Erel, I.; Stern, L.H.; Tan, C.; Weisbach, M.S. Selecting directors using machine learning. Rev. Financ. Stud. 2021, 34, 3226–3264. [Google Scholar] [CrossRef]
- Zheng, S.; He, C.; Hsu, S.C.; Sarkis, J.; Chen, J.H. Corporate environmental performance prediction in China: An empirical study of energy service companies. J. Clean. Prod. 2020, 266, 121395. [Google Scholar] [CrossRef]
- Ingersoll, A.R.; Cook, A.; Glass, C. A free solo in heels: Corporate risk taking among women executives and directors. J. Bus. Res. 2023, 157, 113651. [Google Scholar] [CrossRef]
- Shahzad, F.; Lu, J.; Fareed, Z. Does firm life cycle impact corporate risk taking and performance? J. Multinatl. Financ. Manag. 2019, 51, 23–44. [Google Scholar] [CrossRef]
- Leippold, M.; Wang, Q.; Zhou, W. Machine learning in the Chinese stock market. J. Financ. Econ. 2022, 145, 64–82. [Google Scholar] [CrossRef]
- Kim, H.S.; Sohn, S.Y. Support vector machines for default prediction of SMEs based on technology credit. Eur. J. Oper. Res. 2010, 201, 838–846. [Google Scholar] [CrossRef]
- Chen, Y.; Huang, S. CEO Reputation and Corporate Risk-Taking: Managerial Competence or Managerial Defence? Emerg. Mark. Financ. Trade 2023, 1–26. [Google Scholar] [CrossRef]
- Dong, Y.; Meng, C.; Firth, M.; Hou, W. Ownership structure and risk-taking: Comparative evidence from private and state-controlled banks in China. Int. Rev. Financ. Anal. 2014, 36, 120–130. [Google Scholar] [CrossRef]
- Faccio, M.; Marchica, M.T.; Mura, R. Large shareholder diversification and corporate risk-taking. Rev. Financ. Stud. 2011, 24, 3601–3641. [Google Scholar] [CrossRef]
- Kim, K.; Patro, S.; Pereira, R. Option incentives, leverage, and risk-taking. J. Corp. Financ. 2017, 43, 1–18. [Google Scholar] [CrossRef]
- Khaw, K.L.H.; Liao, J.; Tripe, D.; Wongchoti, U. Gender diversity, state control, and corporate risk-taking: Evidence from China. Pac.-Basin Financ. J. 2016, 39, 141–158. [Google Scholar] [CrossRef]
- Tsai, H.F.; Fang, S.C. Risk–return paradox? The moderating effects of risk-taking capabilities. Manag. Decis. 2023, in press. [CrossRef]
- Do, T.; Zhang, H.; Zuo, L. Rocking the boat: How relative performance evaluation affects corporate risk taking. J. Account. Econ. 2022, 73, 101425. [Google Scholar] [CrossRef]
- Gormley, T.A.; Matsa, D.A. Playing it safe? Managerial preferences, risk, and agency conflicts. J. Financ. Econ. 2016, 122, 431–455. [Google Scholar] [CrossRef]
- Trabert, S. Do younger CEOs really increase firm risk? Evidence from sudden CEO deaths. J. Corp. Financ. 2023, 79, 102367. [Google Scholar] [CrossRef]
- Farag, H.; Mallin, C. The influence of CEO demographic characteristics on corporate risk-taking: Evidence from Chinese IPOs. Eur. J. Financ. 2018, 24, 1528–1551. [Google Scholar] [CrossRef]
- Serfling, M.A. CEO age and the riskiness of corporate policies. J. Corp. Financ. 2014, 25, 251–273. [Google Scholar] [CrossRef]
- Doan, T.; Iskandar-Datta, M. Are female top executives more risk-averse or more ethical? Evidence from corporate cash holdings policy. J. Empir. Financ. 2020, 55, 161–176. [Google Scholar] [CrossRef]
- Sila, V.; Gonzalez, A.; Hagendorff, J. Women on board: Does boardroom gender diversity affect firm risk? J. Corp. Financ. 2016, 36, 26–53. [Google Scholar] [CrossRef]
- Safiullah, M.; Akhter, T.; Saona, P.; Azad, M.A.K. Gender diversity on corporate boards, firm performance, and risk-taking: New evidence from Spain. J. Behav. Exp. Financ. 2022, 35, 100721. [Google Scholar] [CrossRef]
- Li, J.; Tang, Y.I. CEO hubris and firm risk taking in China: The moderating role of managerial discretion. Acad. Manag. J. 2010, 53, 45–68. [Google Scholar] [CrossRef]
- Altunbaş, Y.; Thornton, J.; Uymaz, Y. The effect of CEO power on bank risk: Do boards and institutional investors matter? Financ. Res. Lett. 2020, 33, 101202. [Google Scholar] [CrossRef]
- Sun, Z.; Anderson, H.; Chi, J. Managerial foreign experience and corporate risk-taking: Evidence from China. Int. Rev. Financ. Anal. 2023, 86, 102525. [Google Scholar] [CrossRef]
- Dbouk, W.; Fang, Y.; Liu, L.; Wang, H. Do social networks encourage risk-taking? Evidence from bank CEOs. J. Financ. Stab. 2020, 46, 100708. [Google Scholar] [CrossRef]
- Ferris, S.P.; Javakhadze, D.; Rajkovic, T. CEO social capital, risk-taking and corporate policies. J. Corp. Financ. 2017, 47, 46–71. [Google Scholar] [CrossRef]
- Jiang, J.; Chen, Y. How does labor protection influence corporate risk-taking? Evidence from China. Pac.-Basin Financ. J. 2021, 68, 101572. [Google Scholar] [CrossRef]
- Wu, J.; Zhang, Z.; Zhou, S.X. Credit rating prediction through supply chains: A machine learning approach. Prod. Oper. Manag. 2022, 31, 1613–1629. [Google Scholar] [CrossRef]
- Nguyen, P. Corporate governance and risk-taking: Evidence from Japanese firms. Pac.-Basin Financ. J. 2011, 19, 278–297. [Google Scholar] [CrossRef]
- Panta, H. Does social capital influence corporate risk-taking? J. Behav. Exp. Financ. 2020, 26, 100301. [Google Scholar] [CrossRef]
- Lewellyn, K.B.; Muller-Kahle, M.I. CEO power and risk taking: Evidence from the subprime lending industry. Corp. Gov. 2012, 20, 289–307. [Google Scholar] [CrossRef]
- Lundberg, S.M.; Lee, S.I. A unified approach to interpreting model predictions. In Advances in Neural Information Processing Systems; MIT Press: Cambridge, MA, USA, 2017; pp. 4765–4774. [Google Scholar]
- Li, J.; Liao, Z.; Quaedvlieg, R. Conditional superior predictive ability. Rev. Econ. Stud. 2022, 89, 843–875. [Google Scholar] [CrossRef]
- Freund, Y.; Schapire, R.E. A decision-theoretic generalization of on-line learning and an application to boosting. J. Comput. Syst. Sci. 1997, 55, 119–139. [Google Scholar] [CrossRef]
- Schapire, R.E. Explaining AdaBoost. In Empirical Inference; Schölkopf, B., Luo, Z., Vovk, V., Eds.; Springer: Berlin/Heidelberg, Germany, 2013; pp. 37–52. [Google Scholar] [CrossRef]
- Chang, S.J. Venture capital financing, strategic alliances, and the initial public offerings of Internet startups. J. Bus. Ventur. 2004, 19, 721–741. [Google Scholar] [CrossRef]
- Wang, Y.; Poutziouris, P. Entrepreneurial risk taking: Empirical evidence from UK family firms. Int. J. Entrep. Behav. Res. 2010, 16, 370–388. [Google Scholar] [CrossRef]
- Frijns, B.; Hubers, F.; Kim, D.; Roh, T.Y.; Xu, Y. National culture and corporate risk-taking around the world. Glob. Financ. J. 2022, 52, 100710. [Google Scholar] [CrossRef]


| Model | Total Sample | Small Enterprises | Large Enterprises |
|---|---|---|---|
| LinearRegression | 6.5826 | 3.4296 | 5.0433 |
| Ridge | 6.4993 | 3.7123 | 5.2760 |
| Lasso | 6.5198 | 3.9324 | 5.0868 |
| ElasticNet | 6.3337 | 3.7324 | 5.3546 |
| BayesianRidge | 6.3589 | 3.4596 | 5.5579 |
| ExtraTree | 19.2507 | 10.0737 | 17.8735 |
| RandomForest | 19.2699 | 10.3005 | 17.5704 |
| XGBoost | 13.8818 | −0.1823 | 7.1658 |
| AdaBoost | 13.7653 | 17.7049 | 13.2793 |
| GradientBoost | 14.3386 | 12.6980 | 11.1379 |
| LightGBM | 17.3584 | 12.5887 | 18.4043 |
| Model | One-Versus-One CSPA Tests | ||||||||||||
|---|---|---|---|---|---|---|---|---|---|---|---|---|---|
| Total | (1) | (2) | (3) | (4) | (5) | (6) | (7) | (8) | (9) | (10) | (11) | ||
| (1) | LinearRegression | 5 * | R | R | R | R | R | ||||||
| (2) | Ridge | 6 * | R | R | R | R | R | R | |||||
| (3) | Lasso | 6 * | R | R | R | R | R | R | |||||
| (4) | ElasticNet | 8 * | R | R | R | R | R | R | R | R | |||
| (5) | BayesianRidge | 9 * | R | R | R | R | R | R | R | R | R | ||
| (6) | ExtraTree | 1 * | R | ||||||||||
| (7) | RandomForest | 2 * | R | R | |||||||||
| (8) | XGBoost | 4 * | R | R | R | R | |||||||
| (9) | AdaBoost | 0 | |||||||||||
| (10) | GradientBoost | 1 * | R | ||||||||||
| (11) | LightGBM | 1 * | R | ||||||||||
| Model | Feature | R2 |
|---|---|---|
| AdaBoost | Firm basic characteristics only | 0.4471 |
| Firm performance only | 10.8095 | |
| CEO characteristics only | −273.4586 | |
| Firm basic characteristics plus CEO characteristics | 3.5707 | |
| Firm performance plus CEO characteristics | 9.5419 | |
| Firm basic characteristics plus firm performance | 12.2544 | |
| Firm performance plus firm performance characteristics plus CEO characteristics | 13.1284 |
| Firm Basic Characteristics | R2 | CEO Characteristics | R2 |
|---|---|---|---|
| Fixed_assets | 9.4461 | CEO_age | 4.3035 |
| Size | 8.1247 | CEO_tenure | 3.0405 |
| Sale_growth | 6.1957 | CEO_outsidedirectorates | 2.6666 |
| Firm_age | 5.6597 | CEO_administration | 0.8726 |
| IPO_age | 4.6782 | CEO_design | 0.7835 |
| Leverage | 4.0704 | CEO_education | 0.7217 |
| DER | 4.0615 | CEO_HRM | 0.6788 |
| SOE | 0.5048 | CEO_RD | 0.6556 |
| Firm Performance | R2 | CEO_duality | 0.6286 |
| Net_margin | 7.6391 | CEO_finance | 0.5219 |
| ROA | 7.1779 | CEO_gender | 0.4150 |
| ROE | 7.0045 | CEO_production | 0.3391 |
| Sales | 6.9890 | CEO_accounting | 0.2377 |
| MTB | 6.5973 | CEO_boardexperience | 0.0598 |
| Tobinq | 5.8831 | CEO_legal | 0.0429 |
| Total Sample | Category | Effect |
|---|---|---|
| Fixed_assets | Firm basic characteristics | Positive |
| Size | Firm basic characteristics | Negative |
| ROE | Firm performance | Negative |
| ROA | Firm performance | Negative |
| Firm_age | Firm basic characteristics | Negative |
| Sales | Firm performance | Negative |
| MTB | Firm performance | Negative |
| Sale_growth | Firm basic characteristics | Positive |
| Net_margin | Firm performance | Negative |
| DER | Firm basic characteristics | Positive |
| Small enterprises | Category | Effect |
| Fixed_assets | Firm basic characteristics | Positive |
| ROA | Firm performance | Negative |
| IPO_age | Firm basic characteristics | Positive |
| Size | Firm basic characteristics | Negative |
| MTB | Firm performance | Negative |
| ROE | Firm performance | Negative |
| Sales | Firm performance | Negative |
| Leverage | Firm basic characteristics | Positive |
| Net_margin | Firm performance | Positive |
| Sale_growth | Firm basic characteristics | Positive |
| Large enterprises | Category | Effect |
| ROE | Firm performance | Negative |
| Firm_age | Firm basic characteristics | Negative |
| Fixed_assets | Firm basic characteristics | Negative |
| Sales | Firm performance | Negative |
| Net_margin | Firm performance | Negative |
| Size | Firm basic characteristics | Negative |
| ROA | Firm performance | Negative |
| IPO_age | Firm basic characteristics | Negative |
| Leverage | Firm basic characteristics | Positive |
| Sale_growth | Firm basic characteristics | Positive |
| Total Sample | Category | SHAP Value | Effects | Sign |
|---|---|---|---|---|
| Fixed_assets | Firm basic characteristics | 1.0553 | 0.3130 | Positive |
| Size | Firm basic characteristics | 1.0076 | −0.7559 | Negative |
| ROE | Firm performance | 0.9919 | −0.4278 | Negative |
| ROA | Firm performance | 0.8996 | −0.4496 | Negative |
| Firm_age | Firm basic characteristics | 0.8583 | −0.6920 | Negative |
| Sales | Firm performance | 0.6254 | −0.5165 | Negative |
| Sale_growth | Firm basic characteristics | 0.5989 | 0.4305 | Positive |
| Net_margin | Firm performance | 0.5852 | −0.2070 | Negative |
| MTB | Firm performance | 0.5302 | −0.3582 | Negative |
| Leverage | Firm basic characteristics | 0.4827 | 0.7540 | Positive |
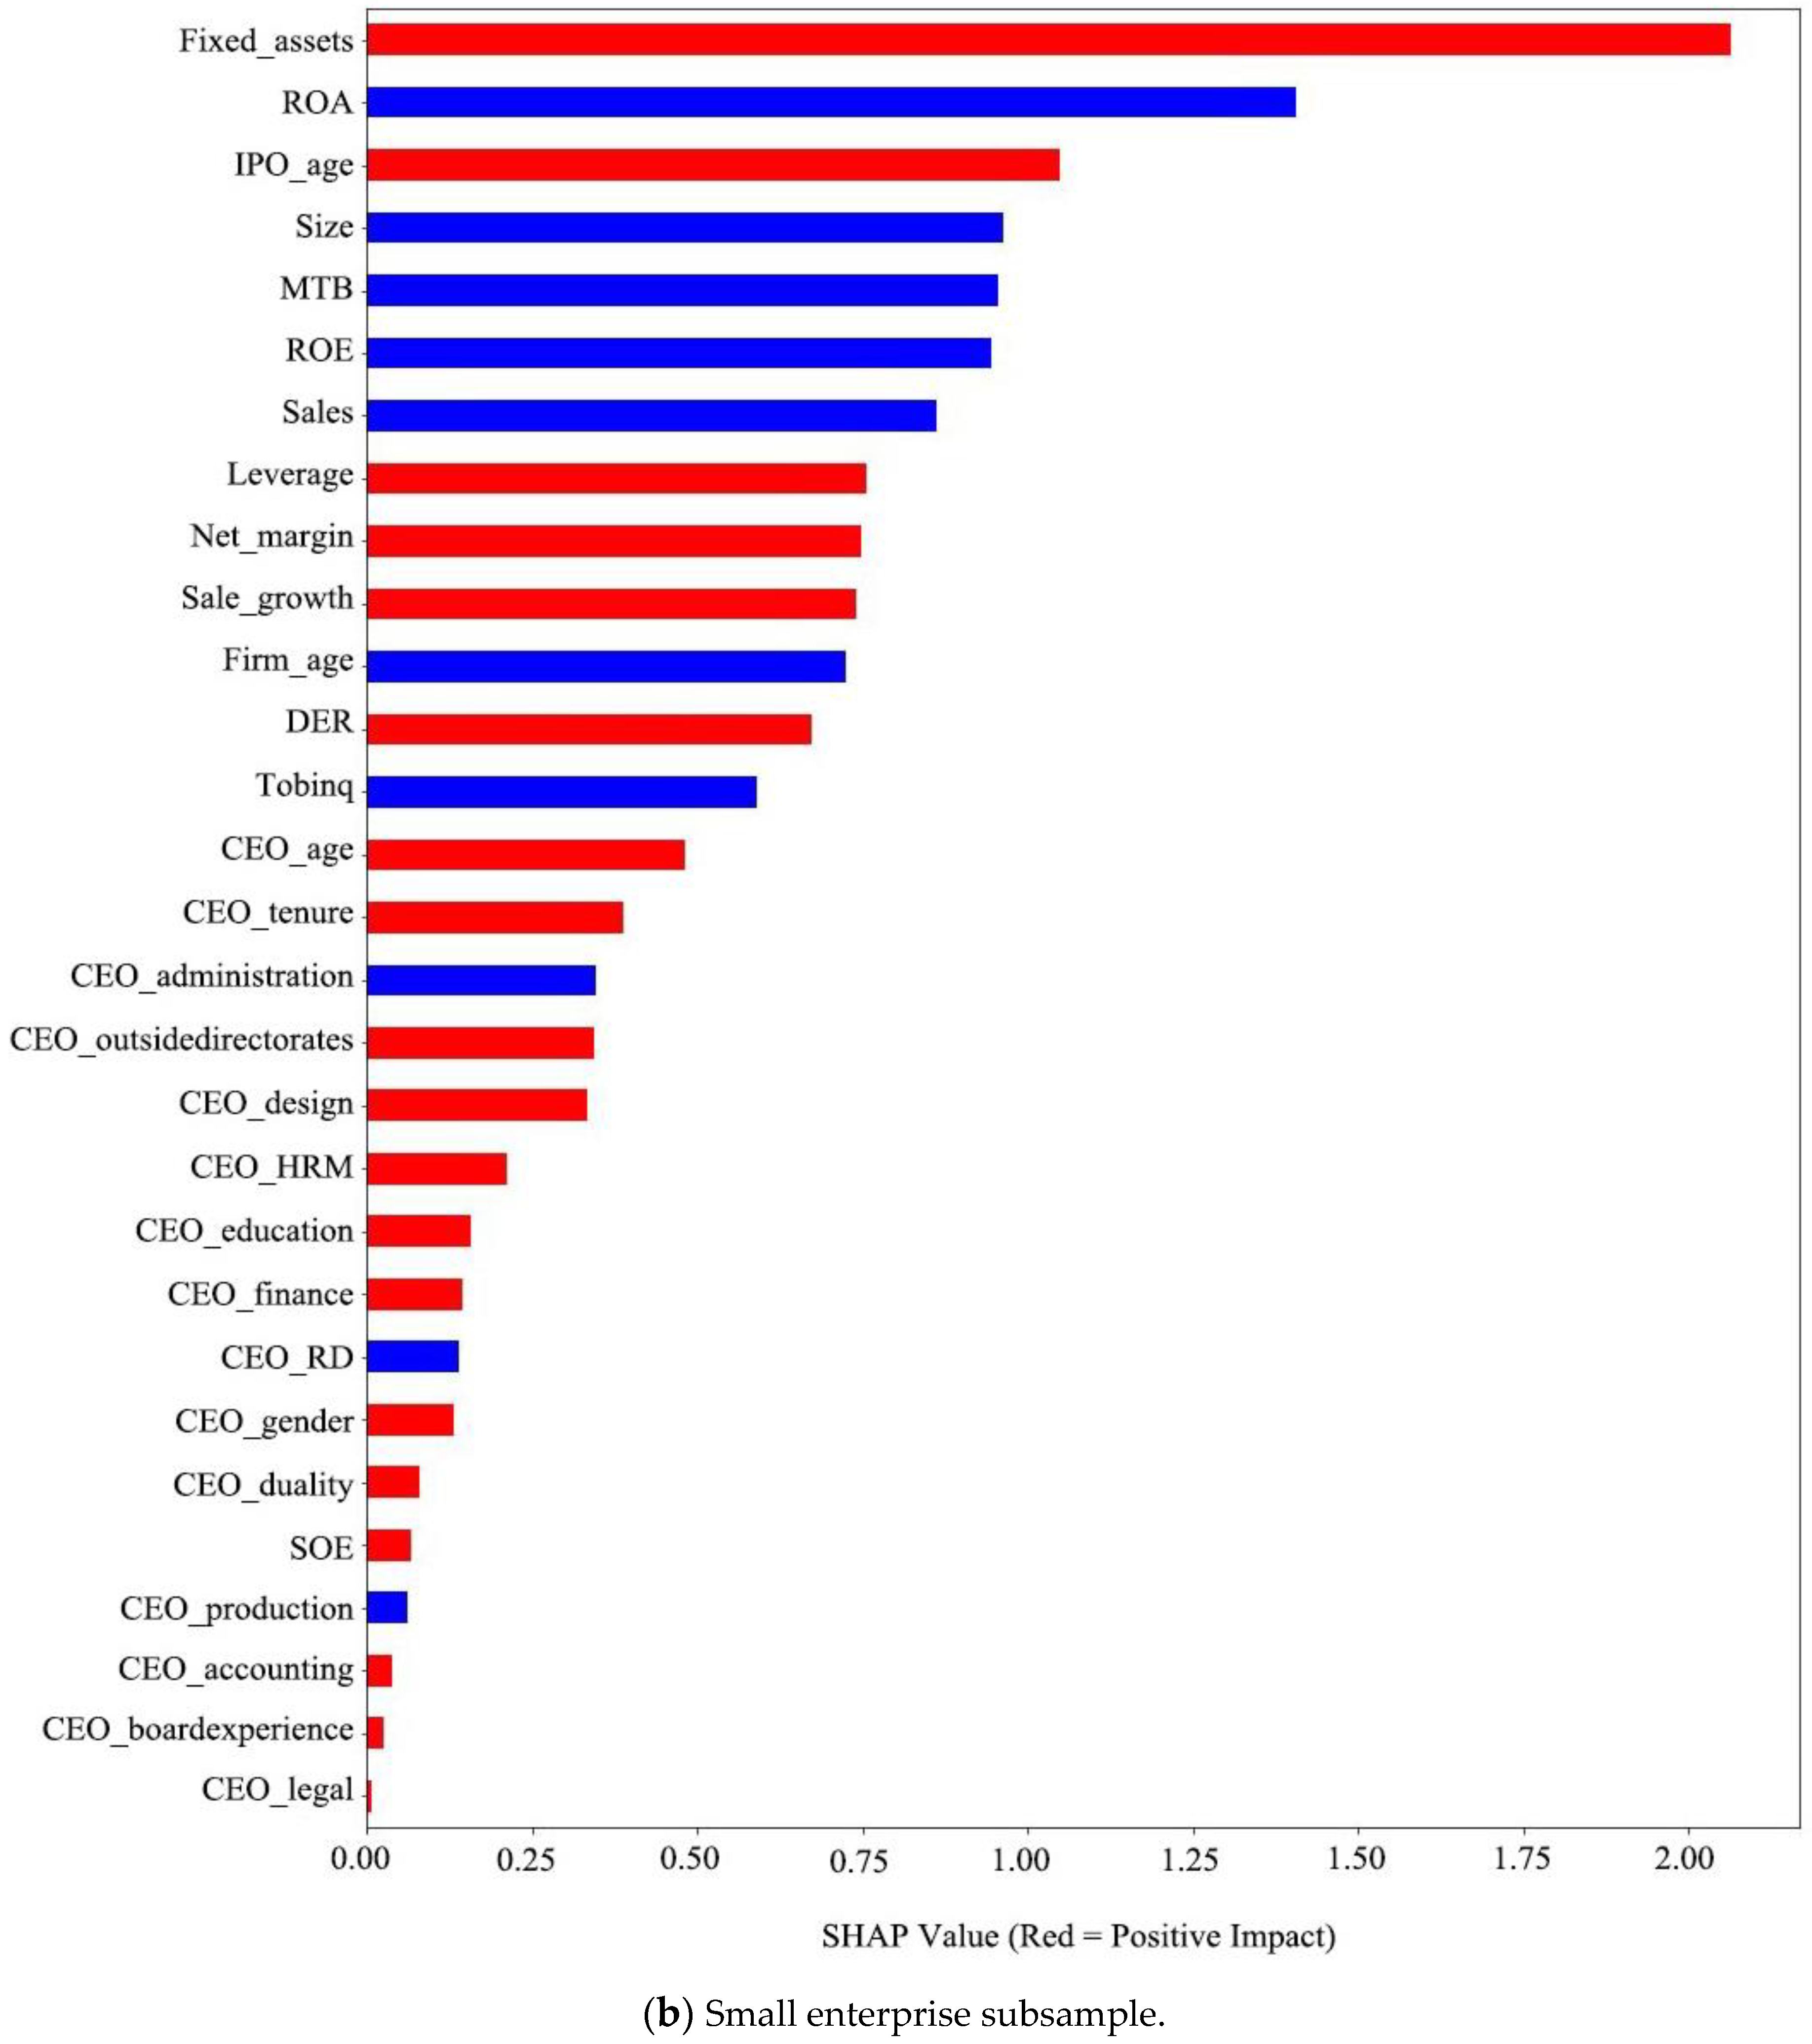
| Small enterprises | Category | SHAP value | Effects | Sign |
| Fixed_assets | Firm basic characteristics | 1.9806 | 0.3480 | Positive |
| ROA | Firm performance | 1.3139 | −0.2492 | Negative |
| ROE | Firm performance | 0.9385 | −0.7008 | Negative |
| Size | Firm basic characteristics | 0.9341 | −0.7123 | Negative |
| IPO_age | Firm basic characteristics | 0.9220 | 0.8805 | Positive |
| MTB | Firm performance | 0.8456 | −0.7019 | Negative |
| Sales | Firm performance | 0.8190 | −0.3223 | Negative |
| Net_margin | Firm performance | 0.6956 | 0.2678 | Positive |
| Sale_growth | Firm basic characteristics | 0.6665 | 0.1323 | Positive |
| Leverage | Firm basic characteristics | 0.6576 | 0.8503 | Positive |
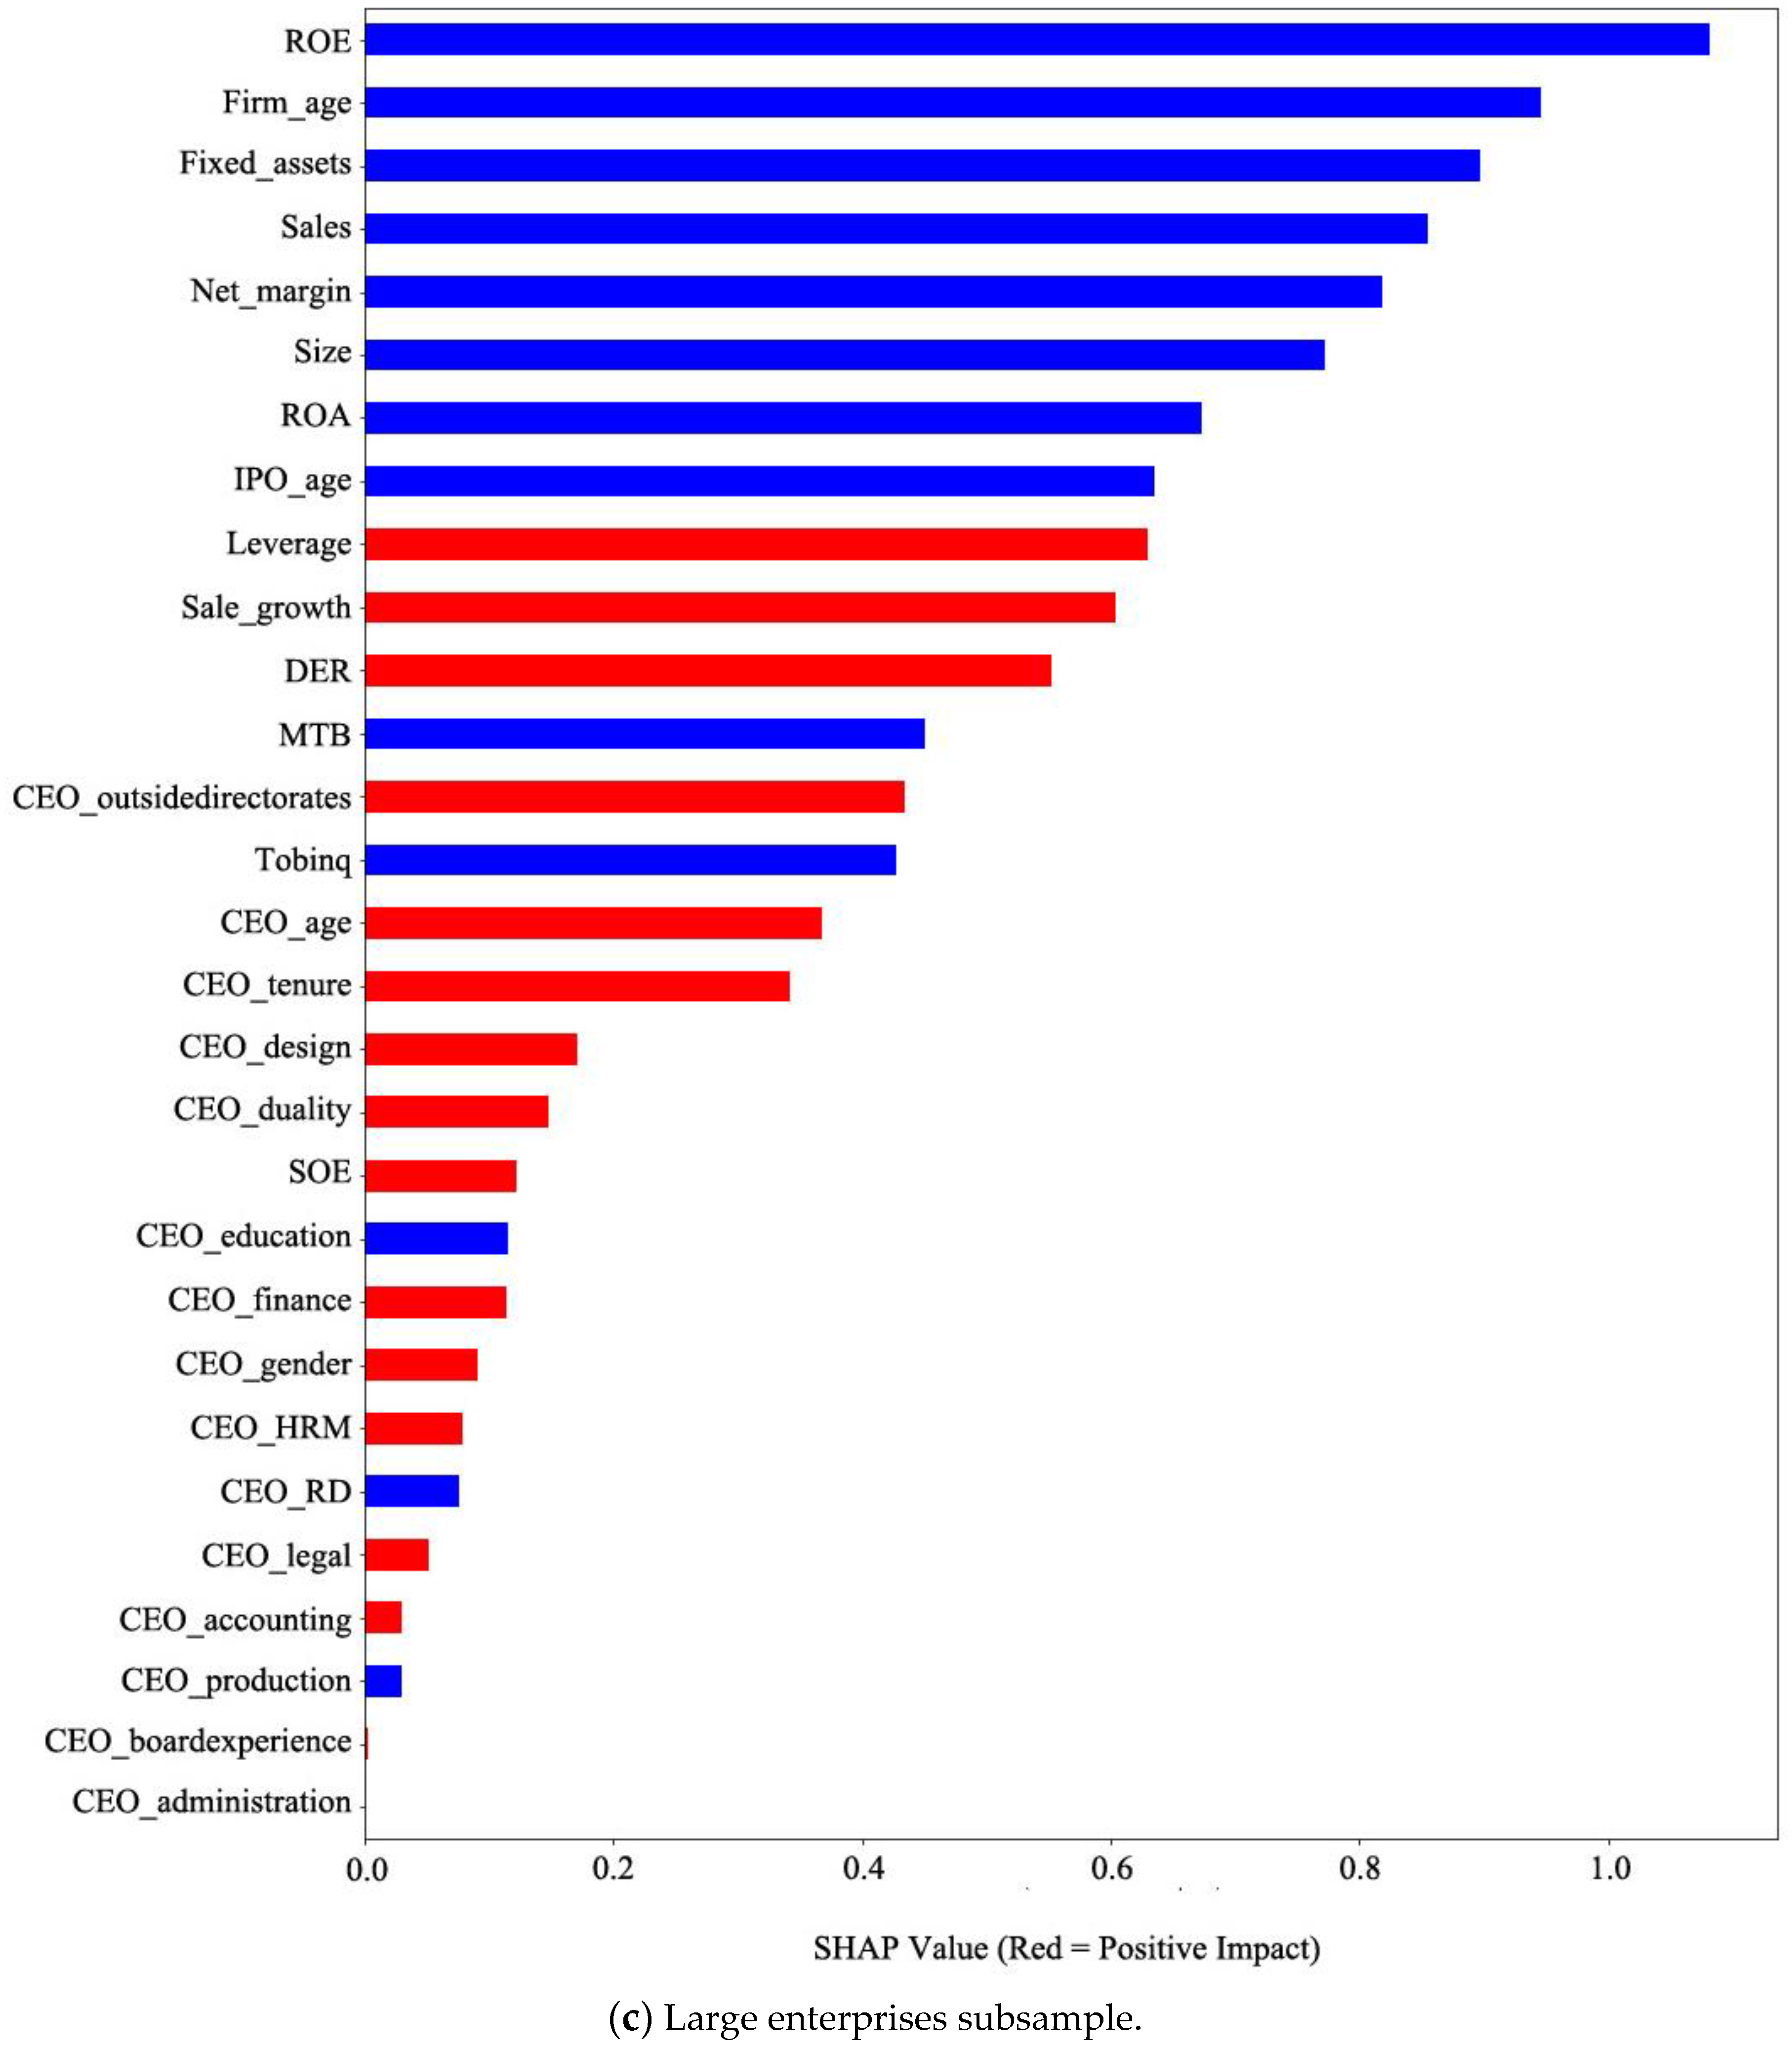
| Large enterprises | Category | SHAP value | Effects | Sign |
| ROE | Firm performance | 0.9759 | −0.2915 | Negative |
| Firm_age | Firm basic characteristics | 0.8756 | −0.5913 | Negative |
| Net_margin | Firm performance | 0.7770 | −0.4371 | Negative |
| Fixed_assets | Firm basic characteristics | 0.7712 | −0.0643 | Negative |
| Sales | Firm performance | 0.7642 | −0.4005 | Negative |
| DER | Firm basic characteristics | 0.6779 | 0.8604 | Positive |
| Size | Firm basic characteristics | 0.6475 | −0.5721 | Negative |
| ROA | Firm performance | 0.5957 | −0.5168 | Negative |
| IPO_age | Firm basic characteristics | 0.5781 | −0.5108 | Negative |
| Sale_growth | Firm performance | 0.5474 | 0.4613 | Positive |
Disclaimer/Publisher’s Note: The statements, opinions and data contained in all publications are solely those of the individual author(s) and contributor(s) and not of MDPI and/or the editor(s). MDPI and/or the editor(s) disclaim responsibility for any injury to people or property resulting from any ideas, methods, instructions or products referred to in the content. |
© 2023 by the authors. Licensee MDPI, Basel, Switzerland. This article is an open access article distributed under the terms and conditions of the Creative Commons Attribution (CC BY) license (https://creativecommons.org/licenses/by/4.0/).
Share and Cite
Liu, C.; Chen, Y.; Huang, S.; Chen, X.; Liu, F. Assessing the Determinants of Corporate Risk-Taking Using Machine Learning Algorithms. Systems 2023, 11, 263. https://doi.org/10.3390/systems11050263
Liu C, Chen Y, Huang S, Chen X, Liu F. Assessing the Determinants of Corporate Risk-Taking Using Machine Learning Algorithms. Systems. 2023; 11(5):263. https://doi.org/10.3390/systems11050263
Chicago/Turabian StyleLiu, Caixia, Yu Chen, Sifan Huang, Xuesheng Chen, and Feng Liu. 2023. "Assessing the Determinants of Corporate Risk-Taking Using Machine Learning Algorithms" Systems 11, no. 5: 263. https://doi.org/10.3390/systems11050263