Article

Input Efficiency Measurement and Improvement Strategies of New Infrastructure under High-Quality Development

1
Business School, Shandong University of Technology, Zibo 255049, China
2
School of Economics, Shandong University of Technology, Zibo 255049, China
*
Author to whom correspondence should be addressed.
These authors contributed equally to this work.
Systems 2023, 11(5), 243; https://doi.org/10.3390/systems11050243
Submission received: 13 April 2023 / Revised: 6 May 2023 / Accepted: 10 May 2023 / Published: 13 May 2023

Abstract

:
As a result of implementing new development concepts and absorbing new technical revolutions in the Intelligent Economy Age, new infrastructure is defined as a new driving force for high-quality development. However, as new infrastructure is constructed, there are problems such as the small scale of high-tech industries, weak economic support and human capital, and difficulty in carrying out new infrastructure construction projects, so it has become crucial to find solutions to these problems. Using the slacks-based measure model and Moran index, this study compares and analyzes the input efficiency of new infrastructure in 30 provinces of China from 2011 to 2020, alongside the analysis of temporal and spatial differences. China’s new infrastructure input generally shows a stable development trend in terms of efficiency, while the regional coordination still needs to be strengthened. Eastern China maintains a leading trend, Central China is developing rapidly, and the western region and Northeastern China do not form high-value agglomeration areas. This study puts forward relevant policy recommendations from four dimensions—optimizing the industrial structure, giving scope to government function, focusing on key areas, and compensating for weak links—to supply a powerful impetus for the development of new infrastructure.

1. Introduction

As a result of implementing new development concepts and absorbing new technical revolutions in the Intelligent Economy Age, new infrastructure will lead to economic community advancements and improve the living standards of residents [1]. Unlike traditional infrastructure designed to connect physical spaces (highways, bridges, pipelines, etc.), new infrastructure uses digital technology to enable connections between the physical space and digital space. While building new infrastructure, traditional industries are also being digitally transformed, and digital industries are being developed. As the guarantee for a digital society, new infrastructure can significantly promote social progress [1,2].
China is currently undergoing an exciting and challenging time, and the Chinese government has realized that accelerating the creation of new infrastructure is the key support for Information and Communication Technology (ICT) progress, an essential component in achieving high-quality development as well as a guarantee for the construction of a modern economic system and a modern socialist regime.
The Central Economic Work Conference first put forward the concept of new infrastructure in December 2018. The Chinese government has repeatedly emphasized that new infrastructure construction has great potential in macroeconomic counter-cyclical adjustment, stabilizing industrial input, and filling industrial shortcomings. Therefore, it is necessary to focus on the national conditions; plan the overall situation and look to the future; define the construction scope, development goals, main tasks, and safeguarding measures of new infrastructure; and accelerate the development of new infrastructure across the country as a whole [3].
New infrastructure can therefore encourage high-quality growth. The Chinese government, taking into consideration the entire scenario, has developed a strategic plan of “hurrying up the creation of a new development structure and exerting effort improving high-quality development,” which has emerged as the most recent path for China’s social advancement [4,5]. At a national level, building new infrastructure not only contributes significantly to preventing and controlling epidemics and resuming work and production, but also contributes to raising living standards within the country and optimizing the industrial structure; it also has great potential in advancing high-quality development.
To encourage high-quality development, it is essential to place emphasis on the problem of development quality, and new infrastructure construction could advance high-quality development via kinetic energy conversion, structural optimization, and improved efficiency, so accelerating new infrastructure construction is an important measure towards high-quality development.
Every province, autonomous region, and municipality (“province” is used in the following) in China is different in terms of its social structure, market, resources, etc. There are also obvious differences in terms of culture and religion. Therefore, it is imperative that new infrastructure inputs in various Chinese provinces are measured for their efficiency, we develop a mechanism to link the new infrastructure in a blended approach, and we advance the creation of new infrastructure.
The identification of new infrastructure, its effect on high-quality development, and current policy suggestions are the primary areas of concentration in the present research on new infrastructure. Firstly, in terms of classification, previous research introduced new infrastructure from three dimensions of information infrastructure, converged infrastructure, and innovation infrastructure, and introduced the beneficial impacts of new infrastructure [6,7,8]. Secondly, in terms of the impact on high-quality development, new infrastructure not only generates economic benefits by promoting technological innovation and digital transformation [1]; it also produces social benefits by improving the ecological environment, responding to public health emergencies, and creating employment opportunities [9,10,11].
Simultaneously, in terms of policy recommendations for new infrastructure construction, existing research proposes that new infrastructure should be integrated with various industry sectors [12], and, according to the characteristics of new infrastructure, measures such as strengthening top-level design, improving policy guarantees, improving innovation capabilities, strengthening application leadership, and emphasizing educational development are implemented to quicken the process of exploiting its great potential. However, there is limited research on the input efficiency of new infrastructure, and the indicators and methods to measure input efficiency need to be further explored to improve new infrastructure’s input efficiency by studying potential problems. Therefore, this research has achieved innovations in the selection of research objects, evaluation indicator systems, and research methods [7].
Firstly, this study considers the key dimensions of information infrastructure, converged infrastructure, innovation infrastructure, and social, economic, and technological innovation, and creates a system to measure new infrastructure’s input efficiency. Then, utilizing the Moran index approach and the super-efficient slacks-based measure (SBM) model, the difference between the input efficiency and time and space of new infrastructure is analyzed. We comprehensively measure the input efficiency of new infrastructure in 30 provinces in China, deeply analyze it, and propose targeted policy solutions to problems encountered during the development of new infrastructure.
This study’s goal is to assess how new infrastructure affects high-quality development by measuring the input efficiency of new infrastructure in selected regions. The remaining sections are as follows. Section 2 is the literature review, including the classification of new infrastructure, its impact on high-quality development, and existing policy recommendations. Section 3 introduces the research methods, which include the super-efficiency SBM model and the Moran index. Section 4 details the new infrastructure input efficiency measurement index system. Section 5 presents the case information and analysis results. As a result of the analysis, Section 6 puts forward corresponding policy recommendations from four dimensions: optimizing the industrial structure, highlighting the government’s important role, focusing on key areas, and compensating for weak links. Finally, Section 7 summarizes the research results of this study and proposes follow-up research ideas.

2. Literature Review

As the supporting foundation for the development of a digital society, new infrastructure can markedly enhance the realization of high-quality development, so it has attracted many scholars to study new infrastructure from multiple fields and perspectives. At present, the research on new infrastructure is largely concentrated in the definition of new infrastructure, its impact on high-quality development, and existing policy recommendations.
(1)
Definition of new infrastructure. New infrastructure construction is a modern infrastructure that provides digitized transformation, intellectualized upgrades, and integrated innovation services for the economic society. It mainly includes information infrastructure, integrated infrastructure, and innovative infrastructure. In 2006, Shin argued that the construction of information infrastructure should be viewed from a long-term perspective, as information infrastructure can penetrate into society, ICT, and other organizations [13]. In 2014, Grisot argued that the key to information infrastructure advancement is a development strategy based on specific user needs, usefulness, and evolutionary growth [8].
Construction of the digital economy is the main focus of information infrastructure, while industrial digitalization is reflected in convergent infrastructure. With the increasing infiltration of new Information and Communication Technology (ICT) in the overall industrial economic activity, it can improve the industrial value chain and energy utilization rate [6,14].
Simultaneously, the transformation of the country’s economic structure has been driving the construction of innovative infrastructure. When building innovation infrastructure, new knowledge and technology are needed to build on it; to protect and build scientific and technological potential, innovation, and entrepreneurship; to guard against the loss of intellectual assets in the form of copyright and patents for research scientists; to improve the efficiency of research activities, and to address the creation of new employment opportunities and the formation of innovative markets [7]. New infrastructure construction projects adapt to the changes of the current era, provide various support for the digital society, advance the intelligent construction of countries and regions, and are defined as the primary impetus of global economic development in the future [15].
(2)
The effect of building new infrastructure on high-quality development. We may rely on the application of ICT to support high-quality development when we are creating new infrastructure. New infrastructure is driven by new ICT; on the other hand, it has a substantial connection with economic and social development [16,17]. In short, new infrastructure could provide key support for urban and regional development. Meanwhile, new infrastructure promotes technological innovation and digital transformation, which enrich the substance and measures of supply-side structural reformation; exert a significant beneficial impact on the mode, structure, and layout of production; and promote economic development [1].
New infrastructure generates not only economic but also social benefits. Information infrastructure reduces air pollution and improves ecological quality by changing the construction mode of traditional infrastructure and improving energy utilization [9]. In the face of the global pandemic, digital infrastructure ensured the health of front-line staff by providing valuable data for the first time, including through remote detection and diagnosis [11]. In addition, as digital infrastructure penetrates into various industries, a large number of jobs will be generated in the process [10].
(3)
Policy recommendations for new infrastructure construction. New infrastructure brings a key impetus to regional digital construction, and scholars have proposed recommendations to increase the input efficiency of new infrastructure from the perspectives of public health, innovation and entrepreneurship, top-level design, and education. When discussing how to increase the input efficiency of new infrastructure, the relevant departments could give full consideration to how the infrastructure supports the public health sector and enhances its ability to respond to major public health events [12].
Governments may promote digital innovation and entrepreneurship, facilitate coordinated efforts across industries, and adapt education systems to changing labor markets in order to deliver digital knowledge and skills training to as many people as possible while constructing new infrastructure [18]. Furthermore, the development of new infrastructure is driven by innovative technologies, and the progress of education could advance the progress of innovative technology. Universities and research institutions should integrate educational development with scientific technology [7,19].
The findings pay attention to the classification of new infrastructure, its impact on high-quality development, and existing policy recommendations, but it is still difficult to give effective guidance and suggestions regarding the construction mode and path of new infrastructure in China. In order to provide beneficial development recommendations for China and other countries and regions, this study combines the requirements of new infrastructure and high-quality development, builds an index system based on these requirements, calculates the input efficiency of new infrastructure in China, and analyzes the current issues.

3. Research Methods

3.1. Introduction to Research Methods

(1)
Super-efficiency SBM model
The Data Envelopment Analysis (DEA) method was jointly proposed by Charnes, Cooper, and Rodes in 1978 [20]. It is a nonparametric approach to estimating the efficacy of multiple decision-making units that explicitly accounts for the application of several inputs and the production of several outputs to compare the effectiveness of several service units providing comparable services [20]. However, the following drawbacks are associated with the traditional DEA model: (1) the radial DEA overestimates the efficiency of DMU in the presence of input overpressure or insufficient output and non-zero relaxation of input or output; (2) the angle DEA must ignore changes in inputs or outputs, and the calculated results are not in line with objective reality.
Tone discovered an efficiency assessment approach in view of relaxation variables, the SBM model, and developed the super-efficiency SBM model in 2002 to continually enhance it in order to address the aforementioned issues [21]. This method has been applied to study energy efficiency in European countries [22], measure regional transport sustainability [23], and examine how regional variations affect the effectiveness of agricultural water use [24].
In measuring the input efficiency of new infrastructure, some relaxation variables are selected to make the measurement results more accurate. The SBM model can be used effectively to deal with relaxation variables. It is easier to assess the test results when the efficiency values of effective efficiency data management units (DMUs) are further examined using the super-efficiency SBM model to identify the level differences of effective efficiency DMUs [23,25,26]. Therefore, this study selected the super-efficient SBM model to measure the input efficiency of new infrastructure, in order to analyze whether the construction of new infrastructure can promote high-quality development in the region.
(2)
Moran index
When scholars research objects or data, they tend to consider whether there are spatial connections between different research objects, especially in terms of spatial relationships, and the Moran index is a comprehensive assessment method used to measure spatial autocorrelation [27,28]. The Moran index typically consists of the global Moran index and the local Moran index. The global Moran index can indicate whether there are anomalies or clustering traits present over the whole regional space; the local Moran index can be used to aggregate certain geographical units and express how close these spatial units are to other areas [29,30]. The Moran index has been widely used to study the regional pollution characteristics of PM2.5 in Eastern and Central China [31]; it explained the complicated interaction between vegetation and thermal behavior in urban areas [32]; and it identified the features of healthy urban growth [33].
In this study, after calculating the input efficiency of new infrastructure in each region, it was necessary to study the spatial differences between regions. As a thorough evaluation technique to calculate spatial autocorrelation, the Moran index can objectively reflect the spatial differences in the input efficiency values of new infrastructure, so this study assesses the spatial distribution of new infrastructure’s input efficiency with the help of the Moran index [34].

3.2. Research Method Details

The input efficiency of new infrastructure in various locations was evaluated and examined in this study using the super-efficiency SBM model. The geographical correlations and differences across areas were then analyzed using the Moran index. The specific formula is as follows.
(1)
Super-efficiency SBM model related calculation formula
The model is as follows:
min δ = 1 c p = 1 c x p ¯ / x p 0 1 d q = 1 d y q ¯ / y q 0
In addition, the above equation also conforms to x ¯ t = 1 , 0 n λ t x t ; y ¯ t = 1 , 0 n λ t y t ; x ¯ x 0 , y ¯ y 0 ; t = 1 , 0 n λ t = 1 ; y ¯ 0 ,   λ 0 .
Here, n denotes DMUs; c and d denote input indicators and output indicators, respectively; x ¯ and y ¯ are relaxation variables representing inputs and outputs, respectively; λ is a constant vector. If σ 1 , the DMU is said to be an effective decision-making unit; if σ < 1 , the DMU is said to be an invalid decision unit. A higher σ represents higher efficiency.
(2)
Moran index related calculation formula
The global Moran index:
I = n p = 1 n t = 1 n w p t x p x ¯ x t x ¯ p = 1 n t = 1 n w p t p = 1 n x p x ¯ 2
where n is the total number of cities; x p and x t are index values of variable x in city p and city t, respectively; x ¯ is the mean of x; w p t is a matrix of adjacency distance space weights, and w p t is 1 when x p and x t are adjacent and 0 when they are not adjacent. The range of I is 1 , 1 . I > 0 indicates that space is positively autocorrelated; I < 0 indicates negative autocorrelation in space; I = 0 means that there is no autocorrelation, and the geographical distribution is random [35]. A larger value of I indicates that the variables are more related and clustered in the spatial distribution.
The Moran index significance test formula is
Z = 1 E ( I ) V ( I )
where Z represents the significance level of spatial autocorrelation, E(I) is the mathematical expectation of the Moran index, and V(I) is the variance.
The local Moran index:
I i = n x p x ¯ t = 1 n x t x ¯ p = 1 n x p x ¯
x p , x t , x ¯ , and w p t have the same meaning as in formula (2). The value of I i is positive, indicating that the space has the same properties as the surrounding area; a negative value indicates that the spatial unit is different from the surrounding area; the degree of aggregation increases with the absolute magnitude of I i .

4. Construction of a Measurement Indicator System

In light of the scientific character, impartiality, independence, and viability, this research completely evaluates the influence of new infrastructure on the high-quality growth of society, economics, and technology. It also develops a new infrastructure input efficiency measurement indicator system in view of China’s current circumstances. The target value of the indicator system is divided into two aspects, input and output, of which the input aspect is the classification of new infrastructure; the output aspect is the perspective from which new infrastructure contributes to high-quality development, including society, the economy, and technological innovation. See Table 1 for details. Among them, “X” represents the input indicator and “Y” represents the output indicator. The first number after “X (Y)” represents the input (output) dimension, and the second number represents the specific indicator.

4.1. Indicators of New Infrastructure Inputs

A new infrastructure system is one that is built on new development principles, driven by technical advancement, with an eye toward information networks, and in response to the desire for high-quality development. Information infrastructure, convergence infrastructure, and innovative infrastructure make up the majority of this infrastructure system, which provides digital transformation, intelligent upgrading, and integrated innovation services. Therefore, this study divides the input indicators into three areas: information infrastructure (X1), converged infrastructure (X2), and innovation infrastructure (X3).
Information infrastructure (X1): Information infrastructure mainly includes infrastructure generated by the evolution of new ICT. Information infrastructure can greatly improve the ability to process, integrate, analyze, and use information and data, while also changing the ways in which countries operate [36]. Therefore, this study reflects the input in information infrastructure in terms of mobile phone base station coverage (X11), long-distance optical cable coverage (X12), and Internet broadband coverage (X13) [37,38,39,40].
Converged infrastructure (X2): Infrastructure that facilitates the modernization and transformation of conventional sectors through information technology, such as the Internet and big data, is referred to as converged infrastructure. Information and communications technology can improve people’s lives, work, and interactions by digitizing traditional social technologies and social infrastructure [41,42,43]. Therefore, the proportion of enterprises that use information management (X21) and the proportion of enterprises that carry out production and business activities through the Internet (X22) are used in this study, and the proportion of enterprises promoting through the Internet (X23) reflects the input in converged infrastructure [44,45,46].
Innovation infrastructure (X3): Science, technology, and product development are represented mostly by innovation infrastructure. Innovation infrastructure has a strong impact on achieving sustainable development goals and enabling economic growth and development in emerging economies [47,48]. The ratio of research and development (R&D) researchers (X31) and the ratio of the internal expenditure of R&D funds of industrial enterprises on the scale (X32) to the number of resources are used to characterize technology R&D and innovation [49,50]. The success rate of patent applications in a region can reflect the innovation capacity of the region, so this study measures the input in innovation infrastructure in terms of regional innovation capacity (X33) [51,52,53].

4.2. Indicators of Outputs

The creation of new infrastructure may accelerate social and economic progress while simultaneously fostering technological advancement and innovation, giving rise to a continuous flow of high-quality development momentum [54]. Therefore, in this study, social (Y1), economic (Y2), and technological innovation (Y3) were selected as output indicators.
Society (Y1): The construction of new infrastructure has made the results of ICT available to more and more people and regions, as well as enhancing the convenience of living, working, and communicating, and this study characterizes the audience by the number of mobile phone subscribers (Y11). The digital financial inclusion index (Y12) reflects the enhancement in people’s everyday lives and jobs from a variety of angles [55].
Meanwhile, there are a number of job possibilities created by the building of new infrastructure, so this study uses the number of persons employed in information transmission, software, and information technology services (Y13) to characterize the capacity of the new infrastructure to increase the employment rate of the population [56,57]. The effect of new infrastructure on people’s livelihoods is not limited to employment; it can also improve the quality of social livelihoods, education, medical care, housing, and social security, so it is reflected in the proportion of people’s livelihood fiscal expenditure (Y14) [58,59].
Economy (Y2): The construction of new infrastructure is based on ICT, which will generate many software products and various types of services related to information technology and information security. In addition, this study uses the software business revenue (Y21) to characterize the driving force provided by information technology for economic development [37,60,61].
Meanwhile, the construction of new infrastructure promotes industrial transformation and intelligent upgrading, especially the rapid development of emerging enterprises, so the gross industrial output value of high-tech enterprises (Y22) is used to express the contribution of new infrastructure to industrial improvement [62,63], reflecting the growth of digitized industries and industrial digitalization in terms of tertiary industry added value (Y23) [64,65]. In addition, this study adopts the green finance index (Y24) to judge a region’s extensive growth in green finance, which can scientifically and objectively reflect the overall advancement of regional green finance [66,67].
Technological innovation (Y3): While building new infrastructure, massive technological and scientific advances and patented inventions will be derived, which can not only improve residents’ daily life and work efficiency, but also indicate the direction for the development of new infrastructure. This study takes the number of new product development projects in high-tech industries (Y31) and the number of effective invention patents in high-tech industries (Y32) to characterize scientific and technological achievements and patented inventions [68,69].
Meanwhile, tech business incubator can improve enterprise technology development, improve national and regional innovation systems, and strengthen the economy, which has great social and economic significance, and the number of companies that graduated from the tech business incubator in that year (Y33) is used to characterize the contribution of new infrastructure to business growth enhancement [70,71]. In addition, the volume of the technology market is the key indicator to evaluate a region’s capacity to apply technical and scientific advances, and the active technology transactions reflect the increasing liquidity, activity, and efficiency of innovation resource inputs in the regional technology factor market, so this study uses the technology market turnover (Y34) to reflect the capacity to transform technical and scientific achievements [72].

5. Empirical Analysis

5.1. Case Information and Preliminary Analysis

5.1.1. Case Information

At present, as a key part of the modern infrastructure system, new infrastructure has attracted extensive attention from the academic community. In this digital era, building new infrastructure to guide and assist the development of sophisticated production forces is vital given the large increases in China’s economic development’s speed and quality.
Since the new infrastructure concept was first presented at the Central Economic Work Conference, the Chinese government has repeatedly emphasized that new infrastructure construction has great potential in macroeconomic counter-cyclical adjustment, stabilizing the industrial input, and filling industrial shortcomings. It is evident that China’s economy has evolved to be characterized by high-quality development, and the development and use of modern infrastructure has become the cornerstone of China’s high-quality development. The in-depth study of the theory and trajectory of how China’s new infrastructure affects high-quality development is necessary to understand this.
For this reason, using China as an example, this study analyzes the investment efficiency of new infrastructure and investigates the impact of new infrastructure on the high-quality development of a country or region using the super-efficiency SBM model. Tibet, Hong Kong, Macao, and Taiwan are not taken into account in this analysis due to a lack of data.

5.1.2. Preliminary Analysis

The data of this study are derived from the China Statistical Yearbook, China Science and Technology Statistical Yearbook, China Torch Statistical Yearbook, and China Tertiary Industry Statistical Yearbook. In order to better evaluate the efficiency of investment in new infrastructure, this study first conducts a preliminary analysis of the collected data.
(1)
Descriptive statistics
Descriptive statistical analysis seeks mainly to perform statistical analysis on the basic information of the sample, and, in this study, the selected data were simply sorted and analyzed via the SPSS 26.0 software, and the specific results are shown in Table 2. By comparing the mean and standard deviation, it can be seen that X11, X12, X13, Y21, Y32, and Y33 have a large degree of dispersion, which shows that, in these aspects, China’s provinces may be in a state of unbalanced development.
(2)
Correlation analysis
Based on the results of the descriptive statistical analysis, this study explores the relationship between the input and output indicators through Spearman correlation analysis. Due to the large number of indicators used in this study, for brevity, the correlation analysis results are included in Appendix A. The specific results are shown in Table A1 and Table A2.
Spearman correlation analysis mainly reflects the degree of correlation between variables through the correlation coefficients and significance relationships between variables. Among them, the significance relationship reflects whether there is a correlation between two variables, while the correlation coefficient reflects the degree of correlation between variables. According to Appendix A, out of 231 significance relationships, a total of 181 relationships met the 1% significance level, 12 relationships met the 5% significance level, and 8 relationships met the 10% significance level. This means that approximately 87% of the samples have a correlation. From this, it can be concluded that the selected indicators in this study have a good correlation and meet the criteria for further analysis.

5.2. Analysis of the Results

5.2.1. Analysis of New Infrastructure Input Efficiency Measurement Based on High-Quality Development

The National Development and Reform Commission of China has clarified that new infrastructure includes information infrastructure, converged infrastructure, and innovation infrastructure. Although the concept of new infrastructure has only been proposed in recent years, its contents have already begun to be constructed. In the literature review part of this study, it was observed that there is a certain connection between new infrastructure and traditional infrastructure. Therefore, this study takes 2011 as the starting point to study the input efficiency of new infrastructure in China in the past decade. In order to determine the new infrastructure input efficiency of 30 Chinese provinces from 2011 to 2020, this study adopts the super-efficiency SBM model, and the specific input efficiency is shown in Table 3. When the input efficiency value is greater than 1, the new infrastructure input efficiency in the region is said to be in an effective state; when the input efficiency value is less than 1, it is considered an invalid state.
Based on the Implementation Opinions of Several Policies and Measures issued by the State Council on the Great Development of the Eastern Region and the Several Opinions of the Communist Party of China (CPC) Central Committee and the State Council on Promoting the Rise of the Central Region, China’s economic regions are divided into four major regions in this article: Eastern China, Central China, Western China, and Northeastern China.
Among them, Eastern China includes 10 provinces, namely Beijing, Tianjin, Hebei, Shanghai, Jiangsu, Zhejiang, Fujian, Shandong, Guangdong, and Hainan; Central China includes six provinces, namely Shanxi, Anhui, Jiangxi, Henan, Hubei, and Hunan provinces; the western region includes the Inner Mongolia Autonomous Region, Guangxi Zhuang Autonomous Region, Chongqing Municipality, Sichuan Province, Guizhou Province, Yunnan Province, Shaanxi Province, Gansu Province, Qinghai Province, Ningxia Hui Autonomous Region, and Xinjiang Uygur Autonomous Region, with 11 provinces; Northeastern China includes three provinces, namely Liaoning, Jilin, and Heilongjiang.
(1)
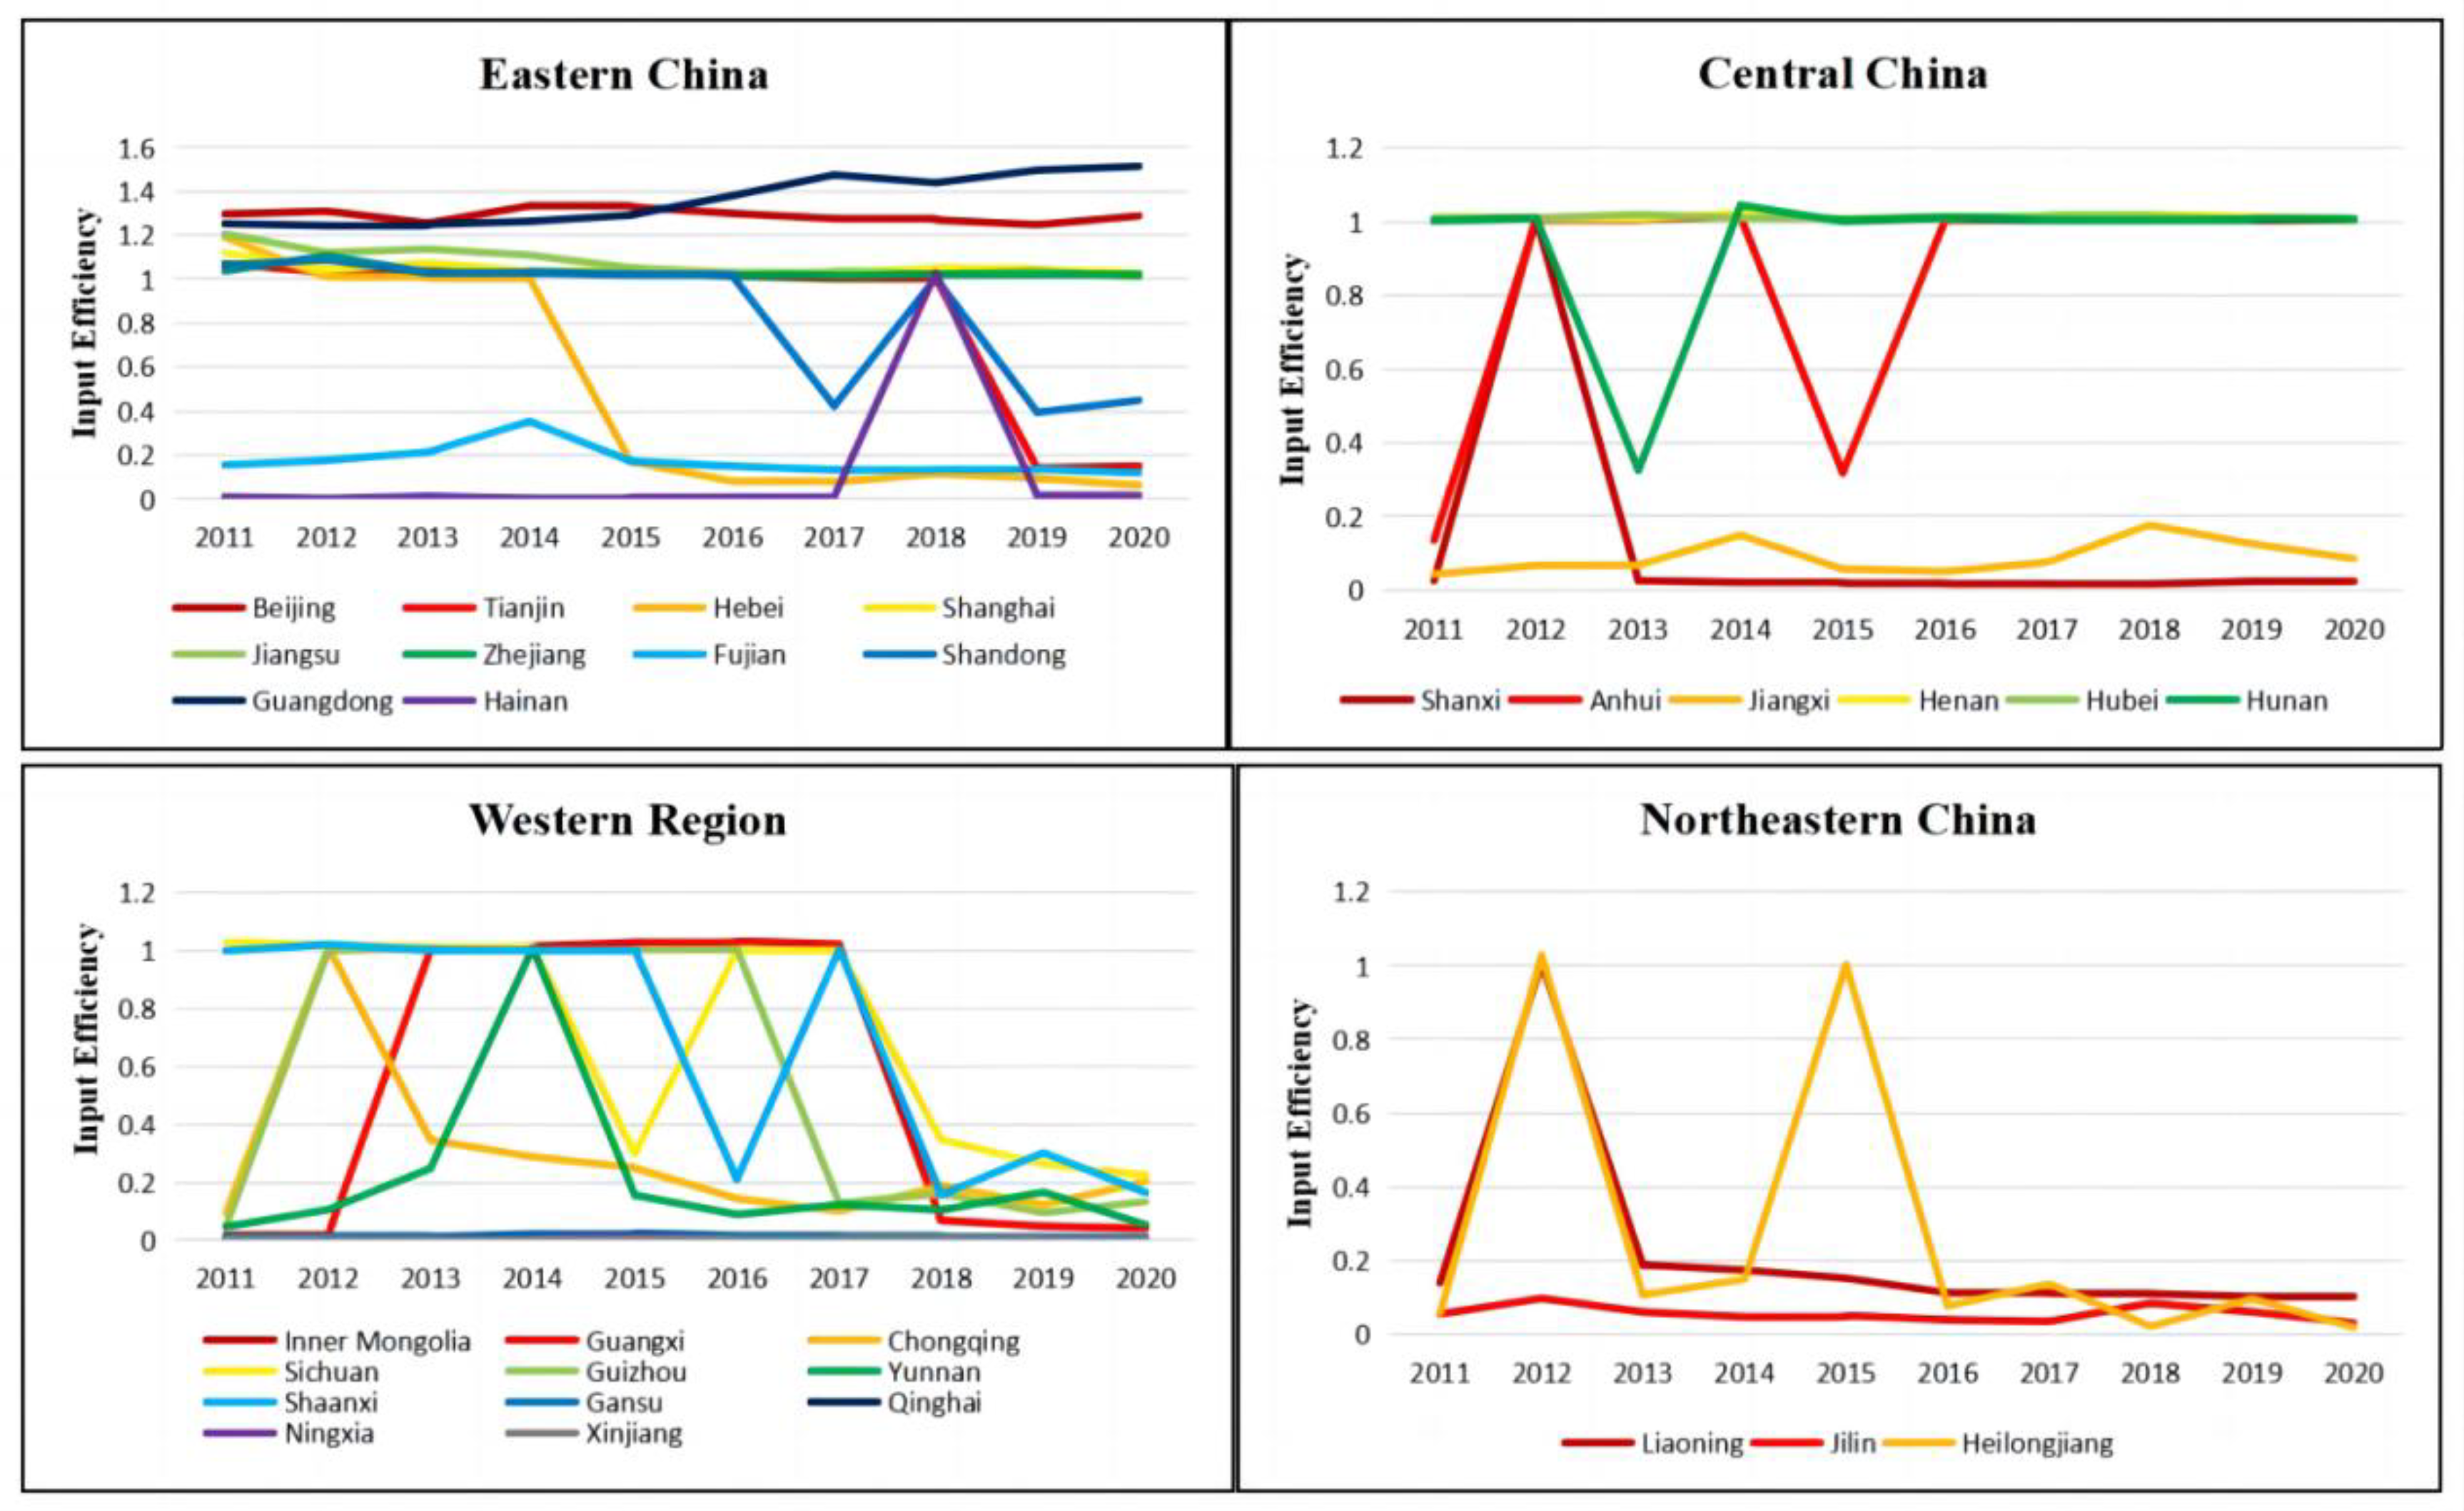
Analysis of the temporal evolution of the input efficiency of new infrastructure
To visually express the distribution of and change in new infrastructure input efficiency in the 30 provinces in China, this study represents and analyzes the input efficiency of the provinces in the form of line charts. See Figure 1 for details.
Table 3 and Figure 1 present the changes in new infrastructure input efficiency in Eastern China, Central China, Western China, and Northeastern China during 2011–2020.
The overall input efficiency level is quite high as viewed from Eastern China, and the five provinces of Beijing, Shanghai, Jiangsu, Zhejiang, and Guangdong have been in an effective state; Hebei, Shandong, and Tianjin have overall good performance, with only occasional inefficiencies between 2015 and 2020. Besides 2018, Fujian and Hainan are in an invalid state for the rest of the time period.
From the viewpoint of Central China, the input efficiency of Henan and Hubei has been in an effective state; the efficiency values of Shanxi, Hunan, and Anhui fluctuated in 2012, 2013, and 2015, respectively, with Anhui and Hunan basically remaining in the valid state, while Shanxi was basically in the invalid state. Jiangxi has been ineffective.
From the viewpoint of the western region, the input efficiency value of each region has changed greatly, and most of the regions are in an invalid state. Sichuan and Shaanxi were basically in an active status before 2017, but both changed to an invalid status in 2018; the efficiency value change curves of Guizhou and Guangxi are of the “π” type, both of which are low at both ends and high in the middle. Chongqing and Yunnan are basically invalid only in 2012 and 2014, respectively; the remaining regions, including Inner Mongolia, Gansu, Qinghai, Ningxia, and Xinjiang, have been in a state of ineffectiveness, and the efficiency values are close and the change curves are basically overlapping.
From the perspective of Northeastern China, since the region only includes three regions, only Heilongjiang was in effect in 2012 and 2015. Liaoning was in an effective state in 2012, and, in the rest of the period, it was the same as Jilin as a whole, all in an invalid state, which shows that the input efficiency of new infrastructure in the region is relatively low.
(2)
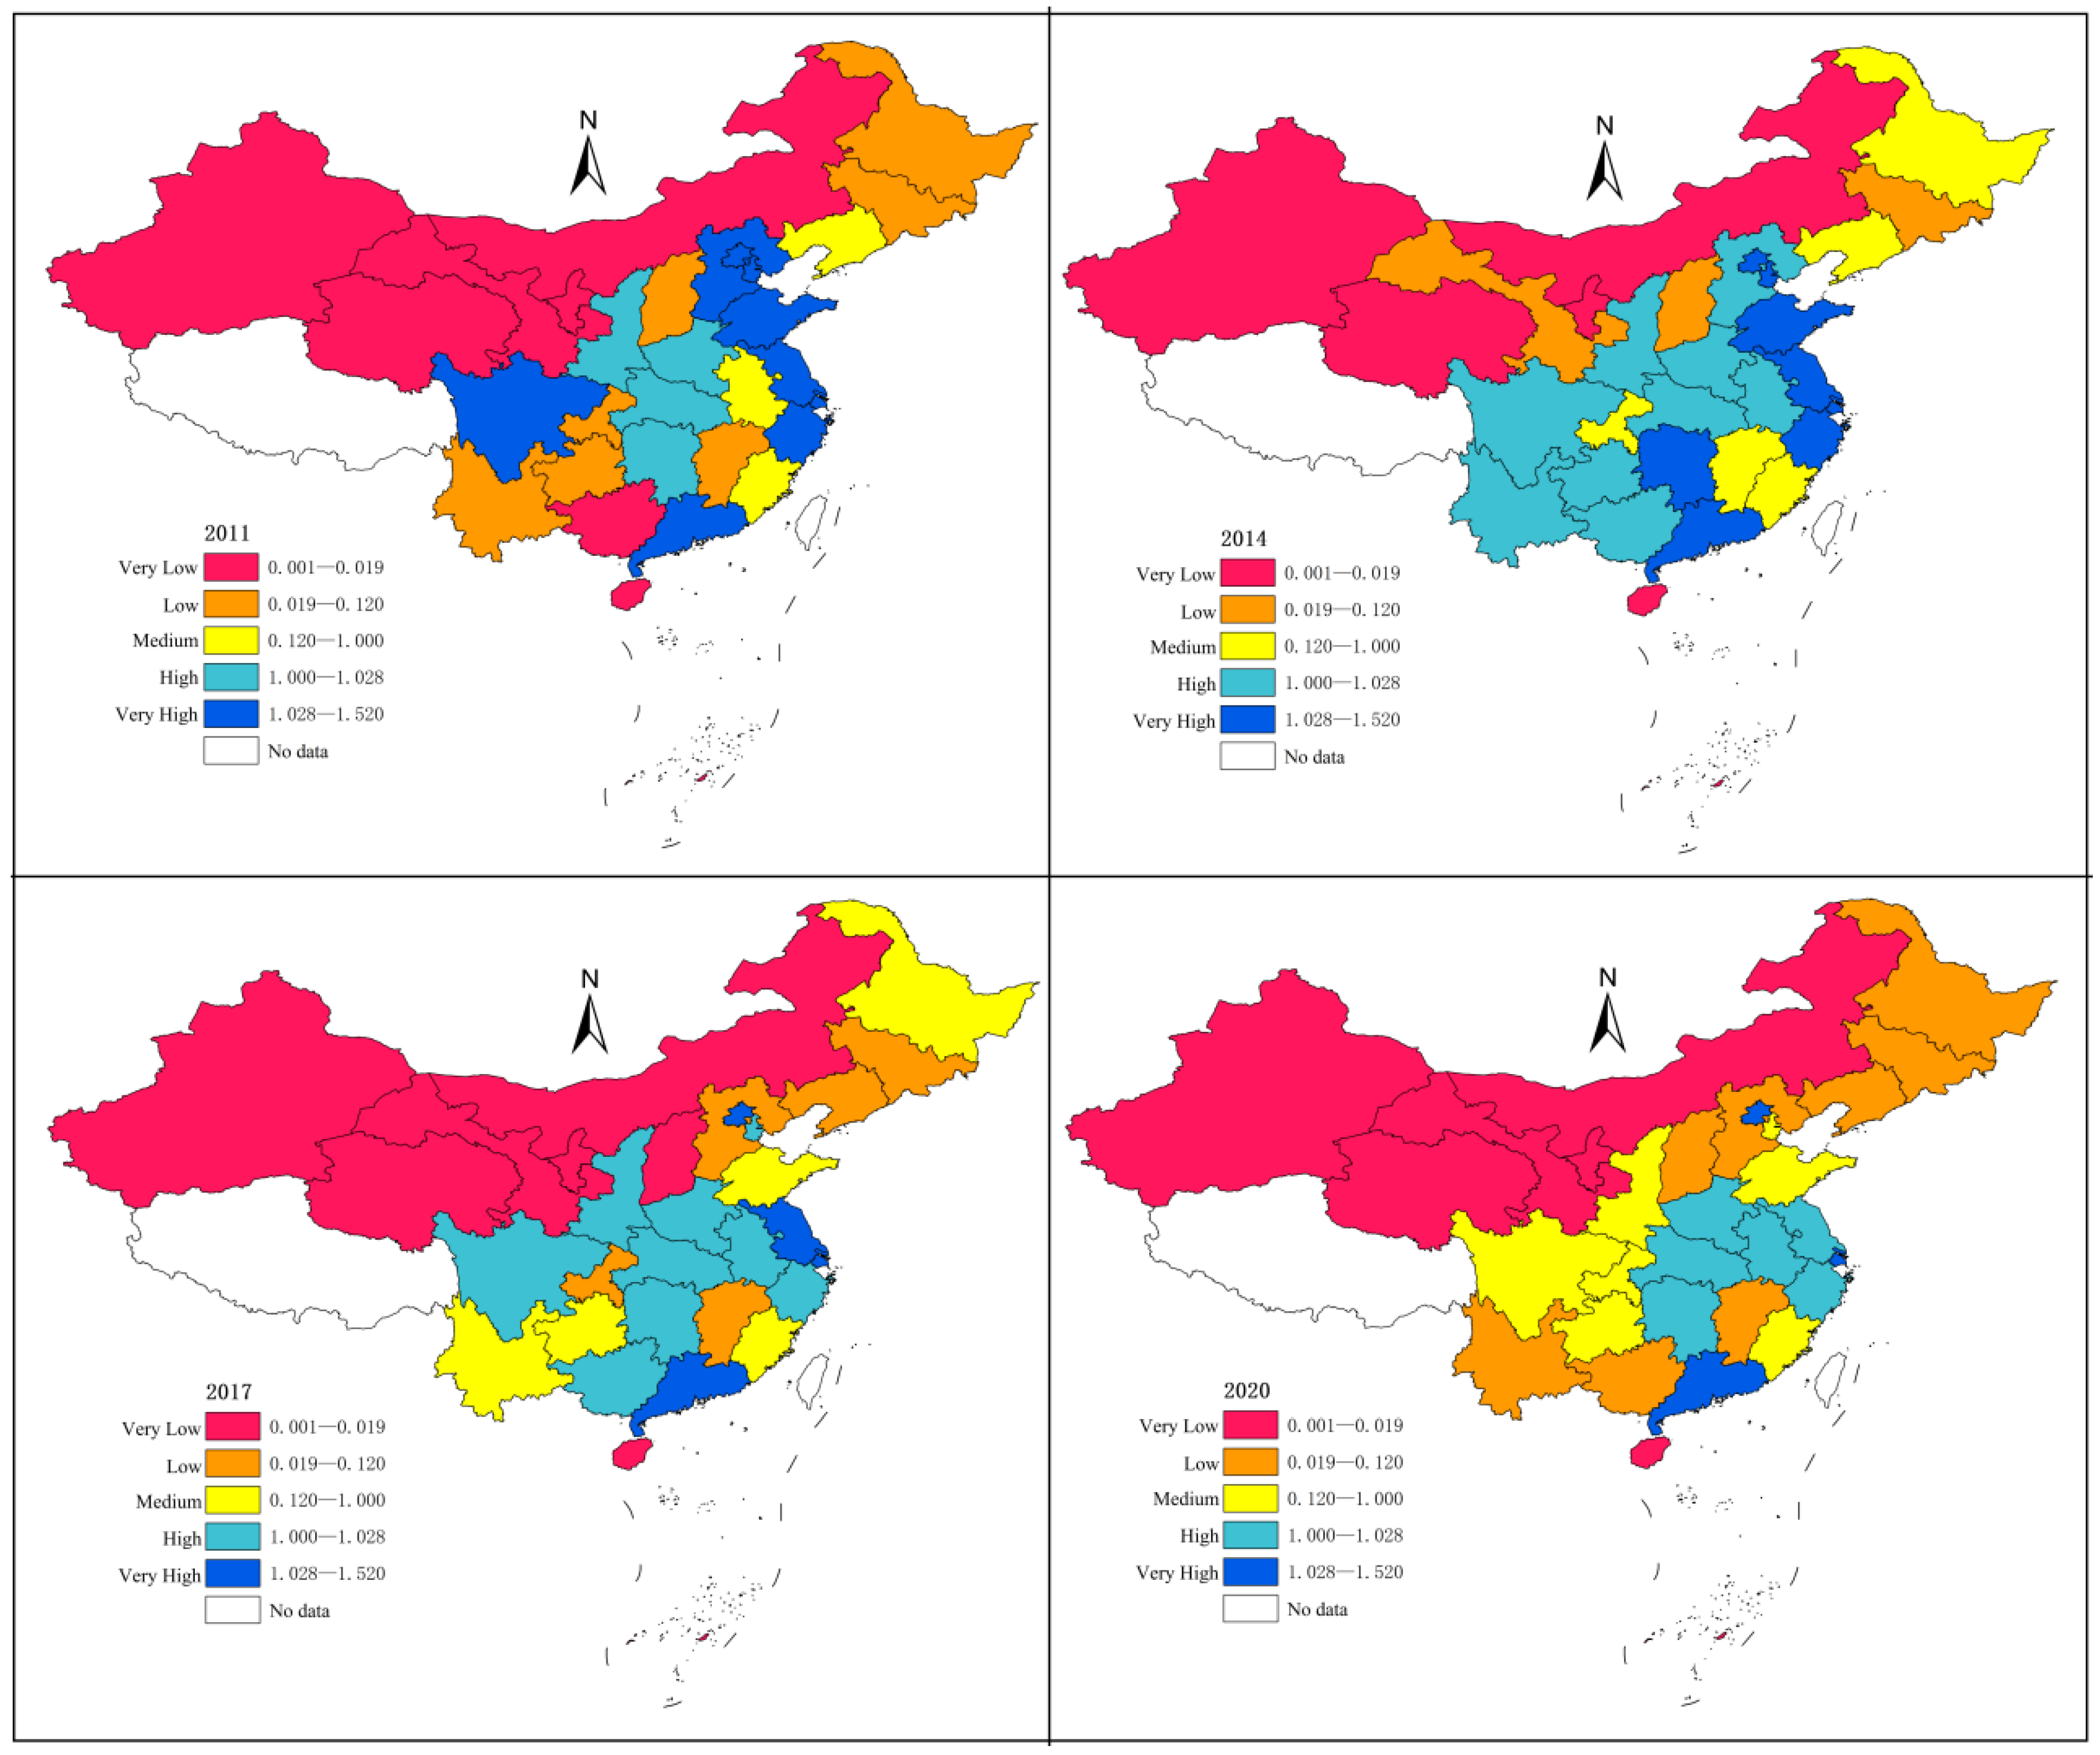
Spatial distribution analysis of new infrastructure input efficiency
To compare the geospatial layout and change characteristics of China’s new infrastructure input efficiency level, with the support of the ArcMap 10.5 software, the natural breakpoint method was used to compare 2011, 2014, 2017, and 2020. For 2020, the input efficiency of new infrastructure in the 30 provinces in China was graded and visualized. The natural breakpoint method is helpful to analyze the efficiency and structural distribution of new infrastructure investment, reflecting regional spatial differences, as shown in Figure 2 [73,74,75].
The results show that except for Hainan, the input efficiency of new infrastructure in Eastern China remains ahead, although the input efficiency of Hebei and Fujian is relatively backward compared with other provinces in Eastern China, but they are still ahead nationally.
There is a polarization in the efficiency of input in new infrastructure in Central China. Since 2014, Hubei, Hunan, Henan, and Anhui have all been at or below a “high level” in terms of input efficiency, while Shanxi and Jiangxi have been at a “low level” and below.
The input efficiency of new infrastructure in the western region is delimited to two regions. The first region is the five southwestern provinces and Shaanxi, namely Chongqing, Sichuan, Yunnan, Guizhou, Guangxi, and Shaanxi; the second region consists of five northwestern provinces, namely Gansu, Qinghai, Xinjiang, Ningxia, and Inner Mongolia. Group I’s Sichuan, Shaanxi, Guizhou, Yunnan and Guangxi were all at a “high level” in 2014 and then the input efficiency began to decline until it fell to a “medium level” and below. Chongqing has been at the “medium level” and below. In the second group, only Gansu was at a “low level” in 2014, while the others were at a “very low level”. Moreover, these provinces have a large area, so they form a large group of low-level agglomeration areas.
Northeastern China comprises three provinces, Heilongjiang, Jilin, and Liaoning, and the input efficiency of new infrastructure in these three provinces is similar; all of them are at a “low level” or “medium level” in the selected years, making this a medium-level region from a national perspective.

5.2.2. Analysis of Spatiotemporal Differences in Input Efficiency of New Infrastructure Based on High-Quality Development

(1)
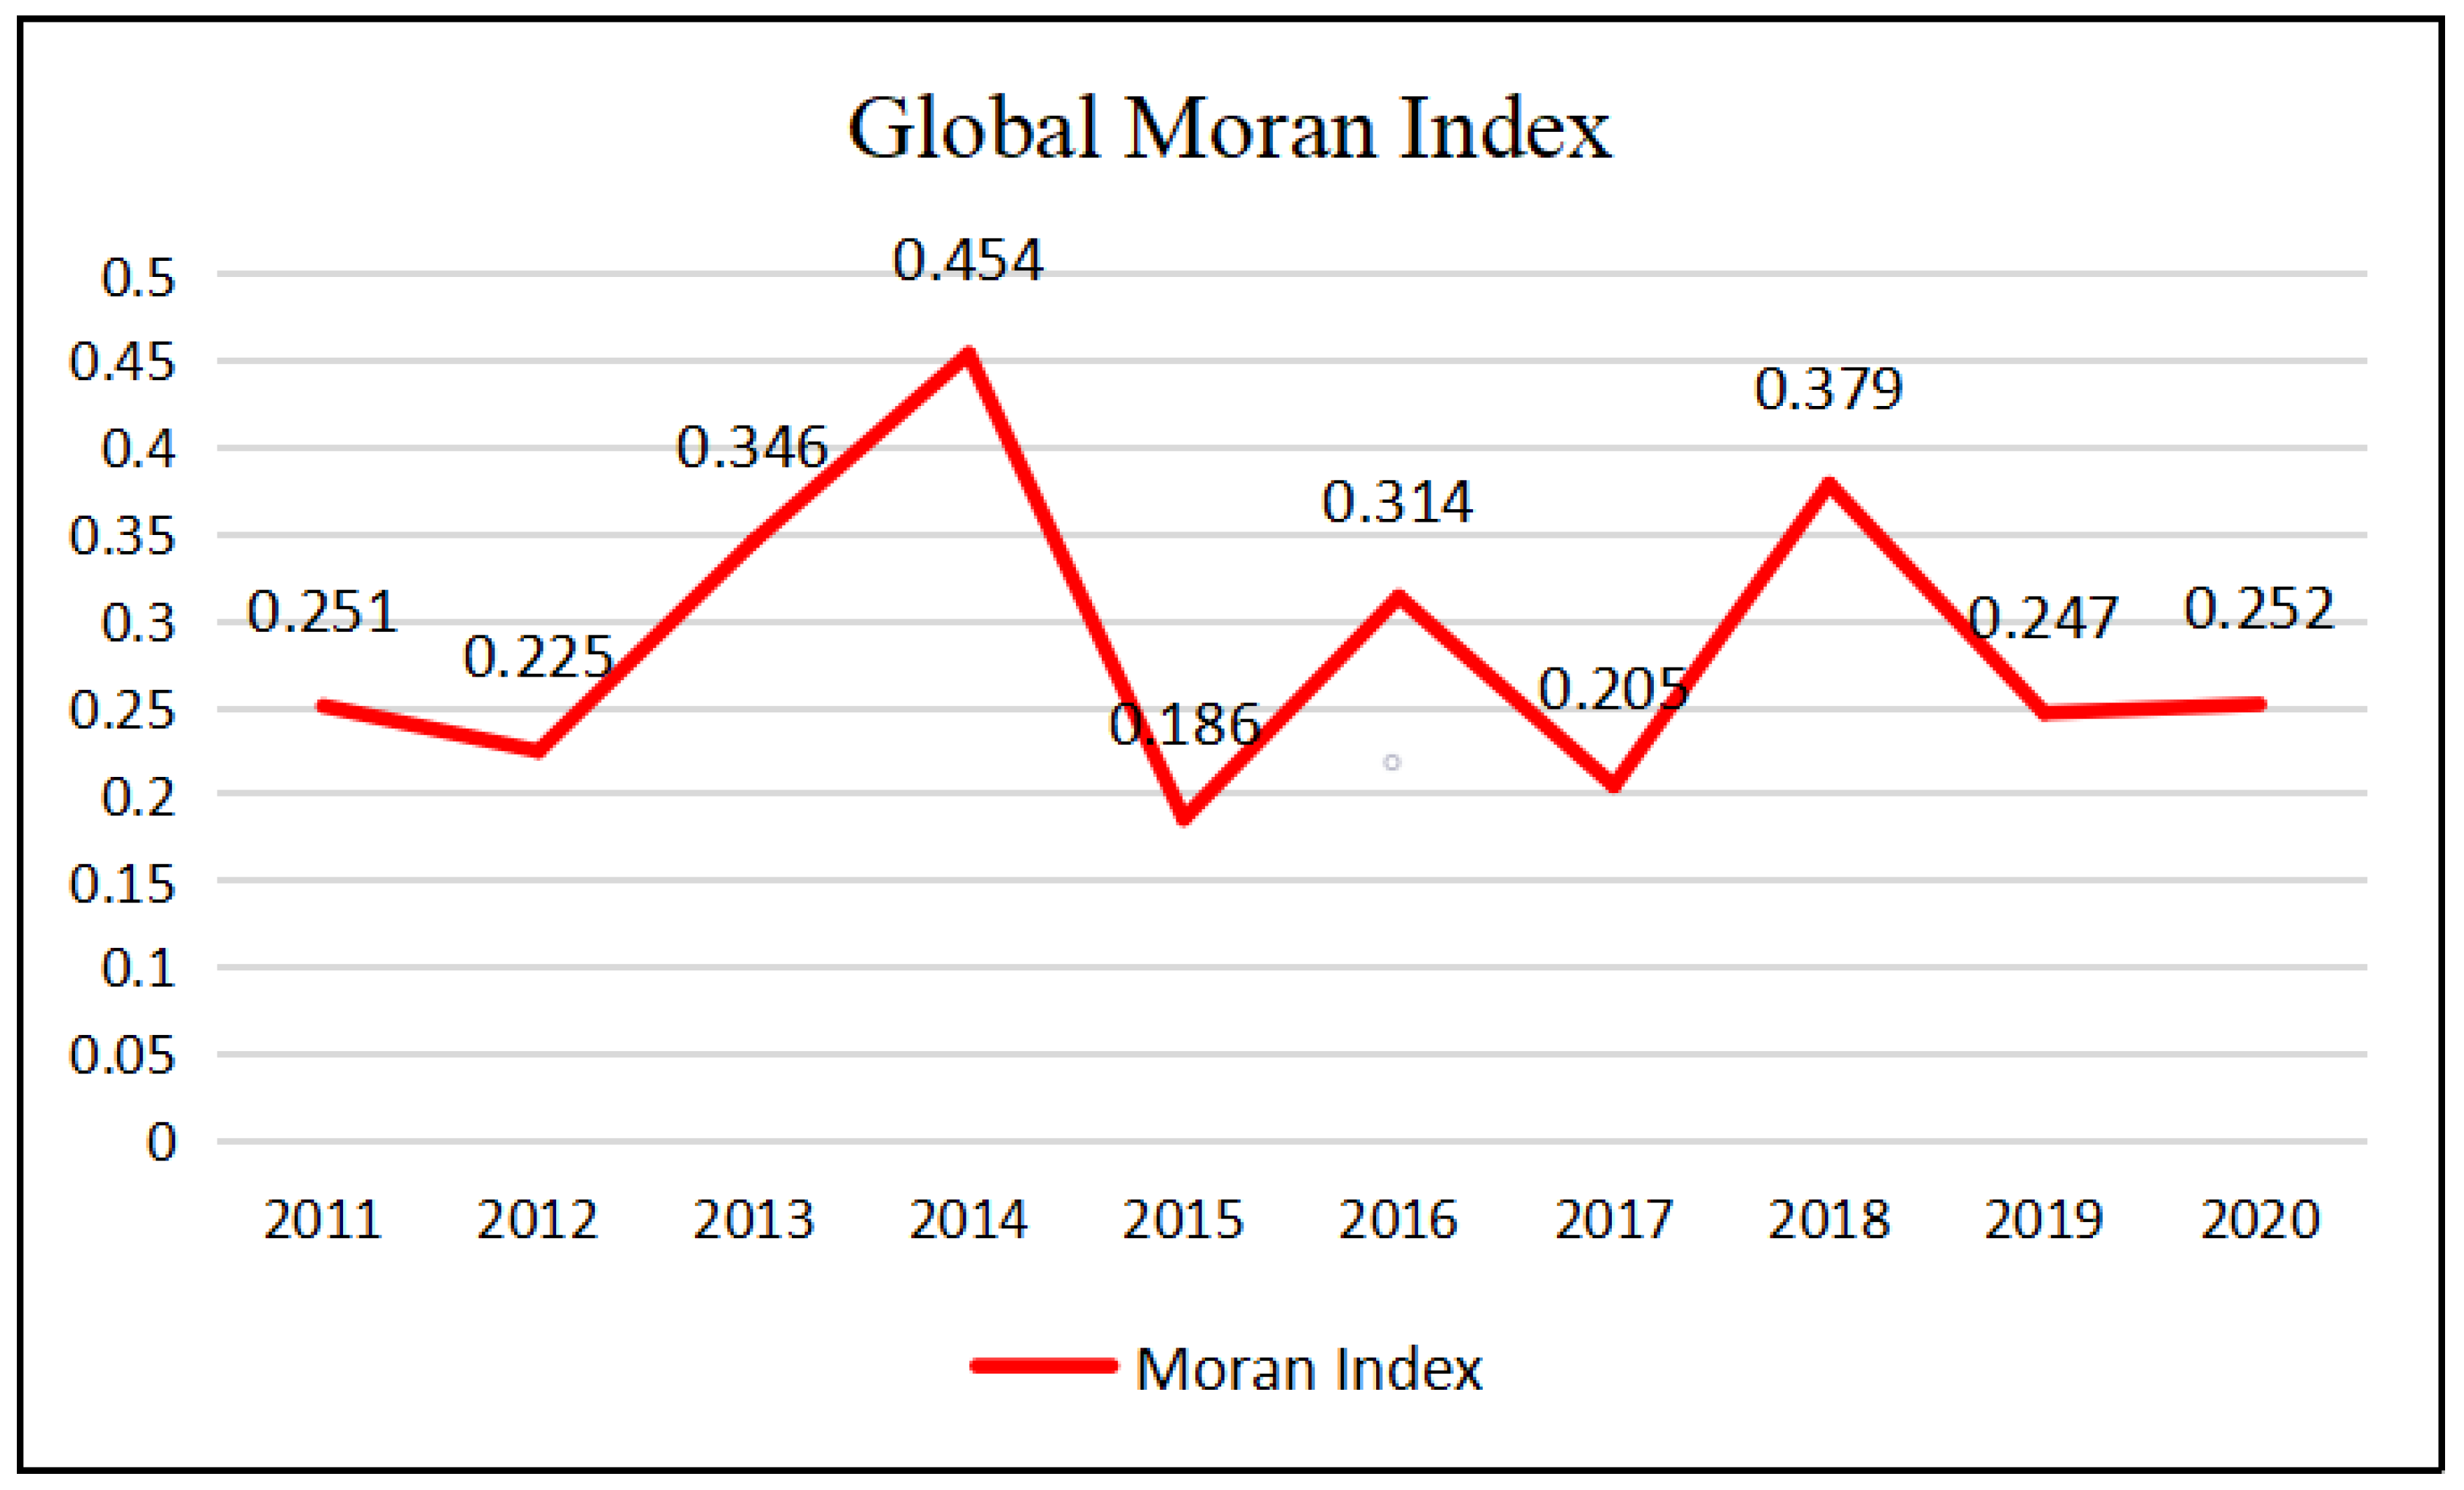
Global autocorrelation analysis of China’s new infrastructure input efficiency
The input efficiency of new infrastructure in every province in the country shows a spatial correlation, and the provinces do not develop independently when building new infrastructure, so it can be inferred that there may be a spatial correlation between provinces. This study calculates the global Moran index of China’s new infrastructure input efficiency from 2010 to 2020 with the help of the GeoDa software. Its spatial correlation is analyzed. See Figure 3 for details.
The global Moran index of China’s new infrastructure investment efficiency from 2010 to 2020 is greater than 0, and the results of 2012, 2015, and 2017 meet the 5% significance level test, while those of the other years satisfy the 1% significance level test. This explains why China’s new infrastructure input efficiency is not distributed randomly across space but has strong spatial aggregation, and the result rejects the hypothesis that space is irrelevant. From a timing perspective, the global Moran index of China’s new infrastructure input efficiency began to increase sharply in 2012, peaked at 0.454 in 2014, and then fell sharply in 2015; it fell to a minimum of 0.186. From 2015 to 2019, China’s new infrastructure input efficiency fluctuated and developed, and then stabilized.
(2)
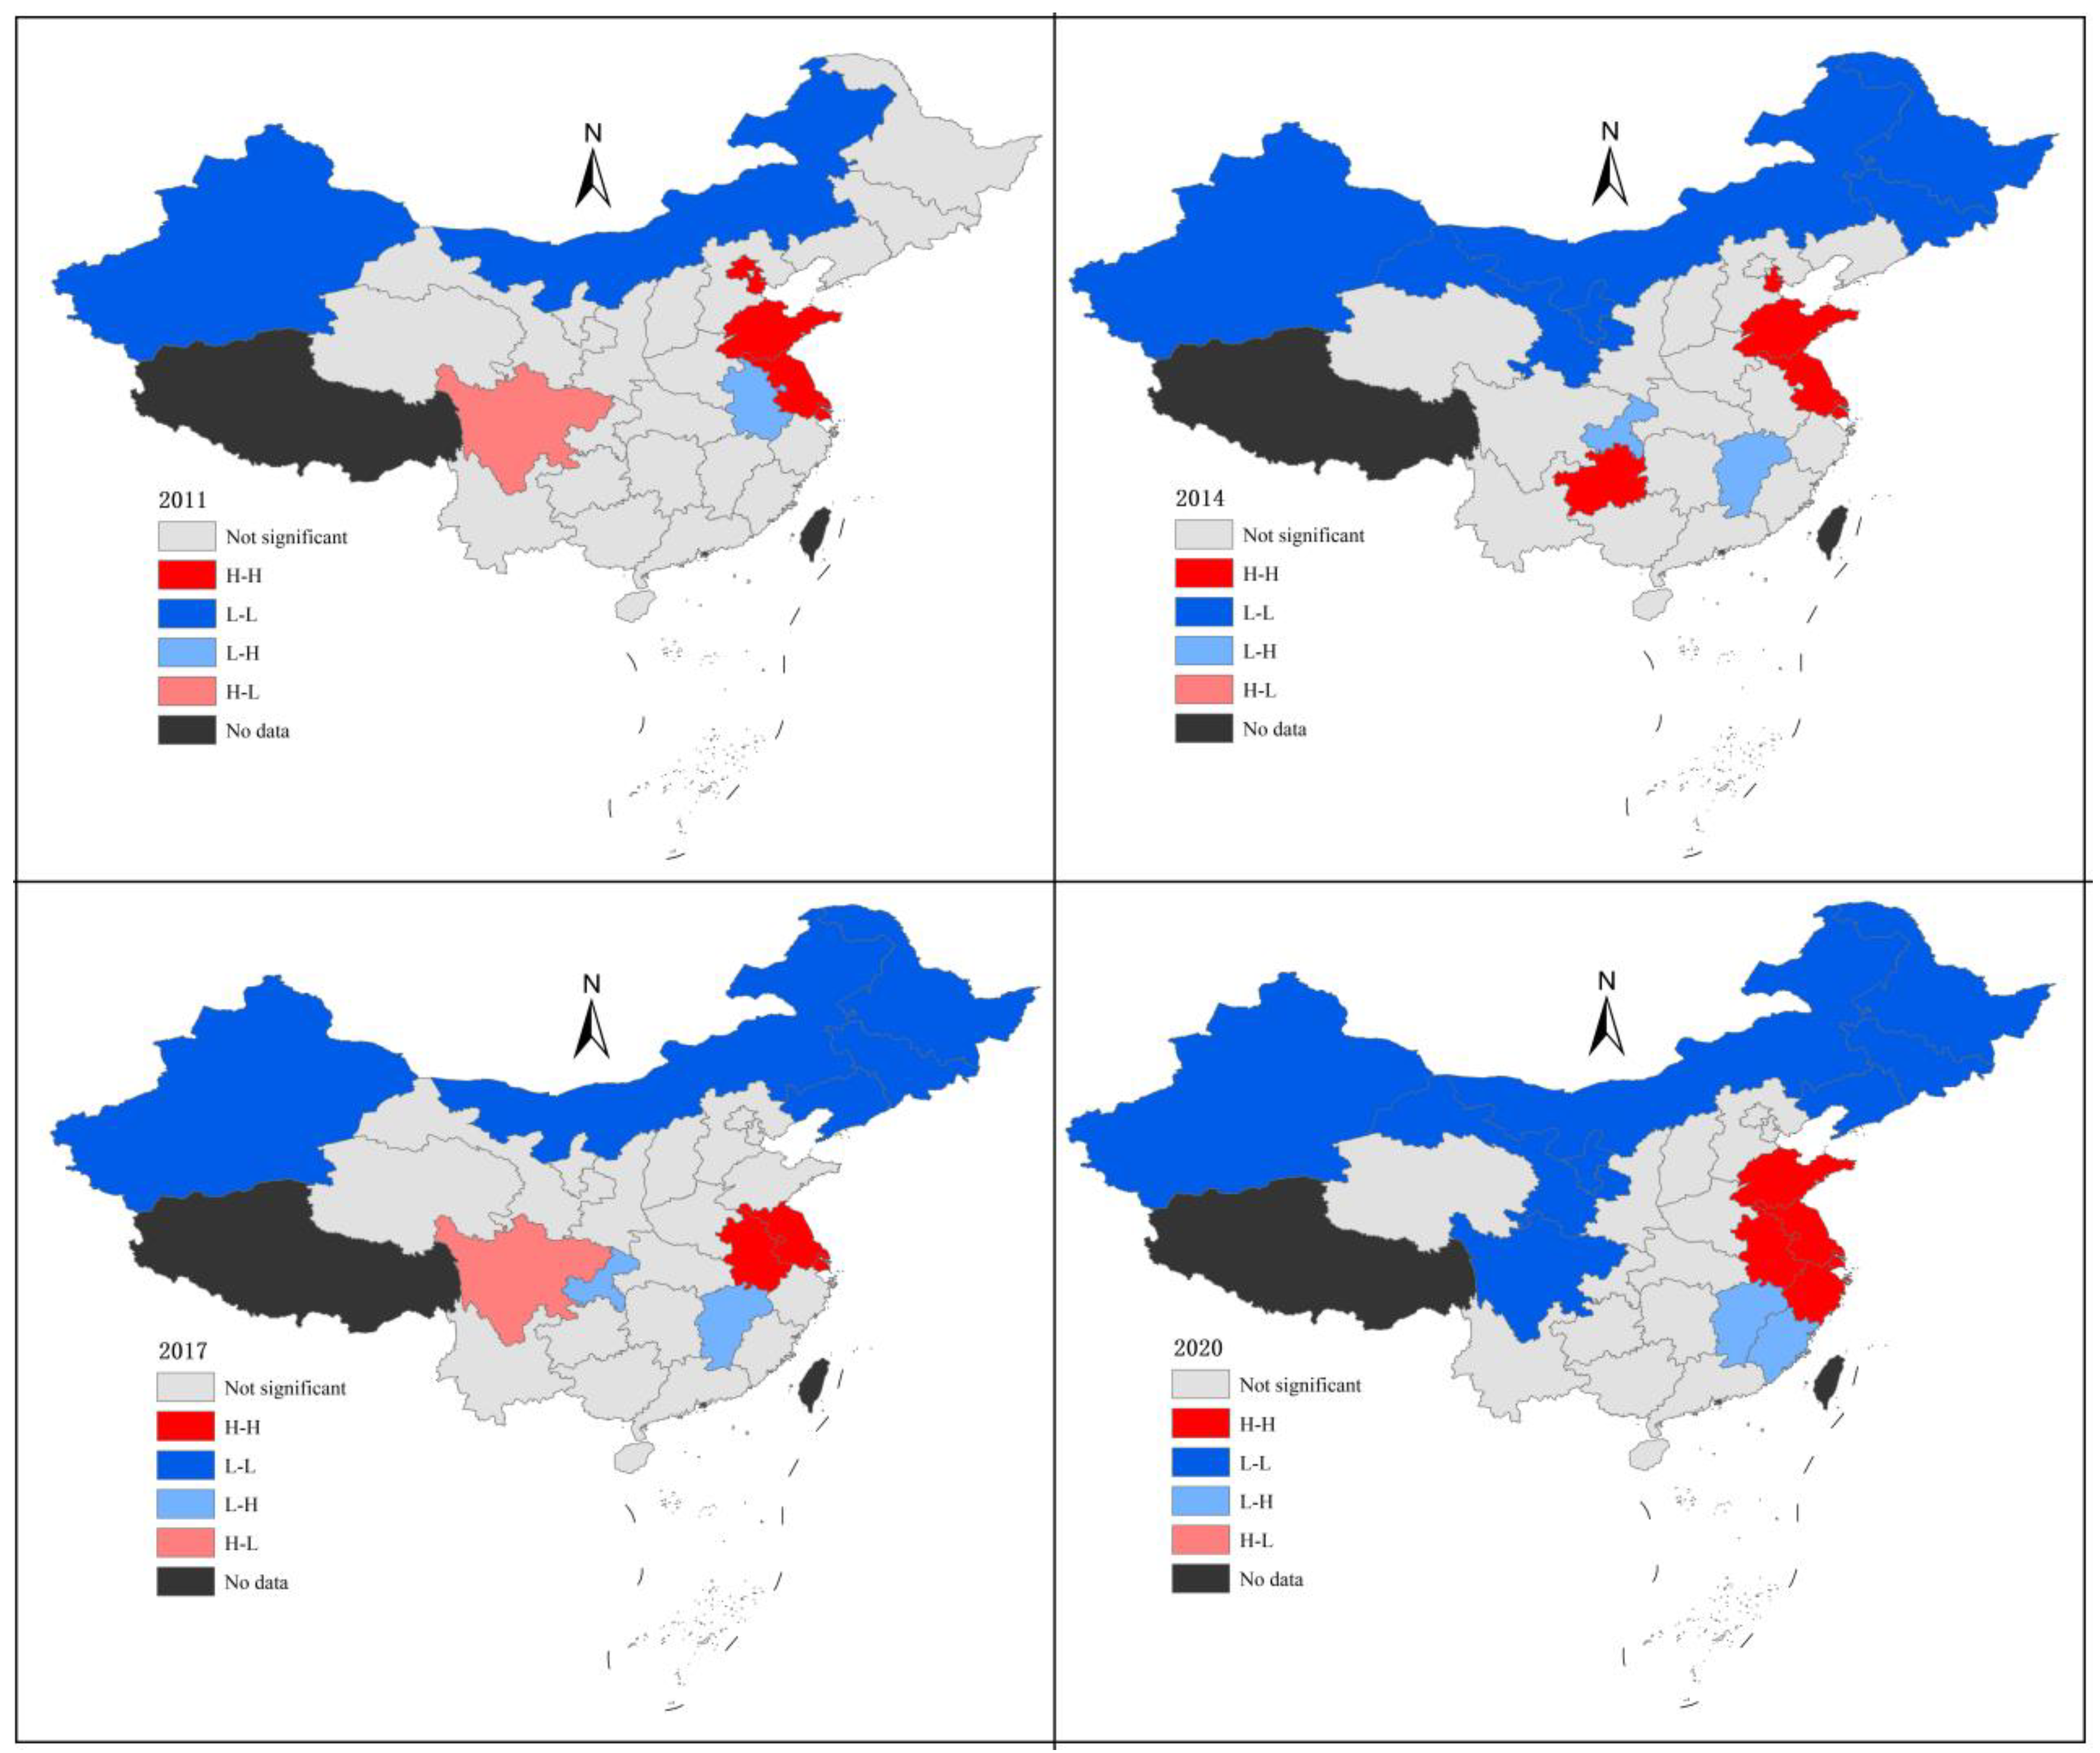
Local autocorrelation analysis of China’s new infrastructure input efficiency
The Linear System Analysis (LISA) agglomeration map was created using the GeoDa program in order to further examine the relevance of the input efficiency of new infrastructure in each province of China, as shown in Figure 4.
Among them, red represents high–high agglomeration areas, i.e., provinces and neighboring provinces that have higher input efficiency of new infrastructure, and the two are positively correlated. Light red represents high–low agglomeration areas, i.e., provinces that have higher input efficiency in new infrastructure while neighboring provinces have low input efficiency, and the two are negatively correlated and there is a spillover effect in space. Blue represents low–low agglomeration areas, i.e., the province itself and neighboring provinces are both low, and the two are positively correlated; light blue represents low–high agglomeration areas, i.e., provinces that have low input efficiency in new infrastructure while neighboring provinces have higher input efficiency, and the two are negatively correlated, which is spatially manifested as a “basin”. Gray indicates that the province is not significant; black indicates that there are no data for the province, and it is not considered in this study. The specific analysis is as follows.
The high–high agglomeration areas include Shandong and the Yangtze River Delta (Jiangsu, Shanghai, and Zhejiang), and Jiangsu, Shanghai, and Zhejiang have been in an effective state from 2010 to 2020, which indicates that the input efficiency of new infrastructure in these and neighboring provinces is relatively high. In 2020, it is ineffective, but the input efficiency is still the highest. The other two important urban agglomerations in Eastern China, the Beijing–Tianjin–Hebei region and the Guangdong–Hong Kong–Macao Greater Bay Area, are not high agglomeration areas, which shows that these two regions should increase their assistance to the surrounding areas while constantly improving themselves. Anhui in Central China is adjacent to the Yangtze River Delta, and, under its driving role, it was integrated into the high–high agglomeration area in 2017.
Low–low agglomeration areas include Xinjiang, Inner Mongolia, and Gansu in the western region, and the entirety of Northeastern China.
The provinces situated in the low–high agglomeration area are mainly Jiangxi and Chongqing, and Fujian also entered the low level in 2020. Fujian and Jiangxi are adjacent to the well-developed Yangtze River Delta and Guangdong, but they have not formed a good learning and cooperative relationship in terms of new infrastructure, and there is a gap between their own development and that of neighboring provinces. As a municipality directly under the central government, Chongqing, despite its social, political, and economic development, falls behind in the construction of new infrastructure compared to neighboring provinces.
As the only province belonging to the high–low agglomeration area, Sichuan, with its rich natural resources, labor quantity, and cost advantages, has become a leader in new infrastructure construction in the western region.

5.3. Analysis Summary

From the above analysis, it can be concluded that provinces with lower investment efficiency in new infrastructure are concentrated in the central, western, and northeastern regions. This study combines the analysis results and the actual situation of each province to explore the content that needs to be focused on.
The main provinces in the central region that need to accelerate the construction of new infrastructure are Shanxi and Jiangxi. Shanxi has a wide distribution of mineral resources, but there are problems such as low per capita energy consumption and serious pollution, which represent obstacles to the high-quality development of Shanxi. Shanxi could exploit the advantages of this region, attract foreign-funded enterprises to conduct business activities, keep improving the industrial structure, improve the eco-environment, and adhere to sustainable development. Jiangxi Province lacks large enterprises and has fewer employment opportunities than neighboring provinces, resulting in Jiangxi becoming a major labor-exporting province and failing to provide human capital assistance for new infrastructure construction. In addition, the new infrastructure construction-related industries are developing rapidly, and the demand for talent is growing rapidly, while the number of universities in Jiangxi Province is relatively small and there is a lack of talent training, resulting in poor talent quality at this stage. Therefore, Jiangxi should strengthen the formation of human capital and strengthen the attraction of talent.
The construction of new infrastructure in Northeastern China is in a relatively stable state, and economic development depends on agriculture and industry. In the previous development process of Northeastern China, the volume of the old industry was too large, emerging industries were at a small scale, and the economic drive was obviously deficient; the economic revitalization of the entirety of Northeastern China could not rely only on the transformation of old industries and enterprises. Therefore, Northeastern China should increase its input in new infrastructure construction; through the improvement of basic elements, this is a key measure to accelerate the northeast’s digital construction.
Compared to the others, the western region shows the largest gap in human capital, knowledge, and technology; lacks funds for economic development; and is affected by the topography, ecological environment, and other factors, resulting in relatively backward new infrastructure. Moreover, the input in new infrastructure in the western region mainly relies on government financial input, which is less able to attract financial and social capital, and financial support is relatively limited. Therefore, the western region should also narrow its gap with Eastern China and Central China and pursue similar prosperity in terms of continuing to promote infrastructure construction, adjusting the industrial structure, strengthening national preferential policies, and providing strong financial capital as a guarantee of support.

6. Policy Recommendations

Combined with the above analysis, this study summarizes the main problems in China as follows.
(1)
Shanxi and Jiangxi in Central China, Sichuan in the western region, and the entirety of Northeastern China should improve their industrial structure at a faster pace, improve the supporting role of new kinetic energy, and promote industrial upgrading.
(2)
Governments at all levels should propose corresponding policies in terms of policy heterogeneity, enterprises, talent, ecology, and other aspects in view of the different contents, patterns, and paths of the development of new infrastructure in different provinces, so as to promote the steady progress of new infrastructure.
(3)
Leading regions should further accelerate the construction of key areas of new infrastructure and improve the development speed of new infrastructure in surrounding areas through technology diffusion.
(4)
The western region, especially the five northwestern provinces, should continuously overcome the challenges brought by the eco-environment, seize the opportunity for new infrastructure construction, continue to address the insufficiency in traditional infrastructure, funds, and technology, and enhance the vitality and motivation of high-quality development.
Aiming at the above problems, this study puts forward relevant suggestions from four dimensions: improving the industrial structure, highlighting the government’s role, focusing on key areas, and compensating for weak links.

6.1. Optimize the Industrial Structure and Promote Industrial Upgrading

Similar to Shanxi, Sichuan, and Northeastern China, many regions around the world belong to resource-based areas (special types of areas developed by relying on natural wealth); due to a decreasing stock of resources and the singular economic structure of such regions, they are highly vulnerable to global market fluctuations and financial risks. Therefore, these regions should seize the opportunity for new infrastructure construction, develop smart industries, and optimize their industrial structures.
When carrying out industrial structure transformation in resource-based areas, they should not only consider the development status of cities but also fully consider the overall industrial development situation of the country, and guide high-pollution, high-energy-consumption enterprises to gradually transform their production and operation methods, take advantage of the high-level new ICT in the new infrastructure, promote industrial transformation through technological innovation, develop emerging industries, advance changes in industrial development toward the orientation of intelligence, and improve the industrial structure. For local national enterprises and large enterprises, it is necessary to take the initiative to play a leadership role in demonstration, understand marketplace dynamics in a timely manner through information technology, and rationally allocate resources, so as to expand the scale of development.
When promoting industrial upgrading, we should pay great attention to the intermediary benefit of new ICT innovation between industrial upgrading and new infrastructure construction, continue to provide resources and cutting-edge technologies, break technical barriers, and fundamentally clear obstacles for industrial upgrading and new infrastructure construction. First of all, all industries can achieve technological upgrading through new infrastructure; guide traditional industries to innovate and upgrade production, operation, and publicity methods through ICT; and accelerate the digital and intelligent transformation of enterprises by building smart factories, digital workshops, enterprise big data platforms, etc., to greatly improve the production efficiency and market competitiveness and build a modern industrial system.
Secondly, all industries should take advantage of the supporting and leading role of new infrastructure construction in industrial modernization and transition, rely on the advantages of various resources, and vigorously develop high-tech industries and other strategic new industries with highly professional capabilities, while eliminating the constraints of large-scale integrated circuits, high-end equipment, industrial information control systems, basic design software, etc., so as to achieve industrial upgrading and occupy the high end of the value chain.
Finally, under the current situation of vigorously developing new infrastructure in various regions, the input in funds and various resources is large, and the new infrastructure input structure should be optimized by adjusting the credit structure and tax structure, so as to realize the integration of agriculture, finance, transportation, education, medical care, and other industries with new infrastructure, thus following the trend of industrial chain integration and comprehensively enhancing the competitiveness of cities. Meanwhile, the government needs to place high value on the overall layout of new infrastructure resources in the region, try to avoid unnecessary input and construction, and maximize the social value of new infrastructure.

6.2. Give Scope to the Government to Improve All-Round Development

During the building of new infrastructure, the government should, on the one hand, play an incentive role, and, on the other hand, regularly play a major role as a decision-maker. The government should focus on the planning and design, resource integration, and policy guarantee of new infrastructure construction; fully absorb the lessons learned from the past infrastructure construction process; promote the successful model experience of new infrastructure, and realize high-quality development.
First, thanks to the return on scale, regions with a better degree of development are more likely to achieve the conversion from resources to income, while regions with relatively backward development have a weaker ability to accept policies. When building new infrastructure, the government should give enough consideration to the economic, social, and cultural differences between different regions, establish corresponding policies and laws according to local conditions, put forward the rational layout and key construction content of new infrastructure construction in a targeted manner, standardize and guide the development of new infrastructure, avoid homogeneous development, and accurately promote high-quality development.
Secondly, the development of new infrastructure can effectively lead the digital transformation of the industry and the close connection between new infrastructure and all walks of life should be strengthened. However, due to the fact that enterprises in different industries, sizes, and regions have different capacities and responsiveness when accepting policies, the government should coordinate their development and implement targeted development strategies. The government can supply a fully competitive market environment for all types of entities by optimizing the environment, balancing resources, and formulating preferential policies. At the same time, the government should promote collaboration among large businesses and small- and medium-sized enterprises (SMEs), increase financial and technical assistance for SMEs, encourage enterprises to accumulate material resources and human capital, increase labor income and enterprise productivity, bring mutual benefits and win–win cooperation, and improve high-quality development.
Then, the government needs to take note of the human capital agglomeration impact that can promote new infrastructure. The effect can not only promote ICT innovation but also promote industrial upgrading. The government should formulate more active, open, and effective talent support policies; improve the talent innovation incentive and assessment mechanism; and encourage the creativity and innovation ability of talent through policy support. Meanwhile, the government should strive to raise the quality of urbanization, attract high-quality talent and technologies, and realize industrial agglomeration in emerging economies, so as to improve high-quality development.
Finally, while the government promotes the construction of new infrastructure, it is also essential to appreciate the ecological environment and consider green environmental protection, and to vigorously develop green environmental protection technologies. Ecological environment problems have always been a major and difficult problem in China, and the goal of achieving carbon neutrality has also put forward new requirements for green technology innovation. The construction of new infrastructure should not only consider social and economic results, but also place an emphasis on ecological and environmental benefits. Governments should take advantage of the opportunity to build new infrastructure to supply a good environment for the innovation of green technologies, and promote the development of green environmental protection technologies.

6.3. Focus on Key Areas and Form Technology Diffusion

The distinction between new and old infrastructure is evident from the fact that new infrastructure is built with the concept of new development in mind and is driven by technical innovation; hence, ICT innovation has helped in the creation of new infrastructure. As a cutting-edge location for China’s new infrastructure construction, Eastern China is at the forefront of development in key areas of ICT. In addition, while continuously improving themselves, leading regions should also take the initiative to share the experiences explored and summarized in the construction process, provide assistance to regions in need of financial and technical support, and drive other regions to achieve common progress.
As the world promotes the construction of new infrastructure, emerging ICT is also being further developed and deepened. Therefore, the leading regions in China should focus on the domestic demand, accelerate digital construction by promoting the integration and innovation of ICT, accelerate the intelligent transformation of industrial enterprises, improve the standards of digital, networked, and intelligent construction in the manufacturing industry, and take advantage of the opportunities of the new technology revolution to pursue digital construction. At the same time, leading regions should deepen their international cooperation under the guarantee of relevant policies, learn from the advanced technologies and innovation experiences of developed countries and regions, and provide a greater development space for new infrastructure construction.
Second, through the sharing of talent and technology, advanced regions can enable more regions to obtain development opportunities and enjoy the fruits of development. Other regions can build on their own foundations and combine talent and technical support to help upgrade their industrial chains to high-tech, high-value links and improve the transformation of the industrial structure. This can not only address the imbalance of the industrial structure and improve the industrial upgrading and transformation capacity of the region, but also stimulate the development vitality and motivation of each region.
In addition, human capital can guarantee technological innovation, and regions wherein new infrastructure construction needs to increase the support of human capital should also fully consider factors such as policy preferences and the innovation environment to enhance the attractiveness and cultivation ability of talent, placing a specific emphasis on the quality advancement of talent, deepening the integrated advancement of talent, achieving a high-quality talent system, and pursuing policy exchange, talent sharing, and achievement sharing; this can serve to vigorously improve the innovation environment and provide a steady stream of power for new infrastructure construction and high-quality development.

6.4. Exploit the Opportunity for New Infrastructure Construction to Compensate for Weak Links in Development

Although the western region is limited by its geographical location and inconvenient transportation, it is unable to accept the driving role of Eastern China, but it is adjacent to some countries in Central Asia, West Asia, and South Asia. This makes it very important for the western region to seize the opportunity for new infrastructure construction and improve the high-quality social, economic, and technological progress of border areas in light of its own characteristics.
For the first time, the western region should attach importance to the opportunity for new infrastructure construction, accommodate the new development opportunities, attach importance to the integration of new infrastructure and traditional infrastructure, and use traditional infrastructure as the carrier to accelerate the digitalization and intelligent construction of transportation, medical care, and education in the region, so as to supply strong support for the development of the western region that is of a high standard. Meanwhile, the goal of new infrastructure construction is to find a high-quality development path suitable for the western region by developing scientific and effective short-, medium-, and long-term plans; promoting high-quality development; and closing the gap between the western region and China’s developed regions.
Second, the western region should attach importance to the mutually reinforcing relationship between economic development and the building of new infrastructure. On the one hand, the building of new infrastructure needs financial guarantees, and, at present, the economic support in the western region basically comes from government input. Social financing led by commercial banks should be strengthened, and a favorable environment for regional economic development and technological innovation should be provided by developing financial products related to new infrastructure construction and relying on the strength of third-party institutions. The development and utilization of new infrastructure can promote the integration of industrial chains, supply chains, and value chains between the western border areas and neighboring countries, continuously promote regional economic cooperation, improve the economic and trade levels of both sides, and provide new development methods for high-quality development.
Meanwhile, the western region can rely on the scientific and technological resources generated by the new infrastructure; fully integrate the new infrastructure with local industries; focus on big data, new materials, new energy, and other high-tech aspects; promote research and development, design, production, integration, and service levels; form industrial agglomeration linkages; and achieve breakthroughs in key industries.
In addition, the government should summarize the existing construction experience of high-tech development zones and economic development zones, combine the actual situation of the western region, give consideration to their respective advantages according to the positioning and functions of different cities, clarify the key points and construction paths of new infrastructure construction, improve the local carrying capacity and innovation capacity for new infrastructure construction, and hasten the pursuit of high-quality development, ensuring the vitality of new infrastructure development in the western region.

7. Conclusions

As the product of a new ICT and digital technology era, new infrastructure is expected to become one of the key foundations of digital advancement. The characteristics of the new infrastructure determine that it can be integrated and innovated with various industries and fields and can promote the country’s digital development in multiple dimensions. Meanwhile, the construction of new infrastructure can provide digital services, providing a steady stream of motivation for regions to attain high-quality development.
In this process, problems such as an unbalanced industrial structure, uncoordinated regional development, and insufficient momentum for regional development may arise. Therefore, it is necessary to identify solutions to these problems, so that we can efficiently improve the construction of China’s new infrastructure and promote China’s high-quality development.
This study used 30 provinces in China as measurement objects. In response to the current scenario in China, a new infrastructure input efficiency measuring index system was developed. The super-efficiency SBM model and Moran index approach was then utilized to evaluate and assess the input efficiency of new infrastructure, as well as its temporal and geographical variations, across the 30 Chinese provinces. Finally, based on the findings of the research, four policy recommendations are made: optimizing the industrial structure, highlighting the government’s engagement, focusing on critical sectors and compensating for weak linkages, and being dedicated to supporting China’s high-quality growth.
This study offers the following three contributions.
(1)
This study fully considers the classes of new infrastructure and new infrastructure’s effects on social, economic, and technological advancement; structures an appropriate evaluation indicator system for the input efficiency of new infrastructure, and closely integrates new infrastructure construction with high-quality development to promote its understanding and identify similarities and differences between theory and practice.
(2)
Building new infrastructure is only worthwhile if it is put to use and contributes to advancing economic and social progress; this study analyzes the input efficiency of new infrastructure through the SBM model, improves the study of the benefits of new infrastructure development from existing research, reveals important insights, and provides ideas for research after new infrastructure.
(3)
This study analyzes the space–time differences in the input efficiency of new infrastructure in different regions with the help of the Moran index, explores the advanced experience of leading regions, summarizes the potential problems of backward regions, and provides a basis for regional decision-makers who need to improve the level of new infrastructure input to formulate policies related to new infrastructure construction and high-quality development.
The study’s concepts, techniques, and preventative measures serve as a guide for the construction of new facilities and more research. This study attempts to provide a research idea for the evaluation of the construction level of new infrastructure; however, due to the diversity of DEA methods, the results obtained by different methods may vary. Therefore, in our follow-up research, we hope to use more DEA methods to improve the research on new infrastructure, comprehensively improve the input efficiency of new infrastructure, and achieve high-quality social, economic, and technological development.

Author Contributions

Conceptualization, X.S. and X.C.; methodology, S.W. and X.S.; software, X.C. and S.W.; validation, X.C., X.S. and S.W.; formal analysis, X.C. and S.W.; investigation, X.C. and S.W.; data curation, S.W. and Y.G.; writing—original draft preparation, X.C., S.W. and Y.G.; writing—review and editing, X.C., X.S. and S.W.; visualization, S.W. All authors have read and agreed to the published version of the manuscript.

Funding

The funding of this study was supported by the Natural Science Foundation of Shandong Province (ZR2020MG073).

Data Availability Statement

Not applicable.

Acknowledgments

The authors would like to thank the anonymous referees for their valuable comments and suggestions. At the same time, we ensured the originality of this research in the dimensions of data acquisition, analysis ideas and the writing of the text.

Conflicts of Interest

The authors declare no conflict of interest.

Appendix A

Table A1. Spearman correlation analysis results.
Variable NameX11X12X13X21X22X23X31X32X33
X111 (0.000 ***)
X120.328 (0.000 ***)1 (0.000 ***)
X130.921 (0.000 ***)0.164 (0.005 ***)1 (0.000 ***)
X210.087 (0.135)−0.014 (0.813)0.106 (0.067 *)1 (0.000 ***)
X220.888 (0.000 ***)0.255 (0.000 ***)0.847 (0.000 ***)0.21 (0.000 ***)1 (0.000 ***)
X230.646 (0.000 ***)0.001 (0.991)0.657 (0.000 ***)0.438 (0.000 ***)0.785 (0.000 ***)1 (0.000 ***)
X310.000 (0.999)0.404 (0.000 ***)−0.09 (0.122)−0.221 (0.000 ***)−0.088 (0.130)−0.298 (0.000 ***)1 (0.000 ***)
X320.24 (0.000 ***)−0.045 (0.438)0.317 (0.000 ***)0.075 (0.197)0.283 (0.000 ***)0.205 (0.000 ***)−0.428 (0.000 ***)1 (0.000 ***)
X330.241 (0.000 ***)0.125 (0.030 **)0.275 (0.000 ***)−0.036 (0.536)0.196 (0.001 ***)−0.035 (0.542)−0.143 (0.013 **)0.26 (0.000 ***)1 (0.000 ***)
Y110.152 (0.009 ***)−0.228 (0.000 ***)0.269 (0.000 ***)0.124 (0.032 **)0.286 (0.000 ***)0.387 (0.000 ***)−0.423 (0.000 ***)0.336 (0.000 ***)0.21 (0.000 ***)
Y120.926 (0.000 ***)0.139 (0.016 **)0.921 (0.000 ***)0.107 (0.065 *)0.891 (0.000 ***)0.725 (0.000 ***)−0.113 (0.051 *)0.273 (0.000 ***)0.213 (0.000 ***)
Y130.148 (0.010 **)−0.375 (0.000 ***)0.307 (0.000 ***)−0.012 (0.831)0.21 (0.000 ***)0.287 (0.000 ***)−0.241 (0.000 ***)0.105 (0.071 *)0.192 (0.001 ***)
Y140.496 (0.000 ***)0.034 (0.556)0.565 (0.000 ***)0.122 (0.035 **)0.606 (0.000 ***)0.559 (0.000 ***)−0.23 (0.000 ***)0.324 (0.000 ***)0.278 (0.000 ***)
Y210.177 (0.002 ***)−0.126 (0.030 **)0.351 (0.000 ***)−0.026 (0.656)0.113 (0.050 *)0.164 (0.005 ***)−0.236 (0.000 ***)0.136 (0.019 **)0.25 (0.000 ***)
Y22−0.149 (0.010 ***)−0.715 (0.000 ***)−0.011 (0.847)0.138 (0.017 **)−0.013 (0.820)0.252 (0.000 ***)−0.437 (0.000 ***)0.16 (0.006 ***)−0.092 (0.111)
Y230.304 (0.000 ***)−0.358 (0.000 ***)0.457 (0.000 ***)0.103 (0.075 *)0.375 (0.000 ***)0.45 (0.000 ***)−0.437 (0.000 ***)0.321 (0.000 ***)0.241 (0.000 ***)
Y240.408 (0.000 ***)−0.449 (0.000 ***)0.55 (0.000 ***)0.037 (0.528)0.39 (0.000 ***)0.42 (0.000 ***)−0.377 (0.000 ***)0.174 (0.002 ***)0.094 (0.105)
Y31−0.056 (0.331)−0.683 (0.000 ***)0.103 (0.076 *)0.069 (0.233)0.047 (0.417)0.239 (0.000 ***)−0.509 (0.000 ***)0.125 (0.031 **)0.033 (0.570)
Y320.486 (0.000 ***)−0.182 (0.002 ***)0.614 (0.000 ***)0.029 (0.618)0.513 (0.000 ***)0.468 (0.000 ***)−0.358 (0.000 ***)0.231 (0.000 ***)0.302 (0.000 ***)
Y330.384 (0.000 ***)−0.179 (0.002 ***)0.528 (0.000 ***)−0.011 (0.855)0.434 (0.000 ***)0.376 (0.000 ***)−0.325 (0.000 ***)0.305 (0.000 ***)0.276 (0.000 ***)
Y34−0.073 (0.206)−0.598 (0.000 ***)0.015 (0.801)0.037 (0.522)−0.023 (0.691)0.207 (0.000 ***)−0.092 (0.111)−0.202 (0.000 ***)−0.279 (0.000 ***)
Note: ***, **, * represent significance levels of 1%, 5%, and 10%, respectively.
Table A2. Spearman correlation analysis results.
Variable NameY11Y12Y13Y14Y21Y22Y23Y24Y31Y32Y33Y34
Y111 (0.000 ***)
Y120.326 (0.000 ***)1 (0.000 ***)
Y130.79 (0.000 ***)0.342 (0.000 ***)1 (0.000 ***)
Y140.833 (0.000 ***)0.635 (0.000 ***)0.682 (0.000 ***)1 (0.000 ***)
Y210.444 (0.000 ***)0.248 (0.000 ***)0.569 (0.000 ***)0.516 (0.000 ***)1 (0.000 ***)
Y220.597 (0.000 ***)0.074 (0.200)0.632 (0.000 ***)0.342 (0.000 ***)0.145 (0.012 **)1 (0.000 ***)
Y230.87 (0.000 ***)0.513 (0.000 ***)0.892 (0.000 ***)0.811 (0.000 ***)0.562 (0.000 ***)0.656 (0.000 ***)1 (0.000 ***)
Y240.495 (0.000 ***)0.561 (0.000 ***)0.683 (0.000 ***)0.51 (0.000 ***)0.564 (0.000 ***)0.49 (0.000 ***)0.754 (0.000 ***)1 (0.000 ***)
Y310.688 (0.000 ***)0.172 (0.003 ***)0.781 (0.000 ***)0.462 (0.000 ***)0.418 (0.000 ***)0.83 (0.000 ***)0.777 (0.000 ***)0.685 (0.000 ***)1 (0.000 ***)
Y320.667 (0.000 ***)0.634 (0.000 ***)0.735 (0.000 ***)0.799 (0.000 ***)0.738 (0.000 ***)0.368 (0.000 ***)0.817 (0.000 ***)0.786 (0.000 ***)0.646 (0.000 ***)1 (0.000 ***)
Y330.696 (0.000 ***)0.536 (0.000 ***)0.738 (0.000 ***)0.749 (0.000 ***)0.62 (0.000 ***)0.421 (0.000 ***)0.826 (0.000 ***)0.71 (0.000 ***)0.615 (0.000 ***)0.853 (0.000 ***)1 (0.000 ***)
Y340.379 (0.000 ***)0.118 (0.042 **)0.586 (0.000 ***)0.214 (0.000 ***)0.11 (0.058 *)0.776 (0.000 ***)0.511 (0.000 ***)0.515 (0.000 ***)0.721 (0.000 ***)0.332 (0.000 ***)0.344 (0.000 ***)1 (0.000 ***)
Note: ***, **, * represent significance levels of 1%, 5%, and 10%, respectively.

References

  1. Jiang, Z.; Wang, X.; Gong, X.; Zhang, X. What are the “new infrastructure” and related values? Open J. Bus. Manag. 2020, 8, 1483. [Google Scholar] [CrossRef]
  2. Wu, J.; Zhang, Y.; Shi, Z. Crafting a sustainable next generation infrastructure: Evaluation of China’s new infrastructure construction policies. Sustainability 2021, 13, 6245. [Google Scholar] [CrossRef]
  3. Zheng, H.; He, Y. How does industrial co-agglomeration affect high-quality economic development? Evidence from Chengdu-Chongqing Economic Circle in China. J. Clean. Prod. 2022, 371, 133485. [Google Scholar] [CrossRef]
  4. Chen, M.; Wang, H. Import technology sophistication and high-quality economic development: Evidence from city-level data of China. Econ. Res. Ekon. Istraživanja 2021, 35, 1106–1141. [Google Scholar] [CrossRef]
  5. Huang, X.; Binqing, C.A.I.; Yalin, L.I. Evaluation index system and measurement of high-quality development in China. Rev. Cercet. Interv. Soc. 2020, 68, 163. [Google Scholar] [CrossRef]
  6. Lan, J.; Wen, H. Industrial Digitalization and Energy Intensity: Evidence From China’s Manufacturing Sector. Energy Res. Lett. 2021, 2, 25733. [Google Scholar] [CrossRef]
  7. Kinash, I.; Andrusiv, U.; Popadynets, I.; Golovnia, O. Aspects of the formation and development of innovation infrastructure in Ukraine. Manag. Sci. Lett. 2019, 9, 2403–2414. [Google Scholar] [CrossRef]
  8. Grisot, M.; Hanseth, O.; Thorseng, A.A. Innovation of, in, on infrastructures: Articulating the role of architecture in information infrastructure evolution. J. Assoc. Inf. Syst. 2014, 15, 2. [Google Scholar] [CrossRef]
  9. Qiao, L.; Li, L.; Fei, J. Information infrastructure and air pollution: Empirical analysis based on data from Chinese cities. Econ. Anal. Policy 2022, 73, 563–573. [Google Scholar] [CrossRef]
  10. Ndubuisi, G.; Otioma, C.; Tetteh, G.K. Digital infrastructure and employment in services: Evidence from Sub-Saharan African countries. Telecommun. Policy 2021, 45, 102153. [Google Scholar] [CrossRef]
  11. Seshadri, D.R.; Davies, E.V.; Harlow, E.R.; Hsu, J.J.; Knighton, S.C.; Walker, T.A.; Drummond, C.K. Wearable sensors for COVID-19: A call to action to harness our digital infrastructure for remote patient monitoring and virtual assessments. Front. Digit. Health 2020, 2, 8. [Google Scholar] [CrossRef] [PubMed]
  12. Yan, X.; Li, T. Construction and application of urban digital infrastructure—Practice of “Urban Brain” in facing COVID-19 in Hangzhou, China. Eng. Constr. Archit. Manag. 2022; ahead-of-print. [Google Scholar] [CrossRef]
  13. Shin, D.H. Effective design in the development of public information infrastructure: A social constructionist approach. Inf. Polity 2006, 11, 85–100. [Google Scholar] [CrossRef]
  14. Škare, M.; Soriano, D.R. A dynamic panel study on digitalization and firm’s agility: What drives agility in advanced economies 2009–2018. Technol. Forecast. Soc. Change 2021, 163, 120418. [Google Scholar] [CrossRef]
  15. Gu, T.; Zhang, P.; Zhang, X. Spatio-temporal Evolution Characteristics and Driving Mechanism of the New Infrastructure Construction Development Potential in China. Chin. Geogr. Sci. 2021, 31, 646–658. [Google Scholar] [CrossRef]
  16. Mangone, G. Constructing hybrid infrastructure: Exploring the potential ecological, social, and economic benefits of integrating municipal infrastructure into constructed environments. Cities 2016, 55, 165–179. [Google Scholar] [CrossRef]
  17. Esfahani, H.S.; Ramírez, M.T. Institutions, infrastructure, and economic growth. J. Dev. Econ. 2003, 70, 443–477. [Google Scholar] [CrossRef]
  18. Ben, S.; Bosc, R.; Jiao, J.; Li, W.; Simonelli, F.; Zhang, R. Digital Infrastructure: Overcoming the Digital Divide in China and the European Union; Centre for European Policy Studies: Brussels, Belgium, 2017. [Google Scholar] [CrossRef]
  19. Zhang, D.; Xu, J.; Zhang, Y.; Wang, J.; He, S.; Zhou, X. Study on sustainable urbanization literature based on Web of Science, scopus, and China national knowledge infrastructure: A scientometric analysis in CiteSpace. J. Clean. Prod. 2020, 264, 121537. [Google Scholar] [CrossRef]
  20. Charnes, A.; Cooper, W.W.; Rhodes, E. Measuring the efficiency of decision making units. Eur. J. Oper. Res. 1978, 2, 429–444. [Google Scholar] [CrossRef]
  21. Tone, K. A strange case of the cost and allocative efficiencies in DEA. J. Oper. Res. Soc. 2002, 53, 1225–1231. [Google Scholar] [CrossRef]
  22. Gökgöz, F.; Erkul, E. Investigating the energy efficiencies of European countries with super efficiency model and super SBM approaches. Energy Effic. 2019, 12, 601–618. [Google Scholar] [CrossRef]
  23. Tian, N.; Tang, S.; Che, A.; Wu, P. Measuring regional transport sustainability using super-efficiency SBM-DEA with weighting preference. J. Clean. Prod. 2020, 242, 118474. [Google Scholar] [CrossRef]
  24. Huang, Y.; Huang, X.; Xie, M.; Cheng, W.; Shu, Q. A study on the effects of regional differences on agricultural water resource utilization efficiency using super-efficiency SBM model. Sci. Rep. 2021, 11, 9953. [Google Scholar] [CrossRef]
  25. Zhang, C.; Feng, Z.; Ren, Q.; Hsu, W.L. Using systems thinking and modelling: Ecological land utilisation efficiency in the Yangtze Delta in China. Systems 2022, 10, 16. [Google Scholar] [CrossRef]
  26. Chen, Y.; Liu, L. Improving eco-efficiency in coal mining area for sustainability development: An emergy and super-efficiency SBM-DEA with undesirable output. J. Clean. Prod. 2022, 339, 130701. [Google Scholar] [CrossRef]
  27. Fotheringham, A.S. “The problem of spatial autocorrelation” and local spatial statistics. Geogr. Anal. 2009, 41, 398–403. [Google Scholar] [CrossRef]
  28. Zhang, J.; Zhang, K.; Zhao, F. Research on the regional spatial effects of green development and environmental governance in China based on a spatial autocorrelation model. Struct. Change Econ. Dyn. 2020, 55, 1–11. [Google Scholar] [CrossRef]
  29. Soltani, A.; Askari, S. Exploring spatial autocorrelation of traffic crashes based on severity. Injury 2017, 48, 637–647. [Google Scholar] [CrossRef]
  30. Keck, F.; Rimet, F.; Bouchez, A.; Franc, A. phylosignal: An R package to measure, test, and explore the phylogenetic signal. Ecol. Evol. 2016, 6, 2774–2780. [Google Scholar] [CrossRef]
  31. Liu, J.; Ruan, Z.; Gao, X.; Yuan, Y.; Dong, S. Quantifying contribution of weather patterns to PM2. 5 concentrations based on spatial effects and health risk assessment. Sustain. Cities Soc. 2022, 83, 103980. [Google Scholar] [CrossRef]
  32. Li, X.; Stringer, L.C.; Dallimer, M. The role of blue green infrastructure in the urban thermal environment across seasons and local climate zones in East Africa. Sustain. Cities Soc. 2022, 80, 103798. [Google Scholar] [CrossRef]
  33. Yan, D.; Wu, S.; Zhou, S.; Li, F.; Wang, Y. Healthy city development for Chinese cities under dramatic imbalance: Evidence from 258 cities. Sustain. Cities Soc. 2021, 74, 103157. [Google Scholar] [CrossRef]
  34. Liu, L.Q.; Liu, K.L.; Zhang, T.; Mao, K.; Lin, C.Q.; Gao, Y.F.; Xie, B.C. Spatial characteristics and factors that influence the environmental efficiency of public buildings in China. J. Clean. Prod. 2021, 322, 128842. [Google Scholar] [CrossRef]
  35. Kusumah, H.; Wasesa, M. Unraveling the Most Influential Determinants of Residential Segregation in Jakarta: A Spatial Agent-Based Modeling and Simulation Approach. Systems 2023, 11, 20. [Google Scholar] [CrossRef]
  36. Rexwhite Enakrire, T.; Onyenania, O.G. Factors affecting the development of information infrastructure in Africa. Libr. Hi Tech News 2007, 24, 15–20. [Google Scholar] [CrossRef]
  37. Luo, H.; Qu, X. Export Trade, Absorptive Capacity, and High-Quality Economic Development in China. Systems 2023, 11, 54. [Google Scholar] [CrossRef]
  38. Han, L.; Shi, W.; Wang, B.; Zhang, P.; Li, X. Development of an integrated air conditioner with thermosyphon and the application in mobile phone base station. Int. J. Refrig. 2013, 36, 58–69. [Google Scholar] [CrossRef]
  39. Tao, G.; Chi, T.H.; Zheng, G.X. Design and study of GIS-based optical cable information system. In Proceedings of the 2010 International Conference on Internet Technology and Applications 2010, Wuhan, China, 20–22 August 2010; pp. 1–4. [Google Scholar] [CrossRef]
  40. Kihl, M.; Ödling, P.; Lagerstedt, C.; Aurelius, A. Traffic analysis and characterization of Internet user behavior. In Proceedings of the International Congress on Ultra Modern Telecommunications and Control Systems, Moscow, Russia, 18–20 October 2010; pp. 224–231. [Google Scholar] [CrossRef]
  41. Tilson, D.; Lyytinen, K.; Sorensen, C. Desperately seeking the infrastructure in IS research: Conceptualization of “digital convergence” as co-evolution of social and technical infrastructures. In Proceedings of the 2010 43rd Hawaii International Conference on System Sciences, Honolulu, HA, USA, 5–8 January 2010; pp. 1–10. [Google Scholar] [CrossRef]
  42. Wen, H.; Lee, C.C.; Song, Z. Digitalization and environment: How does ICT affect enterprise environmental performance? Environ. Sci. Pollut. Res. 2021, 28, 54826–54841. [Google Scholar] [CrossRef]
  43. Matt, D.T.; Pedrini, G.; Bonfant, A.; Orzes, G. Industrial digitalization. A systematic literature review and research agenda. Eur. Manag. J. 2022, 41, 47–78. [Google Scholar] [CrossRef]
  44. Zhao, X. Research on management informatization construction of electric power enterprise based on big data technology. Energy Rep. 2022, 8, 535–545. [Google Scholar] [CrossRef]
  45. Nagy, J.; Oláh, J.; Erdei, E.; Máté, D.; Popp, J. The role and impact of Industry 4.0 and the internet of things on the business strategy of the value chain—The case of Hungary. Sustainability 2018, 10, 3491. [Google Scholar] [CrossRef]
  46. Tsimonis, G.; Dimitriadis, S. Brand strategies in social media. Mark. Intell. Plan. 2014, 32, 328–344. [Google Scholar] [CrossRef]
  47. Mhlanga, D. Artificial intelligence in the industry 4.0, and its impact on poverty, innovation, infrastructure development, and the sustainable development goals: Lessons from emerging economies? Sustainability 2021, 13, 5788. [Google Scholar] [CrossRef]
  48. Nalivaychenko, E.; Kirilchuk, S. The development of methods for the innovation infrastructure progress in crimea region. J. Adv. Res. Law Econ. 2017, 8, 1226. [Google Scholar]
  49. Sánchez-Sellero, P.; Bataineh, M.J. How RD cooperation, RD expenditures, public funds and RD intensity affect green innovation? Technol. Anal. Strateg. Manag. 2022, 34, 1095–1108. [Google Scholar] [CrossRef]
  50. Inekwe, J.N. The contribution of RD expenditure to economic growth in developing economies. Soc. Indic. Res. 2015, 124, 727–745. [Google Scholar] [CrossRef]
  51. Huang, Z. Research on Innovation Capability of Regional Innovation System Based on Fuzzy-Set Qualitative Comparative Analysis: Evidence from China. Systems 2022, 10, 220. [Google Scholar] [CrossRef]
  52. Wang, X.; Wan, T.; Yang, Q.; Zhang, M.; Sun, Y. Research on innovation non-equilibrium of Chinese urban agglomeration based on SOM neural network. Sustainability 2021, 13, 9506. [Google Scholar] [CrossRef]
  53. Chen, Y.; Yang, Z.; Shu, F.; Hu, Z.; Meyer, M.; Bhattacharya, S. A patent based evaluation of technological innovation capability in eight economic regions in PR China. World Pat. Inf. 2009, 31, 104–110. [Google Scholar] [CrossRef]
  54. Sarangi, A.K.; Pradhan, R.P. ICT infrastructure and economic growth: A critical assessment and some policy implications. Decision 2020, 47, 363–383. [Google Scholar] [CrossRef]
  55. Guo, F.; Wang, J.; Wang, F.; Kong, T.; Zhang, X.; Cheng, Z. Measuring the development of digital inclusive finance in China: Index compilation and spatial characteristics. Economics 2020, 19, 1401–1418. [Google Scholar] [CrossRef]
  56. Ojo, A.O.; Raman, M.; Downe, A.G. Toward green computing practices: A Malaysian study of green belief and attitude among Information Technology professionals. J. Clean. Prod. 2019, 224, 246–255. [Google Scholar] [CrossRef]
  57. Peng, G.; Wang, Y.; Han, G. Information technology and employment: The impact of job tasks and worker skills. J. Ind. Relat. 2018, 60, 201–223. [Google Scholar] [CrossRef]
  58. Wang, D.; Zhang, E.; Liao, H. Does Fiscal Decentralization Affect Regional High-Quality Development by Changing Peoples’ Livelihood Expenditure Preferences: Provincial Evidence from China. Land 2022, 11, 1407. [Google Scholar] [CrossRef]
  59. Jiao, C.; Dong, L. The Path to Common Prosperity: Rising Social Construction and Livelihood Expenditure. Soc. Sci. China 2022, 43, 60–77. [Google Scholar] [CrossRef]
  60. Yang, S.; Li, X. Measurement Method of Digital Economy Scale in China. In Proceedings of the 2021 International Conference on Public Management and Intelligent Society (PMIS), Shanghai, China, 26–28 February 2021; pp. 358–362. [Google Scholar] [CrossRef]
  61. Frolova, E.E.; Polyakova, T.A.; Dudin, M.N.; Rusakova, E.P.; Kucherenko, P.A. Information security of Russia in the digital economy: The economic and legal aspects. J. Adv. Res. Law Econ. 2018, 9, 89. [Google Scholar] [CrossRef]
  62. Mandych, I.A.; Bykova, A.V. Trends in innovation and input development of high-tech enterprises. Russ. Technol. J. 2019, 7, 79–92. [Google Scholar] [CrossRef]
  63. Dubitskaya, E.; Tcukanova, O. Analysis of the influence of external environmental factors on the development of high-tech enterprises. In Proceedings of the MATEC Web of Conferences. 2018, 170, p. 01027. Available online: https://www.matec-conferences.org/articles/matecconf/abs/2018/29/matecconf_spbwosce2018_01027/matecconf_spbwosce2018_01027.html (accessed on 1 May 2023). [CrossRef]
  64. Cao, C.; Zhu, X. Development Trend of Scientific Research and Technical Service Industry with Contribution Analysis to Tertiary Industry. In Proceedings of the 2021 IEEE 6th International Conference on Cloud Computing and Big Data Analytics, Chengdu, China, 24–26 April 2021; pp. 563–567. [Google Scholar] [CrossRef]
  65. Li, C. A Empirical Analysis on Performance Evaluation of the Tertiary Industry in Eastern Chinese Province Based on DEA. Stud. Math. Sci. 2012, 5, 105–112. [Google Scholar]
  66. Wang, X.; Zhao, H.; Bi, K. The measurement of green finance index and the development forecast of green finance in China. Environ. Ecol. Stat. 2021, 28, 263–285. [Google Scholar] [CrossRef]
  67. Liu, R.; Wang, D.; Zhang, L.; Zhang, L. Can green financial development promote regional ecological efficiency? A case study of China. Nat. Hazards 2019, 95, 325–341. [Google Scholar] [CrossRef]
  68. Sun, Z.; Wang, X.; Liang, C.; Cao, F.; Wang, L. The impact of heterogeneous environmental regulation on innovation of high-tech enterprises in China: Mediating and interaction effect. Environ. Sci. Pollut. Res. 2021, 28, 8323–8336. [Google Scholar] [CrossRef]
  69. Batkovskiy, A.M.; Klochkov, V.V.; Semenova, E.G.; Fomina, A.V.; Cherner, N.V. Problems of coordination of high-tech enterprises strategies in implementation of innovative technologies. Mediterr. J. Soc. Sci. 2015, 6, 172. [Google Scholar] [CrossRef]
  70. Ghina, A.; Sinaryanti, I. The Learning Evaluation of Business Incubator’s Role in Developing Technology-Based Startups at Technology Business Incubator. Asian J. Technol. Manag. 2021, 14, 35–57. [Google Scholar] [CrossRef]
  71. Bismala, L.; Andriany, D.; Siregar, G. Development strategy analysis of technology business incubator in small medium enterprises accompaniment. J. Crit. Rev. 2020, 7, 221–225. [Google Scholar] [CrossRef]
  72. Arora, A.; Gambardella, A. The market for technology. Handb. Econ. Innov. 2010, 1, 641–678. [Google Scholar] [CrossRef]
  73. Cong, X.; Wang, S.; Wang, L.; Šaparauskas, J.; Górecki, J.; Skibniewski, M.J. Allocation Efficiency Measurement and Spatio-Temporal Differences Analysis of Digital Infrastructure: The Case of China’s Shandong Province. Systems 2022, 10, 205. [Google Scholar] [CrossRef]
  74. Xu, W.; Yu, W.; Jing, S.; Zhang, G.; Huang, J. Debris flow susceptibility assessment by GIS and information value model in a large-scale region, Sichuan Province (China). Nat. Hazards 2013, 65, 1379–1392. [Google Scholar] [CrossRef]
  75. Jenks, G.F. Generalization in statistical mapping. Ann. Assoc. Am. Geogr. 1963, 53, 15–26. [Google Scholar] [CrossRef]
Figure 1. Line chart of new infrastructure input efficiency in four major regions of China.
Systems 11 00243 g001
Figure 2. Efficiency rating of China’s new infrastructure input.
Systems 11 00243 g002
Figure 3. Global Moran index of China’s new infrastructure input efficiency.
Systems 11 00243 g003
Figure 4. China’s new infrastructure input efficiency LISA chart.
Systems 11 00243 g004
Table 1. New infrastructure input efficiency measurement indicator system.
Target LayerQuasi-Measurement LayerMetric Layer
InputInformation infrastructure (X1)Mobile phone base station coverage (X11)
Long-distance cable coverage (X12)
Internet broadband coverage (X13)
Converged infrastructure (X2)The proportion of enterprises that adopt information management (X21)
The proportion of enterprises that carry out production and business activities through the Internet (X22)
The proportion of enterprises that carry out publicity and promotion through the Internet (X23)
Innovation infrastructure (X3)Ratio of R&D researchers (X31)
Ratio of internal expenditure of R&D funds of industrial enterprises on the plan (X32)
Regional innovation capacity (X33)
OutputSociety (Y1)Number of mobile phone subscribers (Y11)
Financial inclusion index (Y12)
Number of persons employed in information transmission, software, and information technology services (Y13)
The proportion of fiscal expenditure for people’s livelihoods (Y14)
Economy (Y2)Software business revenue (Y21)
The total industrial output value of high-tech enterprises (Y22)
The added value of the tertiary industry (Y23)
Green finance index (Y24)
Technological innovation (Y3)Number of new product development projects in high-tech industries (Y31)
Number of effective invention patents in high-tech industries (Y32)
The number of companies that graduated from the tech business incubator in that year (Y33)
Technology market turnover (Y34)
Table 2. Descriptive statistics.
Variable NameSample SizeMaximum ValueMinimum ValueAverage ValueStandard Deviation
X11299112.3807.07821.685
X1229973.55101.0665.253
X132992.66300.1860.568
X2129999.190.596.1861.371
X2229910067.79595.7037.469
X2329992.715.60769.94620.053
X312990.7220.2540.4880.096
X322990.9910.6990.9330.047
X332990.8350.2510.5540.1
Y1129916,823.3463.54465.5863017.394
Y12299431.92818.33217.76796.709
Y1329992.30.611.93415.037
Y1429917,430.79249.922487.1562120.877
Y212996,968,925,7622.15133,417,695.9597,796,163
Y222997,956,479,80174650,265,971.7994,603,891
Y2329962,540.78540.1812,442.63410,903.669
Y242990.8390.0620.1910.113
Y3129946,263123147.6495414.682
Y3229963,161,6220920,674.6894,896,247.62
Y33299271,20002438.94716,406.447
Y3429956,952,8434.763,263,925.5317,021,035.395
Table 3. China’s efficiency in investing in new infrastructure.
RegionProvinceYear
2011201220132014201520162017201820192020
Eastern ChinaBeijing1.2961.3091.2551.3331.3281.2991.2751.2691.2471.287
Tianjin1.0701.0301.0491.0291.0361.0131.0031.0030.1420.150
Hebei1.1911.0091.0031.0040.1690.0810.0770.1150.0950.063
Shanghai1.1201.0431.0731.0381.0371.0271.0311.0501.0451.032
Jiangsu1.2061.1211.1361.1091.0521.0311.0381.0251.0411.008
Zhejiang1.0361.1081.0311.0361.0241.0161.0131.0211.0211.016
Fujian0.1550.1760.2140.3540.1720.1500.1340.1340.1370.121
Shandong1.0641.0881.0281.0281.0201.0130.4231.0040.3950.450
Guangdong1.2521.2431.2491.2621.2911.3791.4741.4381.4951.513
Hainan0.0110.0030.0140.0040.0090.0100.0121.0270.0180.015
Central ChinaShanxi0.0251.0080.0260.0210.0190.0170.0170.0170.0240.020
Anhui0.1361.0061.0071.0140.3191.0051.0071.0161.0041.006
Jiangxi0.0430.0670.0680.1500.0570.0510.0760.1770.1260.085
Henan1.0131.0101.0091.0241.0041.0091.0091.0211.0151.011
Hubei1.0121.0111.0201.0101.0101.0161.0191.0161.0111.004
Hunan1.0021.0100.3261.0461.0011.0111.0041.0041.0081.006
Western RegionInner Mongolia0.0070.0100.0060.0040.0080.0070.0090.0070.0040.009
Guangxi0.0190.0191.0021.0171.0291.0341.0230.0680.0480.041
Chongqing0.0941.0120.3470.2880.2500.1440.1000.1880.1220.202
Sichuan1.0301.0231.0151.0170.2991.0011.0040.3470.2610.225
Guizhou0.0491.0021.0081.0011.0051.0060.1290.1590.0940.134
Yunnan0.0460.1060.2491.0100.1560.0890.1230.1040.1660.053
Shaanxi1.0011.0231.0021.0021.0030.2111.0060.1570.3030.165
Gansu0.0130.0150.0120.0220.0250.0170.0160.0120.0110.011
Qinghai0.0000.0010.0000.0010.0010.0010.0010.0010.0010.002
Ningxia0.0040.0030.0040.0080.0140.0060.0050.0050.0040.005
Xinjiang0.0060.0040.0020.0050.0060.0060.0080.0070.0040.006
Northeastern ChinaLiaoning0.1401.0070.1890.1750.1530.1130.1120.1100.1030.101
Jilin0.0550.0980.0610.0480.0520.0400.0360.0850.0610.032
Heilongjiang0.0571.0270.1070.1501.0020.0780.1380.0220.0970.019
Disclaimer/Publisher’s Note: The statements, opinions and data contained in all publications are solely those of the individual author(s) and contributor(s) and not of MDPI and/or the editor(s). MDPI and/or the editor(s) disclaim responsibility for any injury to people or property resulting from any ideas, methods, instructions or products referred to in the content.

