Article

Spatial Correlation Network Analysis of Industrial Green Technology Innovation Efficiency in China

School of Economics and Management, Harbin Engineering University, Harbin 150001, China
*
Author to whom correspondence should be addressed.
Systems 2023, 11(5), 240; https://doi.org/10.3390/systems11050240
Submission received: 3 April 2023 / Revised: 1 May 2023 / Accepted: 4 May 2023 / Published: 12 May 2023
(This article belongs to the Section Systems Practice in Social Science)

Abstract

:
Exploring the spatial correlation network and its structural characteristics of China’s industrial green technology innovation efficiency is significant for promoting the coordinated development of inter-regional industrial green transformation. Based on the innovation value chain, this paper divides China’s industrial green technology innovation system into three interrelated sub-stages: technology research and development, achievement transformation, and commercialization. The NSBM model is used to measure the efficiency of industrial green technology innovation in 30 provinces and cities in mainland China from 2011 to 2020. The modified gravity model and social network analysis method are introduced to explore its spatial correlation network’s structural characteristics and evolution rules. The results show that the spatial network correlation intensity of the three stages of green technology innovation efficiency in regional industry has gradually strengthened. There is no strict hierarchical structure, and the spatial network tends to be stable. The network shows an apparent “core–edge” distribution in all three stages, with the eastern coastal and central more developed regions at the network’s core. Meanwhile, the northeastern and western remote areas are at the network’s edge and less connected with other regions’ provinces and cities. The distribution of network blocks in the three stages of green technology innovation efficiency is similar. The net benefit block mainly includes the eastern coastal and surrounding developed areas. The net spillover block mainly consists of the economically backward northwest region. The broker block is primarily distributed in the surrounding provinces and cities of the Bohai Rim. The bidirectional spillover block is mainly located in the southwest region. Finally, some suggestions are put forward to promote the coordinated improvement of regional industrial green technology innovation efficiency from the perspective of integrity, individuality, and agglomeration.

1. Introduction

Over the past 40 years of reform and opening up, China’s economy has been increasing while significantly impacting the environment. According to the Global Environmental Performance Index (EPI) 2020 report, China’s EPI ranked 120th out of 180 participating economies with only 37.3 points [1]. Air quality ranked 137th, the worst echelon among the participating countries. Although implementing the innovation-driven strategy has promoted the rapid development of China’s economy, ecological problems such as environmental constraints and resource shortages have not been adequately solved. Therefore, it is necessary to introduce the concept of green development into traditional innovation activities and promote green innovation [2]. Industry is the leading force of national economic development. However, the long-term rough economic development model has also caused severe damage to the ecological environment and increasingly serious resource consumption problems [3]. Therefore, how can resource allocation of green technology innovation be optimized while minimizing the emission of pollutants? Improving green technology innovation efficiency has become an important research topic for driving the development of industrial green transformation and upgrading.
With the continuous promotion of a regional coordinated development strategy, regional innovation cooperation and exchange have become closer, and innovation factors such as knowledge, talent, and capital have been able to flow across regions [4]. As a result, the inter-provincial industrial green technology innovation efficiency gradually produces spatial correlation. It gradually transforms from proximity in a purely geographical sense to a complex spatial network structure. Therefore, it is of great theoretical and practical significance to accurately analyze the spatial correlation network characteristics and evolution rules of regional industrial green technology innovation efficiency, analyze the position and role of provinces and cities in the network, and explore the spatial spillover path of industrial green technology innovation efficiency, to improve the overall efficiency of China’s industrial green technology innovation and promote the transformation of economic development to green innovation mode.
The early research on green technology innovation efficiency mainly focused on efficiency evaluation and influencing factors. First, evaluating the efficiency of green technology innovation includes three methods. One is the parametric method represented by the Stochastic Frontier Approach (SFA) [5]. The other is the non-parametric method represented by Data Envelopment Analysis (DEA) [6] and Slacks-Based Measure (SBM) [7]. Scholars have used these methods to measure the efficiency of green technology innovation in different regions and industries [8,9,10,11]. Second, the existing research on the influencing factors of green technology innovation efficiency is rich, including internal factors such as R & D investment and R & D personnel, as well as external factors such as financial development, global value chain, and environmental regulation [12,13,14,15]. Scholars have turned to the spatial and temporal evolution of green technology innovation efficiency as the research progresses. They mostly use spatial measures based on “attribute” data to explore the spatial and temporal evolution characteristics of green technology innovation efficiency in different regions [2,16,17].
Scholars have conducted much research on the efficiency of green technology innovation, but there are still limitations in the following aspects. First, most studies regard the process of green technology innovation as a “black box”, ignoring that innovation activity is a phased process from R & D to production and then to commercialization, and scientific methods should measure the efficiency of different stages. Second, the spatial and temporal evolution analysis of green technology innovation efficiency is mostly based on “attribute” data, which cannot accurately describe its spatial correlation network structure. Based on the innovation value chain theory, this paper divides the industrial green technology innovation activities into three interrelated sub-stages: technology R & D, achievement transformation, and commercialization. Then the Network Slacks-Based Measure (NSBM) model is applied to measure the efficiency of each stage. Finally, the social network analysis method analyses the spatial correlation network structure formed by green technology innovation activities in each stage. This paper aims to enrich and expand the research perspective of green technology innovation efficiency, provide some reference for accelerating the green transformation and upgrading of China’s industry, and promote the green and high-quality development of China’s industrial economy.
The contributions of this study are mainly reflected in the following aspects. (1) From the perspective of the innovation value chain, the “black box” of industrial green technology innovation is split, and the innovation process is refined into three interrelated sub-stages: technology R & D, achievement transformation, and commercialization. (2) We adopt a non-radial NSBM model to measure the efficiency of industrial green technology innovation in China, which overcomes the shortcomings of the traditional DEA model, considering the economic and environmental benefits. (3) Based on the “relational data”, we explore the spatial correlation of China’s industrial green technology innovation efficiency from the network perspective and clarify each province’s position and role in the network to formulate different green innovation development policies in a targeted manner.
The remaining sections of this paper are structured as follows. Section 2 is the literature review, which mainly introduces the current research status of green technology innovation and innovation value chain theory. Section 3 is the research design, which primarily selects research methods and constructs the evaluation index system and data sources. Section 4 is the empirical section, which mainly analyzes the spatial correlation network characteristics of green technology innovation efficiency in the Chinese industry. Section 5 presents the conclusion, corresponding policy recommendations, theoretical and practical implications, limitations of the paper, and future research directions.

2. Literature Review

2.1. Green Technology Innovation

Regarding the research on green technology innovation, scholars have mainly expanded their analysis from three aspects: connotation, efficiency measurement and evolution of spatial and temporal patterns, and influence factors.

2.1.1. Connotation of Green Technology Innovation

At present, the academic community has not yet made a clear definition of the connotation of green technology innovation. Foreign research on green technology innovation is earlier. Braun and Wield [18] first proposed the concept of “green technology”. They defined it as a general term for the technologies and processes used to reduce environmental pollution, raw materials, and energy consumption. Aguilera et al. [19] argued that green technology innovation should also include corporate green management and green product design. Domestic scholars’ attention to green technology innovation began in the 1990s. Xu et al. [20] argued that technological innovation processes that reduce product life cycle costs could be considered green technology innovation. Liu et al. [21] argued that green technology innovation is an activity that applies new knowledge of environmental protection and green technology together in production, operation, and economic life to create new economic benefits and ecological efficiency. Zhuang et al. [22] defined green technology innovation as improving environmental quality through corresponding technological innovation and management innovation.

2.1.2. Measurements of Green Technology Innovation Efficiency

Regarding the evaluation of green technology innovation efficiency, scholars have mainly measured the green technology innovation efficiency of different regions and industries using the SFA [5] and DEA method [6]. For example, Sun et al. [23] measured the efficiency of R & D green technology innovation in the Korean manufacturing industry using the SFA model. Shen et al. [24] examined the green innovation efficiency of 22 major countries worldwide from 2007 to 2016 using the DEA model. Luo et al. [8] evaluated the green technology innovation efficiency of 21 sub-sectors of strategic emerging industries in China through the DEA-Malmquist model. However, traditional DEA models ignore undesired outputs and improvements to non-zero slack variables. To address this issue, Tone proposed a non-radial, non-angular SBM model [7], which has been widely used. For example, Liu et al. (2019) [9] constructed an improved SBM-DEA model to measure high-tech industries’ green technology innovation efficiency in different regions of China. Zhang et al. (2022) [25] measured the green innovation efficiency of 30 Chinese provinces from 2007 to 2018 based on the super-SBM model. Zhang et al. (2022) [26] similarly evaluated Chinese industries’ green technology innovation efficiency from 2005 to 2018 using the super-SBM model.

2.1.3. Measurements of Green Technology Innovation Efficiency

The efficiency of green technology innovation considers economic and environmental benefits, so its influencing factors are also more complicated. The economic factors mainly include financial development, global value chain, digital economy, etc. The environmental factors mainly include environmental regulation, energy efficiency, etc. For example, Shao et al. [27] explored the degree of technological change in capital, labor, energy, and carbon emissions. They confirmed that improving labor productivity, R & D intensity, and energy efficiency can promote green technical efficiency, while capital deepening suppresses green technological efficiency. Hu et al. [14] studied the impact of the global value chain (GVC) on green technology innovation efficiency under environmental regulation. The results showed that there was a positive moderating effect and a double threshold effect between environmental regulation on GVC location and GTIE. Lv et al. [15] empirically showed significant differences in the impact of financial structure, financial scale, and financial efficiency on green technology innovation. Environmental regulation and innovation output played different moderating roles between financial development and green technology innovation. Chen et al. [28] confirmed that the digital transformation of the national economy had a significant positive impact on the efficiency of green technology innovation in Chinese energy-saving and environmental protection firms. In addition, scholars have also studied the effects of central environmental protection inspectors [29], carbon emissions trading [30], and smart cities [31] on the efficiency of green technology innovation. Due to the different research subjects and methods, the conclusions reached also differ.

2.1.4. Spatial and Temporal Evolution of the Efficiency of Green Technology Innovation

The early studies on the spatial-temporal evolution of green technology innovation efficiency focused on “attribute” data. Yao et al. [2] measured the green technology innovation efficiency of 110 cities in China’s Yangtze River Economic Belt from 2006 to 2020 through the super-SBM model. They analyzed it from two aspects: convergence characteristics and dynamic evolution law. The study found that the green technology innovation efficiency of the Yangtze River Economic Belt gradually converged to an equilibrium point, and the efficiency transfer showed a specific spatial dependence. Liu et al. [16] analyzed green innovation efficiency’s spatial and temporal evolution in Chinese cities using standard deviation ellipse, spatial autocorrelation method, and geographic detector. The results showed that the overall green innovation efficiency of Chinese cities had risen rapidly, and the efficiency center was in the geometric center of China. The spatial polarization characteristics remained prominent despite a slowing trend. Zhang et al. [32] used the Dagum Gini coefficient, its subgroup decomposition method, and the Kernel density estimation method to investigate green technology innovation efficiency’s spatial and temporal variation characteristics in Chinese industries. The study found that the absolute level of real green technology innovation efficiency was low in all regions, and the overall spatial distribution pattern was “high in the east and low in the west”.
From the above literature, we found that spatial measurement methods based on exploratory spatial data analysis (ESDA) have greatly compensated for the deficiency of not considering geospatial factors in the past study of green technology innovation efficiency. However, these methods are often based on the quantitative analysis of “attribute” data and lack the survey of “relationship” data. Some scholars have confirmed that China’s industrial green technology innovation efficiency has an obvious spatial spillover effect, so its spatial correlation network is not only a simple linear correlation but also a complex multi-threaded network. Studies targeting the spatial correlation network of green technology innovation efficiency are relatively rare and generally based on the spatial correlation network of green innovation efficiency framework. Fan et al. [33] used the modified gravity model to explore the spatial correlation strength between provinces. Then they analyzed the spatial correlation network characteristics of China’s green innovation efficiency. Liu et al. [34] analyzed the evolution of green innovation networks and the impact of multidimensional proximity formation using social network analysis and a quadratic association program (QAP). Liang et al. [35] constructed a green innovation efficiency network for 144 countries worldwide in 2017 and 2021 through an improved gravity model. They explored the influencing factors of the green innovation spatial association network. Sun et al. [36] used social network analysis to explore the changing patterns and causes of the spatial correlation network of green innovation efficiency in two stages of Chinese industrial enterprises.

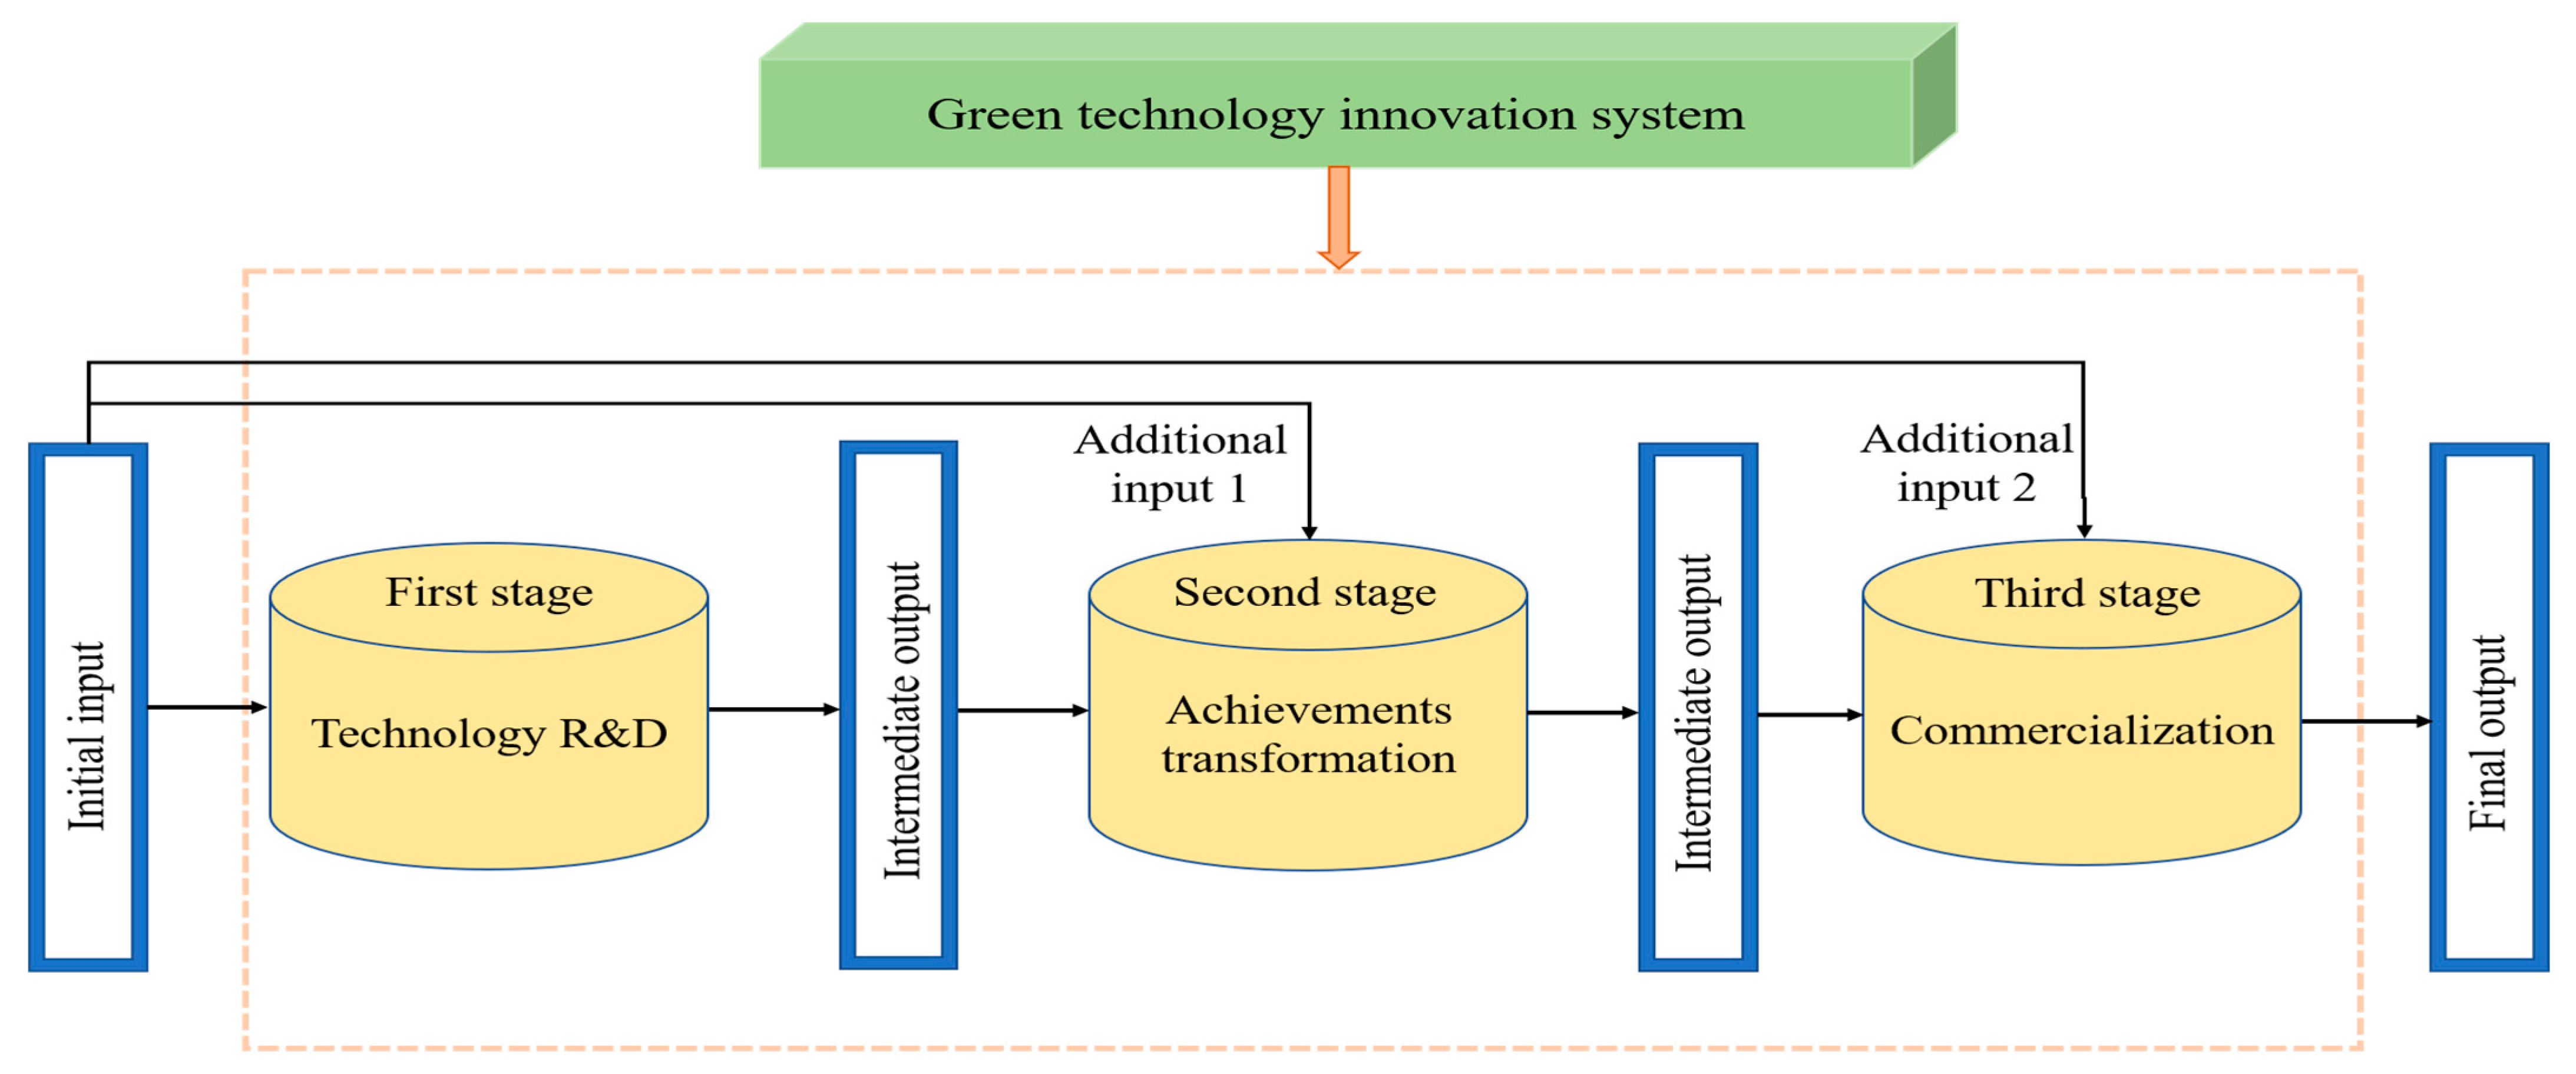
2.2. Innovation Value Chain Theory

Hansen and Birkinshaw first introduced the concept of the innovation value chain in 2007 [37]. They divided the innovation process into three stages: idea generation, transformation, and diffusion. The lag of any one step will affect the entire innovation process. Domestic and foreign scholars have widely used the theory. Roper et al. [38] considered the innovation value chain as a recursive process of knowledge acquisition, transformation and use, and final marketization. Yu et al. [39] divided innovation activities into knowledge, research, and product. They measured the efficiency of regional innovation in China at each stage using a three-stage DEA model. Subsequent scholars have continuously supplemented and improved the innovation value chain stage division for different research objects, providing new perspectives for studying industrial green technology innovation activities. For example, Zhu et al. [40] divided the green technology innovation process in Chinese energy-intensive industries into technology development and achievement transformation. They used a shared input two-stage DEA model to measure the efficiency of each stage’s green technology innovation. Wang et al. [41] divided the efficiency of green technology innovation in the regional context of China into two stages, R & D and commercialization. They evaluated the efficiency of each stage using a dynamic network slacks-based measuring approach.
It can be seen from the above analysis that green technology innovation activities are a complex system process with multiple inputs, multiple outputs, and multiple links. Based on the innovation value chain theory proposed by Hansen [37], this paper draws on and expands the innovation value chain paradigm of Yu et al. [39] and Zhu et al. [40]. We regard green technology innovation as a complex chain system invested by innovative resources to produce creative achievements and finally successfully realize commercialization and application. We refine it into three stages: technology R & D, achievement transformation, and commercialization. As shown in Figure 1.

2.3. Purpose and Questions

In summary, the research on green technology innovation efficiency has gradually formed a complete system. However, the following aspects still need to be further explored: (1) the research perspective on industrial green technology innovation efficiency needs to be expanded. The existing research is more abundant in evaluating single-stage efficiency but less in evaluating multi-stage efficiency and focuses more on the empirical analysis of two-stage efficiency. (2) The current research on the spatial relationship of green technology innovation is based chiefly on Moran’s I index, Thiel index, spatial Durbin model, etc. These research methods are often based on “attribute” rather than “relationship” data. They cannot analyze the spatial correlation network characteristics of green technology innovation efficiency among regions. (3) No uniform standard for industrial green technology innovation efficiency evaluation index system exists. The construction of a scientific and comprehensive evaluation index system under the condition of data availability still needs to be explored in depth. Because of this, the paper divides the green technology innovation process into three stages: technology R & D, achievement transformation, and commercialization from the perspective of the innovation value chain. A non-radial NSBM model is used to measure the efficiency of industrial green technology innovation in China. The spatial correlation network of industrial green technology innovation efficiency is carved out through the “relationship” data. Its structural characteristics are analyzed using social network analysis to provide policy suggestions for promoting the synergistic improvement of industrial green technology innovation efficiency among regions.
We focus on the following questions. (1) Are there differences in the spatial correlation networks of green technology innovation efficiency in different stages? What are their evolutionary trends and characteristics? (2) What are the roles and functions of each province and city in the spatial correlation network of industrial green technology innovation efficiency? (3) Which regions are included in each block? What are the clustering characteristics, correlations, and spillover paths of each block?

3. Research Design

3.1. Construction of Industrial Green Technology Innovation Efficiency Index System

Green technology innovation should not only optimize resource allocation and obtain economic benefits but also reduce energy consumption and control pollution to achieve a win-win situation for the economy and environmental protection. Based on the innovation value chain theory and the current research results, this paper constructs the evaluation index system of China’s industrial green technology innovation efficiency from the input and output perspective. As shown in Table 1.
Table 1 shows that the input and output indicators corresponding to different stages in industrial enterprises’ green technological innovation activities differ. The Cobb-Douglas production function emphasizes the importance of capital, labor, and technology in production activities. Therefore, when we select the input indicators for industrial green technology innovation efficiency, we mainly consider capital, labor, and technology. In different innovation stages, the output indicators are primarily considered from knowledge achievements and economic and environmental benefits.

3.1.1. Technology R & D Stage Input-Output Variables

Technology R & D is the initial stage of the whole innovation value chain. This stage mainly generates new technologies and methods through R & D investment and converts them into knowledge and technological achievements such as patents and non-patent as the output of this stage. Regarding the input elements, R & D personnel is the main executors of innovation activities in the technology R & D stage. The R & D funding is a prerequisite for innovation activities in the technology R & D stage [36]. The R & D projects play an important guiding role as technological inputs from planning to implementation of R & D work. These three are the fundamental resource elements in the R & D stage of green innovation technology. Therefore, this paper refers to the practice of Du et al. [42], selects the R & D personnel full-time equivalent, internal expenditure of R & D funds, and the number of R & D projects as input variables in the technology R & D stage. Regarding the output factors, the technology R & D stage is the process of new knowledge birth. Thus, the R & D results are mainly in the form of patents, which are generated to be converted into new products in the results transformation stage to realize the final commercial value. Therefore, this paper draws on the study of Sun et al. [36], and selects the number of valid invention patents and new product development projects as the output variables in the technology R & D stage.

3.1.2. Achievement Transformation Stage Input-Output Variables

The achievement transformation is the intermediate stage of realizing the value of industrial green innovation. As a continuation of the technology R & D stage, this stage mainly focuses on the subsequent application research of the new technologies and methods generated in the previous step, solving the technical problems from technology R & D to trial production to meet the subsequent mass production and finally realizing commercialization. The input factors in the achievement transformation stage mainly include personnel, financial, and technology input. Referring to the research results of Du et al. [42], in terms of personnel input, the task is primarily accomplished through the personnel of science and technology activities other than R & D, and the personnel of non-R & D science and technology activities is selected as the personnel input variables, which are expressed by scientific and technological activity personnel except for R & D scientists and engineers. Regarding capital investment, new product development funding can reflect the capital investment in the transformation stage more intuitively, but not all research projects serve new products. Therefore, non-R & D investment is selected as a supplement to capital investment. China is still dominated by imitative and progressive innovation. Therefore, non-R & D investment is expressed as the sum of expenditure on introducing foreign technology, expenditure on digesting and absorbing introduced technology, expenditure on purchasing domestic technology, and expenditure on technological transformation [36,40]. Both non-R & D inputs and new product development expenditures are in stock form and treated the same way as R & D expenditures. The number of effective invention patents and new product development projects in the technology R & D stage are selected as technology input variables for technology input. The output of the achievement transformation stage is dominated by process innovation. The utility model patents and design patents can broadly reflect the process innovation results of the achievement transformation stage. Therefore, referring to the research of Du et al. [42], utility models and design patents are selected as output variables. The number of patent applications other than invention patents expresses the index.

3.1.3. Commercialization Stage Input-Output Variables

Commercialization is the final link in realizing the value of industrial green innovation. Enterprises transform the innovation results of the previous stage into tangible commodities to market to enhance the economic, social, and environmental benefits, thus realizing the ultimate value of green innovation. Regarding input factors, the commercialization process involves various aspects such as production, sales, and management. Therefore, this paper draws on the study of Du et al. [42] and selects the average annual number of net employees as the personnel input variable, which is expressed in terms of annual employees excluding scientific and technological activities. (Annual average number of net employees = annual average number of employees in the enterprise − number of personnel in scientific and technological activities). The stock of new fixed assets represents the capital input. The output utility model design patents at the stage of transformation of results are selected as the technology input variable. The selection of output indicators in the commercialization stage is not only to obtain considerable economic benefits but also to try to improve the ecological benefits of the environment. Therefore, this paper divides them into desired output and undesired output indicators. In terms of the desired output, new product sales revenue can visually measure the commercialization level of green technology innovation results. Therefore, the new product sales revenue is selected as the desired output and deflated using the Industrial Producer Exit Price Index [12,40]. The undesired output must consider the energy consumed and pollutants emitted by enterprises in the commercialization of green technology innovation results. This paper selects industrial sulfur dioxide, wastewater, smoke and dust, solid waste emissions, and energy consumption per unit of GDP in each province as indicators of undesired output. The entropy method fits the above five indicators into an environmental pollution index [12,17].

3.2. Research Method

3.2.1. Three-Stage NSBM Model

Scholars on measuring innovation efficiency use non-parametric DEA models [6]. However, the traditional DEA model has radial and directional problems on the one hand and cannot improve non-zero relaxation variables. On the other hand, the DEA model does not consider the undesirable output indicators that may be included in the output items. The SBM model based on undesirable outputs proposed by Tone effectively overcomes the above problems [7]. However, the early SBM model regarded production activities as “black boxes” and did not consider the intermediate production process. Therefore, due to the “black box problem” of traditional non-parametric methods, Tone and Tsutsui [43] proposed a phased NSBM model based on the SBM model in 2009. This model solves the radial problem of the conventional DEA model and splits the “black box” of enterprise green innovation efficiency into different efficiency stages.
Assuming that there are n decision-making units DMU j ( j   =   1 , 2 , , n ) , k ( k   =   1 , 2 , 3 ) is the green technology innovation stage for each decision unit, the three-stage NSBM model framework is as follows.
G T E   =   min ω 1 1     1 m 1 i 1   =   1 m 1 s i 1 j 1 / x i 1 j 1   +   ω 2 1     1 m 2 i 2   =   1 m 2 s i 2 j 2 / x i 2 j 2   +   ω 3 1 1 m 3 i 3   =   1 m 3 s i 3 j 3 / x i 3 j 3 ω 1 1   +   1 p 1 r 1   =   1 p 1 s r 1 j 1 g + / y r 1 j 1   +   ω 2 1   +   1 p 2 r 2   =   1 p 2 s r 2 j 2 g + / y r 2 j 2   +   ω 3 1   +   1 p 3   +   q 3 r 3   =   1 p 3 s r 3 j 3 g + / y r 3 j 3   +   t 3   = 1   q 3 s t 3 j 3 b / b t 3 j 3 s . t . x i 1 j 1   =   j   =   1 n λ j 1 x i 1 j 1   +   s i 1 j 1     i 1   =   1 , 2 , , m 1 y r 1 j 1   =   j   =   1 n λ j 1 y r 1 j 1     s r 1 j 1 g + r 1   =   1 , 2 , , p 1 f i r s t   s t a g e j = 1 n z d j 1 , 2 λ j 1   =   j   =   1 n z d j 1 , 2 λ j 2 d   =   1 , 2 , , v 1 s t a g e l i n k x i 2 j 2   =   j   =   1 n λ j 2 x i 2 j 2   +   s i 2 j 2 i 2   =   1 , 2 , , m 2 y r 2 j 2   =   j   =   1 n λ j 2 y r 2 j 2     s r 2 j 2 g + r 2   =   1 , 2 , , p 2 sec o n d   s t a g e j   =   1 n z d ʹ j 2 , 3 λ j 2   =   j   =   1 n z d ʹ j 2 , 3 λ j 3 d ʹ   =   1 , 2 , , v 2 s t a g e l i n k x i 3 j 3   =   j   =   1 n λ j 3 x i 3 j 3   +   s i 3 j 3 i 3   =   1 , 2 , , m 3 y r 3 j 3   =   j   =   1 n λ j 3 y r 3 j 3     s r 3 j 3 g + r 3   =   1 , 2 , , p 3 b t 3 j 3   =   j   =   1 n λ j 3 x t 3 j 3   +   s t 3 j 3 b t 3   =   1 , 2 , , q 3 t h i r d   s t a g e ω k ,   λ j k , s i 1 j 1 , s r 1 j 1 g + ,   s i 2 j 2 , s r 2 j 2 g + , s i 3 j 3 , s r 3 j 3 g + , s t 3 j 3 b 0   ( k )  
In Equation (1), G T E is the total efficiency value of green technology innovation, ω k is the weight of stage k , λ j k is the intensity vector. m k , p k , q k are the number of indicators for stage k inputs, desired outputs, and undesired outputs. s k , s k g + , s k b are the slack variables for stage k inputs, desired outputs, and undesired outputs, respectively. x i j k i k   =   1 , 2 , m k , y r j k ( r k   =   1,2 , p k ) , b t j k ( t k   =   1,2 , q k ) are the number i input variable, the number r desired output variable, and the number t undesired output variable of the decision unit DMU j at the stage k , respectively. Z ( k , h ) is the intermediate output between stage k and stage h .
The efficiency values for stages 1 and 2 are:
G T E k   =   1 1 m k i k   =   1 m k s i k j k / x i k j k 1   +   1 p k r k   =   1 p k s r k j k g + / y r k j k k   =   1 , 2
The efficiency value of stage 3 is:
G T E 3   =   1 1 m 3 i 3   =   1 m k s i 3 j 3 / x i 3 j 3 1   +   1 p 3   +   q 3 r 3   =   1 p 3 s r 3 j 3 g + / y r 3 j 3   +   t 3   =   1 q 3 s t 3 j 3 b / b t 3 j 3
In Equations (2) and (3), G T E k is the efficiency value of each stage of green technology innovation. If θ k   =   1 , then the decision-making unit is efficient at stage k . When G T E k is 1 for all stages, the decision-making unit is efficient. s i j k , s r j k g + , s t j k b are the slack variables of the optimal input, desired output, and undesired output in Equation (1)

3.2.2. Improved Gravity Model

An essential prerequisite for applying the social network analysis method is the construction of the spatial association matrix. The matrix structure mainly includes the VAR Granger Causality test method and gravity model. Since the over-sensitivity of the VAR model to the lag order will reduce the accuracy of the network structure characteristics portrayal, this paper refers to the study of Liu et al. [34] to introduce an improved gravity model to identify the spatial correlation of the efficiency of green technology innovation in Chinese inter-provincial industry.
R i j   =   K i j   ×   R P i   ×   G T E i   ×   R P j   ×   G T E j D i j 2 K i j   =   G T E i G T E i   +   G T E j
In Equation (4), R i j represents the correlation intensity of industrial green technology innovation efficiency in province i and province j . K i j is the gravitational coefficient. G T E i , G T E j are the efficiency of each industrial green technology innovation stage in the region i and j . K i j is modified by G T E proportion. People are both the subject of innovation activities and the performer of the spatial association generated by the efficiency of green technology innovation, so they should be included in the model (4). There are also differences in the innovation agents in different innovation stages. In the R & D stage, R P i , R P j are the number of R & D personnel in industrial enterprises in province i and province j . In the achievement transformation stage, R P i , R P j are the number of non-R & D scientific and technological activities of industrial enterprises in province i and province j . In the commercialization stage, R P i , R P j are the annual average number of net employees in industrial enterprises in provinces i and j .

3.2.3. Social Network Analysis

Social network analysis is based on “relational data” and explores networks’ structural and attribute characteristics by drawing the relational networks of different social subjects [44]. It mainly includes overall network characteristics analysis, individual network centrality, and block model analysis. It is known from previous studies that green technology innovation efficiency has an apparent spatial spillover effect [45], and its spatial correlation network is a complex system containing many subjects and interactive relationships among elements [46]. The social network analysis method can accurately quantify the relationships among subjects in the network. It is suitable for analyzing the structural characteristics of the spatial correlation network of green technology innovation efficiency.
(1)
Overall Network Characteristics Analysis
This paper selects four indicators of network density, network ties, network hierarchy, and network efficiency to describe the overall spatial network characteristics of China’s industrial green technology innovation efficiency. The network ties degree is used to characterize the robustness of the spatial network of China’s industrial green technology innovation efficiency. The more the network ties degree is close to 1, the more stable the network is. The network hierarchy degree describes the degree of asymmetric accessibility among provinces in the network. The higher the network hierarchy degree, the more distinct the hierarchical relationships among regions in the network. Network efficiency measures the degree of redundant lines existing in the network. The lower the network efficiency, the more connected lines exist between provinces, and the more stable the network structure is.
(2)
Centrality Analysis
Centrality reflects the position and role of each network member, which is one of the focuses of social network analysis. This paper uses degree centrality, closeness centrality, and betweenness centrality to analyze the centrality of China’s industrial green technology innovation efficiency spatial network. Among them, the degree of centrality is used to characterize the position of each province and city in the spatial correlation network of industrial green technology innovation. The larger the value, the more connections with other regions and the more central they are in the network. Closeness centrality measures the degree to which other regions do not dominate each area in the spatial correlation network of industrial green technology innovation. The higher the value, the shorter the “distance” from other regions and the higher the possibility of becoming a network center actor. The betweenness centrality is used to reflect the control ability of each member in the spatial correlation network of industrial green technology innovation on innovation resources. The higher the value, the more vital the region’s role as a “bridge” and “intermediary” in the spatial network.
(3)
Block Model Analysis
This paper uses the block model theory to determine the number of blocks in the spatial correlation network of industrial green technology innovation efficiency. It clarifies the provinces and cities contained in each block to reveal further the internal structural shape of its spatial correlation network. The blocks in the network can usually be divided into four types. First is the net beneficial block, which receives relationships from internal and external members and more connections from outside the block than those sent outside. The second is the net spillover block, which has a low number of relationships among the internal members of the block. Still, the number of relationships spilling over to other blocks is significantly higher than the number of connections it receives. The third is the bidirectional block, which mainly sends relationships to the internal and external members of the block and acquires a small number of relationships from other blocks. The fourth is the broker block, which simultaneously receives and sends relationships to other members. Its internal members have few connections, and it plays the role of “bridge” and “intermediary” in the network.

3.3. Data Sources

This study intends to use the corresponding index data of 30 provinces in different regions (Tibet is eliminated due to a severe lack of data). These raw data are mainly derived from the “China Statistical Yearbook”, “China Industrial Economy Statistical Yearbook”, “China Science and Technology Statistical Yearbook”, “China Environment Statistical Yearbook” and patent statistical annual reports issued by the National Bureau of Statistics from 2012 to 2021

4. Analysis of Spatial Correlation Network Characteristics of Industrial Green Technology Innovation Efficiency in China

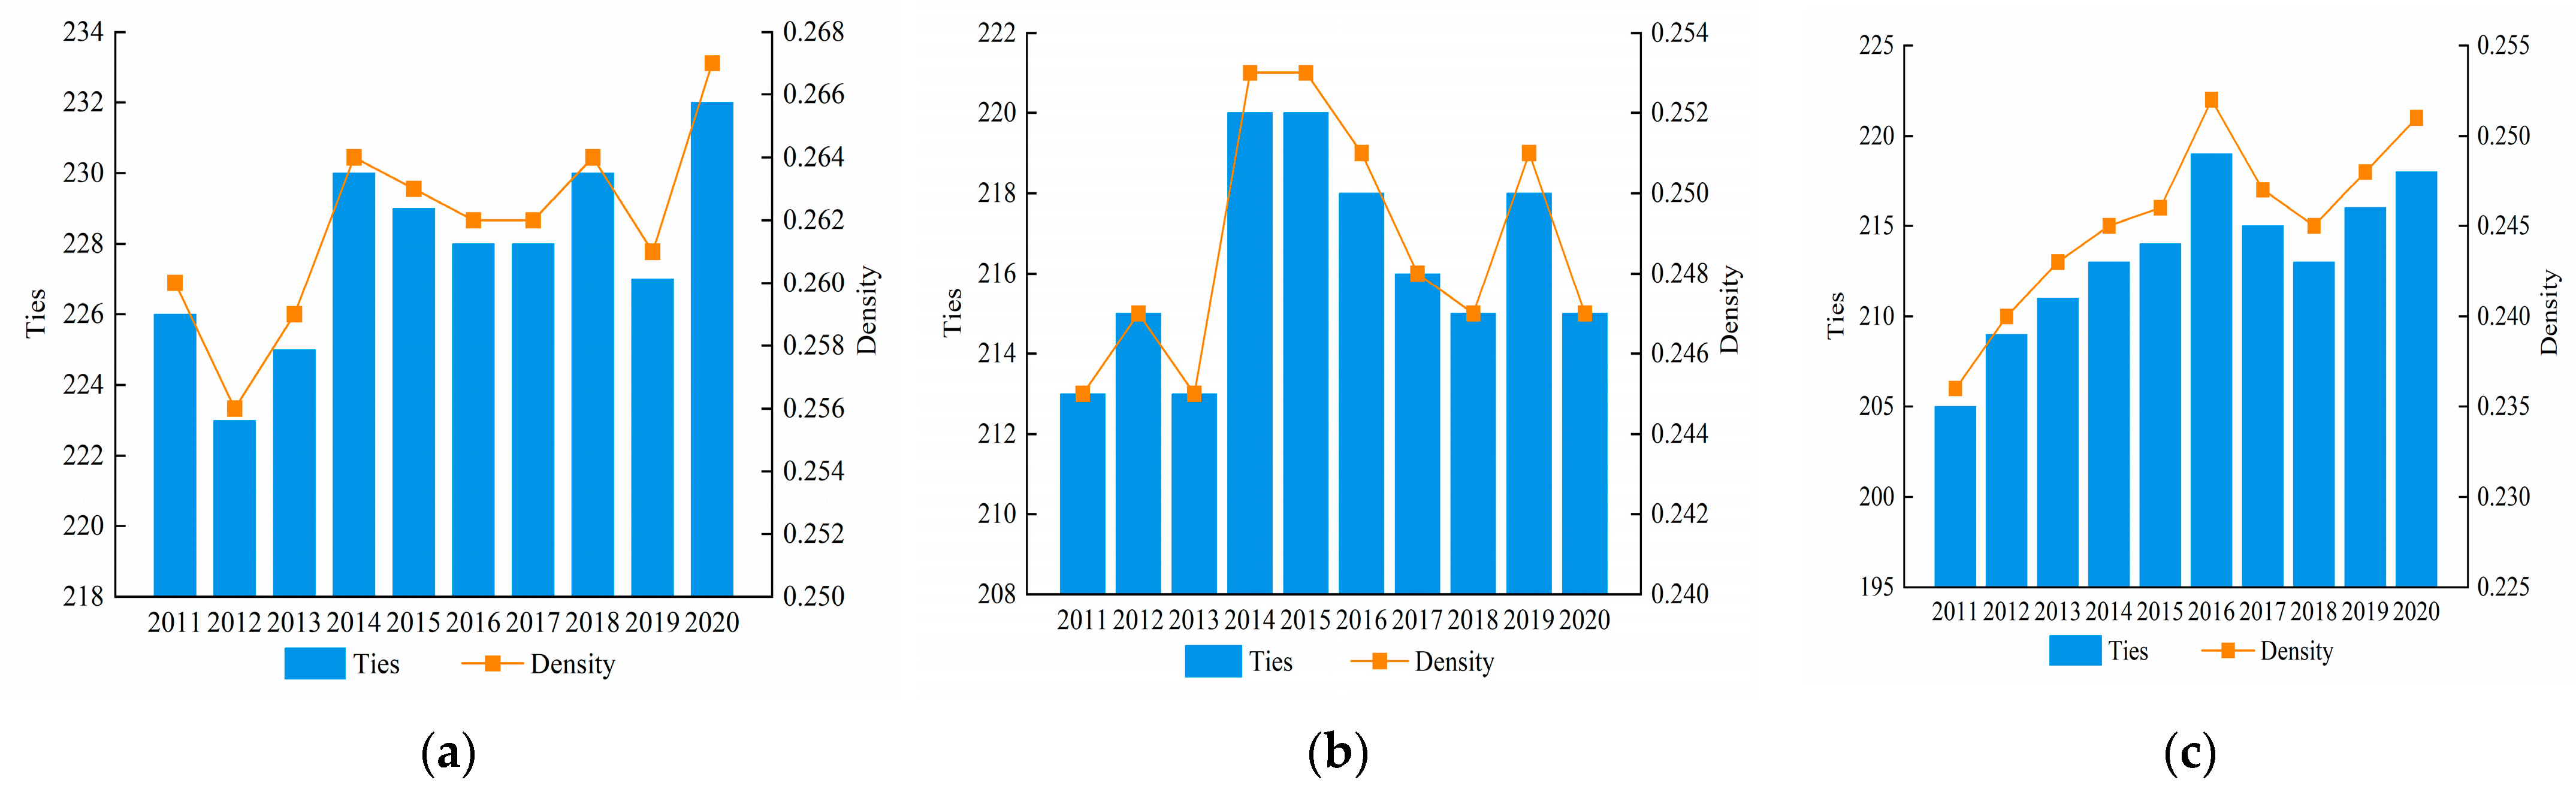
4.1. Overall Network Characteristics and Evolutionary Trends

This paper measured the efficiency of China’s industrial green technology innovation from 2011 to 2020 through the three-stage NSBM model. The modified gravity model established the correlation matrix of inter-provincial industrial green technology innovation efficiency from 2011 to 2020. After binarizing it, the spatial network topology of China’s industrial green technology innovation efficiency in 2011 and 2020 was drawn by Gephi software.
Figure 2 and Figure 3 showed that the spatial correlation effect of industrial green technology innovation efficiency in each province was not only limited to geographically close regions but also existed among non-neighboring regions, establishing a complex and relatively stable spatial correlation network. Among them, the network complexity of the technology R & D stage, achievement transformation stage, and commercialization stage in 2020 was higher than in 2011. The spatial association network was most complex in the technology R & D stage, followed by the transformation and commercialization stages. To further explore the overall network structure characteristics of spatial association of industrial green technology innovation efficiency in China, this paper calculates network density, network ties, network hierarchy, and network efficiency through Ucinet6.0 software based on the spatial correlation matrix. In addition, the three-stage network density and ties comparison graph, network hierarchy, and efficiency comparison graph are drawn by Origin software. As shown in Figure 4 and Figure 5.
The network correlation of all three stages of green technology innovation efficiency in Chinese industry from 2011 to 2020 was 1. It indicates that all provinces and cities were in the spatial correlation network of green technology innovation efficiency. The green innovation development among provinces was closely linked, and no isolated provinces existed. In terms of dynamic evolution trend, the number of ties and network density of the technology R & D stage, achievement transformation stage, and commercialization stage showed an overall fluctuating upward trend during the study period (Figure 4), and the spatial network tended to be stable. Driven by the five development concepts of “innovation, coordination, greenness, openness, and sharing”, all regions actively promoted the coordinated development of industrial green transformation. Therefore, the correlation of China’s industrial green technology innovation efficiency during the study period was growing closer. However, there was still a big gap compared with the theoretical measurement of the maximum correlation number 870 and the maximum network density value 1. This conclusion is similar to Fan et al. [33], Liu et al. [34], and Sun et al. [47]. There was room for further improvement in the coordinated development level of industrial green technology innovation among regions. The measurement results of the network hierarchy showed that the network hierarchy of the technology R & D stage increased from 0.241 to 0.383. In the stage of achievement transformation, there was no change in the network hierarchy during the study period, which was 0.241. The network hierarchy of the commercialization stage was 0.246 until 2014 and decreased to 0.241 after 2014. As seen in Figure 5, the change of network hierarchy degree at each stage was not noticeable and much smaller than the maximum value of hierarchy degree1. There was no strict hierarchical structure in the spatial correlation network of industrial green technology innovation efficiency. The measurement results of network efficiency showed that the network efficiency of the technology R & D stage and commercialization stage showed a decreasing trend (Figure 5a,c), indicating that the spatial correlation network linkage gradually increased in the two stages spatially associated network tended to be stable. The achievement transformation stage’s network efficiency showed a slight upward trend, indicating that the spatial correlation network spillover channels in the achievement transformation stage decreased, and the stability of the spatial network decreased. During the investigation, the spatial correlation network efficiency of Chinese industrial green technology innovation fluctuated around 0.68, indicating more redundant links in the spatial correlation networks of the three innovation stages. The network structure was relatively stable, with high-stability connectivity. This result is not the same as the conclusion of Sun et al. [36]. Sun et al.’s research showed a decrease in network hierarchy and efficiency in the technology R & D and the achievement transformation phase. The conclusion may be due to the differences in the division of green innovation stages and the choice of indicators and methods.

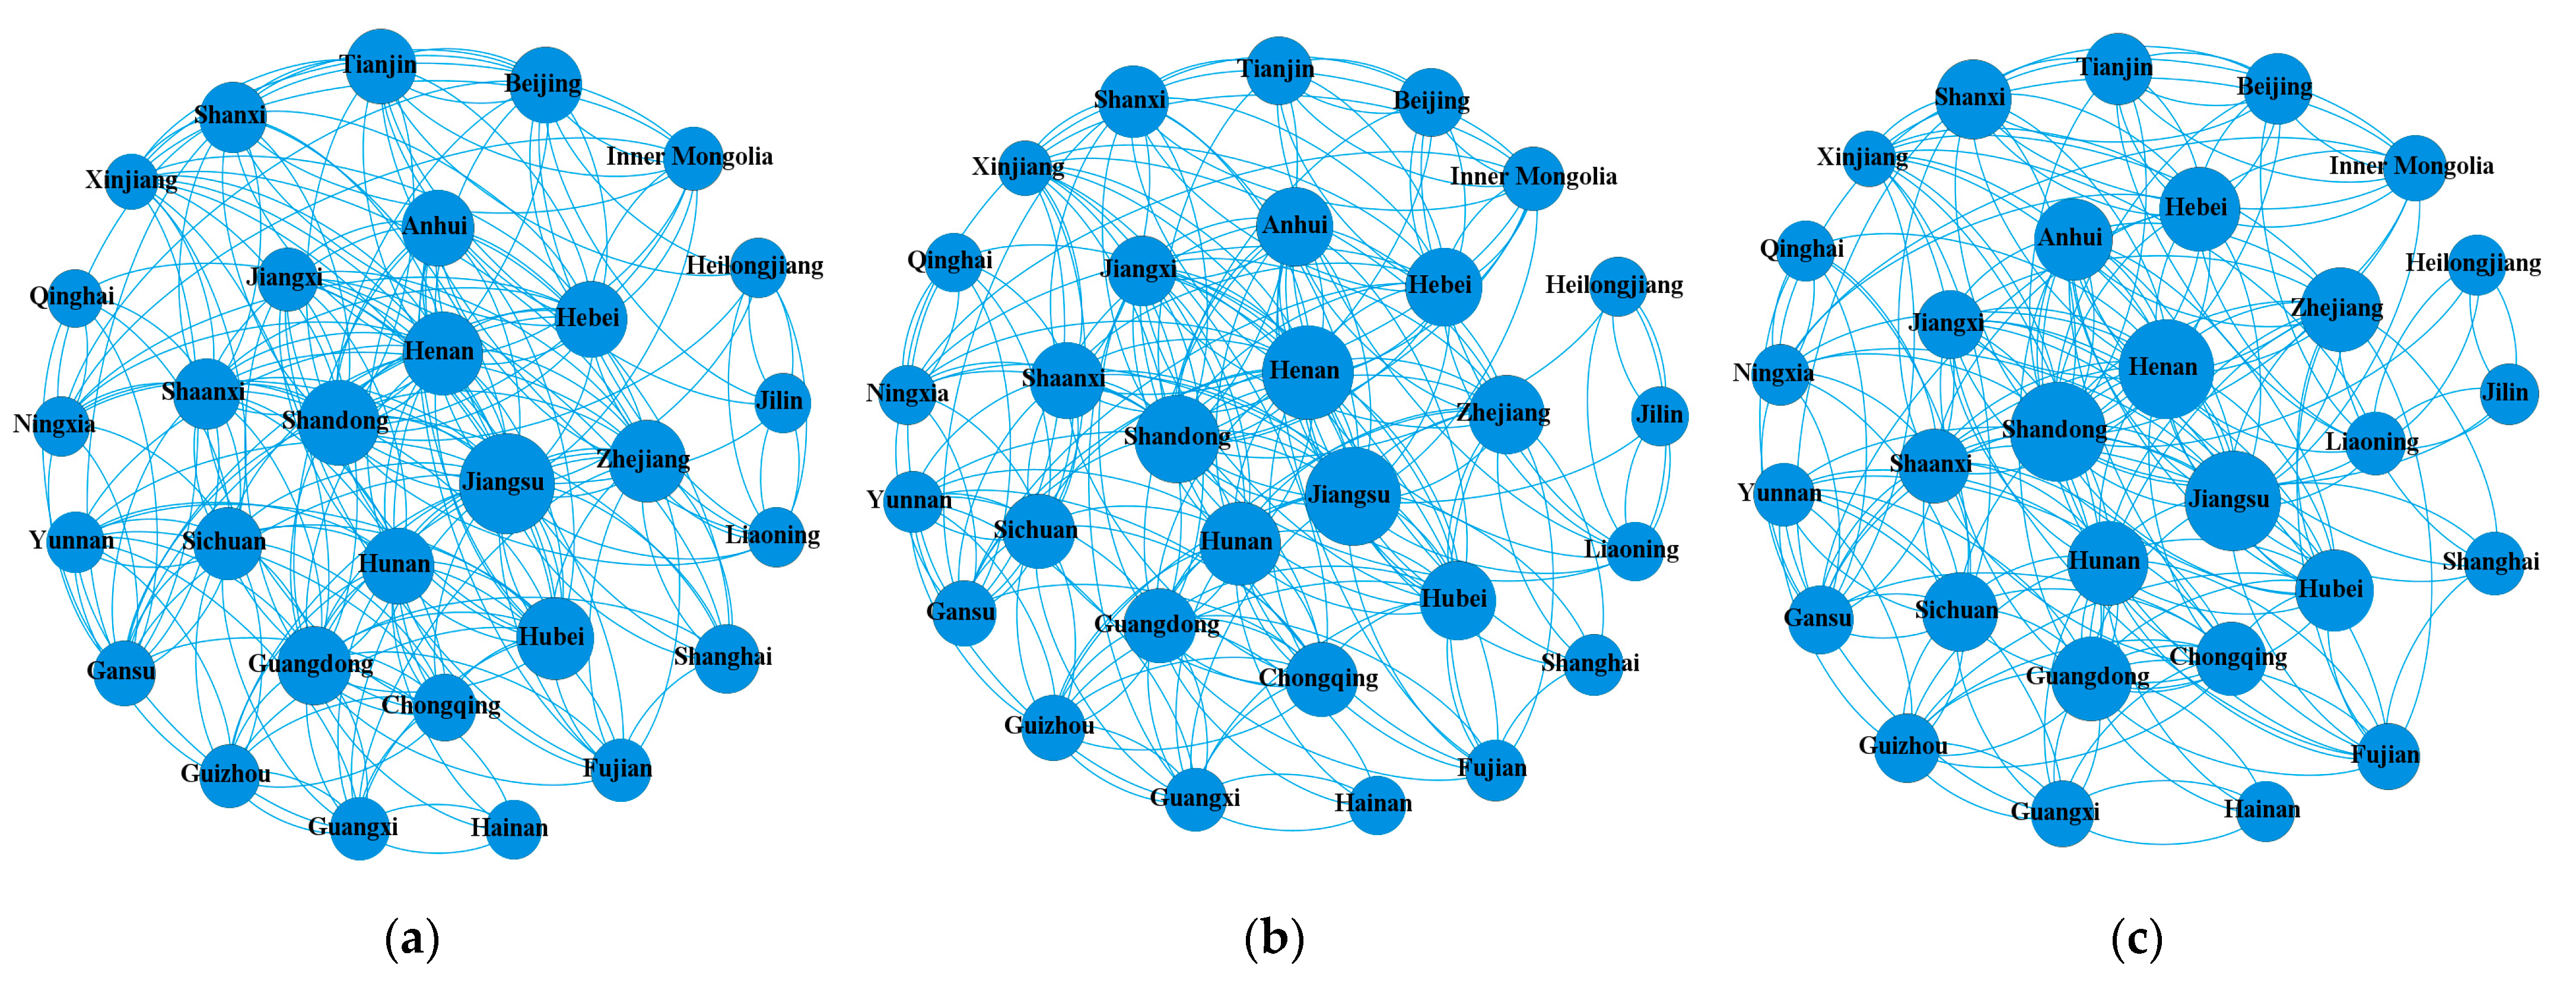
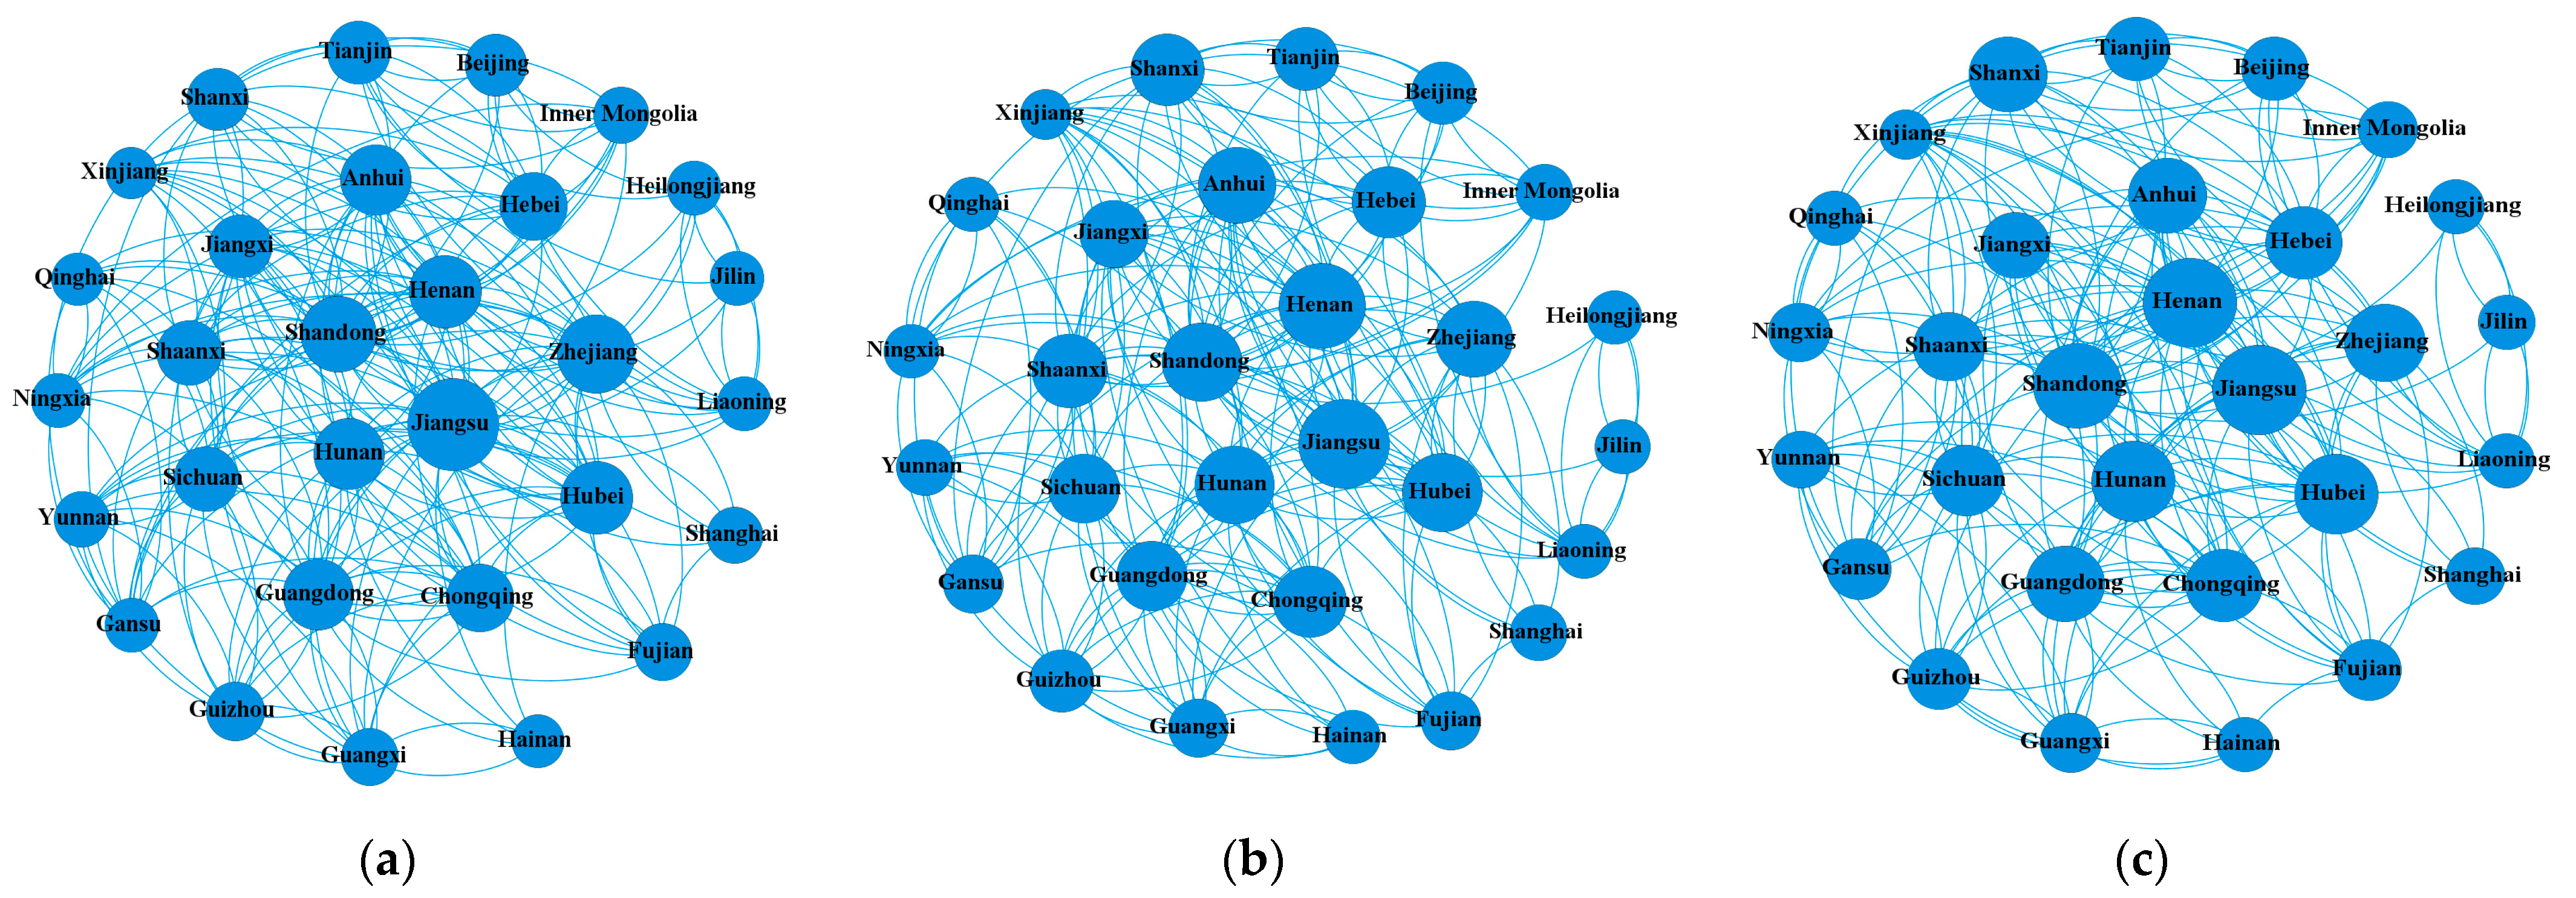
4.2. Network Individual Characteristics and Location Relationship Evolution

This paper analyzed the centrality of China’s inter-provincial industrial green technology innovation efficiency spatial correlation network by point degree centrality, closeness centrality, and betweenness centrality in 2020. We further investigated the individual characteristics and the evolution of the location relationship of each province. The measurement results are shown in Table 2.
(1) Degree centrality. As shown in Table 1, the average degree centrality of 30 provinces in the technology R & D stage, achievement transformation stage, and commercialization stage were 40.460, 35.172, and 35.862, respectively. Among them, Jiangsu, Shandong, Guangdong, Henan, and Hunan were higher than the average and had more relationships in the spatial association network of industrial green technology innovation efficiency. The results are more similar to those of Sun et al. [36]. Jilin, Heilongjiang, Inner Mongolia, Guizhou, and other regions had lower degree centrality and less association with other provinces. Overall, the east and central regions had significantly better control over green technology innovation resources than the west and northeast regions, mainly due to their solid economic foundation, rich scientific and technological resources, and superior geographical location. Among the western provinces, the degree centrality of Shaanxi, Sichuan, and Chongqing was also higher than the national average. The Shaanxi, Sichuan, and Chongqing provinces have recently increased their green technology innovation capacity. They have become an important hub connecting the interaction of green technology innovation resources in the central and western regions. The above analysis showed that most areas in the center of green technology innovation efficiency spatial correlation network had lower point-out and higher point-in degrees, such as Jiangsu, Zhejiang, and Shandong. It should be noted that the degree of centrality in Xinjiang was also higher than the national average. The point degree of the three stages was 12, 14, and 14, respectively, while the point degree was 0. The study by Sun et al. [47] also confirmed that the point entry degree of green technology innovation efficiency in Xinjiang is 0. It meant that Xinjiang’s green technology innovation resources had largely flowed to other regions, which showed that areas with higher efficiency of green technology innovation had not produced sound spatial spillover effects but had benefited from other low-efficiency areas to a certain extent, resulting in a “siphon effect”.
(2) Closeness centrality. As shown in Table 2, in the technology R & D stage, the top five provinces in closeness degree were Jiangsu, Zhejiang, Shandong, Henan, and Shaanxi. The top five provinces in the achievement transformation stage were Jiangsu, Henan, Shaanxi, Shandong, and Zhejiang. The top five provinces in the commercialization stage were Henan, Jiangsu, Shandong, Hubei, and Shaanxi. These provinces had a superior geographical location and could quickly generate spatial association with other regions. They were in the absolute core position with better accessibility in the spatial association network of industrial green technology innovation efficiency. It is similar to Sun et al.’s confirmation that Henan, Shandong, and Jiangsu were located in the spatial correlation network center of China’s green innovation efficiency [36]. It can also be seen from Table 2 that the ranking of closeness centrality was similar to that of degree centrality. Most provinces and cities above the national average were in the eastern and central regions. Due to the low level of economic development and remote geographical location, Qinghai, Yunnan, Jilin, Heilongjiang, and other provinces had a weak ability to obtain green technology innovation resources from other provinces and cities. They could not promote the green development of other provinces and cities, so they were in the marginal position of the spatial correlation network.
(3) Betweenness centrality. It can be seen from Table 2 that in the three stages of technology R & D, achievement transformation, and commercialization, the betweenness centrality of Guangdong, Shandong, Henan, and Shaanxi was always higher than the average and ranks in the top five. It showed that these provinces and cities could essentially control the green technology innovation resources in other regions in the spatial correlation network of industrial green technology innovation efficiency and played the role of “intermediary” and “bridge”. The betweenness centrality of western and northeastern regions such as Inner Mongolia, Guizhou, Liaoning, and Jilin was generally low. These regions lagged in economic development and lacked motivation for green technology innovation. At the same time, they were affected by the “siphon effect” of developed regions. They had difficulties controlling and dominating other provinces and cities in the spatial network of green technology innovation efficiency. It should be noted that the betweenness centrality of Shandong, Jiangsu, and Guangdong was also high because of their absolute core position in the spatial network. They severely weakened the control ability of the neighboring eastern economically developed provinces such as Beijing, Tianjin, and Shanghai over green technology innovation resources.

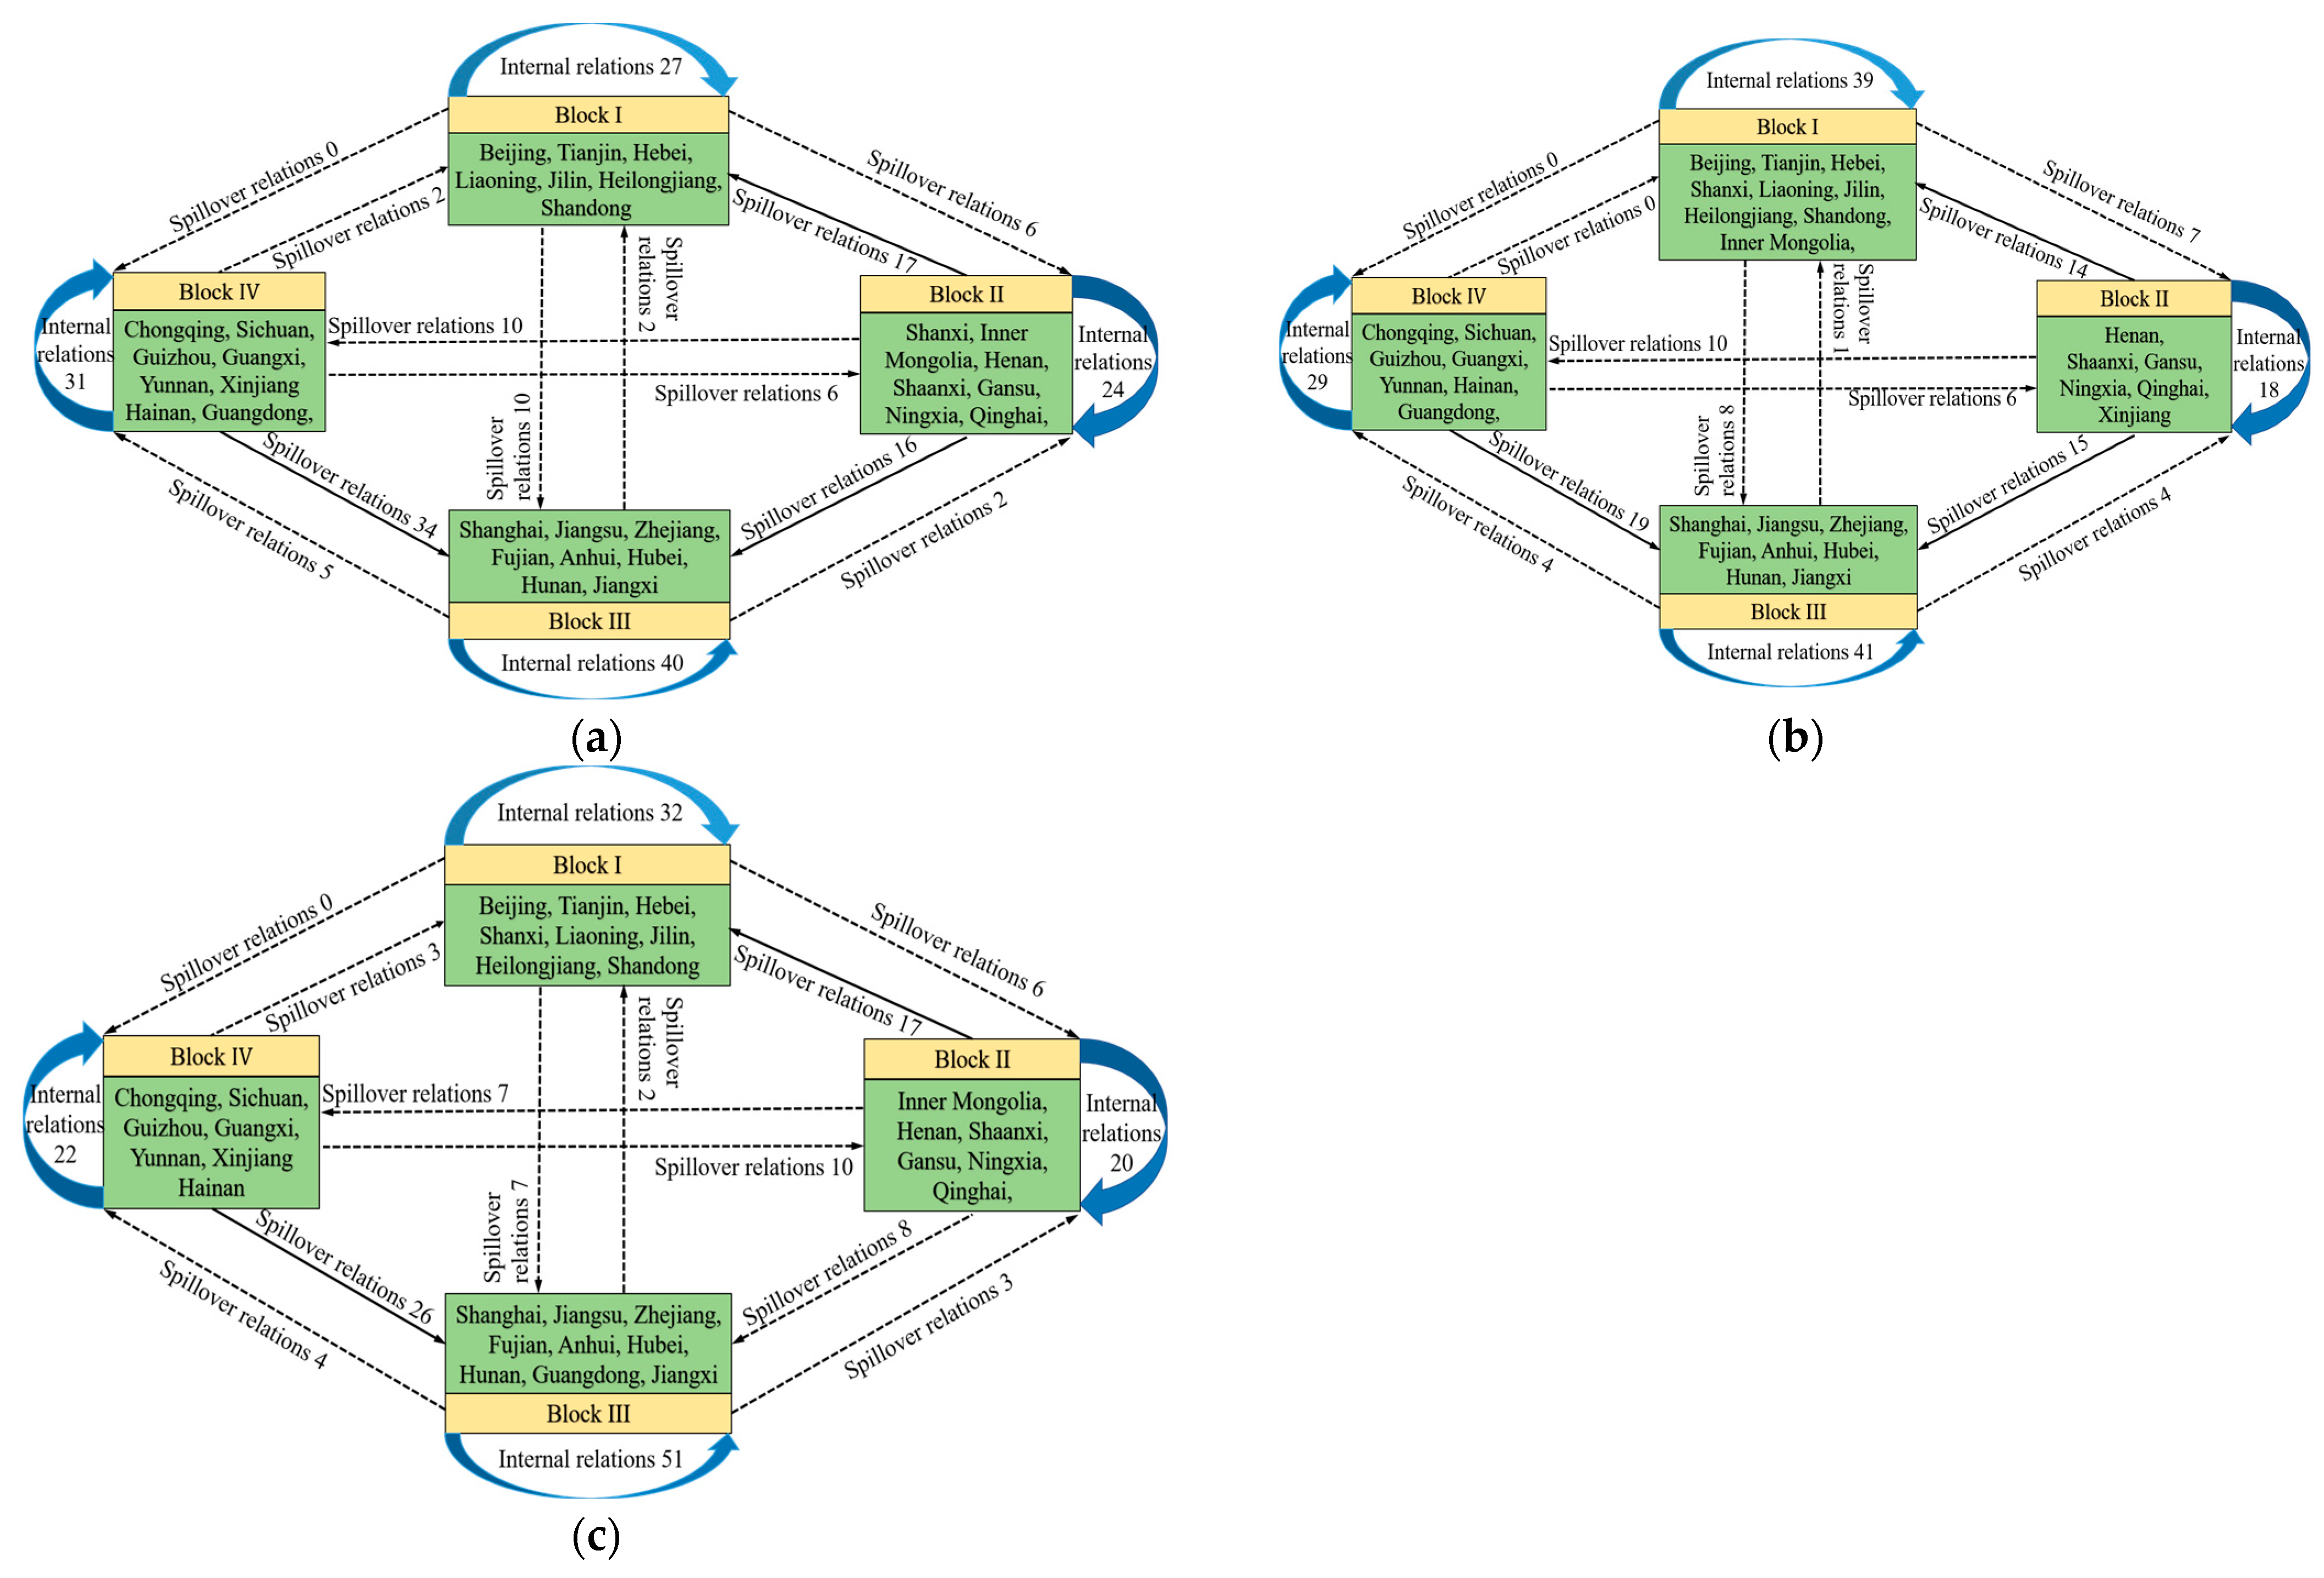
4.3. Block Model Analysis

To deeply analyze the spatial correlation of China’s industrial green technology innovation efficiency and further reveal the spatial network’s correlation characteristics and action rules between regions, this paper adopted the iterative correlation convergence method CONCOR to determine the maximum segmentation depth of 2 and the convergence standard of 0.2. The 30 provinces in the spatial correlation network of China’s industrial green technology innovation efficiency were divided into four sections [33,34,47], as shown in Table 3.
From Table 3, there were 232 relations in the spatial network of the technology R & D stage, including 122 in the blocks and 110 between the blocks. It indicated that both within and between the blocks had apparent correlation effects in space. The number of relationships overflowing from block I to the external block was 16, and the number of connections received from the outer block was 21. The expected and actual internal relationship ratio was 20.69% and 62.79%, respectively. It indicated that this block played the “middleman” role in the green technology innovation efficiency spatial association network by overflowing relationships to the outer block and receiving relationships from the outer block simultaneously. Block I mainly included the Bohai Sea Rim and its adjacent areas: Beijing, Tianjin, Hebei, Liaoning, Jilin, Heilongjiang, and Shandong. The number of relationships spilling out of block II was 43, while the number of relationships receiving out of block II was only 14. The proportions of desired and actual internal relationships were 20.69% and 35.82%, respectively. The number of relationships spilling out of this block to the outside was significantly more than the number of relationships it accepted. Thus, it can be judged that block II was a net spillover block. Block II was mainly for the western region (except Shanxi and Henan), including Shanxi, Inner Mongolia, Henan, Shaanxi, Gansu, Qinghai, and Ningxia. The number of relations outside the receiving block of block III was 60, which was much larger than the number of relations outside the spillover block of 9. Therefore, this block was a “net benefit block”. Block III mainly included the eastern coastal and south-central regions: Shanghai, Jiangsu, Zhejiang, Fujian, Anhui, Hubei, Hunan, and Jiangxi. The total number of spillover relationships in block IV was 73, and the number of spillover relationships within and outside the block was 31 and 42, respectively. The expected and actual internal relationship ratios were 24.14% and 42.47%, respectively. Thus, it can be seen that block IV had spillover effects both inside and outside the block, and it was a “bidirectional spillover block”. Block IV mainly included the southwest region and adjacent provinces, namely Chongqing, Sichuan, Guizhou, Guangxi, Yunnan, Hainan, Guangdong, and Xinjiang. Similar to the technology R & D stage, there were 215 and 218 correlations in the spatial correlation network of the achievement transformation stage and commercialization stage, respectively. Among them, 127 and 125 were within the block, and 88 and 93 were outside, respectively. It showed that significant spatial correlations and spillover effects were still generated between the blocks in the achievement transformation stage and commercialization stage. The same analysis process as the technology R & D stage can be used to obtain the nature of each block in the achievement transformation stage and commercialization stage. From the analysis, the distribution of the blocks was similar in the three stages, and the net benefit blocks were mainly located on the eastern coast and its adjacent areas. It verified the previous conclusion that regions with higher efficiency of green technology innovation were more likely to obtain higher spatially related benefits from inefficient areas. The net spillover block was mainly located in the northwestern region, influenced by the “siphon effect” of economically developed regions. The green technology innovation resources in the western regions, such as Qinghai and Gansu could not effectively absorb the spillover from the neighboring regions while losing them to the outside. The broker block was mainly located in the Bohai Sea region and its surrounding provinces, and the bidirectional spillover block was in the southwest region and its neighboring areas.
To further reveal the correlations and spillover paths among the blocks of industrial green technology innovation efficiency, this paper measured the density matrix among the three stages of the blocks (Table 4). As we know from the previous article, the network densities of the technology R & D stage, achievement transformation stage, and commercialization stage were 0.267, 0.247, and 0.251, respectively. In the density matrix of each stage, the values higher than the network density value were assigned as 1, and the values less than the network density value were set as 0 to transform the density matrix into the corresponding image matrix (see Table 4). Based on this, the correlations between the blocks were plotted (Figure 6) to show the spillover path between the blocks more intuitively.
Table 4 and Figure 6a showed that in the technology R & D stage, the linkages among the provinces within the four blocks were relatively strong. The green technology innovation resources of block II and block IV realized internal flow and overflowed to block III, with an apparent net spillover effect. Block I only carried out green technology innovation spillover internally. As can be seen from Figure 6b, the achievement transformation stage was similar to the technology R & D stage. The members of block IV were active in internal resource interaction and channeled green technology innovation resources to block II. Block II received overflow from block IV and overflowed to block III. The green technology innovation resources of the remaining two blocks were only closely flowing internally, and the spillover effect to other blocks was not noticeable. As shown in Figure 5c, the active flow of green technology innovation resources among the provinces in block I and block III during the commercialization stage also drew a lot of resources and elements from block II and block IV, showing a significant “reverse spillover” feature.
Specifically, block I mainly included the Bohai Sea Rim region (such as Beijing, Tianjin, Shandong, Liaoning, etc.) and its surrounding provinces (such as Jilin, Heilongjiang, etc.). The State Council in 2018 explicitly requested to lead the collaborative development of the Bohai Rim region with Beijing and Tianjin as the center. Therefore, the green technology innovation resources within the Bohai Sea region provinces have produced apparent spillover effects at various stages but have not yet flowed to other areas. Its “intermediary effect” needs to be further strengthened. This conclusion is more similar to the findings of Fan et al. [33]. They concluded that Beijing, Tianjin, and Liaoning only produced spillover effects within the block but did not assume the responsibility of a “middleman” bridge outside the block. Block III mainly included provinces in the Yangtze River Economic Belt (such as Shanghai, Jiangsu, Anhui, etc.). As an early demonstration belt for ecological civilization construction, the Yangtze River Economic Belt always adheres to the strategic positioning of ecological priority and green development. It has a high level of green technology innovation. Therefore, the efficiency of industrial green technology innovation in the Yangtze River Economic Zone provinces was also at the country’s forefront. The resulting “siphon effect” has made the innovation resources from those regions with lower green technology innovation capacity in block II and block IV flow to the Yangtze River Economic Belt and its surrounding areas, which were the net beneficiaries of the spatial correlation network of industrial green technology innovation efficiency. Regarding spatial pattern, the provinces within block IV have tremendous development potential. In the future, Chongqing, Sichuan, and Shaanxi should be the center to drive the western region to implement green synergistic development and give full play to its role as a “middleman” connecting the inland and developed coastal regions for the interaction of green technological innovation resources.

5. Conclusions

5.1. Findings

Based on the innovation value chain perspective, this paper decomposes the green technology innovation system into three stages: technology R & D, achievement transformation, and commercialization. We use the three-stage NSBM model to measure the industrial green technology innovation efficiency of 30 provinces and cities in China from 2011 to 2020. Subsequently, a modified gravity model is introduced to construct the spatial correlation matrix among provinces and cities. Based on this, the structural characteristics of the spatial association network of industrial green technology innovation efficiency in China are explored in depth using the social network analysis method. The primary conclusions drawn are as follows:
(1) Through the analysis of the overall network structural characteristics, the spatial association intensity of the three stages of industrial green technology innovation efficiency in China showed a general increasing trend during the sample period. There was no rigid hierarchical structure, and the spatial network tended to be stable, but the development of the three stages showed a certain degree of disconnection. The network efficiency in the technology R & D stage and commercialization stage declined smoothly, while the achievement transformation stage showed a slight upward trend. The network robustness of the first and third stages showed an overall enhancement trend, and the network robustness of the second stage gradually decreased. The results of this study differ from the findings of Sun et al. [36]. Sun et al. showed that the ties of the spatial correlation network between the two stages of green innovation were not high. The network hierarchy and efficiency of the two stages of technology R & D and achievement transformation showed a decreasing trend. It may be because China is still in the stage of slowing economic growth, high energy consumption, and severe environmental pollution.
(2) Through the analysis of individual characteristics of the network, the spatial correlation network of China’s industrial green technology innovation efficiency in the three stages during the sample period showed an evident “core–edge” distribution. The eastern coastal and central economic regions occupied the core position in the network, had more robust control over the green technology innovation resources, and played the role of “intermediary” and “bridge” to a certain extent. The northeastern and western remote regions were at the edge of the network, less connected with other provinces and cities, and had a weaker ability to obtain green technology innovation resources. Among them, Jiangsu, Guangdong, and Shandong occupied the absolute core position in the spatial network, which weakened the control ability of the neighboring eastern developed provinces such as Beijing, Tianjin, and Shanghai on green resources to a certain extent. As a vital hub connecting the interaction of green technology innovation resources in the central and western regions, Shaanxi and Sichuan could benefit from developing green technology innovation in the local network. This result is more similar to the finding of Liu et al. [34]. and Sun et al. [47]. The “siphon effect” is evident in the economically developed east and central regions, and the beneficial effect is significant. In contrast, the spillover effect is obvious in the western and northeastern provinces, mainly at the network’s edge.
(3) Through block model analysis, the spatial correlation network of industrial green technology innovation efficiency in China during the sample period was divided into four blocks, and the distribution of the blocks was similar in the three stages. The net benefit block mainly included Shanghai, Jiangsu, Zhejiang, Fujian, Anhui, Hunan, and other eastern coastal regions and their surrounding economically developed provinces and cities. The net spillover block mainly included Shaanxi, Qinghai, Gansu, Ningxia, and other economically more backward northwest regions. The broker block mainly included Beijing, Tianjin, Hebei, Shandong, Liaoning, Jilin, and other Bohai Sea-ring regions and surrounding provinces and cities. The bidirectional spillover block mainly included the southwestern region such as Sichuan, Guangxi, Chongqing, Yunnan, and its neighboring areas. Among them, the net spillover block and the bidirectional spillover block were influenced by the “siphon effect” of developed regions. Their green technology innovation resources flowed internally and spilled over to the broker and net benefit blocks simultaneously. The broker block only achieved the internal green technology innovation spillover, and the “intermediary effect” needed to be further strengthened. The comparison reveals that although previous studies have divided the spatial correlation network of green innovation efficiency into four blocks, the spillover paths between the blocks and the composition of internal provinces differ [33,34,35,36,47]. For example, Sun et al. [47] divided China’s spatial correlation network block of green science and technology innovation efficiency into two main spillover blocks, one gain block, and one broker block. The differences may be due to the differences in research objects, methods, and evaluation indicators. Our study further refines the green technology innovation process into three stages: technology R & D, achievement transformation, and commercialization, providing a new network perspective for researching China’s industrial green technology innovation.

5.2. Recommendations

(1) To comprehensively understand the spatial correlation network of industrial green technology innovation efficiency in China and its structural characteristics and actively expand its spillover channels. From the perspective of the innovation stage, enterprises, governments, and universities should strengthen cooperation and exchanges, further optimize the industry-university-research cooperation platform, establish an efficient mechanism for achievement transformation and commercialization transformation, and continuously improve the ability of green innovation resource allocation. We strive to improve the “disconnection” in the innovation value chain transmission process. From the perspective of the regional, on the one hand, each region needs to follow the trend of gradually tightening the spatial correlation network of regional industrial green technology innovation efficiency. On the other hand, it is necessary to speed up the process of breaking down regional green technology innovation barriers, promote the smooth circulation of innovative resources such as talents and knowledge among regions, and realize the efficient integration of industrial green technology innovation elements among regions. Ultimately, the aim is to optimize the structure of the green technology innovation spillover network and improve the efficiency of China’s industrial green technology innovation.
(2) Fully grasp the role and position of each region in the spatial correlation network and formulate targeted strategies based on their development status. Enterprises are the central units of green technology innovation. Jiangsu, Guangdong, and Shandong are at the absolute core of the spatial correlation network. They should further improve their spillover effects and take advantage of the “non-hierarchical” nature of the spatial correlation network to realize the assistance of high-efficiency regions to low-efficiency regions while maintaining the efficient development of their industrial green technology innovation. Beijing, Tianjin, and Shanghai have high efficiency in green technology innovation but are “marginalized” in the network due to the influence of whole core regions. They should further enhance the inter-regional flow of innovation factors such as knowledge, talents, and capital, and actively cooperate with other regions to continuously improve their status in the network. Shaanxi, Sichuan, and Chongqing occupy the advantages in the local network. They should invest more green technology innovation resources in the future and use them as intermediary hubs to connect the flow of green technology innovation resources in the central and western regions to promote the synergistic development of green technology innovation among provinces and cities in the west region. As a solid backing for enterprises to carry out green innovation activities, the government should formulate relevant policies to strengthen resource conservation and environmental protection. Moreover, they should fully stimulate the motivation of enterprises’ green technology innovation. For economically underdeveloped regions, the government can also give corresponding policy support and tax relief to provide a good innovation environment for enterprises.
(3) Improve and optimize the conduction mechanism between blocks to promote the synergistic development of industrial green technology innovation between regions. First, the “frontrunners” should be precisely positioned for the internal block. The block’s green technology innovation spillover effect should be fully used to achieve the coordinated development of “point to block”. Second, for the provinces and cities with the net benefit block with the “siphon effect”, while maintaining their advantages in green technology innovation resource allocation, they should continuously improve the level of green technology innovation diffusion to benefit the neighboring regions. Provinces and cities in the broker block should fully play the role of “intermediary” and “bridge”. They should continue to strengthen exchanges with the net benefit block in the future and actively cooperate with low-efficiency regions in green technology innovation to promote the coordinated development of industrial green technology innovation in each region. The provinces and cities in the net spillover and bidirectional spillover blocks should further optimize their green technology innovation environment and formulate relevant preferential policies to gradually attract talent to local areas to narrow the gap with developed regions.

5.3. Implications

5.3.1. Theoretical Implications

Based on the theory of innovation value chain and the connotation of green technology innovation, this study analyzes the structural characteristics of the spatial correlation network of industrial green technology innovation efficiency in China from the perspective of “relationship”, clarifies the status and role of each province and city in the network, and profoundly explores the intrinsic correlation between each province and city in the green technology innovation network. It is of great theoretical significance to further enrich and expand the research perspective of green technology innovation and promote the coordinated development of green technology innovation in the Chinese industry.

5.3.2. Practical Implications

Green technology innovation is essential to promote China’s economy and accelerate high-quality development. It not only enables the enterprises to obtain corresponding economic benefits but also promotes the joint development of upstream and downstream enterprises in the industrial chain. This study explores the overall characteristics, individual characteristics, and clustering characteristics of industrial green technology innovation spatial correlation networks under different innovation stages from the perspective of the innovation value chain. The results of the study provide not only practical insights for enterprises to optimize the allocation of innovation resources and enhance green technology innovation capability but also provide valuable ideas for the government to formulate regional development strategic planning and improve relevant policies of green innovation development. This study has important practical significance for promoting the overall improvement of China’s industrial green technology innovation efficiency and promoting the sustainable and high-quality development of China’s industrial enterprises.

5.4. Research Shortcomings and Future Perspectives

This paper investigates the spatial correlation network characteristics of China’s industrial green technology innovation efficiency and obtains meaningful conclusions. However, this paper is only a preliminary study, and many issues remain to be further explored. For example, no scientific and uniform measurement standard exists for the green technology innovation efficiency evaluation index system. Scholars have different evaluation indexes, and the research results will inevitably differ. Therefore, in the future, we will continue to work on finding a more comprehensive and scientific evaluation system to measure the efficiency of green technology innovation more accurately. Second, this study takes China’s provincial data as the research subject. The research object can be refined to the urban level, and the obtained green technology innovation efficiency network can be more targeted. In addition, based on existing research, appropriate models can be further adopted in the future, such as the spatial panel model and QAP (quadratic assignment process) analysis method. We can use them to deeply analyze the factors affecting the efficiency of China’s industrial green technology innovation at all stages and further explore the dynamic mechanism of its spatial correlation network evolution.

Author Contributions

Conceptualization, D.F.; methodology, X.W.; software, X.W.; validation, D.F. and X.W.; formal analysis, X.W.; investigation, D.F. and X.W.; resources, X.W.; data curation, X.W.; writing—original draft preparation, X.W.; supervision, D.F.; and funding acquisition, D.F. All authors have read and agreed to the published version of the manuscript.

Funding

This research was funded by the Key Project of the National Social Science Foundation of China (funder: Decheng Fan, the funding number: 19AGL007) and the Philosophy and Social Science Research Planning Project of Heilongjiang Province, China (funder: Decheng Fan, the funding number: 18GLD291).

Institutional Review Board Statement

Not applicable.

Informed Consent Statement

Not applicable.

Data Availability Statement

This paper analyses publicly available datasets. These data can be found here: http://www.stats.gov.cn (accessed on 20 April 2022). https://data.cnki.net/yearBook?type=type&code=A (accessed on 17 April 2022).

Acknowledgments

We would like to thank all the anonymous reviewers and editors.

Conflicts of Interest

The authors declare no conflict of interest.

References

  1. Lin, S.F.; Xiao, L.; Wang, X.J. Does air pollution hinder technological innovation in China? A perspective of innovation value chain. J. Clean. Prod. 2021, 278, 123326. [Google Scholar] [CrossRef]
  2. Yao, M.C.; Duan, J.J.; Wang, Q.S. Spatial and temporal evolution analysis of industrial green technology innovation efficiency in the Yangtze River economic belt. Int. J. Environ. Res. Public Health 2022, 19, 6361. [Google Scholar] [CrossRef] [PubMed]
  3. Li, Y. Path-breaking industrial development reduces carbon emissions: Evidence from Chinese Provinces, 1999–2011. Energy Policy 2022, 167, 113046. [Google Scholar] [CrossRef]
  4. Yang, C.; Liu, S. Spatial correlation analysis of low-carbon innovation: A case study of manufacturing patents in China. J. Clean. Prod. 2020, 273, 122893. [Google Scholar] [CrossRef]
  5. Aigner, D.J.; Lovell, C.A.K.; Schmidt, P. Formulation and estimation of stochastic frontier production function models. J. Econom. 1977, 6, 21–37. [Google Scholar] [CrossRef]
  6. Charnes, A.; Cooper, W.W.; Rhodes, E. Measuring the efficiency of decision making units. Eur. J. Oper. Res. 1978, 2, 429–444. [Google Scholar] [CrossRef]
  7. Tone, K. A slacks-based measure of super-efficiency in data envelopment analysis. Eur. J. Oper. Res. 2001, 130, 498–509. [Google Scholar] [CrossRef]
  8. Luo, Q.L.; Miao, C.L.; Sun, L.Y.; Meng, X.N.; Duan, M.M. Efficiency evaluation of green technology innovation of China’s strategic emerging industries: An empirical analysis based on Malmquist-data envelopment analysis index. J. Clean. Prod. 2019, 238, 117782. [Google Scholar] [CrossRef]
  9. Liu, C.Y.; Gao, X.Y.; Ma, W.L.; Chen, X.Y. Research on regional differences and influencing factors of green technology innovation efficiency of China’s high-tech industry. J. Comput. Appl. Math. 2020, 369, 112597. [Google Scholar] [CrossRef]
  10. Zeng, J.Y.; Škare, M.; Lafont, J. The co-integration identification of green innovation efficiency in Yangtze River Delta region. J. Bus. Res. 2021, 134, 252–262. [Google Scholar] [CrossRef]
  11. Zhang, J.; Ouyang, Y.; Ballesteros-Pérez, P.; Li, H.; Philbin, S.P.; Li, Z.; Skitmore, M. Understanding the impact of environmental regulations on green technology innovation efficiency in the construction industry. Sustain. Cities Soc. 2021, 65, 102647. [Google Scholar] [CrossRef]
  12. Miao, C.; Duan, M.; Zuo, Y.; Wu, X. Spatial heterogeneity and evolution trend of regional green innovation efficiency--an empirical study based on panel data of industrial enterprises in China’s provinces. Energy Policy 2021, 156, 112370. [Google Scholar] [CrossRef]
  13. Li, J.; Du, Y. Spatial effect of environmental regulation on green innovation efficiency: Evidence from prefectural-level cities in China. J. Clean. Prod. 2021, 286, 125032. [Google Scholar] [CrossRef]
  14. Hu, D.; Jiao, J.; Tang, Y.; Han, X.; Sun, H. The effect of global value chain position on green technology innovation efficiency: From the perspective of environmental regulation. Ecol. Indic. 2021, 121, 107195. [Google Scholar] [CrossRef]
  15. Lv, C.; Shao, C.; Lee, C.-C. Green technology innovation and financial development: Do environmental regulation and innovation output matter? Energy Econ. 2021, 98, 105237. [Google Scholar] [CrossRef]
  16. Liu, K.; Xue, Y.T.; Chen, Z.F.; Miao, Y. The spatiotemporal evolution and influencing factors of urban green innovation in China. Sci. Total Environ. 2023, 857, 159426. [Google Scholar] [CrossRef]
  17. Xu, S.R.; Wu, T.; Zhang, Y. The spatial-temporal variation and convergence of green innovation efficiency in the Yangtze River Economic Belt in China. Environ. Sci. Pollut. Res. Int. 2020, 27, 26868–26881. [Google Scholar] [CrossRef]
  18. Braun, E.; Wield, D. Regulation as a means for the social control of technology. Technol. Anal. Strateg. Manag. 1994, 6, 259–272. [Google Scholar] [CrossRef]
  19. Aguilera-Caracuel, J.; Ortiz-de-Mandojana, N. Green Innovation and Financial Performance. Organ. Environ. 2013, 26, 365–385. [Google Scholar] [CrossRef]
  20. Xu, Q.R.; Wang, Y. A New Exploration of Green Technology Innovation: A Life Cycle View. Sci. Manag. Res. 1999, 17, 001. [Google Scholar] [CrossRef]
  21. Liu, W. Research progress overview of green innovation and development at home and abroad. J. Hebei Univ. Environ. Eng. 2012, 22, 17–20. Available online: https://kns.cnki.net/kcms2/article/abstract?v=3uoqIhG8C44YLTlOAiTRKgchrJ08w1e7fm4X_1ttJAlSnrrQalYEVnCsXO8PvphMzBdCivZaFgTfh8ZDXhOjGFt_yb7QQnGr&uniplatform=NZKPT (accessed on 7 March 2023).
  22. Zhuang, Q.Q.; Wu, B.; Hong, Q.L. Market-oriented green technology innovation system:theoretical connotation, practical exploration and promotion strategy. Economist 2020, 11, 29–38. [Google Scholar] [CrossRef]
  23. Sun, C.H.; Kalirajan, K.P. Gauging the source of growth of high-tech and low-tech industries: The case of Korean manufacturing Aust. Econ. Pap. 2005, 44, 170–185. [Google Scholar] [CrossRef]
  24. Shen, L.; Qian, L. Green innovation efficiency and its spatial spillover effects in 22 major countries in the world. J. N. China U. Sci. Technol. 2020, 20, 44–53. Available online: https://kns.cnki.net/kcms2/article/abstract?v=3uoqIhG8C44YLTlOAiTRKibYlV5Vjs7i8oRR1PAr7RxjuAJk4dHXoo2exviFNhrFknUwym-H_zyHaTMy6j5QhApHzp3MQKxI&uniplatform=NZKPT (accessed on 7 March 2023).
  25. Zhang, M.F.; Hong, Y.X.; Wang, P.; Zhu, B.Z. Impacts of environmental constraint target on green innovation efficiency: Evidence from China. Sustain. Cities Soc. 2022, 83, 103973. [Google Scholar] [CrossRef]
  26. Zhang, L.Y.; Ma, X.; Ock, Y.S.; Qing, L.L. Research on Regional Differences and Influencing Factors of Chinese Industrial Green Technology Innovation Efficiency Based on Dagum Gini Coefficient Decomposition. Land 2022, 11, 122. [Google Scholar] [CrossRef]
  27. Shao, S.; Luan, R.R.; Yang, Z.B.; Li, C.Y. Does directed technological change get greener: Empirical evidence from Shanghai’s industrial green development transformation. Ecol. Indic. 2016, 69, 758–770. [Google Scholar] [CrossRef]
  28. Chen, X.H.; Zhou, P.; Hu, D.B. Influences of the ongoing digital transformation of the Chinese Economy on innovation of sustainable green technologies. Sci. Total Environ. 2023, 875, 162708. [Google Scholar] [CrossRef]
  29. Cheng, Z.H.; Yu, X.J. Can central environmental protection inspection induce corporate green technology innovation? J. Clean. Prod. 2023, 387, 135902. [Google Scholar] [CrossRef]
  30. Han, Y.; Zhe, C.H.; Liu, X.M. Is the carbon emissions trading system conducive to the urban green technology innovation level? Evid. China Energy Rep. 2023, 9, 3787–3799. [Google Scholar] [CrossRef]
  31. Yan, Z.M.; Sun, Z.; Shi, R.; Zhao, M.J. Smart city and green development: Empirical evidence from the perspective of green technological innovation. Technol. Forecast. Soc. Chang. 2023, 191, 122507. [Google Scholar] [CrossRef]
  32. Zhang, L.; Huang, L.Q. Research on proactive technology innovation efficiency of industrial enterprises: Analysis based on improved three stage SBM-DEA model. Stat. Inform. Form 2020, 35, 50–61. [Google Scholar]
  33. Fan, J.; Xiao, Z. Analysis of spatial correlation network of China’s green innovation. J. Clean. Prod. 2021, 299, 126815. [Google Scholar] [CrossRef]
  34. Liu, Y.; Shao, X.; Tang, M.; Lan, H. Spatio-temporal evolution of green innovation network and its multidimensional proximity analysis: Empirical evidence from China. J. Clean. Prod. 2021, 283, 124649. [Google Scholar] [CrossRef]
  35. Liang, Z.Y.; Chen, J.; Jiang, D.Y.; Sun, Y.P.e. Assessment of the spatial association network of green innovation: Role of energy resources in green recovery. Resour. Policy 2022, 79, 103072. [Google Scholar] [CrossRef]
  36. Sun, L.W.; Han, Y. Spatial Correlation Network Structure and Influencing Factors of Two-Stage Green Innovation Efficiency: Evidence from China. Sustainability 2022, 14, 11584. [Google Scholar] [CrossRef]
  37. Hansen, M.T.; Birkinshaw, J. The Innovation Value Chain. Harv. Bus. Rev. 2007, 4, 121–130. [Google Scholar]
  38. Roper, S.; Du, J.; Love, J.H. Modelling the innovation value chain. Res. Policy 2008, 37, 961–977. [Google Scholar] [CrossRef]
  39. Yu, Y.Z.; Liu, D.Y. The effect of the space outflow of China’s regional innovation and the effect of the outflow of value chanins: A study, from the perspective of the innovative value chain, on the model of the panel of multidimentsional space. J. Manag. World 2013, 7, 6–20+70+187. [Google Scholar] [CrossRef]
  40. Zhu, L.; Luo, J.; Dong, Q.L.; Zhao, Y.; Wang, Y.Y.; Wang, Y. Green technology innovation efficiency of energy-intensive industries in China from the perspective of shared resources: Dynamic change and improvement path. Technol. Forecast. Soc. Chang. 2021, 170, 120890. [Google Scholar] [CrossRef]
  41. Wang, Q.; Ren, S.M. Evaluation of green technology innovation efficiency in a regional context: A dynamic network slacks-based measuring approach. Technol. Forecast. Soc. Chang. 2022, 182, 121836. [Google Scholar] [CrossRef]
  42. Du, M.; Fan, D. Research on technological innovation resource allocation efficiency in knowledge intensive manufacturing industries—Semi—Parametric analysis based on dynamic StoNED model. Inq. Econ. Iss. China 2019, 11, 142–150. [Google Scholar]
  43. Tone, K.; Tsutsui, M. Network DEA: A slacks-based measure approach. Eur. J. Oper. Res. 2009, 197, 243–252. [Google Scholar] [CrossRef]
  44. Liu, Y.; Liu, Y.J. Measurement on China’s ecological welfare performance and analysis on spatial correlation network characteristics. Stat. Decis. 2021, 37, 52–57. [Google Scholar] [CrossRef]
  45. Shang, H.; Jiang, L.; Pan, X.Y.; Pan, X. Green technology innovation spillover effect and urban eco-efficiency convergence: Evidence from Chinese cities. Energy Econ. 2022, 114, 106307. [Google Scholar] [CrossRef]
  46. Yao, M.C.; Duan, J.J.; Zhang, R.J.; Xuan, Z.Y. Spatial correlation structure and influencing mechanism of green innovation efficiency of China’s high-tech industries. Resour. Environ. Yangtze Basin 2022, 31, 2345–2356. [Google Scholar]
  47. Sun, Z.R.; Fan, J.; Sun, Y.; Liu, H.C. Structural characteristics and influencing factors of spatial correlation network of green science and technology innovation efficiency in China. Econ. Geogr. 2022, 42, 33–43. [Google Scholar] [CrossRef]
Figure 1. Green technology innovation stage division.
Systems 11 00240 g001
Figure 2. Spatial correlation network map of China’s industrial green technology innovation efficiency in 2011. (a) technology R & D, (b) achievement transformation, (c) commercialization.
Systems 11 00240 g002
Figure 3. Spatial correlation network map of China’s industrial green technology innovation efficiency in 2020. (a) technology R & D, (b) achievement transformation, (c) commercialization.
Systems 11 00240 g003
Figure 4. The number of ties and density of spatial correlation network of industrial green technology innovation efficiency in China. (a) technology R & D, (b) achievement transformation, (c) commercialization.
Systems 11 00240 g004
Figure 5. The hierarchy and efficiency of spatial correlation network of industrial green technology innovation efficiency in China. (a) technology R & D, (b) achievement transformation, (c) commercialization.
Systems 11 00240 g005
Figure 6. Inter-block correlation map. (a) technology R & D, (b) achievement transformation, (c) commercialization (Note: The solid line indicates the obvious net spillover effect between sectors, and the dashed line indicates the insignificant net spillover effect).
Systems 11 00240 g006
Table 1. Evaluation index system of industrial green technology innovation efficiency in China.
Innovation StageIndicator TypeEvaluation DimensionsDescription and Measurement
Technology R & D Human inputsFull-time equivalent of R & D personnel
InputsCapital inputsInternal expenditure of R & D funds
Technical inputsThe number of R & D projects
IntermediateDesired OutputsThe number of valid invention patents
Outputs The new product development projects
Achievement transformationInputsHuman inputsThe personnel of non-R & D science and technology
Capital inputsThe non-R & D inputs
The new product development funds
Technical inputsThe number of valid invention patents
The new product development projects
Intermediate outputsDesired outputsThe utility model appearance patent
commercialization Human inputsThe annual average number of net employees
InputsCapital inputsThe stock of new fixed assets
Technical inputsThe utility model appearance patent
Final outputsDesired outputsThe new product sales revenue
Undesired outputsIndustrial wastewater emissions
Industrial SO2 emissions
Industrial fume and dust emissions
Energy consumption
Table 2. Spatial correlation network centrality analysis of China’s industrial green technology innovation efficiency in 2020.
RegionTechnology R & DAchievement TransformationCommercialization
Degree CentralityCloseness CentralityBetweenness CentralityDegree CentralityCloseness CentralityBetweenness CentralityDegree CentralityCloseness CentralityBetweenness Centrality
Beijing24.13846.7740.05520.69043.9390.02520.69045.3130.025
Tianjin27.58647.5410.15820.69043.9390.02520.69045.3130.025
Hebei41.37963.0434.18037.93160.4172.97637.93160.4174.152
Shanxi34.48360.4173.07837.93160.4176.80941.37961.7024.456
Inner Mongolia31.03459.1840.56531.03458.0000.39227.58652.7273.217
Liaoning34.48360.4170.77131.03455.7692.38431.03458.0002.622
Jilin17.24154.7170.00010.34541.4290.00010.34542.6470.000
Heilongjiang24.13856.8630.10810.34541.4290.00010.34542.6470.000
Shanghai13.79351.7860.00013.79344.6150.00013.79344.6150.000
Jiangsu93.10393.5489.43762.06972.5008.28758.62170.7326.837
Zhejiang62.06972.5004.93341.37963.0435.29241.37963.0434.408
Anhui44.82864.4441.65341.37963.0431.48137.93161.7021.676
Fujian27.58655.7691.32027.58651.7861.58934.48355.7693.025
Jiangxi31.03456.8632.26834.48355.7694.73627.58650.0002.032
Shandong62.06972.50011.51751.72465.9099.75258.62169.04812.322
Henan58.62170.7328.67362.06972.50016.93568.96676.31618.580
Hubei55.17269.0487.53744.82859.1842.17651.72467.4427.708
Hunan55.17265.9093.82055.17263.0437.14755.17263.0435.456
Guangdong55.17265.90910.99644.82859.1849.25148.27659.1849.798
Guangxi37.93159.1844.76434.48355.7691.17934.48354.7172.424
Hainan17.24152.7270.00017.24141.4290.00017.24142.0290.287
Chongqing48.27663.0432.72241.37956.8634.07644.82859.1844.730
Sichuan48.27663.0433.30737.93155.7693.93544.82858.0006.214
Guizhou31.03456.8631.34831.03452.7272.69431.03453.7041.110
Yunnan31.03456.8630.18824.13850.8770.53724.13851.7860.224
Shaanxi58.62170.7327.39058.62170.73219.40448.27665.90910.923
Gansu37.93161.7020.31927.58652.7276.75931.03455.7692.152
Qinghai27.58658.0000.00020.69049.1530.05624.13851.7860.031
Ningxia41.37963.0430.27334.48359.1840.57631.03455.7692.811
Xinjiang41.37963.0430.00048.27665.9090.00048.27665.9090.000
Average40.46061.8743.04635.17256.2353.94935.86256.8073.908
Table 3. The spatial correlation of China’s industrial green technology innovation efficiency block in 2020.
Innovation
Stage
BlocksAcceptance Relation
Matrix
Relations
Received
from
Other Blocks
Relations
Sent to
Other Blocks
Expected
Internal
Relationship
Ratio
Actual Internal
Relationship Ratio
IIIIIIIV
Technology R & DI276100211620.6962.79
II17241610144320.6935.82
III2240560924.1481.63
IV263431154224.1442.47
Achievement transformationI39780151527.5972.22
II14181510173917.2431.58
III1441442924.1482.00
IV061929142520.1453.70
commercializationI32670221324.1471.11
II172087193217.2438.46
III2351441927.5985.00
IV3102622113920.6936.07
Table 4. Density matrix and image matrix between green technology innovation efficiency blocks in Chinese industry in 2020.
Innovation
Stage
BlocksDensity MatrixImage Matrix
IIIIIIIVIIIIIIIV
Technology R & DI0.6430.1220.1790.0001000
II0.3470.5710.2860.1791110
III0.0360.0360.7140.0780010
IV0.0360.1070.5310.5540011
Achievement transformationI0.5420.1300.1110.0001000
II0.2590.6000.3130.2381110
III0.0140.0830.7320.0710010
IV0.0000.1430.3390.6900011
commercializationI0.5710.1250.0970.0001000
II0.3540.6670.1480.1671100
III0.0280.0560.7080.0630010
IV0.0540.2380.4130.5240011
Disclaimer/Publisher’s Note: The statements, opinions and data contained in all publications are solely those of the individual author(s) and contributor(s) and not of MDPI and/or the editor(s). MDPI and/or the editor(s) disclaim responsibility for any injury to people or property resulting from any ideas, methods, instructions or products referred to in the content.

