Article

Consumer Panic Buying Behavior and Supply Distribution Strategy in a Multiregional Network after a Sudden Disaster

1
School of Management, Anhui Science and Technology University, Bengbu 233000, China
2
School of Accounting, Zhejiang Gongshang University, Hangzhou 310018, China
3
School of Management, Fuzhou Technology and Business University, Fuzhou 350715, China
4
School of Statistics and Mathematics, Zhejiang Gongshang University, Hangzhou 310018, China
*
Author to whom correspondence should be addressed.
Systems 2023, 11(2), 110; https://doi.org/10.3390/systems11020110
Submission received: 28 January 2023 / Revised: 14 February 2023 / Accepted: 17 February 2023 / Published: 20 February 2023
(This article belongs to the Special Issue Frontiers in Complex Network Theory and Its Applications)

Abstract

:
Panic buying is now a frequent occurrence in many countries, leading to stockouts and supply chain disruptions. This paper highlights consumers’ panic buying behavior in different types of regions and the impact of different replenishment strategies after an emergency supply disruption. Panic buying behavior occurs when consumers try to mitigate the negative impact of a supply disruption. Therefore, this paper develops a consumer-based agency model to study the correlation between public opinion and panic buying and simulates the influence of consumers’ panic buying behavior under different situations in a complex network. The results show that the spread of panic feelings can lead to panic buying behavior among consumers, which then shocks the retailer market. The distribution of supplies according to the type of city and the number of people can have an impact on consumer panic buying behavior, and when the government adopts a restrictive strategy, implementing a quota policy or uniform rationing is very effective in reducing the number of consumers participating in panic buying.

1. Introduction

Disruptions of the material supply chain may interrupt supply following sudden disasters. There may be a rush to stockpile when the public receives news of supply shortages, leading to insufficient supplies of retailers in the region. Some members of the public will not be able to obtain the necessary supplies, and their basic livelihood security will be threatened, which may lead to social disorder and social unrest [1,2,3]. Therefore, it is of great practical significance to investigate the evolution of panic buying behavior under the condition of disruption of regional material supply and optimize the decision-making plan for emergency material dispatch and support, which can help to improve social equity and the efficiency of the emergency supply chain.
It is complex and difficult to recover the supply chain system after a sudden disaster is in a short period of time. The government first dispatches materials from suppliers in other regions to supply the affected cities; then, consumers will purchase materials from retailers in cities. On the other hand, when the scope of the disaster is large, the government may also directly intervene in the distribution of materials. The government directly distributes materials to consumers or formulates other material distribution policies. In the process of material dispatching, other factors, such as consumer purchasing behavior decisions, disaster-related public opinion information, material reserves in different regional cities, and the duration of the disaster, should also be considered [4,5]. These undoubtedly increase the difficulty of supply scheduling decisions. Therefore, the most important emergency response task is the effective allocation and dispatch of supplies.
As public opinion related to sudden disasters begins to emerge, there will be a lot of information about disasters on Weibo, Twitter and other social media. Through public opinion monitoring data platforms, it is possible to count the number of microblogs or tweets, as well as the number of reposts, that is, the volume of public opinion information [6,7,8]. With the exchange of public information, public opinion also increases and spreads constantly, affecting consumers and retailers in the affected areas, and the public may receive false or malicious negative public opinion that causes extreme panic, for example, about a lack of materials, the long duration of disasters, rumors of disasters and other negative public opinion. Moreover, retailers cannot obtain materials directly from suppliers in a short period of time; they can only sell existing materials. In other words, the public can only buy limited materials from retailers, which exacerbates the public panic to some extent. Negative public opinion encourages the public to purchase a large amount of material in a short time, which leads to panic buying. Once materials cannot be replenished in time and some consumers cannot buy needed materials, these uncertainties and public opinion can endanger the harmony and stability of the entire society. Therefore, it is critical to control the increase in negative public opinion and to guarantee the supply of basic materials. It is necessary to optimize the material supply system, reduce the emergence of panic purchases as much as possible and guarantee the stability of material supply in the region.
From a retail perspective, panic buying actually disrupts the supply chain of materials within the region [2]. After a disaster, on the one hand, it is necessary to secure the supply of materials to prevent the phenomenon of panic buying; on the other hand, it is also necessary to ensure that consumers in different regions can access basic living materials after panic buying. In addition, there are some vulnerable groups in different regions. Vulnerable groups refer to those who do not have enough living materials or cannot buy materials due to inconvenience factors (such as the elderly or the poor). After a disaster, when daily necessities are constantly consumed and storage materials are insufficient, panic buying may occur. In this process, some affected groups will be transformed into vulnerable groups due to insufficient materials. Basic living materials are the most important, and the group with the fewest materials is the most damaged. Therefore, it is essential to provide necessary materials to vulnerable groups while ensuring the efficiency of the supply chain.
A complex network has significant advantages for research on public opinion communication and panic buying behavior because it can enable researchers to connect the micro-level individual and macro-level system and generate a comprehensive or interconnected complete space formed by the interaction between individual users. Therefore, using complex networks as a research tool can better explain the changes among research subjects and how these factors affect the relationship structure of the whole social network. The formation and development of public opinion cannot be separated from the strong and weak connection between microindividuals, and the transmission of panic buying behavior cannot be separated from the relationship between various participants. Therefore, complex networks are also valuable tools for understanding supply chain networks [9]. According to the above analysis, the supply of materials under sudden disasters is a very complex problem. Consumers affected by negative public opinion may exhibit panic buying behavior, resulting in a shortage of materials among regional retailers, which increases the difficulty of material supply. However, previous studies have not considered the situation of material distribution strategies and assistance to vulnerable groups from the perspective of complex networks. Thus, in this paper, we propose a consumer panic buying model based on a complex network of a cross-regional supply chain to analyze the forming factors of panic buying and study supply allocation methods, especially material assistance for vulnerable groups under different situations, so as to discover strategies to reduce consumers’ panic purchasing behavior and solve complex material supply problems. This research can provide a scientific basis to effectively respond to a wide range of panic buying.
The structure of this paper is arranged as follows, First, Section 2 presents an overall discussion of panic buying and disaster rescue through a literature review. In Section 3, we construct a cross-regional panic buying model and a public opinion information transformation panic model, as well as a clustering algorithm, to assign consumers within the region to corresponding retailers. Thirdly, Section 4 focuses on applying simulation experiments to analyze cross-regional buying behavior and material allocation strategies under different cases. Finally, conclusions and suggestions for future research are identified in Section 5.

2. Literature Review

At present, plenty of literature focuses on panic buying behavior after disasters. Panic buying leads to an imbalance in commodity purchasing, and intervention is needed to reduce its harm [10,11,12]. Herbon and Kogan [13] state that competition cannot suppress panic and will lead to frequent price fluctuations by considering suppliers’ allocation of scarce materials to two competing retailers. In terms of the effect of Internet rumors on panic buying, Li et al. [14] argue that rumors on the Internet trigger real-life panic buying and that panic buying in some areas does not cause all areas to participate in panic buying. Li et al. [15] state that the results reveal that panic buying can be explained as a response to both environmental stimuli and reflective thinking and that emotional reactions stimulate panic buying to some extent. According to Kassas and Nayga [16], the timing and importance of household panic buying are related to household structural characteristics, with hygiene products and protective equipment preferred over non-perishable foods, and psychological factors play an essential role in panic buying. Pan et al. [17] suggest that retailer characteristics (retail network and product variety), household characteristics (income and disaster experience) and disaster characteristics (disaster intensity and proximity) significantly influence consumer stockpiling, and pharmaceuticals are considered to have the largest stockpiling demand. Gupta and Gentry [18] showed that under the condition of perceived scarcity, the increase in purchase urgency promotes consumers’ tendency to hoard. Panic buying is often directly related to disasters. Based on these studies, in this paper, we also pay attention to the context of consumer opinion; furthermore, the increase in public opinion information also prompts consumers to panic more.
In terms of supply chain security, Li et al. [19] studied different agricultural supply chain disruption scenarios and found that multisource sourcing can only improve the supply chain to a limited extent and that it is important to focus on strengthening the resilience of the supply chain model. In view of supply interruption and the purchasing behavior of retailers, Yang [20] proposed an information update model based on Bayesian statistics, suggesting that suppliers can update information in real time and construct an optimal production decision model. Maghsoudi [21] studied the supply chain of humanitarian aid organizations and found that resource sharing, supply chain responsiveness and flexibility can have a significant impact on rescue, while resource scarcity and redundancy can significantly weaken resource sharing. Burgos and Ivanov [22] developed and applied a discrete-event simulation model, the results of which show that food retail supply chain resilience is affected by disasters and the intensity of government regulation and that supplier operational performance is the most affected by demand surges and supplier disruptions, whereas transportation disruptions have less of an impact on suppliers. Referring to human psychology and social cognitive theory, Sheu and Kuo [23] argue that disaster risk, social impact and emotional response enable members in the supply chain to hoard materials speculatively, eventually leading to the interruption of the agricultural supply chain. Collectively, these studies outline a critical role for supply chain disruption. Disasters can be costly for suppliers, retailers and consumers alike, and they all take different measures to reduce damage and improve their own survival. According to the above research, disasters can cause huge losses to suppliers, retailers and consumers alike. At the same time, they will take various measures to reduce damage and improve their own viability. The core problem is how to improve the supply of materials to the public in order to achieve sustainable development.
In addition, post-disaster emergency rescue research focuses on emergency material allocation, scheduling optimization, reserve site selection, etc. Zhang et al. [24] established a stochastic programming model to simulate the allocation of emergency resources in view of the multistage rescue of secondary disasters. By using local information systems, Shapira et al. [25] developed an information sharing model that can provide resource control and allocation for emergency decision makers; however, political complexity and the availability of tools can impact the use of the system. Wang et al. [26] proposed a site-selection framework model based on uncertain time costs and scenarios, using a particle swarm optimization algorithm to solve specific instances. Cao et al. [27] proposed a multiobjective, bi-level planning rescue model to meet the material supply needs to the greatest extent possible and maximize the satisfaction of the affected groups. Ghaffari et al. [28] proposed an integrated supply chain network model involving local and global suppliers of medical rescue supplies to allocate and arrange relief resources composed of relief projects and medical teams in order to meet emergency rescue needs. The above literature only studies specific emergency scheduling optimization problems, which cannot satisfy the rescue needs of special groups; therefore, rescue fairness cannot be achieved, which will still lead to panic buying.
From the above literature, it can be seen that panic buying behavior is an important reason for supply interruption after disasters, and some studies have also involved improving supply elasticity and reducing the impact of panic buying. However, there are still some research gaps. First, previous studies mainly focused on the content of online public opinion events and did not pay attention to changes in the amount of public opinion information and the impact on consumers’ panic. Secondly, many researchers have studied individual rush buying behavior. Even following the same disaster, consumers will exhibit different buying behaviors in cities of different sizes. Finally, there is still a lack of effective material distribution strategies, and research on assistance for vulnerable groups is not deep enough. Few scholars have studied the assistance methods of vulnerable groups. Thus, from the perspective of a complex network, in this paper, we establish a panic buying framework under a multiregional model that takes into account the influence of the diffusion of public opinion information on panic buying and focuses on solving the distribution of emergency supplies in different regions and the satisfaction degree of vulnerable groups, optimizes the supply decision of emergency supplies and reduces the risk of panic buying.

3. Model Descriptions

Supplies are interrupted in the early stage of sudden disasters, and in order to reduce the panic buying of consumers in the region, in this paper, we focus on exploring the formation mechanism of consumer panic psychology and reasonably allocating emergency supplies. The research strategy mainly includes four processes. First, in this paper, we build a model of consumers purchasing supplies, which shows that consumers may go to other cities to purchase supplies when their area is short of supplies. Secondly, a model for the transformation panic of public opinion information is constructed. Moreover, a clustering algorithm is used to divide consumers into multiple groups to identify retailers who are purchasing supplies for the first time. Finally, in this paper, we simulate the panic buying behavior of consumers and analyze the law of public opinion diffusion [29], as well as the changes in the level of consumer panic in different stages of public opinion information volume, and study the influence of different supply distribution methods on consumers’ panic buying behavior.

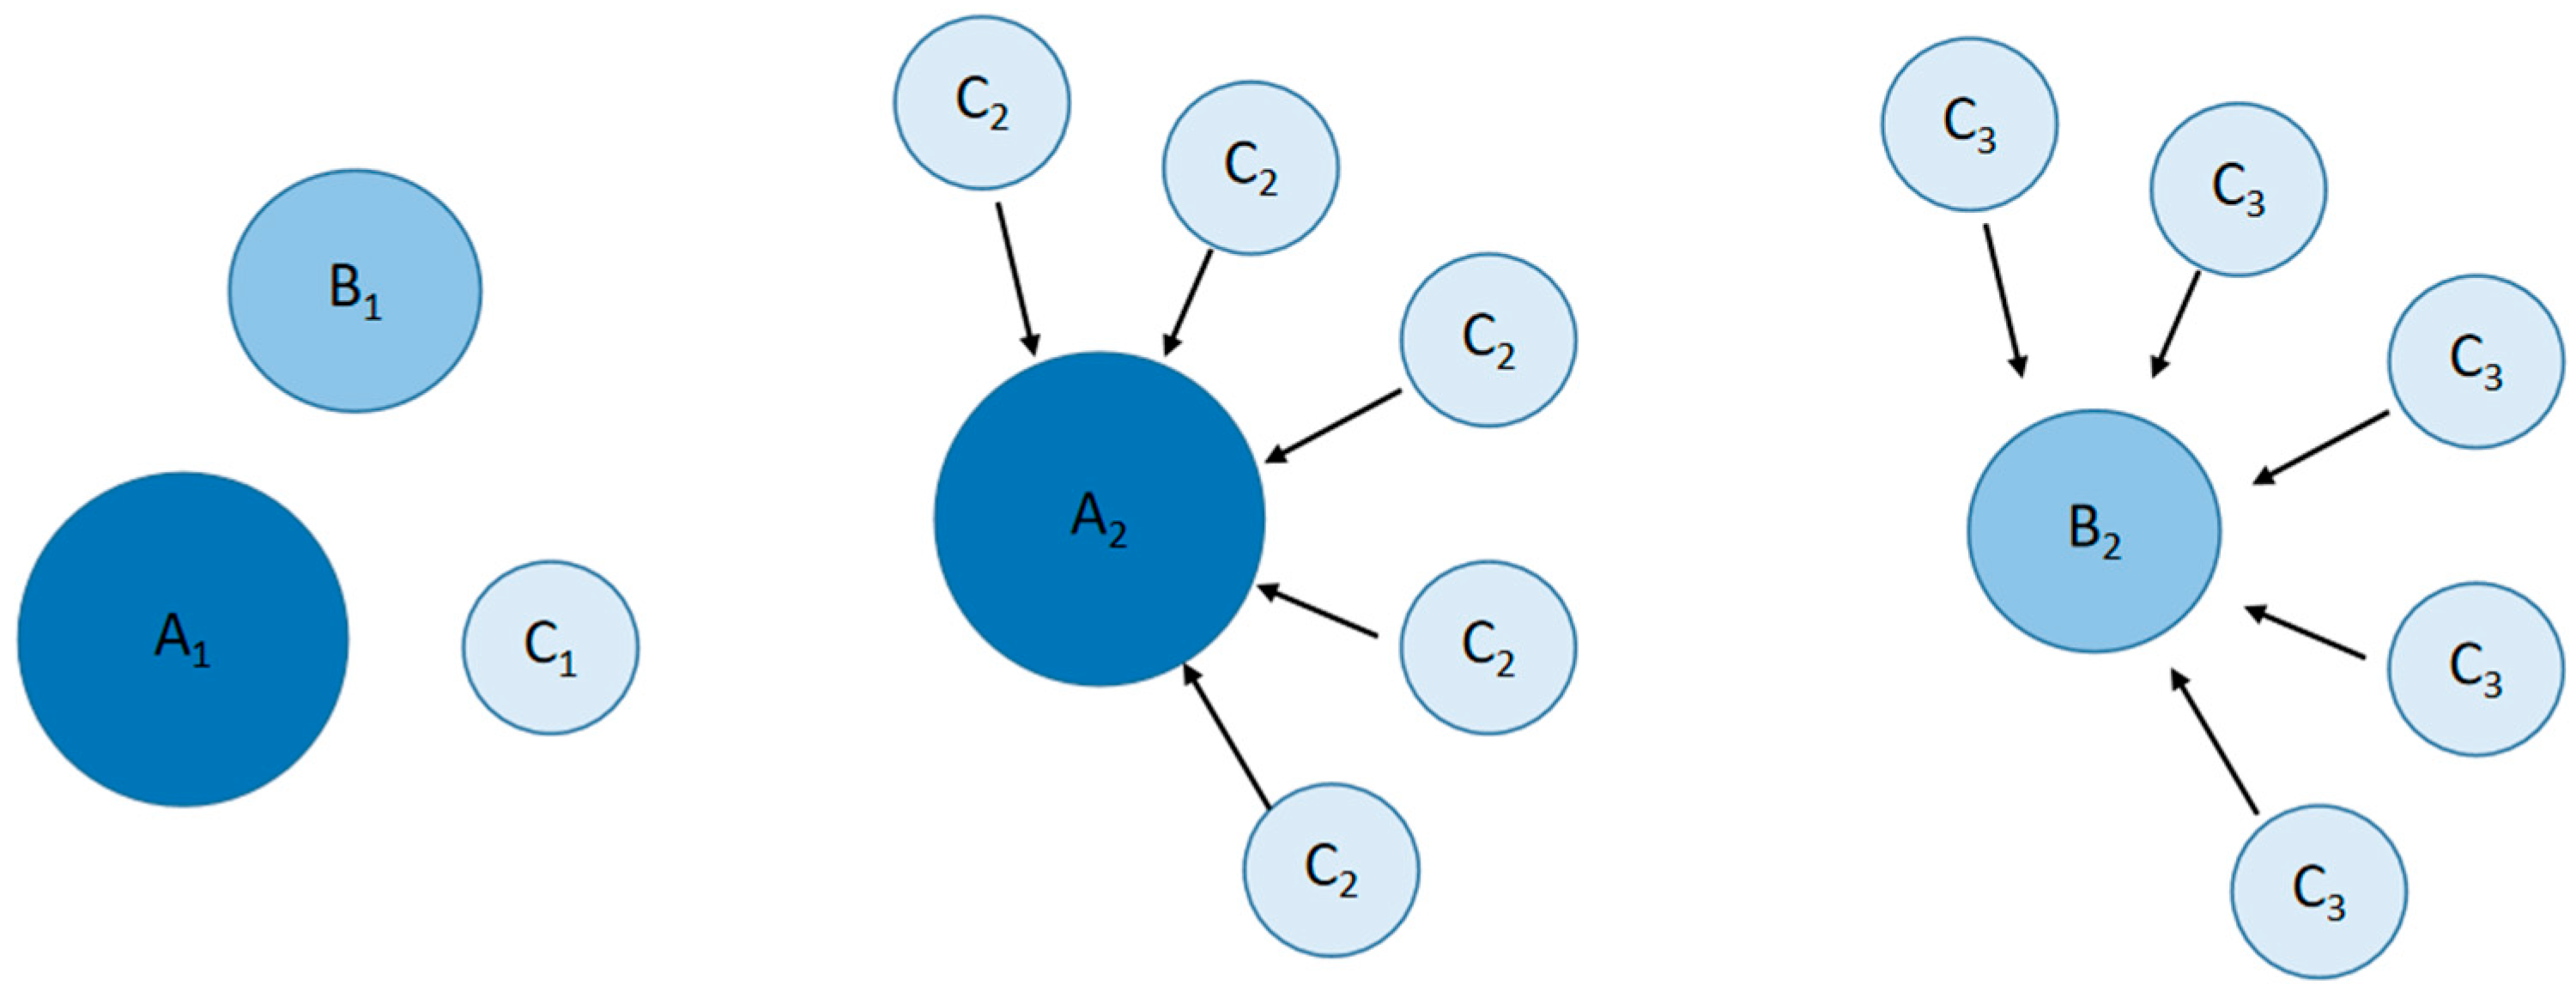
3.1. Description of Cross-Regional Purchases

Sudden disasters can have a wide range of consequences for many areas. Suppose there are large-scale urban areas, suburban medium-sized urban areas adjacent to large core urban areas and remote small urban areas; the three types of urban areas have different levels of commercial development and populations. Large-scale cities are the most densely populated, with the most commercial development and the largest number of retailers. Because large-scale cities have the characteristics of high population density and high mobility, all retailers in large core cities jointly serve all customers within the city with household goods, and customers can choose any retailer to purchase supplies. The second category is medium-sized suburban cities, where the population size and commercial development are lower than in large core cities, and the number of retailers is also lower than in core cities. Customers in medium-sized cities usually only choose the nearest retailer to buy their daily supplies. Finally, remote and small urban areas have the smallest populations and the minimum number of retailers, and consumers do not usually travel to other types of cities to buy supplies. However, when a disaster occurs, consumers tend to travel across the region to cities with more retailers to buy supplies because of shortages and survival needs. However, consumers in large or medium-sized cities do not travel to smaller cities to buy supplies because if supplies are not available in these cities, it will be difficult to secure supplies in smaller cities as well, as shown in Figure 1.
Figure 1 shows three types of cities: a large urban area (A2) surrounded by many small urban areas (C2) and a medium-sized urban area (B2) surrounded by many small urban areas (C3). In order to analyze the impact of city type and size on panic buying behavior, in this paper, we assumes that there is an isolated large urban area (A1), a medium-sized urban area (B1) and a small urban area (C1) for comparison.
Each type of urban area has a certain number of retailers that supply consumers within their respective urban areas to meet the material needs of the urban areas. The arrows between cities indicate that there is geographical mobility between these areas, and residents in different urban areas can cross regions to access supplies from other urban areas. Therefore, retailers in the large urban area (A2) can sell goods to residents in the small urban area (C2) in the event of a disaster. Similarly, retailers from the medium-sized urban area (B2) can sell goods to residents of the small urban area (C3).

3.2. Customer Purchase Behavior Model

In the early stages of a disaster, most customers are not aware of whether the disaster is serious and whether they need to stockpile. As food has a certain shelf life and considering the limitation of storage space, many customers do not choose to buy large quantities of supplies. A customer buying supplies at moment t is denoted by the Boolean variable Si(t), and Si(t) = 1 indicates that the purchase of supplies occurs at moment t for customer I and vice-versa, as shown in Equation (1).
S i t = 0 Not   purchased   at   moment   t 1 Purchased   at   moment   t
Assuming that the number of consumers in this supply chain network is N, the number of consumers who buy supplies at any given moment (Nb(t)) can be calculated as Equation (2).
Nb(t) = N × Si(t)
Therefore, the total amount of supplies (Mb(t)) purchased by consumers at any given moment in the emergency supply network can be calculated as in Equation (3).
Mb(t) = mi × Nb(t) = mi × N × Si(t)
where mi is the quantity of supplies purchased by the consumer. When the supplies owned by consumers are consumed as safety stock, quantitative replenishment is used to replenish the amount of supplies to the highest value of storage by purchasing the same amount of supplies each time. Assuming that the consumer’s current supply possession is M and the time required to consume all the current supplies is T, then the necessary supply consumption (Rt) of the consumer at any time is
R t = M T
From the above, it is clear that in an equilibrium network, the amount of material purchased by all consumers is equal to the amount of supply of materials and also equal to the amount of material consumption over a period of time.

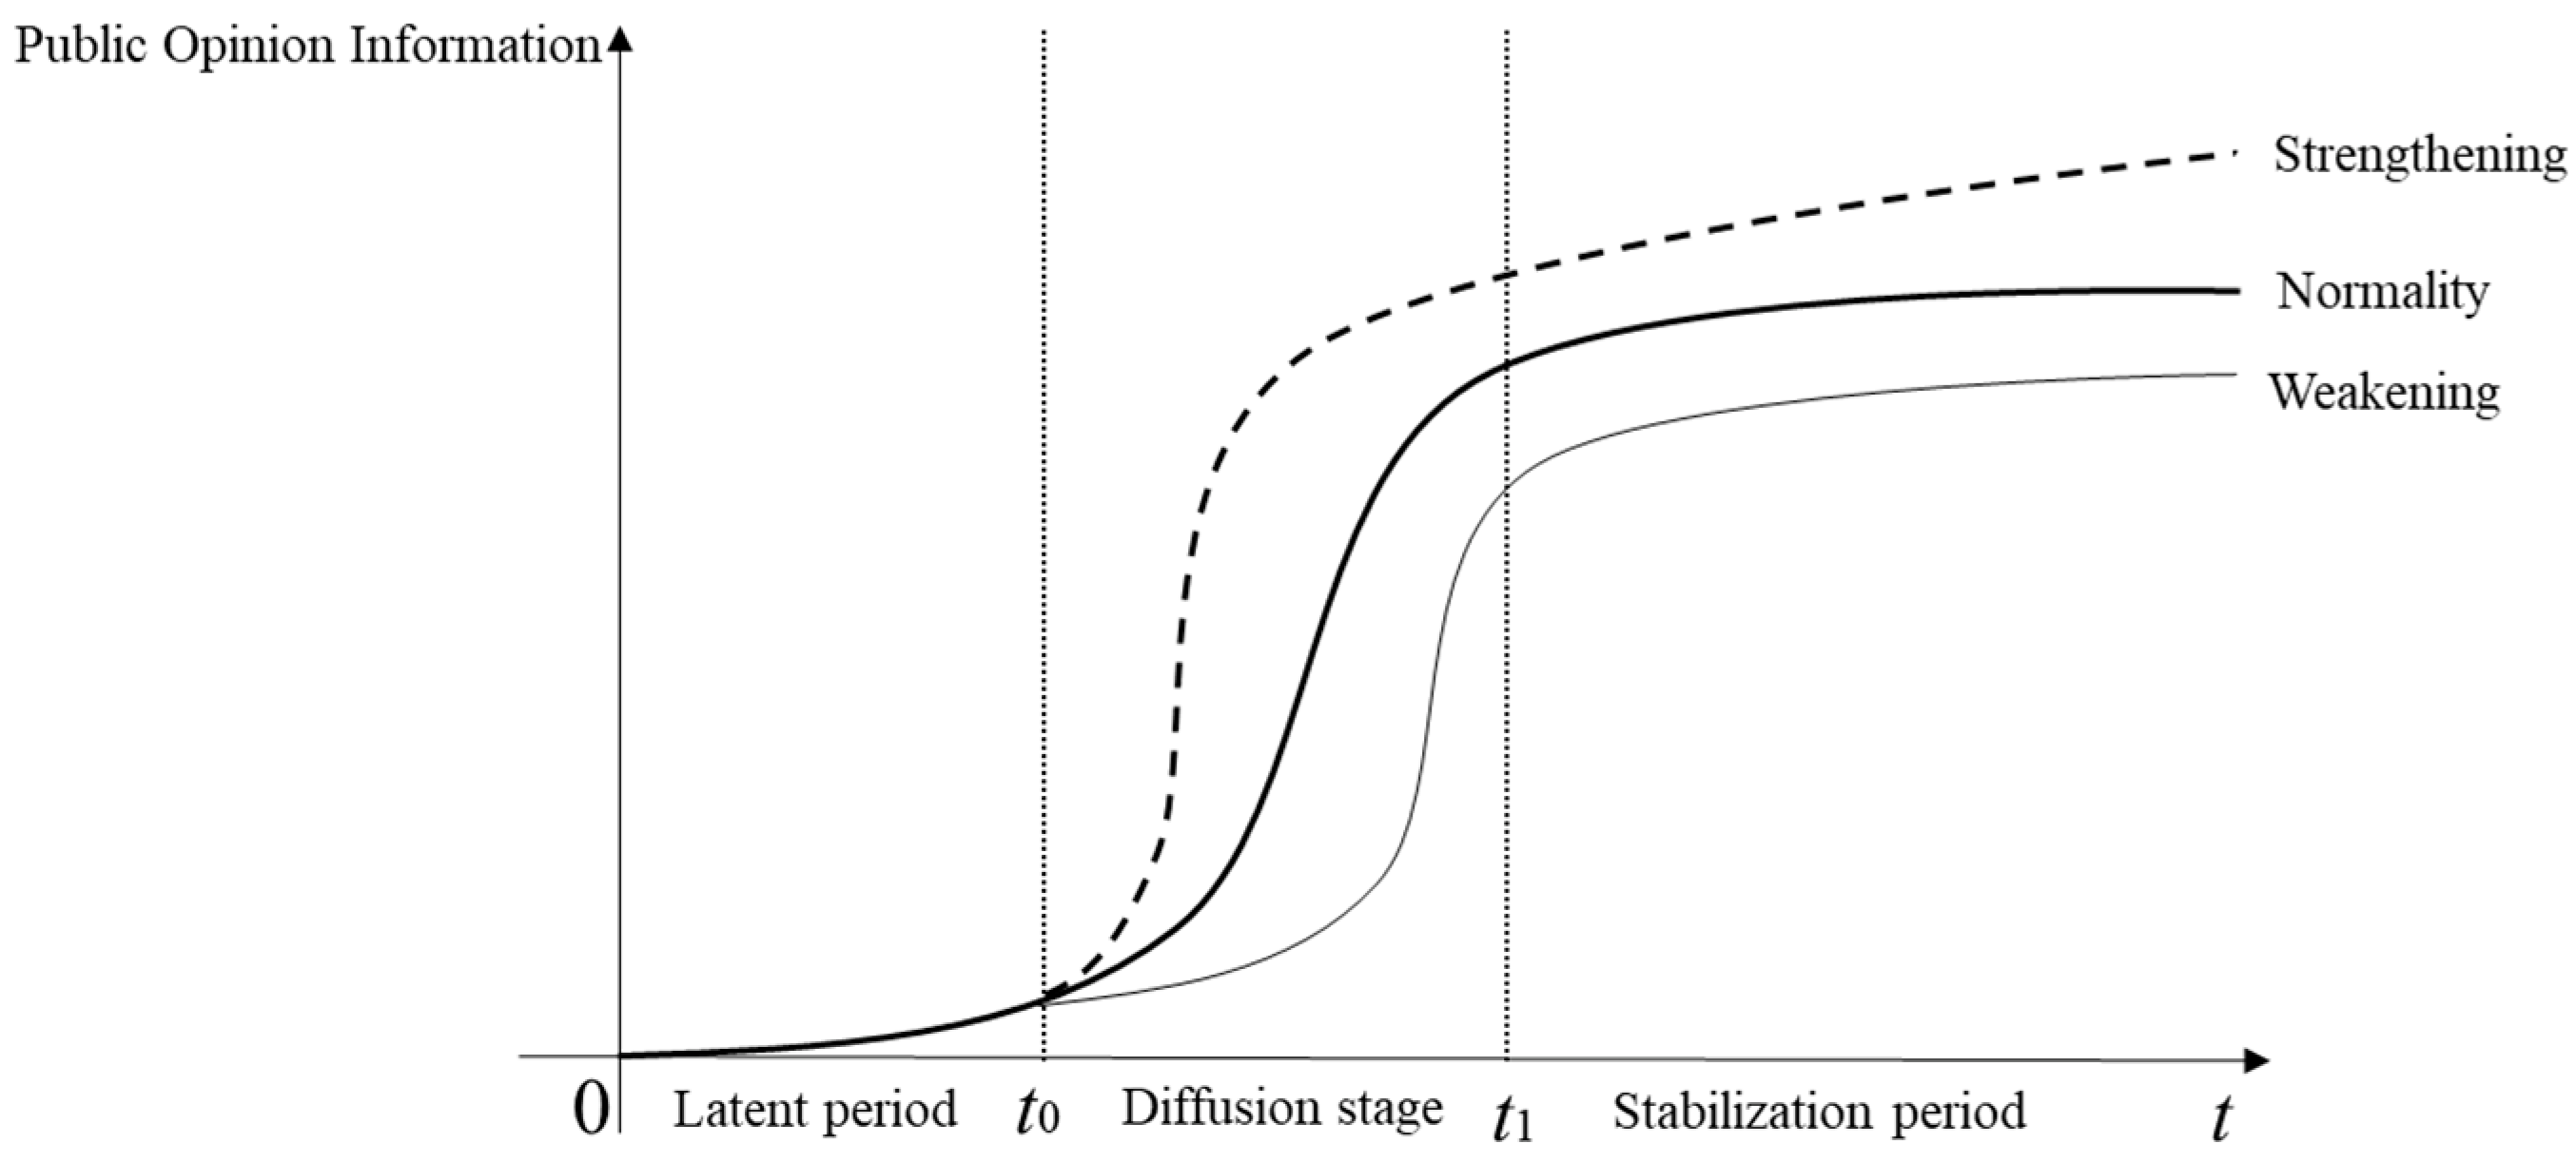
3.3. Public Opinion Information Diffusion Model and Panic Feeling Model

Panic feeling after a disaster comes from the uncertainty of information, especially when public opinion information is filled with a large amount of negative information, such as about a lack of goods, inability to rescue in time, secondary disasters, etc. People are not sure about the authenticity of this information, which leads to distrust of media content and exacerbates people’s panic feeling [30,31,32]. In addition, the panic feeling caused by negative public opinion information further expands the scope of panic feeling as consumers communicate with each other. Therefore, a model of panic feeling is proposed based on public opinion information, which places emphasis on studying the evolutionary law of public opinion information diffusion and its mechanism for the formation of consumer panic feeling.
After a sudden disaster, the appearance and duration of negative public opinion are not certain, but the volume of negative public opinion information can be determined. In addition, negative public opinion is the main source of panic, which helps to examine how public opinion information affects the degree of consumer panic [33,34,35]. In this paper, we classify negative public opinion information into three states: strengthened state, normal state and weakened state [36,37]. Public opinion in the strengthened state is influenced by information alienation, emotional polarization and other factors, and the evolution of the amount of public opinion information deviates from the normal state, which enables the amount of public opinion information to increase significantly in a short period of time to a level beyond the normal state. Public opinion can be controlled by means of deleting and blocking information and then transformed into public opinion information in the weakened state, in which the amount of public opinion information is less than that in the normal state. The maximum amount of information on public opinion in the strengthened state increases, and the information growth rate becomes faster. The maximum amount of public opinion information in the weakened state is reduced, and the information growth rate slows down. The generation and diffusion of public opinion information under different states are shown in Figure 2.
Furthermore, public opinion information can be divided into three stages: the incubation stage, the diffusion stage and the stable stage. In the incubation stage of public opinion information, public opinion has just begun to be conceived, the volume of information is relatively small and the development direction of public opinion information cannot be determined. During the diffusion stage, the amount of public opinion information is divided into a strengthened state, a normal state and a weakened state, and the increased speed and diffusion of the information volume range from high to low in the three states. The last stage is the stable stage of public opinion information, where the growth rate becomes flat. According to information life cycle theory [38], information can be divided into an incubation period, diffusion period and fading period. Public opinion is also a kind of information, and the statistical data accumulation of public opinion information has obvious “S-shaped” data characteristics. Therefore, the improved logistic growth curve function model is applied to represent the growth process of public opinion information [39,40]. The volume of public opinion information in the normal state (y) can be expressed as Equation (5).
y = Y 1 + Y y 0 1 e θ t
where θ > 0 is the growth rate of opinion information volume, y0 is the initial opinion information volume and Y is the upper limit of opinion information volume.
y ( t ) = Y 1 a Y 1 + Y y 0 1 e θ t Y 1 + a Y 1 + Y y 0 1 e θ t
Equation (6) describe the volume of public opinion information in the strengthened and weakened states, respectively, where a denotes the public opinion strengthening (weakening) coefficient. As θ > 0, it can be inferred that 0 < 1 − y Y   < 1. Because the accumulated amount of public opinion information has been increasing, we take the derivative of Equations (5) and (6); the function after the derivative is monotonically increasing, i.e., 0 < y < Y, d y d t > 0. If t → -∞, then y → 0, where y = 0 is the lower asymptote of the model. If t → ∞, then yY, where Y is the upper limit of the monotonically increasing y(t). The value range of a is calculated based on the result after derivation. When the spread of public opinion is in a strengthened state, 0 < a < 1 Y ; when the spread of public opinion is in a weakened state, 1 Y 1 y   < −a < 0.
When negative public opinion begins to spread, panic spreads with it. In addition to uncertainty about negative public opinion information, consumers’ panic is also influenced by their own sense of security. It is most important to meet one’s sensation of life safety when a sudden disaster occurs; therefore, the amount of material reserves can also affect the public’s panic. Therefore, according to the analysis of public opinion and the quantity of consumer supplies owned, the consumer panic model can be expressed as Equation (7).
X i = p y   + q ( 1 M )
The larger the value of M, the more one’s sense of security is satisfied and the lower the level of panic. p and q represent the influence coefficients of y and 1 M , respectively, and p + q = 1.
In a disaster, retailers similarly receive negative public opinion information, which then influences their stocking decisions. As negative public opinion information gradually increases, the perceived risk of a disaster increases, which enables retailers to increase their stock of supplies for sale. If there are not enough supplies to sell, losses will be incurred. Hence, retailers can only make more profit if they have enough supplies to sell. The amount of retailer supply reserves (L) affected by the amount of public opinion information is:
L = L 0 + y 2 Y × w
where L0 denotes the retailer’s initial quantity of supplies, and w is the quantity of supplies purchased. In order to strengthen the influence of public opinion information on the retailer’s material reserve, in this paper, we use the ratio of the square of the volume of public opinion information received by the retailer relative to the upper limit of the volume of public opinion information as the multiplier of the quantity of supplies purchased; the greater the volume of public opinion information, the greater the quantity of supplies purchased, although not exceeding the storage limit.

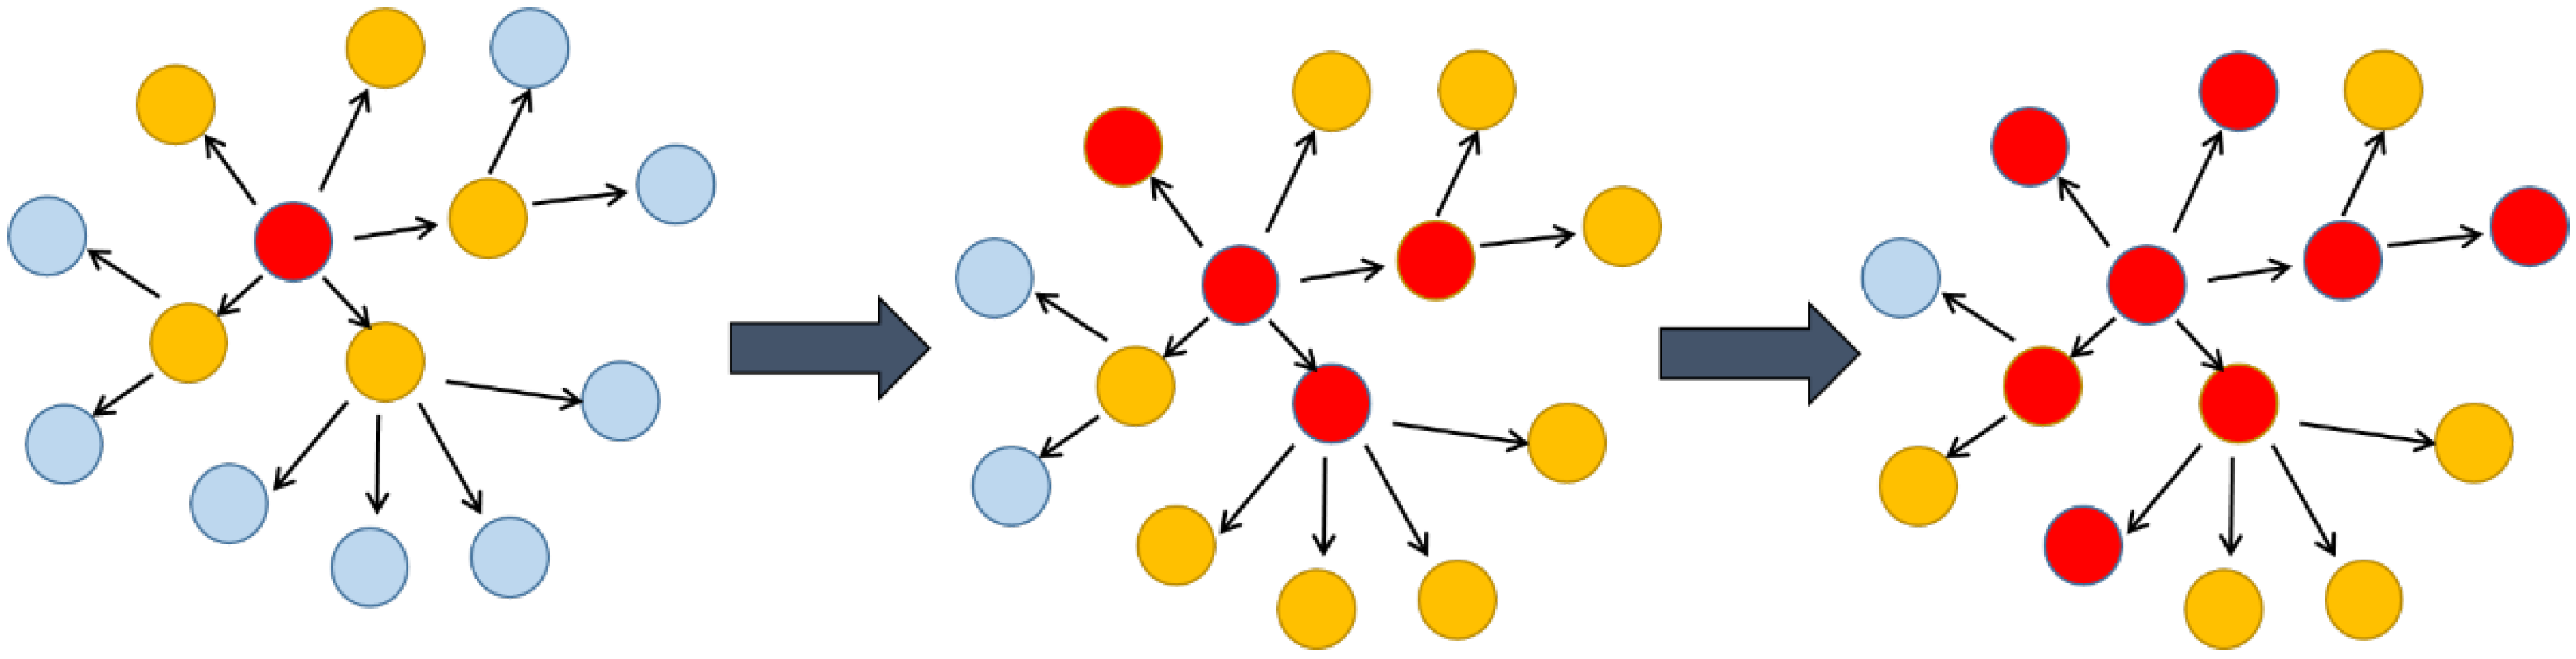
3.4. Consumer Panic Buying Model

Based on the above, in this paper, we assume that the emergency supply network has two main types of nodes: retailers and consumers. Prior to a disaster, the supply chain network is a partially closed-loop, steady-state network; the goods obtained by suppliers from outside the network are equal to the materials obtained by retailers from the supplier and equal to the goods obtained by all consumers from retailers. However, when a disaster occurs, parts of the supply chain system may be disrupted, such as suppliers being unable to deliver supplies to retailers in time or retailers running out of stock, leading to a perceived lack of supplies and panic buying among consumers at the end of the supply chain, which, in turn, leads to a greater shortage of supplies.
When suppliers are unable to provide a stable supply to retailers, retailers with a small stockpile of supplies will sell out of supplies first, resulting in a disruption in the supply chain. Consumers who are supplied by these retailers directly feel that they lack supplies, resulting in cross-regional panic buying behaviors. In general, consumers who own more supplies will feel more secure to some extent; therefore, the probability of participating in panic buying is inversely correlated with the quantity of supplies they own. It is worth noting that the amount of materials stored by individuals will decrease over time, and the probability of consumers’ panic buying behavior will gradually increase.
At the same time, each consumer is not isolated in real life. When a consumer finds out that a retailer is out of stock, he will immediately inform his close friends, family members or neighbors, who will then be more likely to follow these purchase suggestions, potentially resulting in large-scale panic buying. In the supply network, if consumer node i finds that a retailer is out of stock, he will only convey the out-of-stock information to his neighboring node (j), interacting with the neighboring nodes, and all nodes (j) connected to node i will start snapping up supplies. A consumer node exhibiting panic buying behavior induces individuals in the rest of the network to follow the behavior, which subsequently leads to large-scale panic buying.
The Kuramoto model [41] is a mathematical model for describing synchronization that is introduced here to explain the behavior of individuals influenced by others. Specifically, it shows the synchronous behavior of a large number of coupled oscillators. The model assumes that all the oscillators are identical or almost identical, that the coupling between them is weak and that the strength of the interaction between any two oscillators depends on the sine of their phase difference, as shown in Equation (9).
d θ i d t = ω i + K N j = 1 N sin θ j θ i , i = 1 , , N
In a supply network, assume that the geographical location of consumer i is Di and that the geographical location of consumer j is Dj. Then, the distance difference (Dij) between the two is calculated as follows [42].
D ij = x i x j 2 + y i y j 2
where D(xi, yi) is the coordinate position of node i, and if Dij is less than the set threshold (Dmax), then individual i and individual j are neighbors. We abstract consumers in reality into nodes on the map, and abstract nodes do not consider obstacles. Equation (10) uses Euclidean distance for calculation. In order to identify neighbors in the network, we assume that two individuals with a distance of less than a certain threshold are neighbors and will influence each other. In fact, only two geographically close individuals can become neighbors and interact offline in a real-life situation. Therefore, the handling of distance issue is relatively simple without obstacles. Since large urban areas are densely populated, the number of individual neighbors in large urban areas will be greater than that in medium-sized urban areas.
The consumer’s decision as to whether to panic buy at time t is affected by the degree of panic feeling of the previous moment and the degree of panic feeling of their neighbor. The decision of individual consumer i to panic buy at time t is expressed by Zi in the range of 0–1.
Z i t = X i t + K N j = 1 N sin X j X i , i = 1 , , N if   D i j t < D max 0 if   D i j t D max
where denotes the coefficient by which individual i is influenced by others, and N refers to the number of neighbors influenced per unit moment. If the threshold at which an individual is influenced by panic and engages in panic buying behavior is h, then Equation (1) above can be modified as Equation (12).
S i t = 0 if   Z i t < h 1 if   Z i t h
The panic buying transmission process is shown in Figure 3.
The red node is an individual who is in panic, and the yellow node is the red node’s neighbor node in the above figure. If a node feels panic at moment t, panic may be transmitted to its neighbor nodes. However, some neighbor nodes begin to panic at the t + 1 moment and continue to transmit panic. Consumers join in panic purchasing when the panic feeling value exceeds the threshold value.

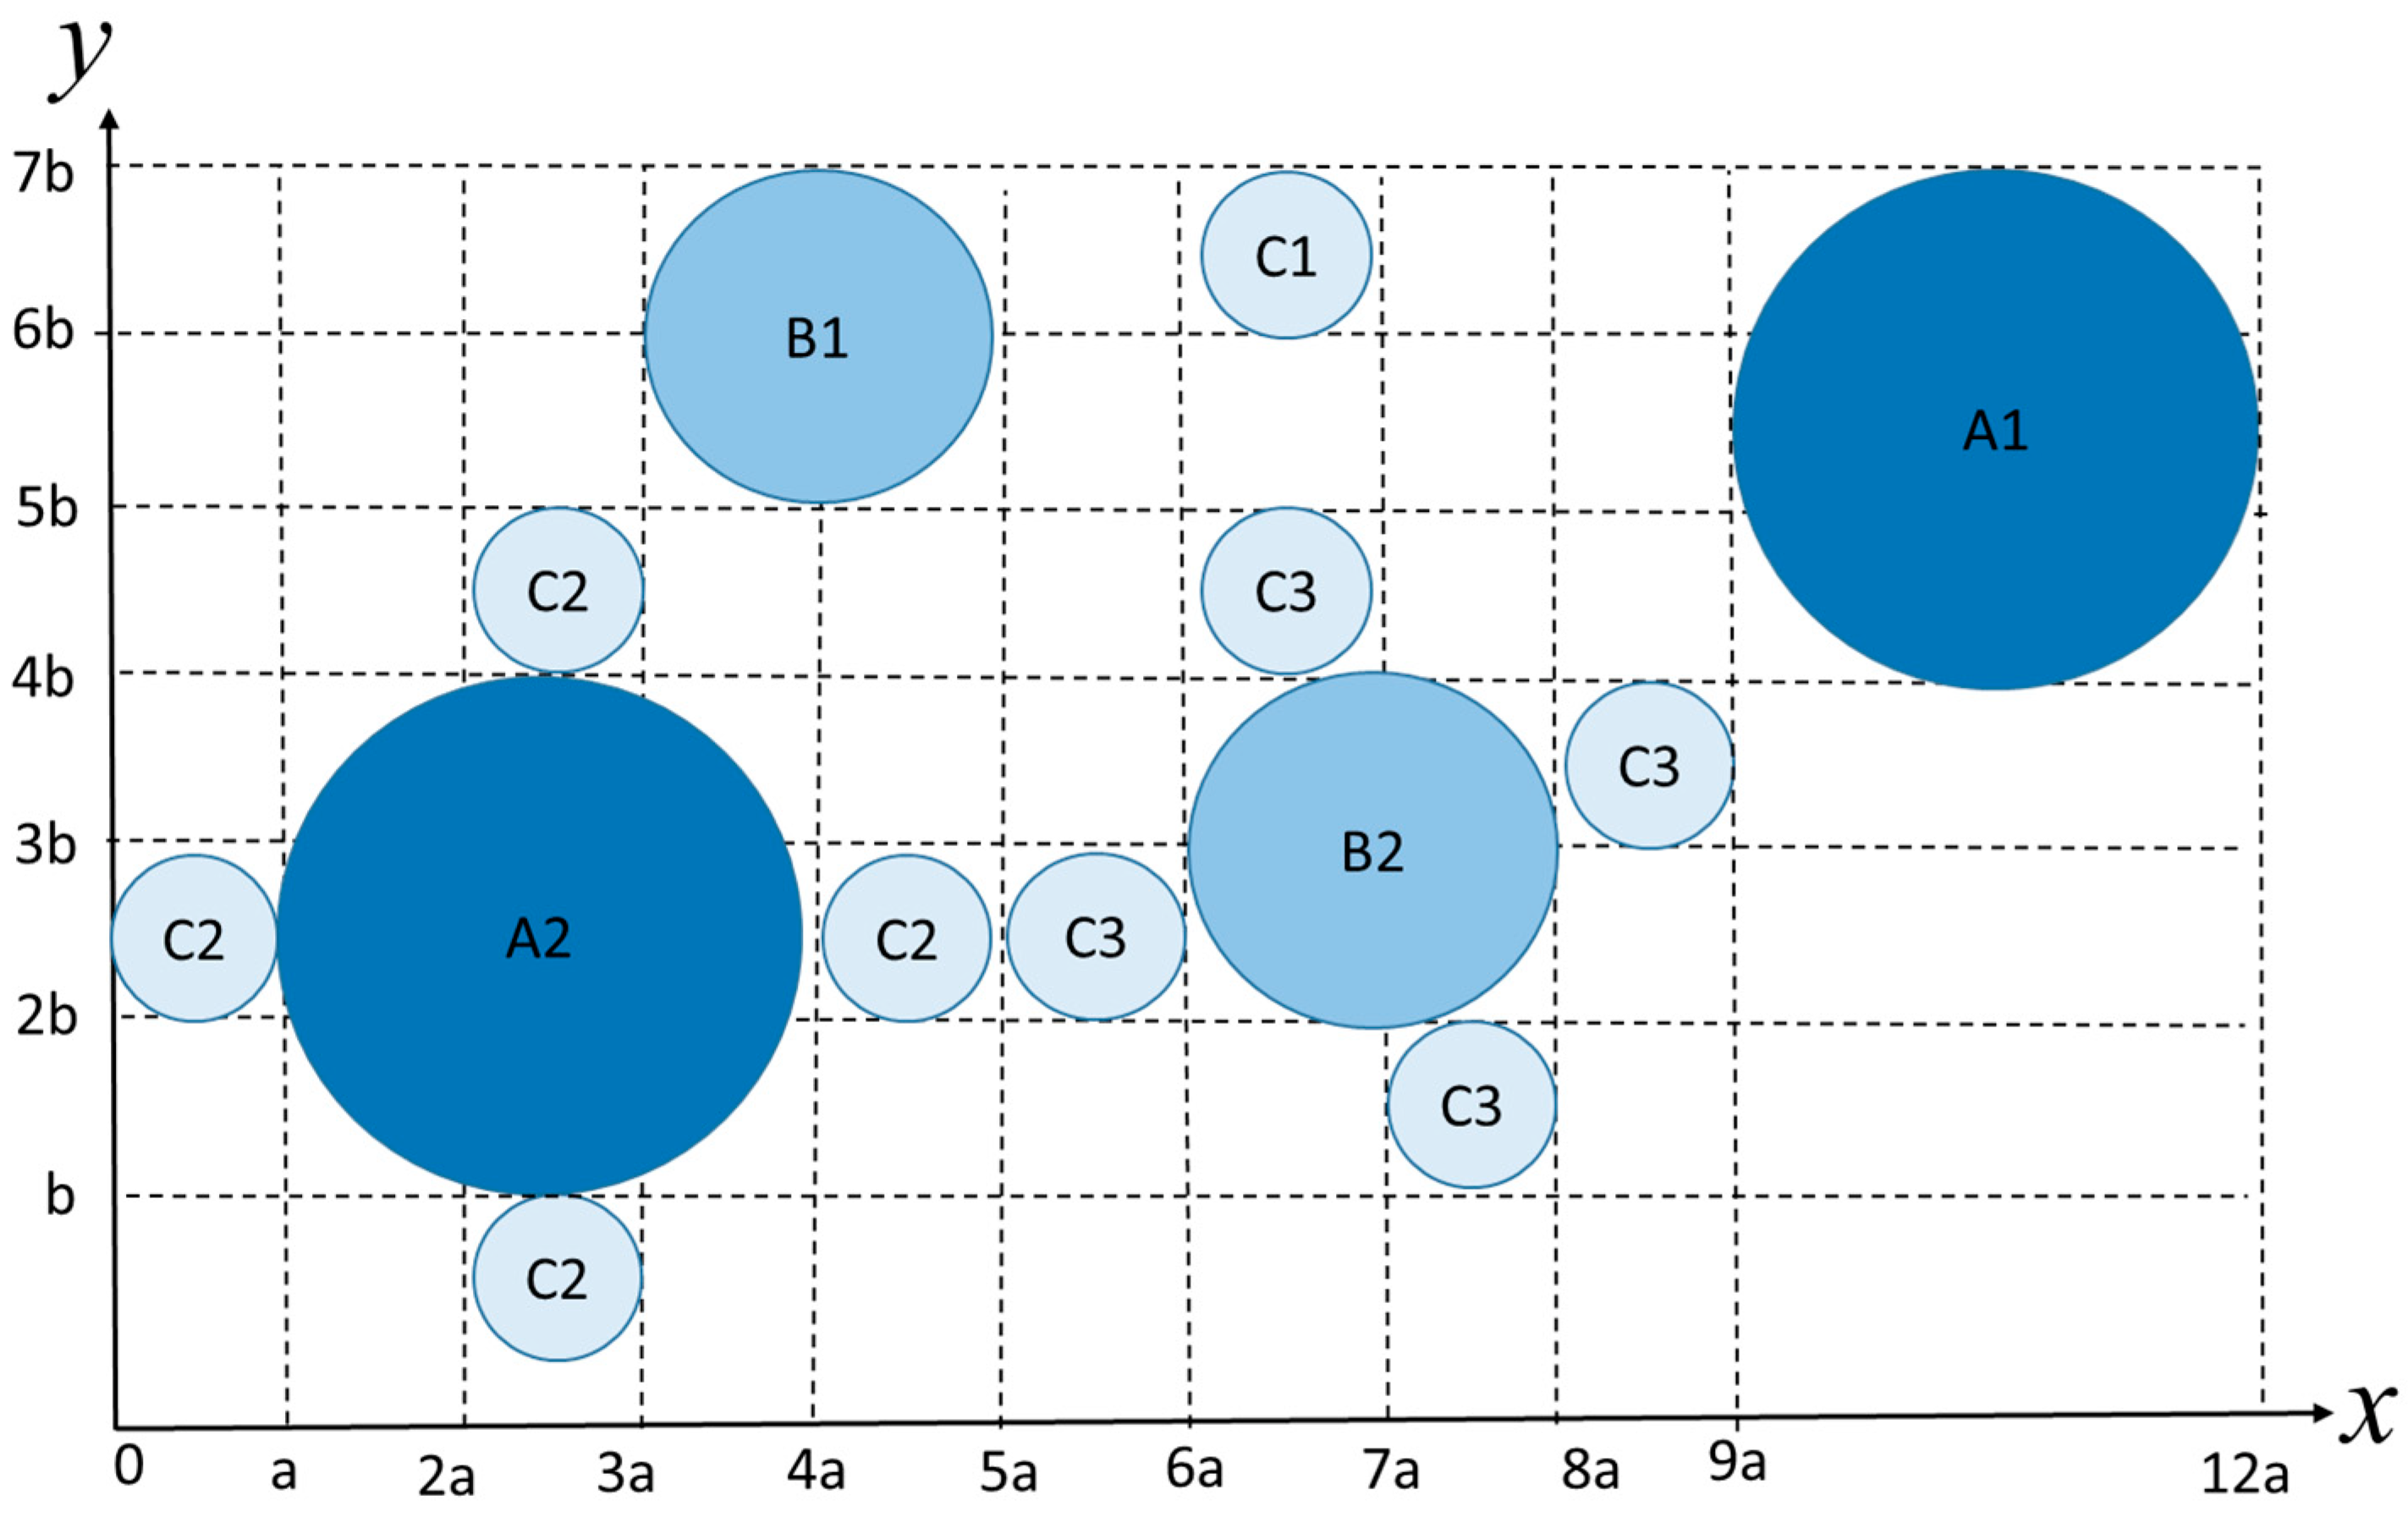
3.5. Clustering Algorithm

In order to make the distribution of materials more efficient, in this paper, we categorize all consumers in the region and determine the location of retailers according to consumers in different locations, which cannot only unify the distribution of materials but also improve the efficiency of the rescue. The K-means clustering algorithm is used to determine the retailer location.
In the K-means algorithm, K means to cluster all individuals into K clusters, which means to take the mean value of data in each cluster as the center of the cluster (also called the centroid). Specifically, the cluster is described by the centroid of each class. The idea of the algorithm is roughly as follows. First, K samples are randomly selected from the sample set as the cluster center, and the distance between all samples and the K “cluster centers” is calculated. Each sample is divided into a cluster where the closest “cluster center” is located, and for the new cluster, the new “cluster center” of each cluster is calculated.
In this paper, we divide the entire affected area into three categories of 13 urban areas, with areas A1 and A2 representing large core urban areas; B1 and B2 representing suburban medium-sized urban areas; and C1, C2 and C3 representing small urban areas. Small urban area C2 surrounds large core urban area A2; small urban area C3 surrounds medium-sized urban area B2; and urban areas A1, B1 and C1 are relatively independent of each other. The specific coordinate locations are shown in Figure 4.
In the 13 urban areas, retailers and consumers are distributed in different urban areas, and the ratio of the number of retailers to the number of consumers is 1:n. Among them, large-scale core regions A1 and A2 contain 100 retailers and 10,000 consumer nodes, while medium-sized regions B1 and B2 contain 50 retailers and 5000 consumer nodes. The remaining small districts each have 10 retailers and 100 consumer nodes, as shown in Figure 5.
Determining the retailer’s location. Because the K-means algorithm is sensitive to the initial value and the abnormal value, we repeated the simulation 10 times and took the average value of the results of these 10 times to avoid accidental errors. The clustering results reveal 50 central points an set the locations of retailers to replenish supplies to other consumer nodes. When consumers buy materials from this retailer node, the supplier node reduces the corresponding quantity of materials. By analogy, the retailer location is calculated using this algorithm for all remaining urban areas, as shown in Figure 6.
In region A1, the distribution of consumer nodes after clustering is not uniform, and the proportion of consumers of various colors differs, which is actually in line with the distribution of people in reality; the degree of people gathering in different regions is not the same density. In addition, the location distribution of retailers is unbalanced, with more retailers in the central area and more scattered around, which makes it easier to distribute materials [43], as shown in Figure 7.

3.6. Simulation Process Description

The following is the simulation process of panic buying behavior under the condition of material supply interruption:
Step 1: Initial network construction. First, a WS small-world network containing N+N/n nodes is generated. In this network, there are two types of nodes (N/n retailers and N consumers); materials flow one way from retailers to consumers in the region.
Step 2: Determine the location of the two types of nodes. Consumer location is randomly generated according to the network clustering algorithm to determine the location of consumers and retailers.
Step 3: Initial state generation. A set of consumer material stocks satisfying an N ~ (0,1) normal distribution is randomly generated, and the initial amount of opinion information is determined.
Step 4: Evolution of panic degree. After determining the state of public opinion information, public opinion information starts to spread, and the value of the amount of public opinion information is calculated based on Equations (5) and (6). The panic level of individuals in the network is then calculated according to Equation (7).
Step 5: Evolution of consumer panic buying behavior. The possibility of panic buying is calculated according to Equation (11), and Equation (12) determines whether the consumer buying possibility is greater than or equal to the buying threshold.
Step6: Cross-regional buying. When determining whether consumers are panic buying, we can calculate whether the retailer has enough supplies. If the retailer has the supplies the consumer needs at time t = t0, the retailer reduces the amount of supplies purchased by the consumer. When a nearby retailer does not have enough supplies to complete the purchase, the consumer is unable to buy from this retailer and transfers to another retailer in the area to purchase supplies.
Step 7: For each iteration, the material reserves of all consumers need to be subtracted from the unit material consumption (Rt) once.
Step 8: Repeat the above operations (step 5–7) until the iteration is completed.
In summary, the cross-regional panic buying process described in this paper is shown in Figure 8.

4. Simulation Analysis

External supply chains are temporarily blocked and the materials stored by consumers are constantly consumed in the aftermath of sudden disasters. Therefore, under the premise of ensuring the necessary materials for all members of the public, the panic buying behavior of consumers should be reduced to the greatest extent possible. Because the hoarding of goods leads to a surge in purchase volume, materials of retailers cannot be purchased by consumers in short supply in a timely manner, and the material needs of each consumer cannot be met to the maximum extent, which may lead to a humanitarian crisis. Therefore, in this section, we explore the mechanism of cross-regional panic buying evolution under the conditions of material supply disruptions in terms of the amount of public opinion information, material distribution methods, retailers’ material distribution efficiency, panic degree, etc.

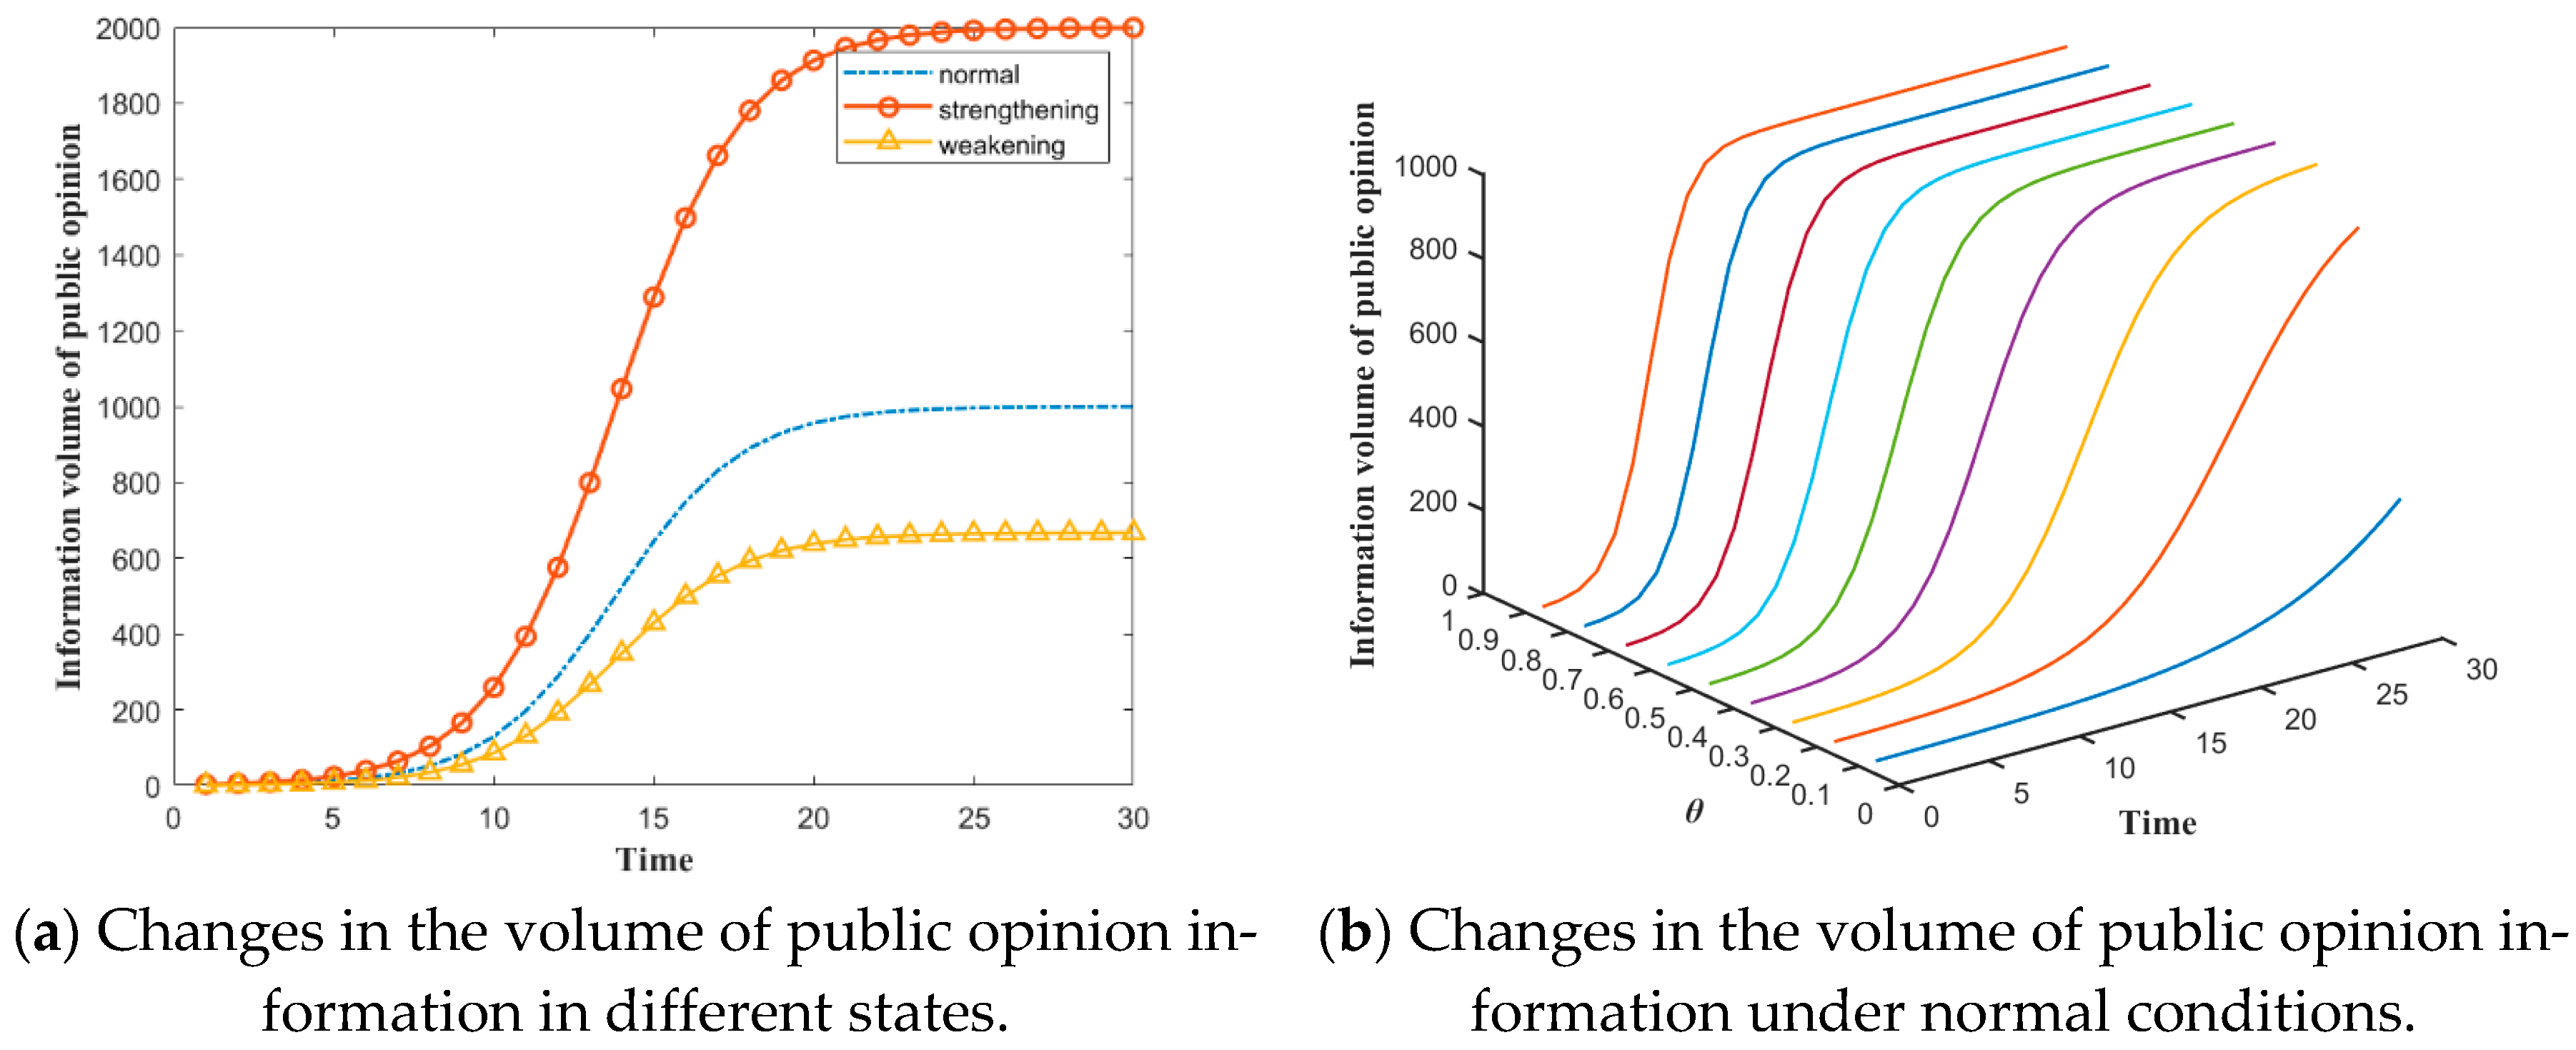
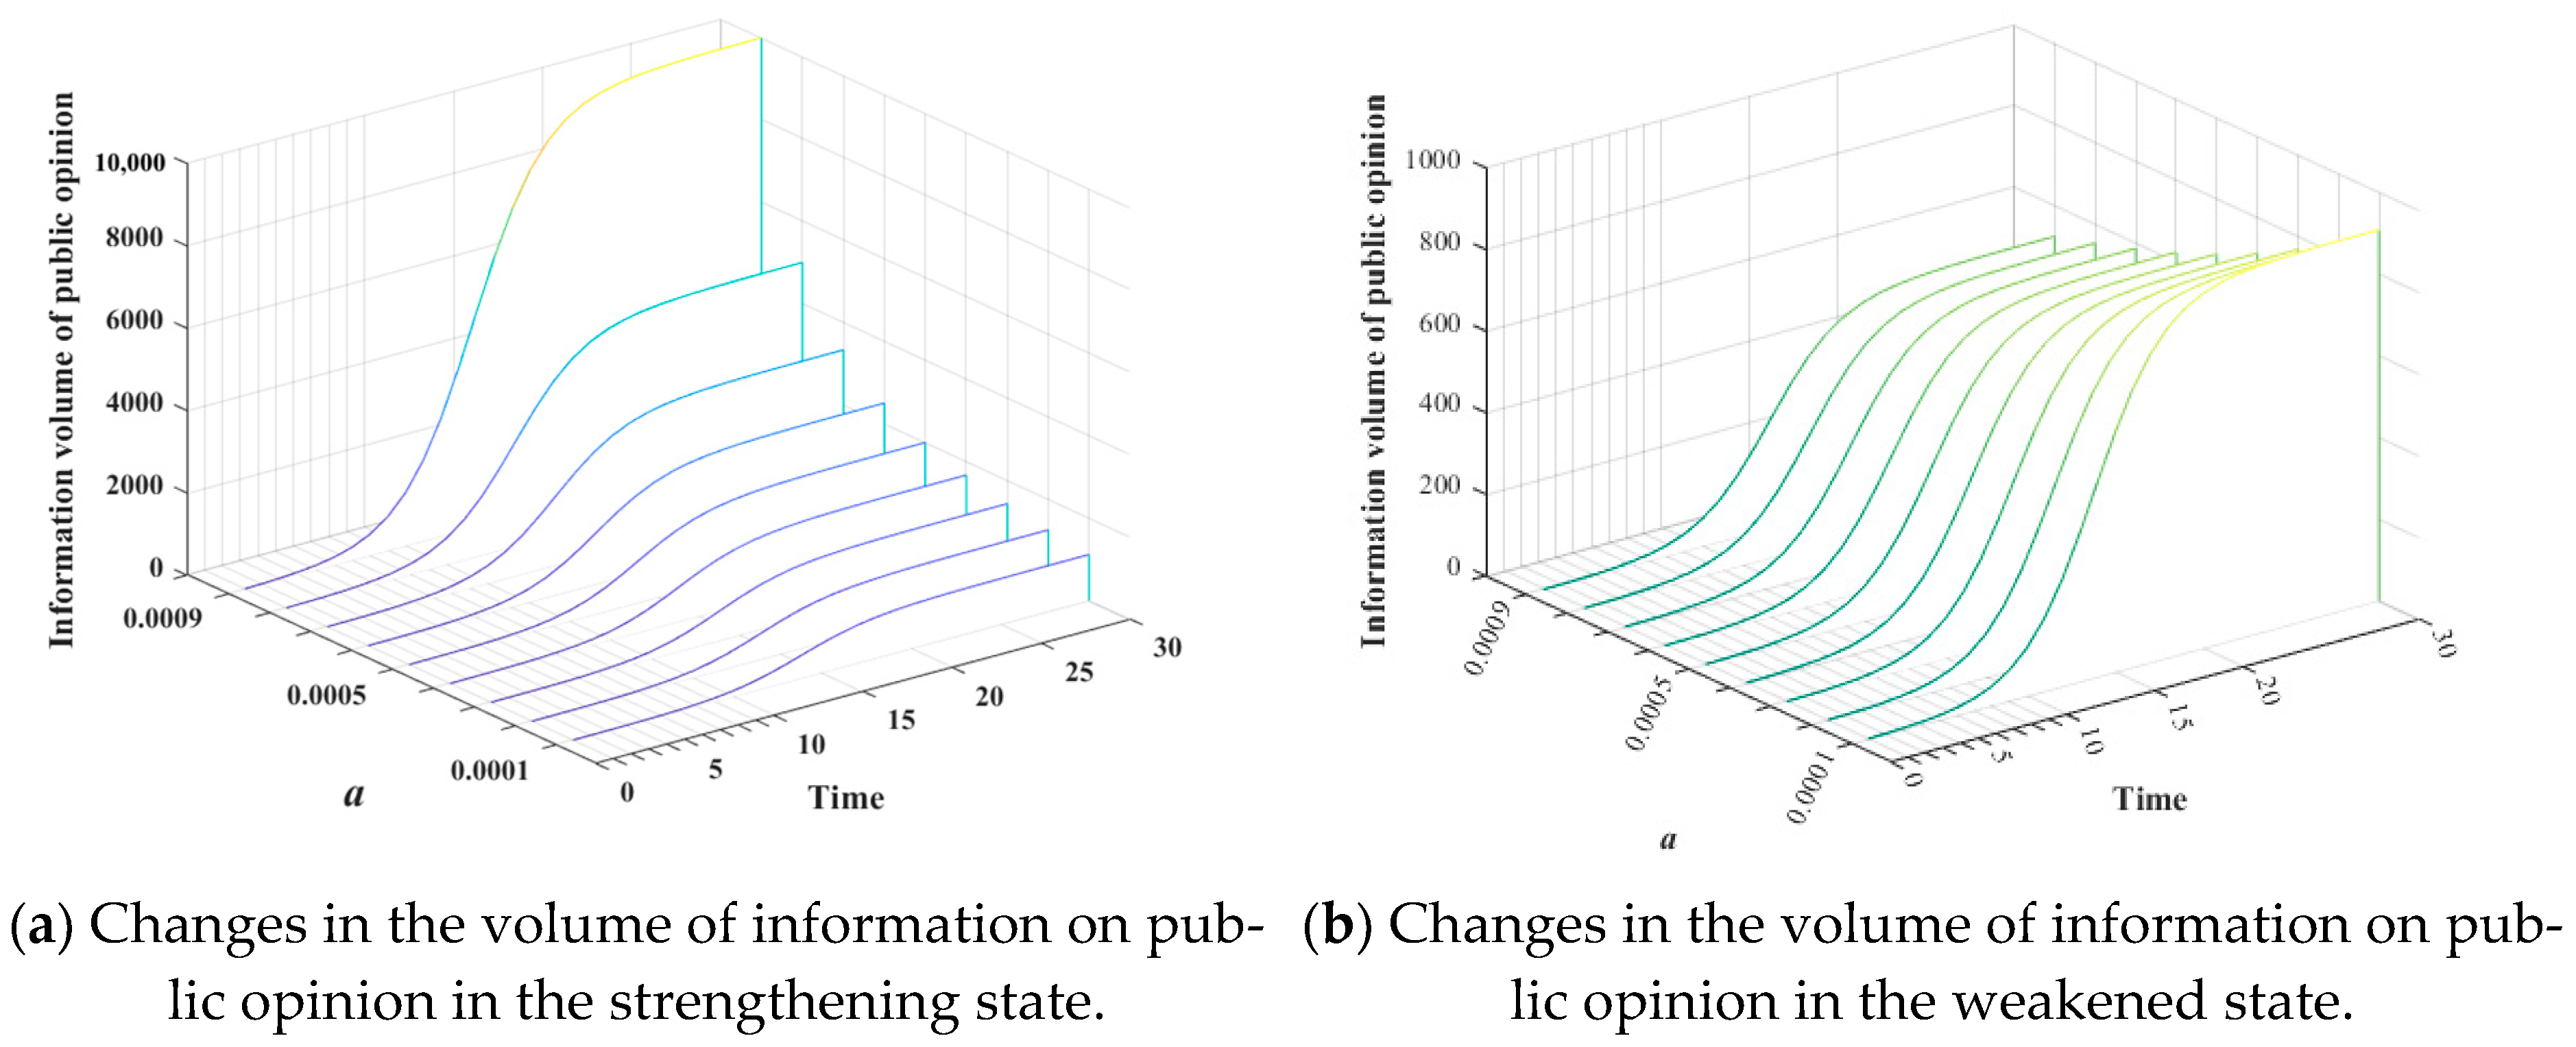
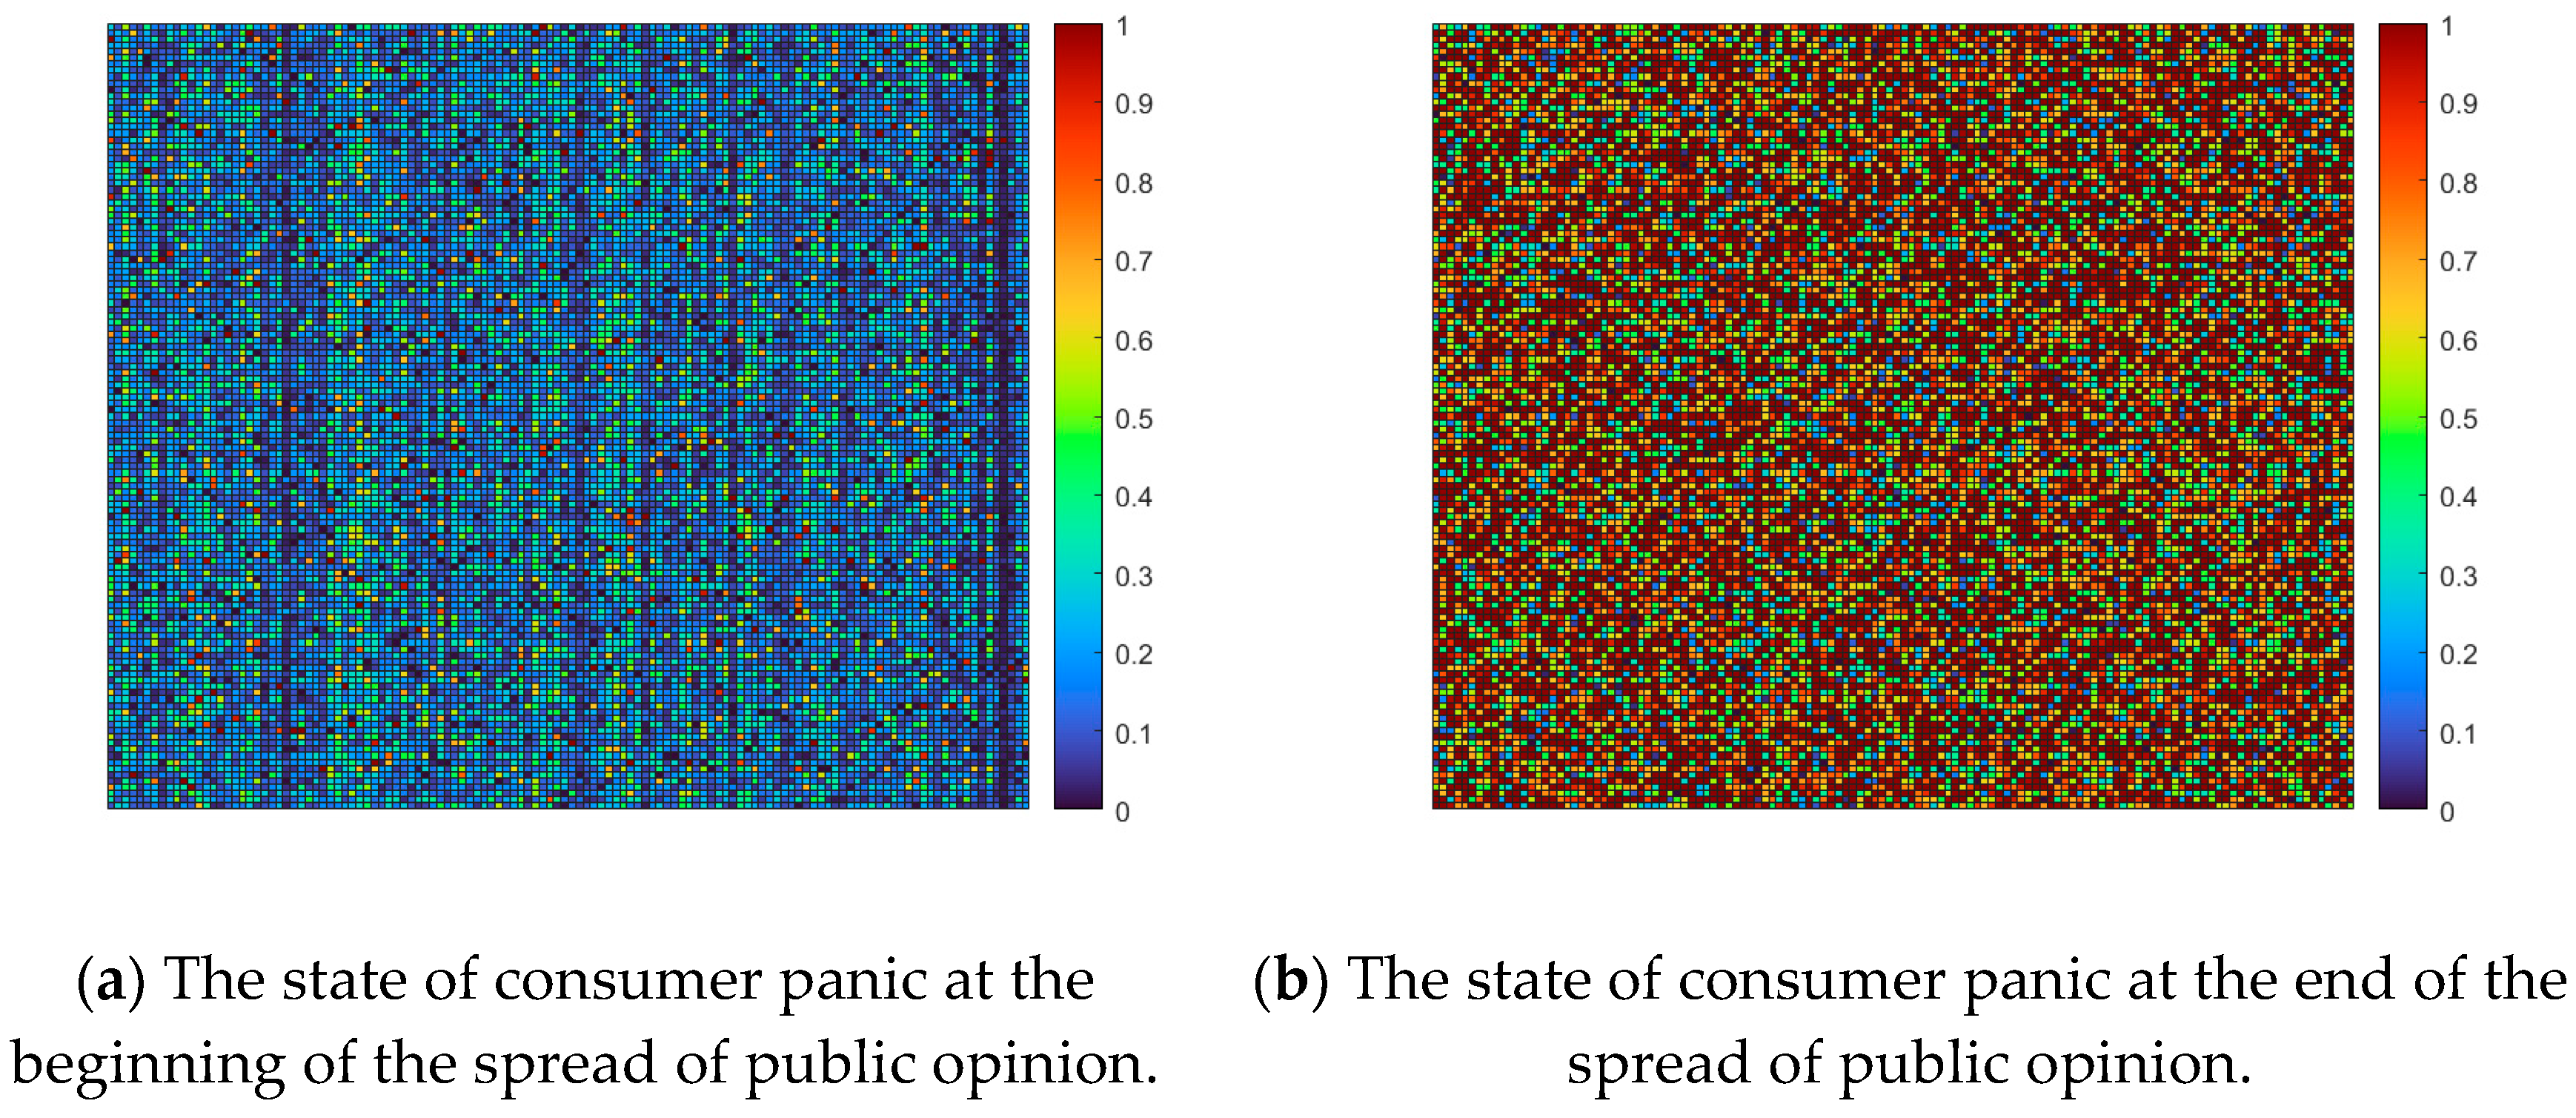
4.1. Influence of the Volume of Public Opinion Information on Panic

The change in public opinion information has varying impacts on consumer panic. In this section, we explore the change rule of public opinion information by simulating and verifying the formation and diffusion mechanisms of the panic transformation of public opinion information. The simulation parameters are set as follows: θ = 0.5; Y = 1000; initial negative public opinion information, y0 = 1; 0 ≤ t ≤ 30; public opinion to strengthen (weaken) coefficient of a (0,0.001). First, the evolution of public opinion information after sudden disasters is analyzed, as shown in Figure 9.
Compared with public opinion information in the normal state, the volume of public opinion information in the strengthened state increases rapidly, the upper limit of public opinion information volume increases and the diffusion speed becomes faster. The upper limit of public opinion information volume in the weakened state is reduced, and the growth rate of information volume is relatively slow compared to the normal rate. As shown in Figure 9b, by simulating the diffusion of public opinion information in the normal state, we find that at θ = 0.1, the diffusion period of public opinion information volume starts at time ≈ 25, while at θ = 0.9, public opinion information starts to enter the diffusion period at time ≈ 3. Moreover, as θ grows, the upper limit of the volume of public opinion information is reached more quickly.
According to Figure 10a, as the α value increases, the diffusion period of public opinion advances, and the upper limit of the volume of public opinion information also increases. As shown in Figure 10b, the amount of public opinion information in the weakened state gradually decreases as the α value increases, and the beginning time of the diffusion period of public opinion information is delayed. Furthermore, when a sudden disaster arouses widespread public concern or when the damage caused by a sudden disaster is very large, public opinion on the disaster becomes very intense, and negative public opinion information also increases.
The formation and diffusion mechanism of public opinion information to panic are discussed in the following paragraphs. The initial material quantity of consumers is randomly generated, which conforms to the normal distribution of N ~ (0,1), and all consumer nodes are converted into a flat network to observe the change in panic degree of all nodes, as shown in Figure 11.
There is less negative public opinion information during the early stage, and the vast majority of consumers have sufficient materials and do not worry that materials cannot be purchased. Most consumers have a low degree of panic, but a small number of consumers is still in a high degree of panic because a small number of consumers are vulnerable groups, their own ability to obtain materials is insufficient and their resistance to disasters is weak. With the continuous growth and spread of negative public opinion, consumers’ materials are also gradually consumed. At this time, the number of consumers with serious panic has increased significantly, and consumers can buy fewer materials from retailers in the region, which leads to a large range of panic buying and even a cross-regional panic buying phenomenon.

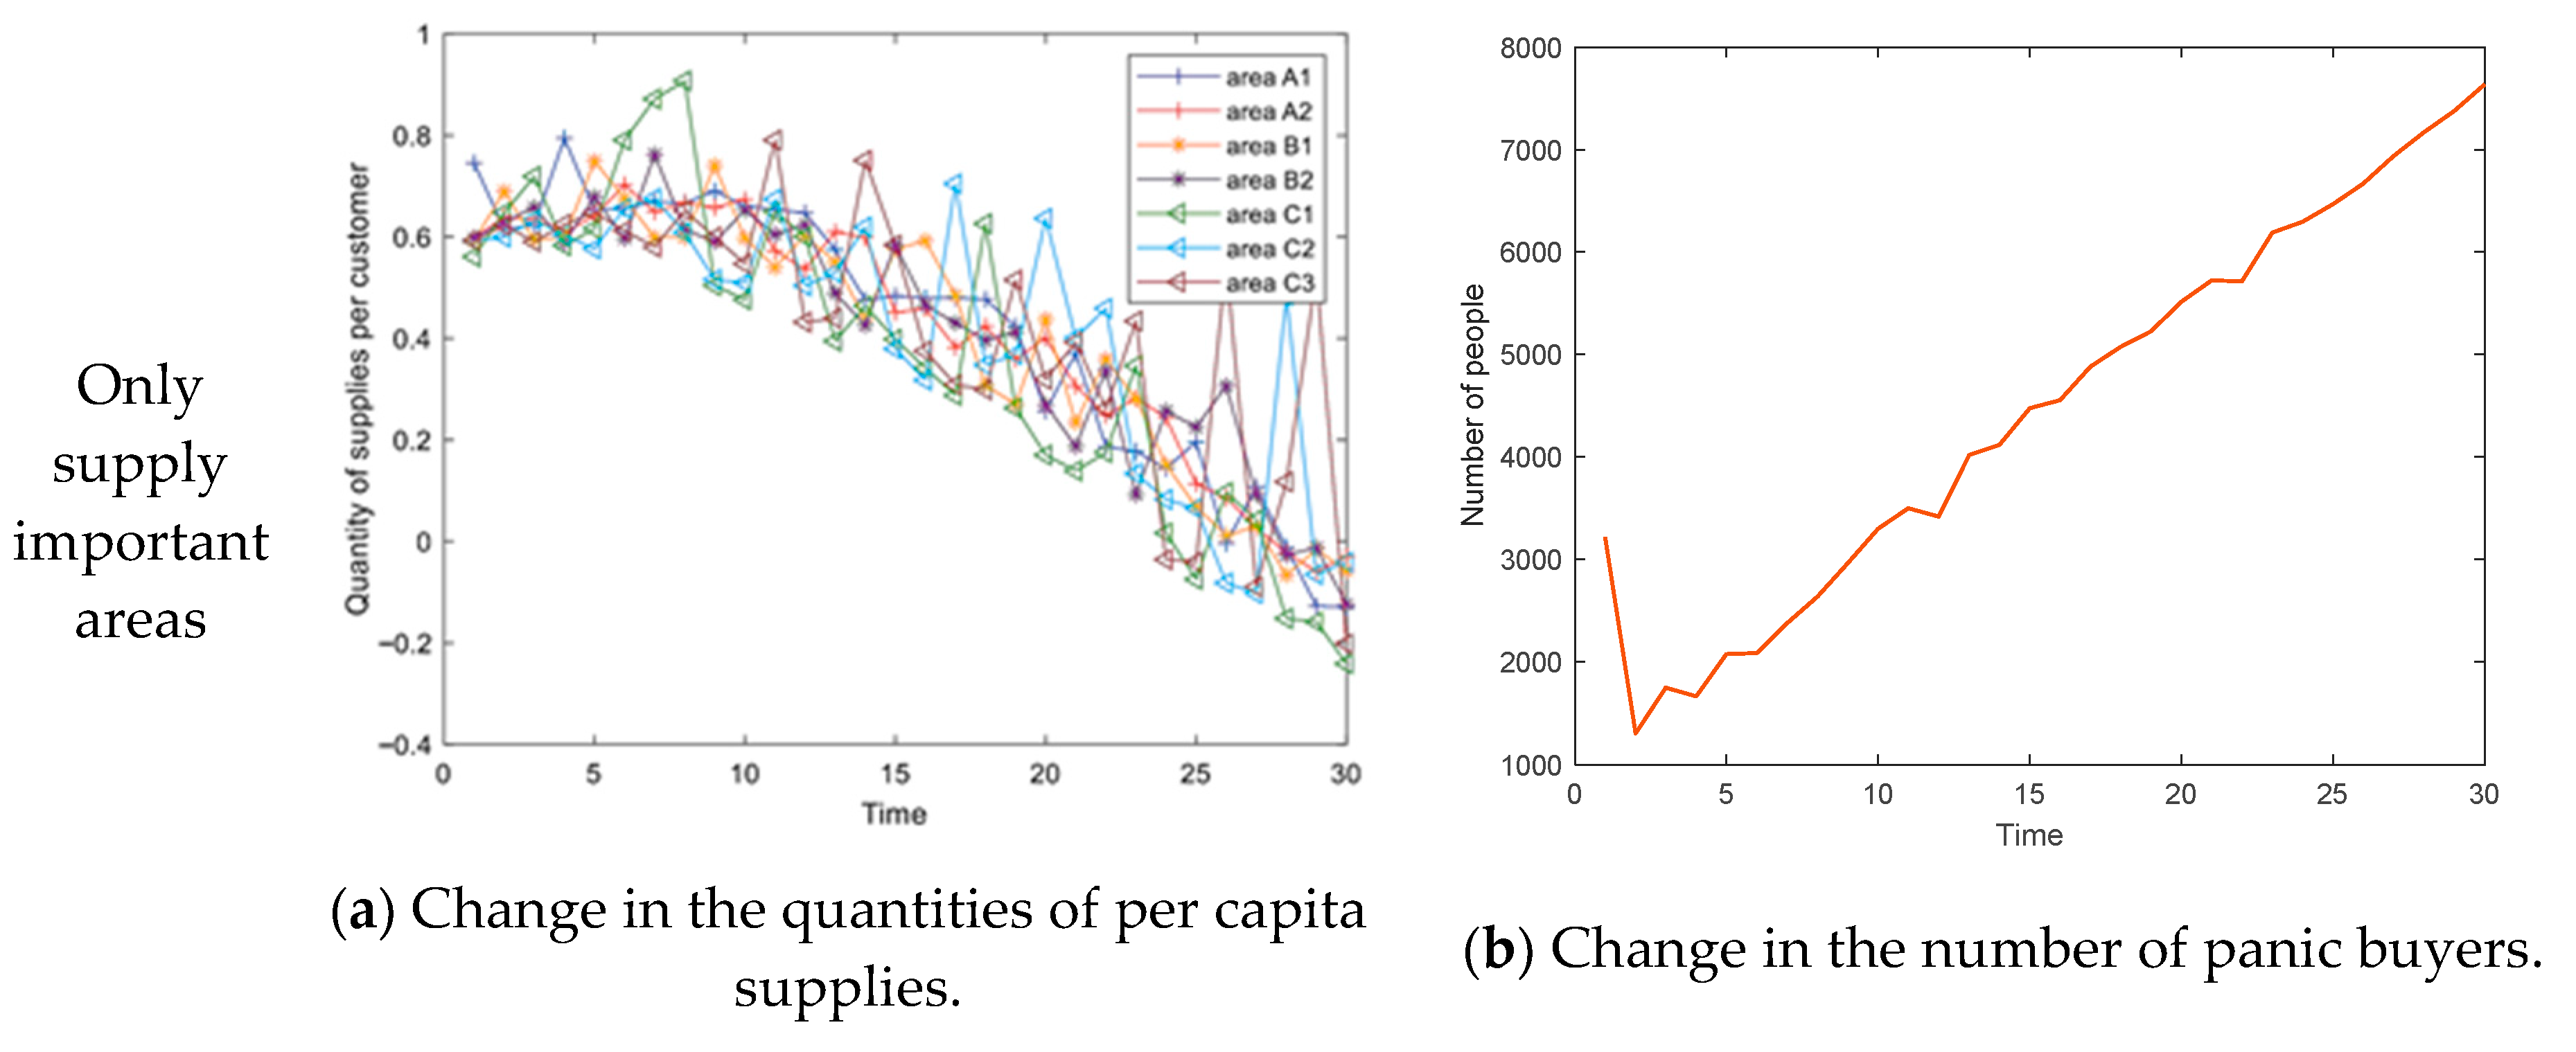
4.2. The Impact of Supply Distribution on Panic Buying

4.2.1. Distribution of Supplies by External Suppliers

After sudden disasters, a large amount of emergency supplies is needed in the disaster area, which results in many complex challenges in the supply chain of emergency rescue. When materials are insufficient, many organizations, including the government, prioritize large cities with large populations or developed economies. Small cities are always easy to neglect and cannot receive timely support. However, the hoarding behavior of some consumers in neglected urban areas can lead to further shortages. In addition, the buying behavior of consumers in this region can produce a series of chain reactions and even lead to the failure of material security in important regions. Therefore, the supply modes of two different regions are simulated, and the optimal supply chain is identified to ensure the basic survival materials of consumers in different regions to the greatest extent possible. At the same time, the panic caused by the shortage of goods spreads extremely fast when a disaster occurs, and consumers becoming panic-stricken further prompts them to make panic purchases, further reducing the remaining supplies in the region. Therefore, it is crucial to allocate materials in a reasonable manner when supplies are insufficient. Accordingly, in this section, we analyze the relationship between consumer panic transmission and panic buying behavior in different regions.
In the first experiment, only important regional cities are supplied, i.e., the large core cities (A2) and medium-sized cities (B2) with high population density, while consumers in small cities (C2 and C3) need to go to the nearest large cities (A2) or medium-sized cities (B2) to purchase supplies when they are short of supplies. In the control experiment, the initial stockpile of supplies and the distribution of retailers in the different types of cities are identical, and the amount of supplies purchased by consumers due to panic is the equivalent to one week, which is seven times the amount of materials consumed in a single day. Furthermore, we simulated a situation in which emergency supplies were equally supplied to each regional retailer and an equal number of people, and all 13 regions had access to supplies.
To make the results more convincing, the other parameters described in Section 4.2 ensure consistency, except for the differences in the parameters analyzed in each section. In addition, the threshold for two nodes to be neighbors is 0.2, and the threshold for purchase behavior due to panic is 0.5. The maximum panic value of a node is 1, and the minimum panic value is 0. Each individual consumes 0.1 units of supplies at each moment, and when the customer is not affected by factors such as panic, the threshold for purchase behavior is 0.1, that is, purchase behavior only occurs when the amount of supplies owned by the customer is less than 0.1. At the initial moment, the amount of supplies of all nodes in the network follows a normal distribution of N ~ (0,1), as shown in Figure 12.
When the supplies of retailers in different regions were replenished, the per capita volume of supplies fluctuated and decreased. Specifically, when the provision of supplies to large core cities is prioritized, the per capita material quantity in all regions declines slowly, and at time = 30, the per capita material quantity can still be guaranteed to be greater than 0, while the average supply of all regions leads to rapid consumption of material quantity. At time = 25, the material quantity is already less than 0 in many regions. This suggests that the even distribution of goods is not a reasonable solution to the panic buying problem. It is worth noting that in Figure 12a, the per capita material possession is negative after time = 25. We retain the negative situation, but even if the per capita material quantity is negative, some consumers in this region still excessively hoard materials, resulting in a serious shortage of material possessions for other consumers. In particular, C1, as an isolated region that cannot be connected to other regions, has large fluctuations in the quantity of goods per capita, regardless of the mode of supply. The most likely explanation is that consumers in this isolated region participate in panic buying as soon as they receive material assistance, resulting in spikes in the amount of supplies at regular intervals.
The post-disaster supply capacity is limited, and although many consumers in all regions want to snap up supplies after reaching the panic buying threshold, only some consumers actually obtain supplies, as retailers do not necessarily have sufficient supplies to sell. In order to explore the reasons for panic buying, we divide the consumers who actually obtain supplies into two parts: those generated by interaction with neighbors’ public opinion and those generated by their own lack of supplies, as shown in Figure 13.
In Figure 13, the actual number of people in the region who snapped up supplies shows a fluctuating downward trend. On the one hand, the shortage of supplies prevents consumers from successfully snapping up supplies; on the other hand, consumers are resupplied with supplies from previous panic buying and do not participate in the snapping behavior when supplies are temporarily available. Secondly, when suppliers only supply large core cities, the number of consumers who participate in panic buying is smaller than under average supply of materials to all cities. After the time = 7, the number of consumers who actually buy supplies is almost identical to the number of people who buy due to panic transmission from their neighbors, while there is still some difference between the two lines under a scenario of equal distribution of supplies across all cities. This suggests that it is easier to transmit panic by supplying only large core cities than to distribute supplies evenly across all cities according to the number of people, resulting in large-scale panic buying.
However, when the same amount of materials is equally distributed in each region, the number of people who snap up supplies increases rapidly in a short time, which is more likely to lead to a shortage of materials for consumers. This is because the materials allocated to each region are in an insufficient state, and the public has weak expectations about whether they can purchase materials in the future, which leads to panic buying and hoarding. The government can reduce the degree of public panic and the probability of panic buying events by publishing information about materials. In addition, it is necessary for the government to properly control public opinion if materials are only supplied to large core cities.

4.2.2. Government Intervention to Distribute Supplies

The simulations in Section 4.2.1 prove that prioritizing supplies to key cities in the early stages of a disaster can be effective in reducing the overall level of panic in society and reducing the amount of panic buying. In the simulation, it was also found that there are many consumers whose material supply will decrease to 0 at a later stage. As shown in Figure 14, at the initial moment, the distribution of material among all individuals in the network is uneven. About one-tenth of the consumers’ material possession is in the range of 0–0.1; this portion of consumers’ material consumption cannot maintain a unit of time. These consumers with insufficient supplies are vulnerable groups, and at the next moment, their materials are consumed.
However, suppliers who distribute supplies do not take into account the material needs of vulnerable groups. Vulnerable groups with insufficient materials, such as the elderly and the disabled, have less interaction with others and receive less information about public opinion related to the disaster. Therefore, it is difficult to purchase supplies in the early stages of the disaster, and this group is most affected by the disaster, which is unfair to some extent.
Therefore, when regional stocks are insufficient, the government also needs to ensure that all groups have access to supplies for humanitarian and equity reasons. In this paper, we explore the government’s material supply methods in depth. First, we simulates a situation in which materials are insufficient and the government limits the amount of materials purchased by consumers so that consumers can only buy a certain amount of materials from retailers. The per capita material quantity of different regions is shown in Figure 15a.
Moreover, the government’s use of a distribution method that reserves a portion of supplies should be considered. Assume that the government identifies vulnerable groups through information and reserves a portion of supplies for these vulnerable groups after a disaster. In the simulation, the vulnerable group refers to the consumer with a stock of 0 supplies at time t. As supplies are constantly consumed over time and are replenished once the consumer’s supplies reach 0, the number of vulnerable groups is not exactly the same at different moments. A proportion of 10% of the total daily supply of supplies is reserved to supply the vulnerable groups to guarantee their basic living needs. The per capita material quantity of different regions is shown in Figure 15b.
Figure 15 shows the overall trend; the second distribution method can increase the per capita supply volume. After limiting the amount of supplies purchased, consumers’ supplies can last for about 25 time units. As shown in Figure 15a, most consumers have fewer than 0 and are in a state of scarcity at time = 25, and as shown in Figure 15b, most consumers still have a small amount of supplies at time = 25. Combined with Figure 9, at moment time ≈ 12, the number of panicked people begins to increase rapidly, and the number of people involved in panic buying begins to gradually increase. Once the supplies have been snapped up, there is a definite drop in panic among this group of consumers. When time = 15, panic starts to spread throughout all regions, and a large number of consumers appears to snap up supplies; thus, there is a certain sudden change in the amount of supplies per capita before it starts to fall again. In the downward trend, the largest fluctuations in the amount of supplies per capita continues to be found in C1, followed by regions C2 and C3. This means that it is smaller cities that are most affected by the disaster due to the difficulty of rapid improvements in production capacity and inconvenient transportation. Furthermore, the lack of materials after the disaster is a difficult problem to solve in small cities.
As shown in Figure 16, after limiting the amount of goods purchased by consumers, the quantity of goods owned per capita begins to gradually decrease, and when the quantity of goods owned per capita is in the (0,0.1) range, the number of people begins to gradually increase, and each person can only maintain the minimum standard of goods demanded. Specifically, the number of vulnerable people increases, and the needs of this group of consumers need to be secured on a daily basis. Figure 16b also shows that the number of panic buyers increases rapidly and peaks at t = 10. As shown in Figure 17, if a portion of supplies can be reserved to ensure the living needs of vulnerable groups, the perception of shortages will be reduced, and the number of consumers participating in panic buying behaviors decreases significantly. With increased public expectation of being able to access supplies, that is, once materials are available to vulnerable groups, the government prioritizes ensuring personal supplies, thereby reducing consumers’ hoarding behavior caused by panic. Compared with Figure 15, Figure 16 and Figure 17, after prioritizing the supply of materials to vulnerable groups, the number of panic buyers decreases, and the per capita possession of supplies increases. Therefore, prioritizing supplies to vulnerable groups is a superior means of distribution.
As shown in Figure 18, the advantages of prioritizing supplies for vulnerable groups are obvious, and the actual number of panic buyers is lower, staying below one-tenth of the total. The restriction on the quantity of goods purchased enables consumers to buy fewer goods, which leads to a significant increase in the number of panic buyers.
In contrast, when the government does not intervene in the distribution of goods to consumers, changes occur in the quantity of supplies to all consumers and panic buying decisions, as shown in Figure 19.
The number of people who actually snap up supplies without government intervention is also at a low level. Because the availability of supplies in all areas progressively diminishes with the change in time and because there are no longer sufficient supplies to purchase, most consumers’ supplies exhibit a downward trend. Moreover, almost all panic buyers are affected by the panic of neighbors, which also shows that panic has a knock-on effect on the retailer market. At time = 4, there are already consumers whose supply volume is less than zero, and the number of these consumers gradually increases. At time = 30, the blue line in Figure 19b has reached around 6000; in other words, there are about 6000 nodes with a supply volume less than 0 at the last moment of the simulation, i.e., consumers who would be most vulnerable in a disaster. Moreover, the number of vulnerable individuals rapidly increases due to the presence of panic buying.

4.3. Interruptions in the Supply of Market Supplies

The above analysis of methods for the distribution of supplies with two different subjects resulted in different panic buying behavior of consumers. Moreover, we analyzed consumers’ panic buying decisions and changes in the volume of supplies when supplies are completely disrupted, as shown in Figure 20.
Figure 20 shows the change in the number of panic buyers and the volume of supplies during the disruption. The number of people actually purchasing supplies also drops significantly after the disruption, most of whom are affected by the spread of panic. According to the simulation results, the amount of supplies owned by consumers reaches two extreme cases: one is the saturation state of supplies, and the other is a serious shortage of supplies. Therefore, a large number of panic buying and hoarding behaviors of some consumers only leads to the phenomenon of “the Matthew Effect”; that is “the rich get richer and the poor get poorer”. The phenomenon of snapping up medicines during the COVID-19 pandemic shows that supplies are not fully utilized, and government intervention in the distribution of supplies can reduce such phenomena.

5. Conclusions and Outlook

In this study, we constructed a model for the panic buying behavior of consumers in different regions in the event of insufficient supplies after a disaster, evaluated the effect of public opinion information on consumer panic and explored the impact of different material allocation and supply decisions on consumer panic buying. The results show that, first of all, negative public opinion has a direct impact on panic buying and that the government needs to pay attention to the control of negative public opinion. Second, prioritizing material distribution to large cities can reduce the amount of panic buying faster than providing an average supply to all cities; however, but large cities are more likely to spread panic feeling, while small cities are more affected by panic buying. Third, restricting the amount of material purchased by each person can only maintain the short-term material needs of most people, which enables more people to snap up materials; however, this strategy can only maintain the minimum level of material. Finally, reserving a portion of supplies to protect vulnerable groups can increase public expectations of material protection and reduce the number of people who panic buy. If no measures are taken, the “Matthew effect” may occur in the amount of goods for consumers, which is very unfair. This paper may contribute to distribution decisions of supplies in post-disaster scenarios, in addition to improving inherent cognition in disaster rescue and providing a basis for rational operational decisions in abnormal situations.
Although many studies have effectively discussed the problem of supply disruption, but the supply chain system is a huge, dynamic system composed of many factors. In this system, small changes in the initial conditions can drive long-term reaction of the whole system. The combination of the multiagent modeling method, which describes the behavior of the whole system from a top-down perspective, and a nonlinear model may be an effective way to solve this problem. In addition, how to identify vulnerable groups is a very difficult problem. In our model, we simply select individuals whose quantity of goods is less than a threshold as vulnerable groups. However, when disasters occur, this method is not efficient in reality due to the lack of information. Therefore, how to accurately and efficiently identify vulnerable groups is also a topic worthy of discussion. More generally, the determination of city size, the accurate demand for material quantity and the analysis of the impact of public opinion on regional material dispatching strategies need to be discussed in practical applications. Therefore, the ABM method of data injection should also be a focus of future research [44]. Finally, when a disaster occurs, different individual characteristics lead to different behavior choices, such as whether consumers are absolutely optimistic about the supply chain. These factors affect the individual’s panic buying behavior [45], which needs to be supplemented and improved in future research.

Author Contributions

S.W. described the proposed framework and wrote the whole manuscript; Y.S. implemented the simulation experiments; T.C. and L.X. collected data; Y.G. revised the manuscript. All authors have read and agreed to the published version of the manuscript.

Funding

This research is supported by the Zhejiang Provincial Natural Science Foundation of China (Grant No. LY22G010003).

Institutional Review Board Statement

Not applicable.

Informed Consent Statement

Not applicable.

Data Availability Statement

The data used to support the findings of this study are available from the corresponding author upon request.

Conflicts of Interest

The authors declare no conflict of interest.

References

  1. Li, G.; Liu, M.; Zheng, H. Subsidization or Diversification? Mitigating Supply Disruption with Manufacturer Information Sharing. Omega 2022, 112, 102670. [Google Scholar] [CrossRef]
  2. Zheng, R.; Shou, B.; Yang, J. Supply disruption management under consumer panic buying and social learning effects. Omega 2021, 101, 102238. [Google Scholar] [CrossRef]
  3. Njomane, L.; Telukdarie, A. Impact of COVID-19 food supply chain: Comparing the use of IoT in three South African supermarkets. Technol. Soc. 2022, 71, 102051. [Google Scholar] [CrossRef] [PubMed]
  4. Deng, C.; Wang, H.; Hong, S.; Zhao, W.; Wang, C. Meeting the challenges of food-energy-water systems in typical mega-urban regions from final demands and supply chains: A case study of the Bohai mega-urban region, China. J. Clean. Prod. 2021, 320, 128663. [Google Scholar] [CrossRef]
  5. Omar, N.A.; Nazri, M.A.; Ali, M.H.; Alam, S.S. The panic buying behavior of consumers during the COVID-19 pandemic: Examining the influences of uncertainty, perceptions of severity, perceptions of scarcity, and anxiety. J. Retail. Consum. Serv. 2021, 62, 102600. [Google Scholar] [CrossRef]
  6. Zhang, M.; Wang, W. Study on public opinion propagation in self media age based on time delay differential model. Procedia Comput. Sci. 2017, 122, 486–493. [Google Scholar] [CrossRef]
  7. Shioda, S.; Nakajima, K.; Minamikawa, M. Information spread across social network services with non-responsiveness of individual users. Computers 2020, 9, 65. [Google Scholar] [CrossRef]
  8. Lan, Y.; Lian, Z.; Zeng, R.; Zhu, D.; Xia, Y.; Liu, M. A statistical model of the impact of online rumors on the information quantity of online public opinion. Phys. A Stat. Mech. Appl. 2020, 541, 123623. [Google Scholar] [CrossRef]
  9. Hearnshaw, E.J.S.; Wilson, M.M.J. A complex network approach to supply chain network theory. Int. J. Oper. Prod. Manag. 2013, 33, 442–469. [Google Scholar] [CrossRef]
  10. Chen, T.; Jin, Y.; Yang, J.; Cong, G. Identifying emergence process of group panic buying behavior under the COVID-19 pandemic. J. Retail. Consum. Serv. 2022, 67, 102970. [Google Scholar] [CrossRef]
  11. Kogan, K.; Herbon, A. Retailing under panic buying and consumer stockpiling: Can governmental intervention make a difference? Int. J. Prod. Econ. 2022, 254, 108631. [Google Scholar] [CrossRef]
  12. Yoon, J.; Narasimhan, R.; Kim, M.K. Retailer’s sourcing strategy under consumer stockpiling in anticipation of supply disruptions. Int. J. Prod. Res. 2018, 56, 3615–3635. [Google Scholar] [CrossRef]
  13. Herbon, A.; Kogan, K. Apportioning limited supplies to competing retailers under panic buying and associated consumer traveling costs. Comput. Ind. Eng. 2021, 162, 107775. [Google Scholar] [CrossRef]
  14. Li, Q.; Chen, T.; Yang, J.; Cong, G. Based on Computational Communication Paradigm: Simulation of Public Opinion Communication Process of Panic Buying during the COVID-19 Pandemic. Psychol. Res. Behav. Manag. 2020, 13, 1027–1045. [Google Scholar] [CrossRef]
  15. Li, X.; Zhou, Y.; Wong, Y.D.; Wang, X.; Yuen, K.F. What influences panic buying behaviour? A model based on dual-system theory and stimulus-organism-response framework. Int. J. Disaster Risk Reduct. 2021, 64, 102484. [Google Scholar] [CrossRef]
  16. Kassas, B.; Nayga, R.M., Jr. Understanding the importance and timing of panic buying among US Households during the COVID-19 pandemic. Food Qual. Prefer. 2021, 93, 104240. [Google Scholar] [CrossRef]
  17. Pan, X.; Dresner, M.; Mantin, B.; Zhang, J.A. Pre-hurricane consumer stockpiling and post-hurricane product availability: Empirical evidence from natural experiments. Prod. Oper. Manag. 2020, 29, 2350–2380. [Google Scholar] [CrossRef]
  18. Gupta, S.; Gentry, J.W. ‘Should I Buy, Hoard, or Hide?’-Consumers’ responses to perceived scarcity. Int. Rev. Retail. Distrib. Consum. Res. 2019, 29, 178–197. [Google Scholar] [CrossRef]
  19. Li, Z.; Zhao, P.; Han, X. Agri-food supply chain network disruption propagation and recovery based on cascading failure. Phys. A Stat. Mech. Appl. 2022, 589, 126611. [Google Scholar] [CrossRef]
  20. Yang, H.; Chen, L.; Liu, B.; Migdalas, A. Emergency decision-making model of suppliers with updating information in cases of sudden accidents. Comput. Ind. Eng. 2021, 162, 107740. [Google Scholar] [CrossRef]
  21. Maghsoudi, A.; Zailani, S.; Ramayah, T.; Pazirandeh, A. Coordination of efforts in disaster relief supply chains: The moderating role of resource scarcity and redundancy. Int. J. Logist. Res. Appl. 2018, 21, 407–430. [Google Scholar] [CrossRef]
  22. Burgos, D.; Ivanov, D. Food retail supply chain resilience and the COVID-19 pandemic: A digital twin-based impact analysis and improvement directions. Transp. Res. Part E Logist. Transp. Rev. 2021, 152, 102412. [Google Scholar] [CrossRef] [PubMed]
  23. Sheu, J.B.; Kuo, H.T. Dual speculative hoarding: A wholesaler-retailer channel behavioral phenomenon behind potential natural hazard threats. Int. J. Disaster Risk Reduct. 2020, 44, 101430. [Google Scholar] [CrossRef]
  24. Zhang, J.; Liu, H.; Yu, G.; Ruan, J.; Chan, F.T. A three-stage and multi-objective stochastic programming model to improve the sustainable rescue ability by considering secondary disasters in emergency logistics. Comput. Ind. Eng. 2019, 135, 1145–1154. [Google Scholar] [CrossRef]
  25. Shapira, S.; Feder-Bubis, P.; Clarfield, A.M.; Aharonson-Daniel, L. Bridging information gaps: The path to optimal care for medically vulnerable populations following large-scale public health emergencies. Int. J. Disaster Risk Reduct. 2019, 41, 101319. [Google Scholar] [CrossRef]
  26. Wang, B.C.; Qian, Q.Y.; Gao, J.J.; Tan, Z.Y.; Zhou, Y. The optimization of warehouse location and resources distribution for emergency rescue under uncertainty. Adv. Eng. Inform. 2021, 48, 101278. [Google Scholar] [CrossRef]
  27. Cao, C.; Liu, Y.; Tang, O.; Gao, X. A fuzzy bi-level optimization model for multi-period post-disaster relief distribution in sustainable humanitarian supply chains. Int. J. Prod. Econ. 2021, 235, 108081. [Google Scholar] [CrossRef]
  28. Ghaffari, Z.; Nasiri, M.M.; Bozorgi-Amiri, A.; Rahbari, A. Emergency supply chain scheduling problem with multiple resources in disaster relief operations. Transp. A Transp. Sci. 2020, 16, 930–956. [Google Scholar] [CrossRef]
  29. Ma, Y.; Shu, X.; Shen, S.; Song, J.; Li, G.; Liu, Q.Y. Study on network public opinion dissemination and coping strategies in large fire disasters. Procedia Eng. 2014, 71, 616–621. [Google Scholar] [CrossRef] [Green Version]
  30. Wang, J.; Wang, X.; Fu, L. Evolutionary game model of public opinion information propagation in online social networks. IEEE Access 2020, 8, 127732–127747. [Google Scholar] [CrossRef]
  31. Jabalameli, S.; Xu, Y.; Shetty, S. Spatial and sentiment analysis of public opinion toward COVID-19 pandemic using twitter data: At the early stage of vaccination. Int. J. Disaster Risk Reduct. 2022, 80, 103204. [Google Scholar] [CrossRef]
  32. Han, L.; Sun, R.; Gao, F.; Zhou, Y.; Jou, M. The effect of negative energy news on social trust and helping behavior. Comput. Hum. Behav. 2019, 92, 128–138. [Google Scholar] [CrossRef]
  33. Lasswell, H.D. The Measurement of Public Opinion. Am. Political Sci. Rev. 1931, 25, 311–326. [Google Scholar] [CrossRef]
  34. Katz, D. Psychological tasks in the measurement of public opinion. J. Consult. Psychol. 1942, 6, 59–65. [Google Scholar] [CrossRef]
  35. Lisette, K.; Elena, S.; Sarah, B. Gender Gaps in the Measurement of Public Opinion about Homosexuality in Cross-National Surveys: A Question-Wording Experiment. Int. J. Public Opin. Res. 2018, 30, 692–704. [Google Scholar]
  36. Yan, S.; Su, Q.; Gong, Z.; Zeng, X.; Herrera-Viedma, E. Online public opinion prediction based on rolling fractional grey model with new information priority. Inf. Fus. 2023, 91, 277–298. [Google Scholar] [CrossRef]
  37. Zhihong, L.; Jile, H.; Pengfei, W. The Time Period Characteristic of Information Communication Model and It’s Management Strategies of Paroxysmal Public Crisis. Libr. Inf. Serv. 2007, 51, 88–91. [Google Scholar]
  38. Marchand, D.A.; Horton, F.W., Jr. Infotrends: Profiting from Your Information Resources; John Wiley & Sons, Inc.: Hoboken, NJ, USA, 1986. [Google Scholar]
  39. Pearl, R.; Reed, L.J. On the rate of growth of the population of the United States since 1790 and its mathematical representation. In Mathematical Demography; Springer: Berlin/Heidelberg, Germany, 1977; pp. 341–347. [Google Scholar]
  40. Wei, J.; Zhao, D.; Liang, L. Estimating the growth models of news stories on disasters. J. Am. Soc. Inf. Sci. Technol. 2009, 60, 1741–1755. [Google Scholar] [CrossRef]
  41. Acebrón, J.A.; Bonilla, L.; Vicente CJ, P.; Ritort, F.; Spigler, R. The Kuramoto model: A simple paradigm for synchronization phenomena. Rev. Mod. Phys. 2005, 77, 137. [Google Scholar] [CrossRef] [Green Version]
  42. Maurer, C.R.; Qi, R.; Raghavan, V. A linear time algorithm for computing exact Euclidean distance transforms of binary images in arbitrary dimensions. IEEE Trans. Pattern Anal. Mach. Intell. 2003, 25, 265–270. [Google Scholar] [CrossRef]
  43. Jones, S.; O’Neill, E. Feasibility of structural network clustering for group-based privacy control in social networks. In Proceedings of the Symposium on Usable Privacy & Security, Redmond, WA, USA, 14–16 July 2010; ACM: New York, NY, USA, 2010. [Google Scholar]
  44. Xu, A.; Zhu, Y.; Wang, W. Micro green technology innovation effects of green finance pilot policy—From the perspectives of action points and green value. J. Bus. Res. 2023, 159, 113724. [Google Scholar] [CrossRef]
  45. Li, J.; Lian, G.; Xu, A. How do ESG affect the spillover of green innovation among peer firms? Mechanism discussion and performance study. J. Bus. Res. 2023, 158, 113648. [Google Scholar] [CrossRef]
Figure 1. Diagram illustrating the cross-regional purchase of supplies.
Systems 11 00110 g001
Figure 2. The volume of information on public opinion in different states.
Systems 11 00110 g002
Figure 3. Diagram of panic buying spread.
Systems 11 00110 g003
Figure 4. Location diagram of different types of cities.
Systems 11 00110 g004
Figure 5. Distribution of consumers in different types of cities.
Systems 11 00110 g005
Figure 6. Distribution of retailer locations in all regions.
Systems 11 00110 g006
Figure 7. Node location diagram of A1 city.
Systems 11 00110 g007
Figure 8. Flow chart for panic buying under the condition of material disruption.
Systems 11 00110 g008
Figure 9. Changes in the volume of public opinion information after sudden disasters.
Systems 11 00110 g009
Figure 10. Changes in public opinion information under two states.
Systems 11 00110 g010
Figure 11. Panic state of consumers in different stages of public opinion.
Systems 11 00110 g011
Figure 12. Changes in per capita material quantity and the number of people panic buying under different supply modes.
Systems 11 00110 g012aSystems 11 00110 g012b
Figure 13. Population change in all areas under different modes of supply distribution by suppliers.
Systems 11 00110 g013
Figure 14. Number of people in possession of different materials.
Systems 11 00110 g014
Figure 15. Changes in consumer material ownership under government intervention in supply distribution.
Systems 11 00110 g015
Figure 16. Population change in all areas under the restrictions on the number of supplies purchased.
Systems 11 00110 g016
Figure 17. Population change in all areas under a scenario of priority distribution for vulnerable groups.
Systems 11 00110 g017
Figure 18. Population change in all areas under different government distribution methods.
Systems 11 00110 g018
Figure 19. Population change in all areas without government intervention.
Systems 11 00110 g019
Figure 20. Changes in the number of panic buyers and the amount of supplies under a scenario of interrupted supply.
Systems 11 00110 g020
Disclaimer/Publisher’s Note: The statements, opinions and data contained in all publications are solely those of the individual author(s) and contributor(s) and not of MDPI and/or the editor(s). MDPI and/or the editor(s) disclaim responsibility for any injury to people or property resulting from any ideas, methods, instructions or products referred to in the content.

