Article

Enabling Mobility: A Simulation Model of the Health Care System for Major Lower-Limb Amputees to Assess the Impact of Digital Prosthetics Services

by
Jefferson K. Rajah
1,
William Chernicoff
2,
Christopher J. Hutchison
3,
Paulo Gonçalves
4 and
Birgit Kopainsky
1,*
1
System Dynamics Group, Department of Geography, University of Bergen, 5020 Bergen, Norway
2
Toyota Mobility Foundation, Plano, TX 75024, USA
3
ProsFit Technologies JSC, 1407 Sofia, Bulgaria
4
Facoltà di Scienze Economiche, Università della Svizzera Italiana, 6900 Lugano, Switzerland
*
Author to whom correspondence should be addressed.
Systems 2023, 11(1), 22; https://doi.org/10.3390/systems11010022
Submission received: 13 November 2022 / Revised: 27 December 2022 / Accepted: 29 December 2022 / Published: 3 January 2023
(This article belongs to the Special Issue System Dynamics Models for Public Health and Health Care Policy)

Abstract

:
The World Health Organization estimates that 5 to 15% of amputees in any given population have access to a prosthesis. This figure is likely to worsen as the amputee population is expected to double by 2050, straining the limited capacity of prosthetics services. Without proper and timely prosthetic interventions, amputees with major lower-limb loss experience adverse mobility outcomes, including the loss of independence, lowered quality of life, and decreased life expectancy. Presently, the use of digital technology in prosthetics (e.g., 3D imaging, digital processing, and 3D printed sockets) is contended as a viable solution to this problem. This paper uses system dynamics modeling to assess the impact of digital prosthetics service provision. Our simulation model represents the patient-care continuum and digital prosthetics market system, providing a feedback-rich causal theory of how digital prosthetics impacts amputee mobility and the corollary socio-health-economic outcomes over time. With sufficient resources for market formation and capacity expansion for digital prosthetics services, our work suggests an increased proportion of prosthesis usage and improved associated health-economic outcomes. Accordingly, our findings could provide decision support for health policy to better mitigate the accessibility problem and bolster the social impact of prosthesis usage.

1. Introduction

The World Health Organization (WHO) estimates that around 0.5% of any given population require prosthetics and orthotics services [1]. This figure is expected to double by 2050 as a result of ageing populations and rising rates of medical conditions, such as diabetes mellitus, peripheral arterial disease (PAD), and sepsis [1,2]. Particularly for major lower-limb amputations (i.e., above ankle), over 90% of cases in industrialized countries are attributed to PAD (either primary or secondary to diabetes); whereas traumatic injuries make up most cases in developing countries [3,4,5]. PAD is a progressive vascular disease that commonly causes arterial obstruction in the lower extremities. Known PAD risk factors include cigarette smoking, diabetes mellitus, hypertension, and dyslipidemia, with incidence sharply rising for populations above age 50 [6,7]. PAD progresses to the more severe critical limb ischemia, if not effectively managed at an earlier stage, which could lead to amputation [8].
Major lower-limb amputation, without timely prosthetic intervention, leads to a loss of mobility, which has several ripple effects at both the individual and societal level. It worsens individual health and psychosocial outcomes, including the loss of independence, increased depression and self-esteem issues, lowered quality of life, and increased risk of comorbidities and mortality [9,10,11]. There is also high economic burden on patients, families (increased caregiving), health and welfare systems, as well as the workforce (lower rates of return to work) [1,12,13]. Such negative externalities can be alleviated with the use of prostheses to regain mobility and functional independence [14]. However, WHO estimates that only 5 to 15% of amputees have access to prosthetics services [1]. Even then, approximately 50% of amputees in prosthetics care abandon the process or their prosthetic devices [15,16]. Barriers include high financial costs for treatment, poor health care coverage, prosthetics service capacity constraints, limits in prosthetics technology and fitting, lack of proximity to services, and inadequate continuity of care [14,15,16,17].
The recent introduction of digital technology in prosthetics is seen as a viable solution to the accessibility problem [16,18,19]. Digital solutions to prosthesis fitting (henceforth, digital prosthetics) involve a streamlined process of scanning the limb and using a digital software to create a model of the socket for three-dimensional printing. Digital technology reduces the delays, patient time and travel burden, and labor involved in traditional prosthetics. Using traditional methods, the prosthetist must handcraft the socket using plaster casts and test the fittings several times before a definitive socket is manufactured and assembled [19]. With digital prosthetics, this manufacturing delay can be more than halved. In turn, this reduces the chances of the patient’s limb and/or weight having changed before receiving the prosthesis device—the main cause of discomfort and pain [16]. The fit challenges are a primary cause for the 50% abandonment [15,16]. Hence, digital prosthetics could lead to higher success rates since the digital design is more accurate, precise, and enables direct translation of a prosthetist’s skill-level over a minimum baseline in place; has a much shorter timeframe such that there is little time for limb changes; and results in a more comfortable fit for patients [16].
Moreover, digital prosthetics could improve accessibility by expanding service capacity. With a more streamlined and effective fitting process, each prosthetist can fit more patients in their schedule than it otherwise would have been possible with conventional techniques and processes. Digital technology also frees the prosthetist from their clinic and gives them the flexibility to bring the service to patients through distributed care networks [20]. Accordingly, proponents of digital prosthetics anticipate several positive externalities for amputees, their families, and the economy more broadly. This paper seeks to assess this impact of digital prosthetics service provision on total amputee mobility. Mobility, here, is measured by the proportion of medically eligible amputees who are fitted with a prosthesis and have regained functional mobility. The benefit of digital prosthetics can be further measured by the health-related socio-economic consequences of such mobility; namely, the surplus economic productivity from returning to work and the net economic costs incurred or avoided (health care, family opportunity cost, social and welfare payments).
The purpose of this study is to explore how the adoption of digital prosthetics impact amputee mobility and associated outcomes over time. To assess such changes, we model the key causal mechanisms found in the health care system, including the patient-care continuum and prosthetic service provision. For this purpose, we build and analyze a dynamic simulation model to identify high-leverage points that can enhance the effects of digital prosthetics service provision on mobility outcomes. This paper describes the structure, empirical foundation, illustrative results, and strategic insights from the prototype prosthetic service provision model, as well as how it might be further refined. The results reported in this paper result from two activities: First, we use an in-depth review of the existing knowledge (from literature and expert interviews) coupled with causal loop diagramming [21] to identify core feedback mechanisms driving prosthetic service provision. Second, we developed a formal system dynamics simulation model to characterize the range of outcomes that these processes generate, even in a data-poor context. The end result is an internally consistent theory that provides insights into the determinants of success and failure of digital prosthetics service provision.

2. Materials and Methods

This study employs the system dynamics (SD) method, using compartment models, for conducting model-based hypothesis testing. SD models seek to simulate and explain problem behaviors by modeling the underlying system structure [21]. Importantly, they offer an “endogenous or feedback perspective” to structural problems [22] (p. 1) that can aid “theory building, policy analysis, and strategic decision support” [23] (p. 11). This endogenous perspective relates to two fundamental methodological tenets: (1) problem behaviors arise from the complex interaction of interrelated components within a closed boundary of a system, and (2) the system components are connected in feedback loops (circular chains of causal relationships), which endogenously generate the observed system behavior [24,25]. In this sense, the SD method “helps construct a causal-loop theory of system behavior in terms of feedback linkages” [26] (p. 400).
SD modeling is well-suited to domains in public health and medicine, with over 300 applications to date – for a review, see [27,28]. The “dynamic complexity in public health” (particularly due to nonlinear effects of multiple interacting variables within the system that affect health outcomes) makes it “difficult to know how, where, and when to intervene” [29] (p. 452). SD simulation modelling can effectively address this challenge and “elucidate the counterintuitive behavior of complex healthcare problems” [28] (p. 1). Particularly for prosthetics provision and related health care policy, SD modelling can support decision-making under uncertainty. The domain of prosthetics services is mired by the lack of robust data collection, contributing to a high level of uncertainty surrounding policy planning [1,16]. SD models, however, can “admit more variables on the basis of logic or expert opinion and for which solid statistical estimates may not be available” [29] (p. 453) and still generate useful insights under such uncertainty.

2.1. Literature Review

To our knowledge, apart from the two preliminary versions of this work [30,31], there has been no other application of SD to prosthetic service provision or major lower limb amputations in the academic literature. However, this work builds on existing SD literature on emerging medical technologies and innovation diffusion more generally. Paich, Peck and Valant present a model on pharmaceutical product strategy that integrates patient flows, product diffusion and adoption by physicians, and treatment attractiveness to patients [32]. Homer developed a model for medical technology adoption based on demand-side (user dispositions to accept or abandon based on social exposure and evaluation of product performance) and supply-side (R&D for product performance improvement and investment in promotional activities) dynamics [33]. These models are extensions of the Bass Diffusion generic structure that includes a word-of-mouth diffusion process (social exposure and imitation) and external adoption from advertising, which enhance the realism of innovation diffusion [21].
In their systematic review of SD models on innovation systems, Uriona and Grobbelaar point to a “promising stream of research” based on Technological Innovation Systems (TIS) theory, that departs from the innovator-imitator structure of Bass Diffusion [34] (p. 34). TIS theory posits that the formation of a new technological innovation system requires seven key interacting elements: (1) entrepreneurial activities, (2) knowledge development, (3) knowledge diffusion, (4) guidance of search, (5) market formation, (6) mobilization of resources, and (7) creation of legitimacy [35,36,37]. The complex interactions of these elements determine the growth prospects of a new technology. Subsequently, Walrave and Raven operationalized the theory into a conceptual SD simulation model [36,38]. The main advantage of the TIS framework is its explanatory power for the market formation of new technologies—a “complex non-linear interactive process” that involves several actors and institutions [34] (p. 28). Indeed, market formation requires collective market-oriented action to develop “shared market infrastructure” for “supporting the functioning of a stable market” [39] (p. 244).
Our work contributes to existing knowledge by synthesizing the TIS model with medical technology adoption models. Similar to Paich, Peck and Valant, we represent the patient flow of the health care and prosthetics care system for amputees. Like Homer, we represent the demand-side dispositions of amputees to adopt or abandon the emerging digital prosthetic device based on performance evaluation and word-of-mouth diffusion. We then captured the supply-side conditions of digital prosthetics using the TIS framework. In doing so, we present a feedback perspective to digital prosthetics market formation prospects and the corollary effects on product adoption as well as on the socio-economic and health indicators for the amputee population.

2.2. Data Collection

The iterative model building process, from conceptualization, quantification, to validation, was conducted in collaboration with Toyota Mobility Foundation—expert in system dynamics and human centered design for promoting mobility (second author) and ProsFit Technologies—digital prosthetics service provider (third author). It is tradition in SD to include problem owners and experts in the model building process who possess important domain expertise, experiential knowledge, and mental models of the system under investigation [40,41,42]. During this process, several iterations of the model were presented to the collaborators for validation. In terms of model parameterization, ProsFit provided numerical estimates for some parameter values where existing data was not available. In such instances, ProsFit relied on its network of prosthetists and other experts in the field to corroborate their assumptions and understanding. Estimates and comments from these domain experts were anonymized and shared via email correspondence. Such estimates represent the best available data and expert judgement at the time of the model development.
Apart from expert opinion, existing peer-reviewed literature was utilized extensively for model conceptualization—especially so for the conceptual market formation subsystem in the model. As for quantification, parameter values were obtained either from epidemiological data reported in the literature or from secondary datasets (Table 1). The model is calibrated to data from the United Kingdom (UK), since expert knowledge and literature pertaining to the country is more readily available, but it can nevertheless be calibrated to other contexts.

2.3. Model Description

In this section, we present a simplified stock-and-flow representation of the model. The simplified structure is split into the top-level Health Care System (Figure 1) and the Market Subsystem (Figure 2). We then briefly describe the key feedback processes involved (see Appendix A for a more detailed description of each feedback loop).

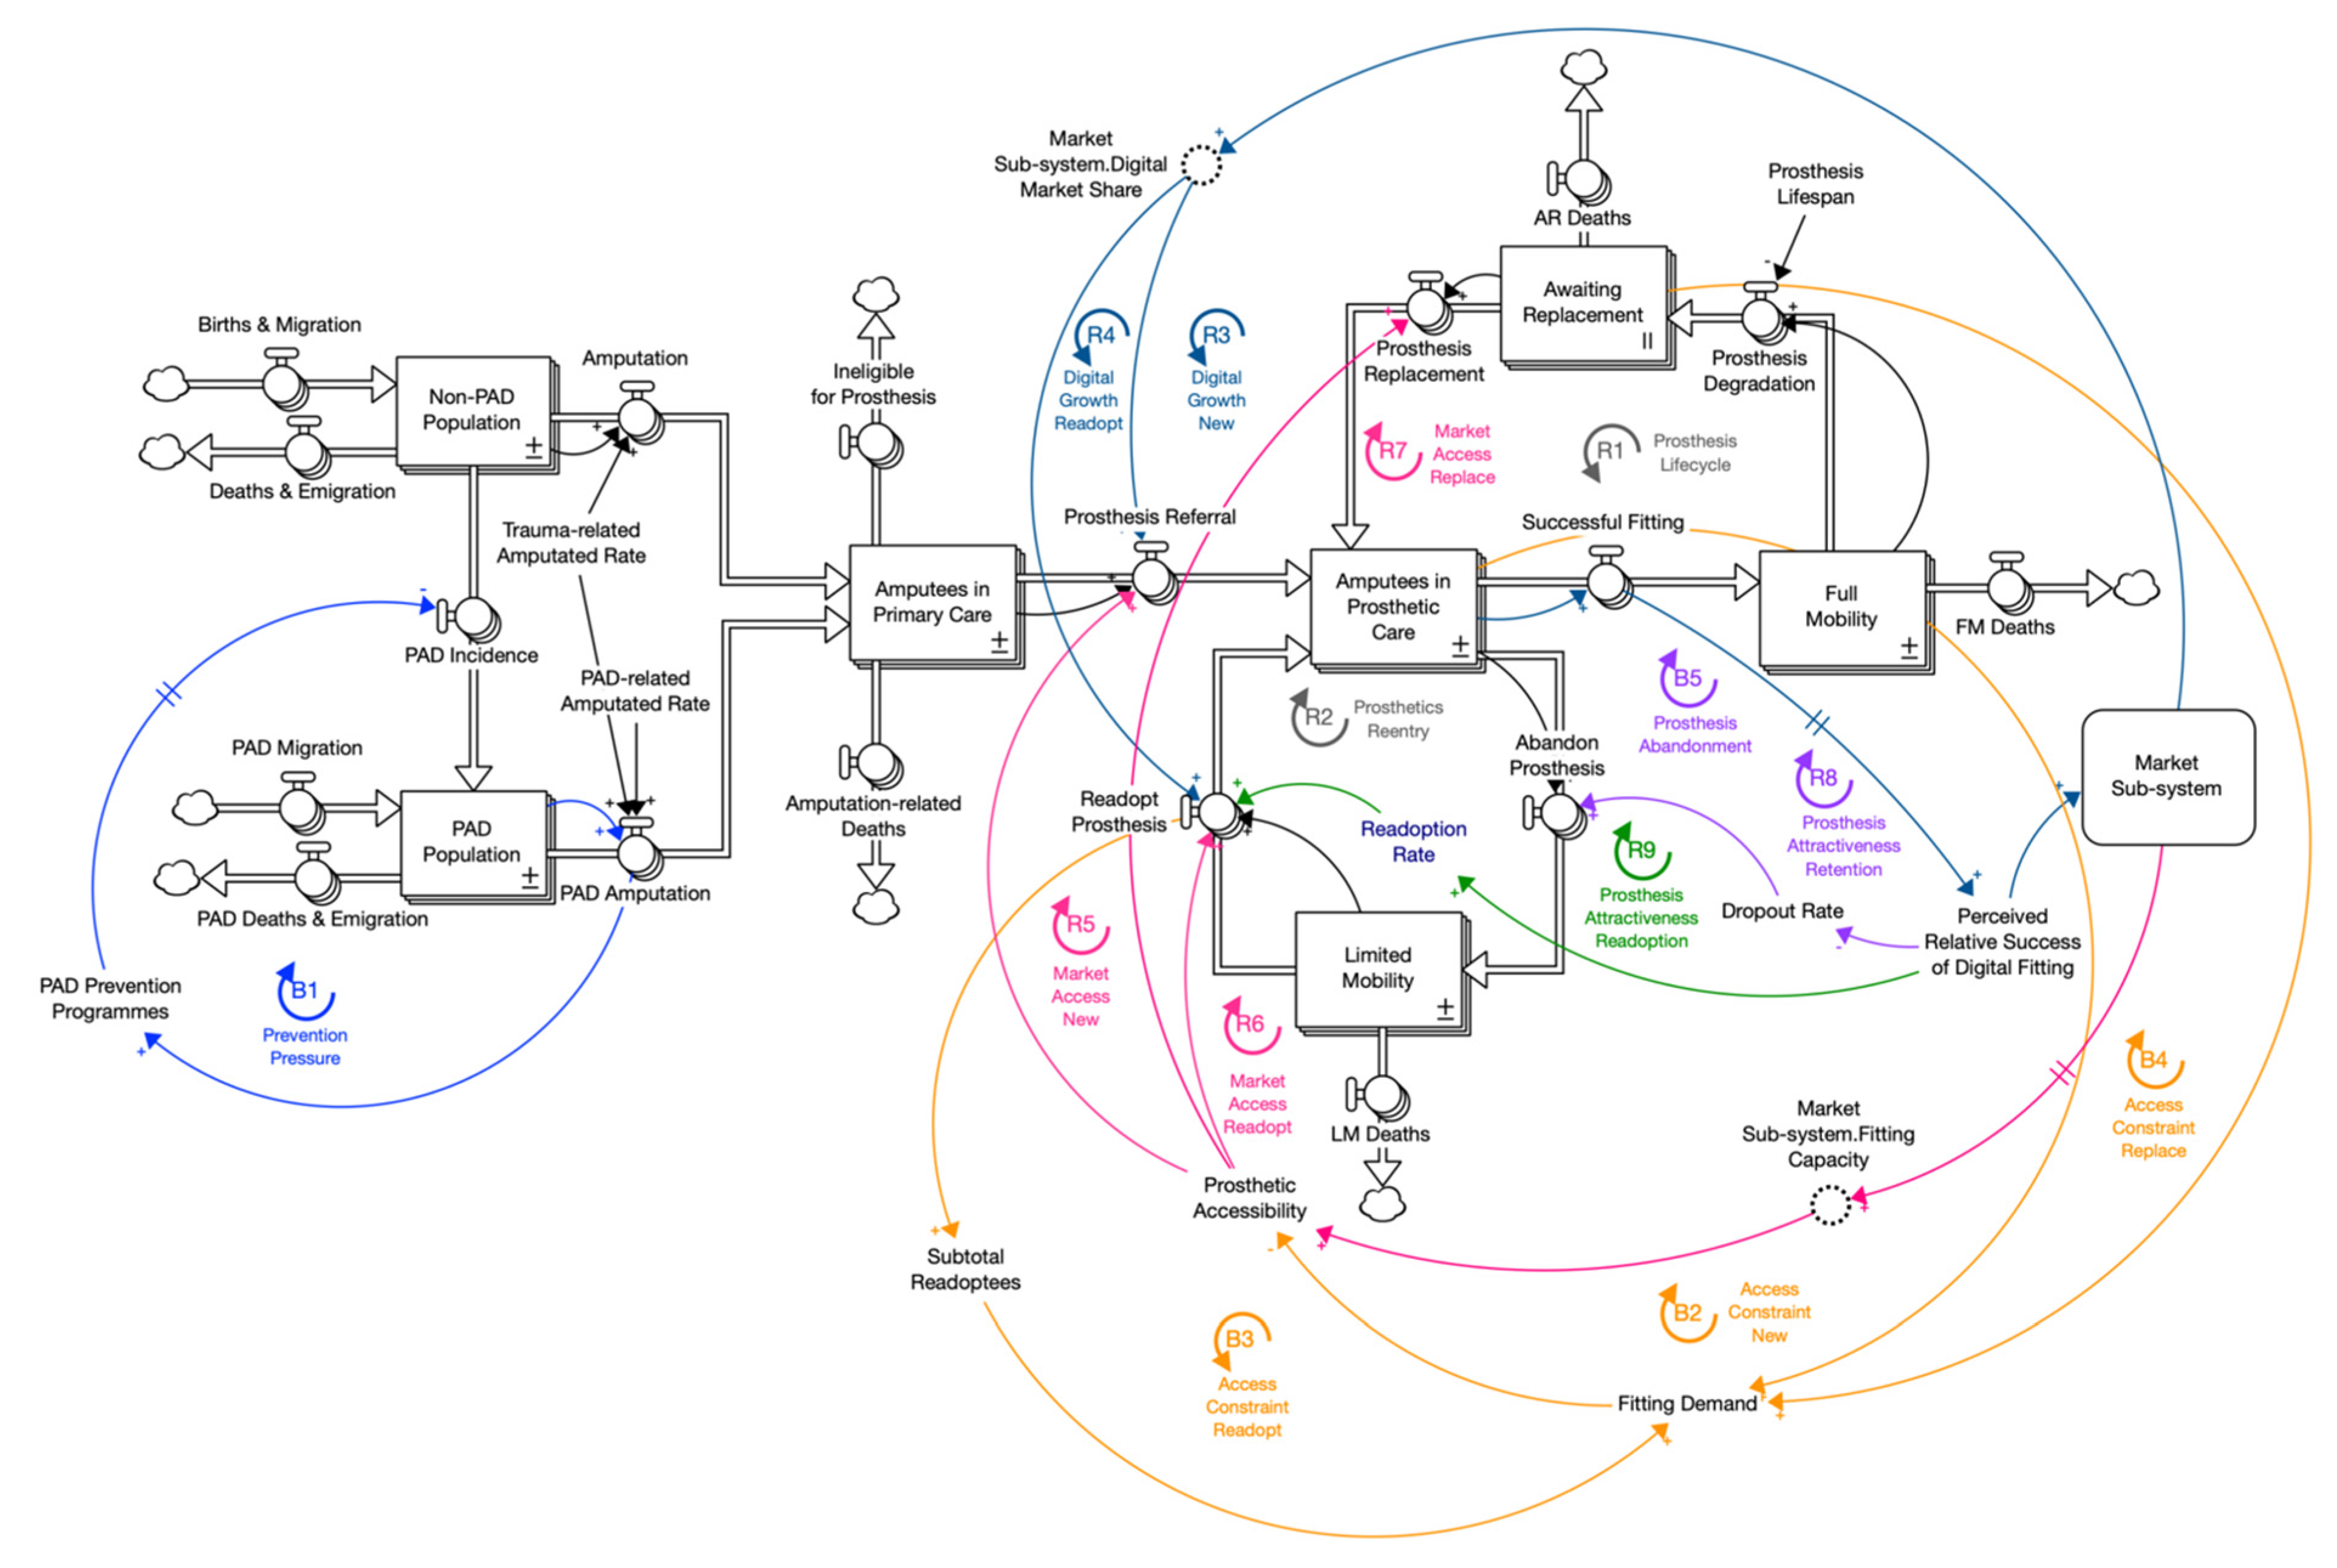
2.3.1. Health Care System

The health care system for amputees is represented as an aging chain that captures the flow of people across different stages or compartments. This structure is further arrayed to better capture and represent the characteristics and choices of different population groups (e.g., age and prosthesis type). Aging chains, commonly used in SD health models, can help identify accumulations and key bottle-necks in patient flows [27]. Figure 1 captures the flow of people from the general population and the PAD population stocks to acute care for either trauma-related or PAD-related amputation. At this stage, the Prevention Pressure loop (B1) works to reduce the PAD incidence rate over the long-term as the PAD-related amputations increase over time. This balancing feedback loop represents the prevention pressure faced by public health agencies to address the prevalence of PAD by stepping up efforts towards primary prevention, including early screening, smoking cessation, nutritional and activity programs [57,58]. A decline in PAD incidence would lead to a reduction of the PAD prevalence over time, which would eventually decrease major lower-limb amputations from PAD.
Amputees then flow into the prosthetic care stage, either into traditional prosthetics or digital prosthetics depending on the respective market share, from the primary care stage. They may achieve full mobility if successfully fitted with a prosthesis. However, both prosthesis types need to be replaced every three years on average [59]. As more amputees enter the prosthetics care stage, prosthesis degradation over time increases the number of amputees awaiting replacement of their devices before re-entering the prosthetic fitting process again. In this regard, the Prosthesis Lifecycle loop (R1) could result in a growing pressure for prosthetics demand, emanating from our best efforts to successfully fit new amputees with a prosthesis. Alternatively, amputees may dropout from the prosthesis fitting process altogether or abandon the device due to an unsuccessful fit [16,60]. These individuals flow into the limited mobility stock. However, amputees with limited mobility may later decide to readopt a prosthesis and therefore re-enter the prosthetic care stage again. This process is captured in the Prosthetics Re-entry loop (R2). Both loops engender a reinforcing mechanism that moves amputees through different stages of prosthetics care. They do not independently multiply the number of amputees in the loop beyond those already within the closed aging chain.
With the introduction of a digital prosthetics market, amputees are probabilistically referred to a digital prosthetist dependent on the market share. The perceived success of digital prosthetics is then conceptualized as the ratio of the rate of successful digital fitting relative to traditional fitting. When the rate of digital fittings surpass the incumbent traditional technology, we can expect a stronger favorable word-of-mouth diffusion about the success or reputation of digital prosthesis [61,62]. Over time, we expect the reputation of digital technology to reinforce the growth of the digital market size and thus the market share of the digital prosthetics through the Digital Growth loops (R3 and R4). With a higher market share, even more amputees are more likely to be referred to a digital prosthetist or may seek out one themselves if they are re-adoptees. Concurrently, the Prosthesis Attractiveness loops (R8 and R9) encourage stronger uptake of digital prosthesis devices. Word-of-mouth diffusion about the relative success of digital technology could motivate individuals to stick to the process and thus translate to a lower drop-out rate. It could also motivate those who have previously abandoned the process to re-enter the fitting the process, consequently increasing the re-adoption rate. Here, the diffusion processes are driven by evaluations of the relative performance of digital prosthetics (successful digital fitting rates vs. traditional), similar to the adoption structure in Homer’s model [33].
While the digital growth and prosthesis attractiveness loops drive the accumulation of amputees in the digital prosthetics care sector, the Access Constraint loops (B2, B3 and B4) counteract their reinforcing effects. Amputees’ access to the prosthetics care stage is limited by the capacity of the sector (number of fittings that can be accommodated by available prosthetists). Fitting demand is driven by new amputees, those seeking to replace their degraded device, and re-adoptees who previously abandoned the fitting process. When the fitting demand outweighs the fitting capacity, prosthetic accessibility reduces and thus limits amputees from entering the stage even if so desired. Over the longer term, however, the Market Access loops (R5, R6 and R7) work to improve accessibility for digital prosthetics by expanding capacity. A higher market share of digital technology would lead to an expansion of digital prosthetic clinics, which enables the sector to accommodate a larger number of patients. This effect, however, is delayed as it takes time to assess the market and set up new clinics.
As for the incumbent traditional prosthetics, they compete with the growing digital prosthetics market for referrals from the primary care stage. This is captured in the patient flow between the two stages, where entry to traditional prosthetics is determined by the inverse of the digital market share (i.e., 1–“Digital Market Share”). However, in the model, traditional prosthetics is assumed to be unaffected by the diffusion processes of digital technology. Should digital technology gain dominance, one might expect the incumbent’s reputation to diminish and, as a result, more amputees might dropout and fewer might re-adopt a traditional prosthesis. Moreover, traditional prosthetics sector might also face a capacity contraction. Yet, these effects were not modeled for a more conservative estimate of digital prosthetics’ impact since, without concrete data, this could add to further uncertainty of the model. Instead, the patient flows within the traditional prosthetics care sector were held at constant fractional rates, apart from new amputee referrals.

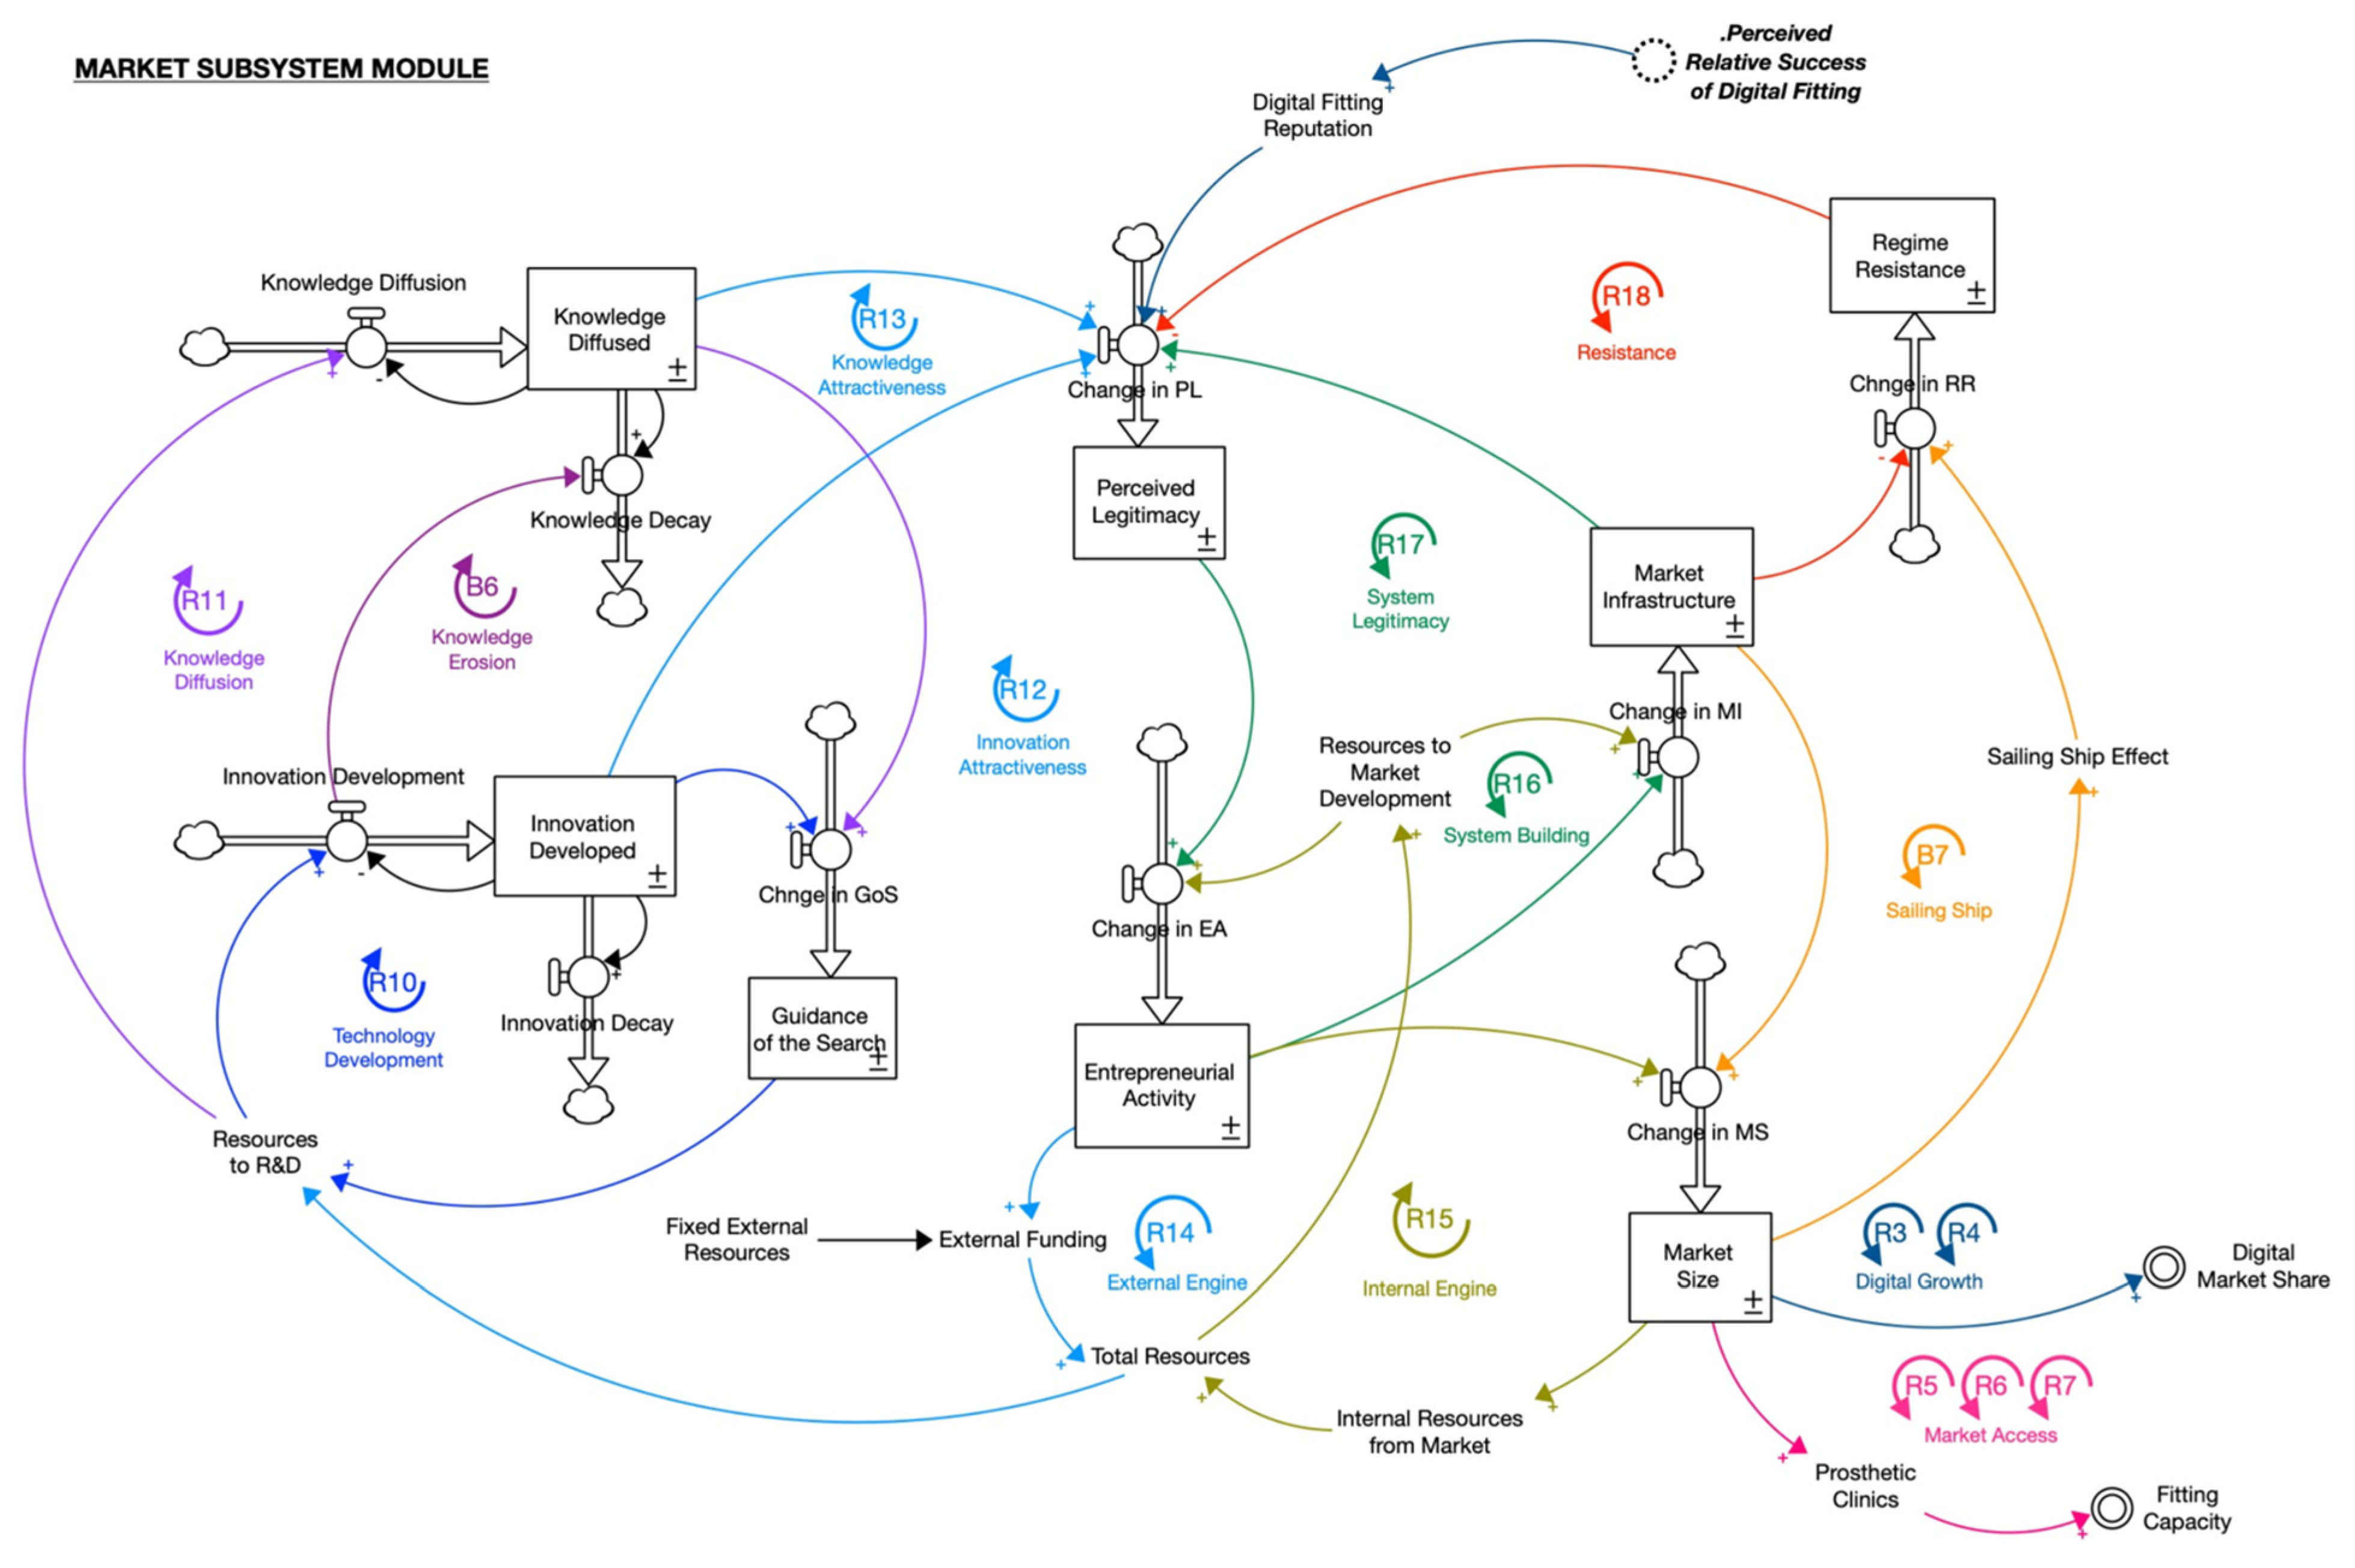
2.3.2. Market Subsystem

In the top-level health care system, we sought to explain the effects of digital prosthetics market growth on the prosthetics care sector. The complexity involved in market formation within the market subsystem is represented in Figure 2.
The process of technological knowledge development is described by the synergistic interaction of the Technology Development loop (R10) and Knowledge Diffusion loop (R11). Innovation development and diffusion of knowledge is required for any TIS to grow, and this is dependent on the level of resources available for R&D [35,63]. As innovation is developed and diffused through the exchange of knowledge between various actors in the system, the guidance of search for the new technology increases. Guidance of search refers to the “visibility and clarity” of the state of the art [35] (p. 423) that reflects the “promises and expectations of the emerging technology” [63] (p. 56). This helps in the priority-setting of that technology and directing more resources for further R&D, which would enable even more technological knowledge development and diffusion.
This process, in turn, attracts new entrepreneurs into the emerging market through the Innovation Attractiveness loop (R12) and Knowledge Attractiveness loop (R13). Entrepreneurs are central to any TIS for carrying out market-oriented action [63]. As more innovation is developed and diffused, the technological legitimacy of the technology increases and accumulates the perceived legitimacy of innovation system. [36]. This encourages more entrants to enter the market and grow the level of market-oriented entrepreneurial activity. Since entrepreneurial activities indicate the health and sustainability of an innovation system [35], this would bring in more external funding/resource stream into the system from private or public actors [36,63]. External funding further reinforces the growth of entrepreneurial activities through the External Engine loop (R14). External backing reduces the perceived entrepreneurial risks involved, and consequently is better able to attract further entry into the market [36,63]. Moreover, the external funding stream increases the total resources available in the system, which spurs more development of innovation that increases the legitimacy of the technology even further.
While the external engine stimulates entrepreneurial activity initially, the System Legitimacy loop (R17) endogenously generates internal (“financial, material, human capital”) resources over the longer term for market sustainability [63] (p. 57). This loop comprises the two smaller Internal Engine loop (R15) and the System Building loop (R16), and is capable of driving the entire system [37]. Entrepreneurs contribute to the “development of formal market rules, establishment of intermediary networks, the building of infrastructure, or the development of formal regulations” [36] (p. 1837). The developed market infrastructure generates market legitimacy for the TIS, which reduces market formation uncertainty and the perceived cost to participation [39]. Hence, more entrepreneurs are willing to overcome perceived risks and enter the market, contributing to further infrastructure development (R16). Moreover, these established market structures, mediated by entrepreneurial activities, “contribute to the creation of a demand for the emerging technology” [63] (p. 56). This increases the market size for the technology that generates internal resources from the market (R15). The synergy of the loops, reflected in R17, thus drives the self-reinforcing growth of entrepreneurial activities, market infrastructure, market legitimacy, and market size.
The formation of a niche market for the emerging technology, however, precipitates “resistance from actors with interests in the incumbent” regime [63] (p. 57). For instance, “when regime actors try to influence public discourses, or lobby against favourable support” [36] (p. 1837). This process is captured in the Resistance loop (R18). Regime resistance decreases the market legitimacy of the emerging technology, which disincentivizes entrants due to higher perceived risks. In turn, there will be less market infrastructure development to counter the regime resistance. As the niche market grows and competes with the incumbent regime, resistance could also come in the form of innovation. Given the new threat, regime actors would “increase their efforts to improve the performance of the existing regime through innovation” [36] (p. 1838). This is referred to as the sailing ship effect [64,65] and is represented in the Sailing Ship loop (B7). It contributes to a stronger regime resistance and counteracts the effects of the System Legitimacy loop.
Finally, the top-level health care system is connected to market subsystem through the Digital Growth loops and Market Access loops. As the reputation of digital fittings grow, we expect it to bolster the technological legitimacy of digital prosthetics. This would lend strength to the System Legitimacy loop, which ultimately increases the market size. With a larger market size, the market share of digital prosthetics rises relative to the incumbent traditional prosthetics. Importantly, the number of digital prosthetic clinics also increases to expand the fitting capacity. This improves the digital prosthetics accessibility, which enables more amputees to be fitted with a prosthesis and achieve mobility.

2.4. Model Validation

The described feedback structure was operationalized into a SD simulation model. The model was built in Stella Architect version 3.0 (SD modelling software from isee systems) using Euler Integration with a time-step of 1/16 of a month, or about 2 days, which is less than half of the smallest time constant of 7 days (0.23 months) for the pre-operation hospital stay in the primary care sector. The model is simulated over a time horizon of 480 months, representing January 2010 to January 2050. Simulation modelling facilitates the visualization of the impact of digital prosthetics on the health care system and, more importantly, experimentations to better understand the dynamic complexity of the system [21,29]. Here, we summarize the results of the model validation procedure as proposed by Forrester and Senge [66] and Barlas [67] to build confidence in the simulation results. A more detailed validation report is available in a previous iteration of this work [30].
The model structure is supported by relevant literature and input from stakeholders. As a digital prosthetics service provider (ProsFit) and a double lower-limb amputee, the third author of this paper was heavily consulted during the iterative process of model building to validate the structures in the health care system. Parameterization of the health care system was based on empirical data sources (Table 1). In instances where data was not available, the values were estimated from expert opinion. This pertains to the fractional dropout and readoption rates, which are estimates from ProsFit and their network of prosthetists. Parameter verification for the market subsystem, however, was challenging given the conceptual nature of the model. Thus, the parameter values set in the original model [38] was kept and subject to further sensitivity tests. All parameters and variables in the model were assigned units of measurement that are both mathematically and conceptually consistent. The model documentation provided in the Supplementary Materials details the above for each variable in the model.
Moreover, direct- and indirect-extreme conditions tests were performed to ensure robustness of structural formulations. There were no computational errors detected in the model and the results conform to values that are within bounds. We further conducted sensitivity analysis for all parameters in the model. Each parameter was varied over 100 sensitivity runs. The variation is based on a uniform distribution random draw using Sobol Sequence sampling method [68]. The results of the sensitivity analysis are summarized in Table 2. Expectedly, the model was mostly sensitive to parameters in the conceptual market subsystem. As a result, it introduces uncertainty to the relatively empirical top-level model. This means that this model cannot produce accurate numerical estimations. Nevertheless, it was deemed more useful to represent the complexity of market formation than the alternative: a simplistic table function with high levels of sensitivity. Understanding how digital prosthetic market formation may plausibly occur from a feedback perspective could be useful to decision-makers seeking to improve mobility outcomes and maximize the impact of limited resources.

3. Simulation Results

3.1. Baseline Setup

The model was initialized in equilibrium to produce the baseline simulation results. In a previous iteration, we attempted to initialize the stocks at the obtained or calculated initial values [30]. However, there are virtually no numerical estimates for individuals in the various transitory stages of the primary care continuum and prosthetic care continuum. Consequently, we opted to initialize the stocks in their long-term equilibrium values to prevent transient stock adjustments. Moreover, initializing the model in equilibrium enables us to observe the full effects of any shocks exogenously introduced to the model—in our case, the formation of a niche digital prosthetics market.
To set the model in equilibrium, we held the total population of the UK constant at about 61.1 million individuals over the time horizon and initialized the population stocks in their long-term equilibrium values. The equilibrium switch in the market subsystems initializes the innovation diffusion stocks at zero and cuts off the exogenous input of relative resources. This ensures there are no dynamics in the market subsystem, thus representing a scenario wherein the prosthetics sector is solely serviced by the traditional prosthetics service providers at their existing capacity.

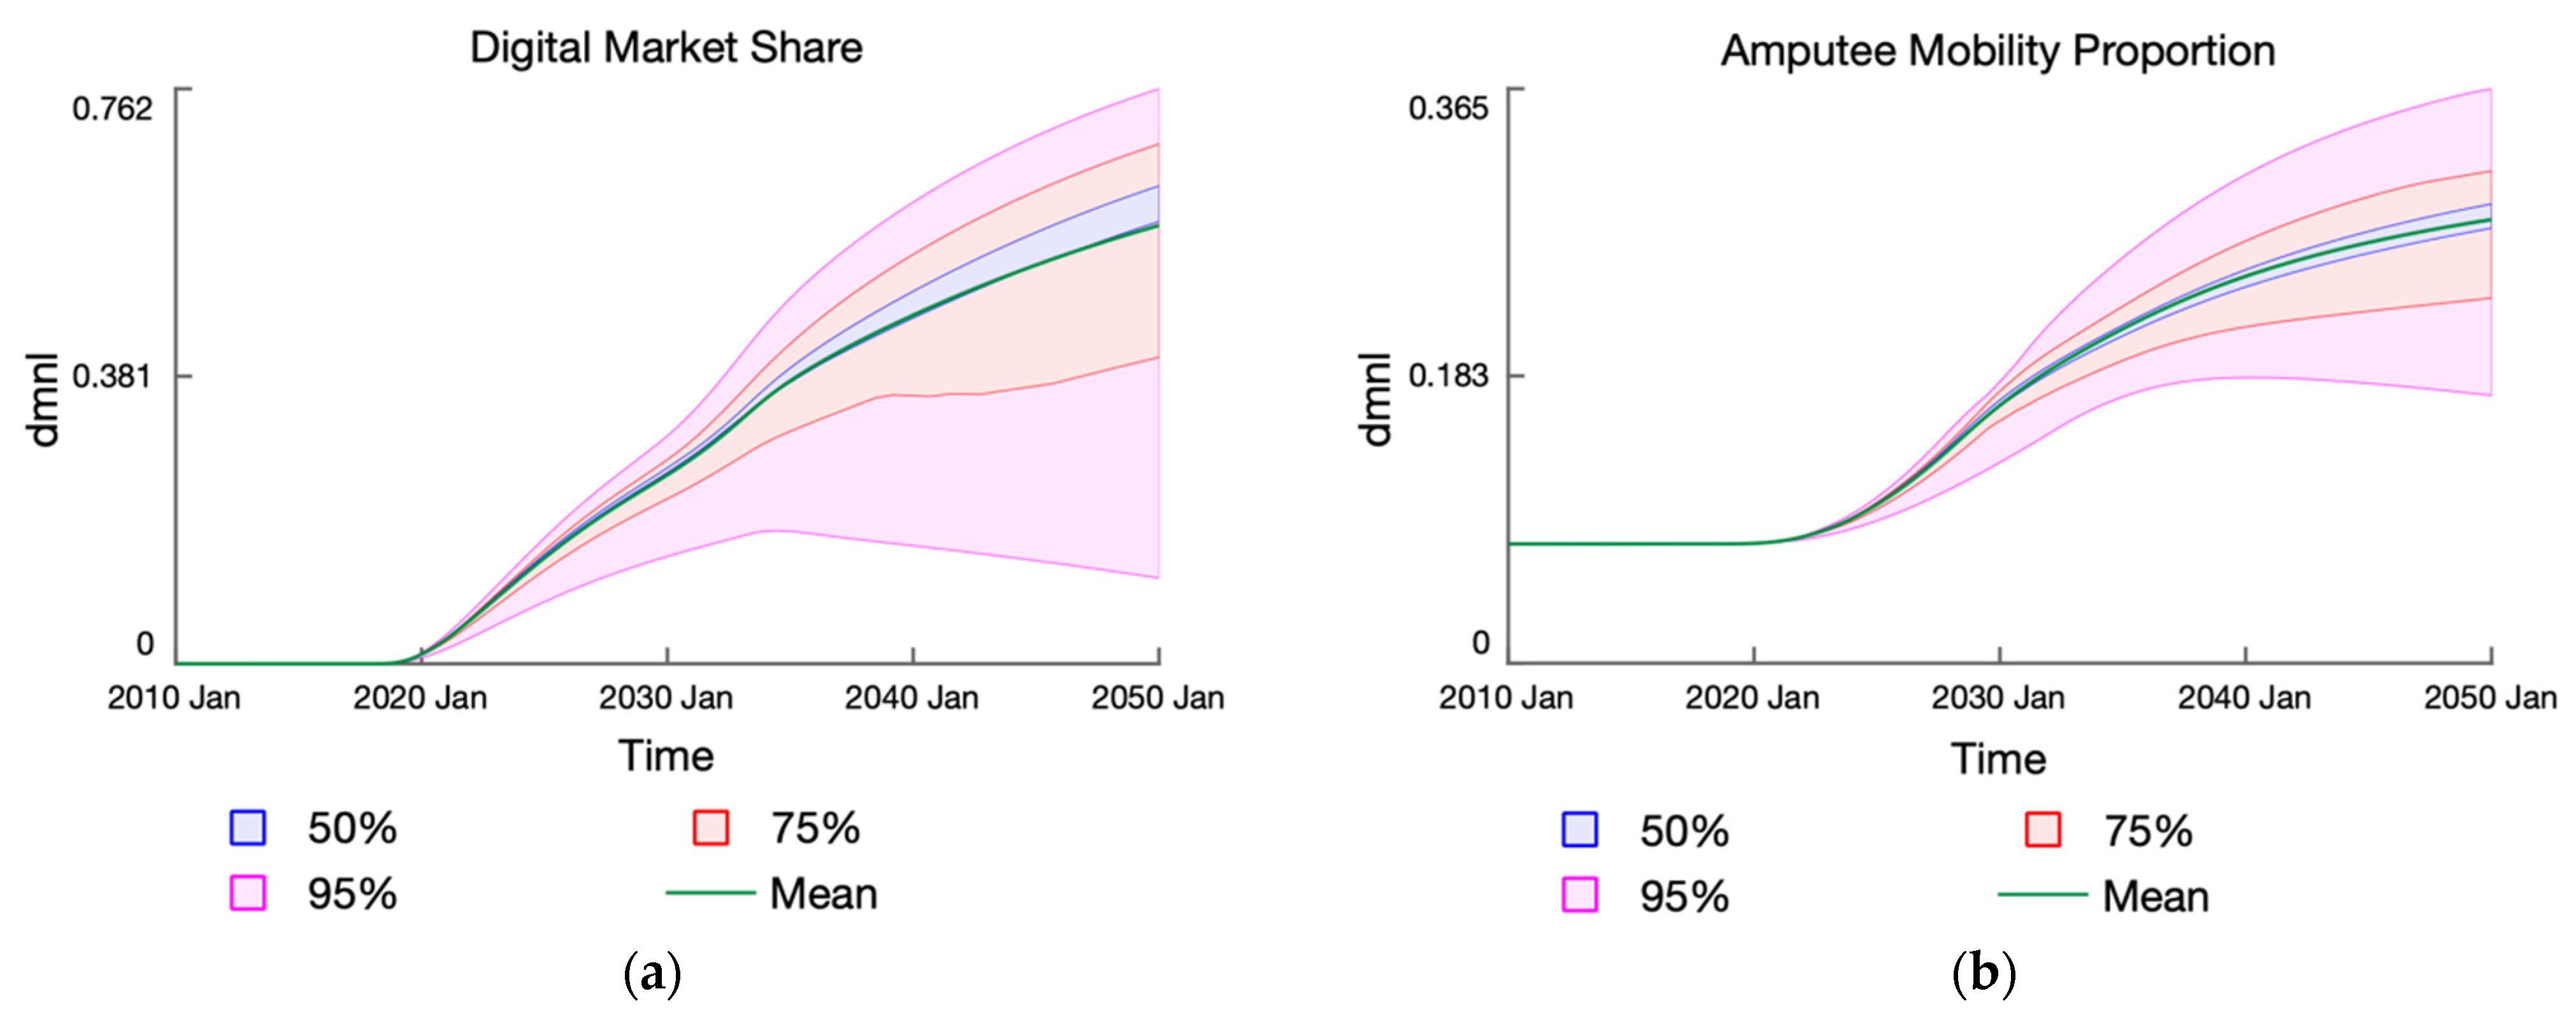
3.2. Baseline Results

The baseline results provide the estimated equilibrium values of the respective key indicators for the system (see Table 3). With a constant population size of 61.1 M people, we estimate a total of 84.8 K major lower-limb amputees, with about 85% of them being deemed medically eligible for a prosthetic device (71.9 K people). Of those eligible, only 5.5 K amputees are estimated to be fitted with a (traditional) prosthesis, thus resulting in a mobility proportion of over 7%. The amputee mobility proportion represents the proportion of eligible amputees who have achieved full mobility through a successful prosthesis fitting, which is determined by three factors. First, the accessibility of prosthetics services, which represents the percentage of demand that is met by the existing service capacity. The model estimates this to be just under 12%, indicating a bottleneck in the prosthetic care system. This is also within range of the WHO global estimate—that only 5 to 15% of amputees have access to prostheses [1]. Second, individual dispositions to drop out from the fitting process (estimated by experts to be about 10% for each stage of the process prior to the final device) and to readopt it (about 20%) at a later time. Third, the probability of final device fit success, which is about 50% for traditional devices [15,16].
Furthermore, health-related economic indicators were calculated based on the inputs from the endogenous processes in the health and prosthetics care systems. The monthly economic productivity of amputees is estimated to be about USD14 M per month. This indicator represents the economic participation of amputees from returning to work and reintegrating into the workforce. It is conceptualized as the product of the estimated number of employed amputees with the gross domestic product per capita. Amputees not fitted with prostheses are excluded from workforce participation given their limited mobility. This is a gross simplification that does not completely reflect the economic contribution of amputees from other measures such as individual consumption. The total economic cost incurred, on the other hand, is estimated to be USD210 M per month. This includes the differentiated health care costs, unemployment and social payments, and the opportunity costs borne by families for caretaking. Lastly, the estimated total cost of prosthesis provision is about USD1.94 M per month, which includes both successful and failed prosthesis fittings. Reimbursements for prosthesis costs are assumed to be fully covered by national insurance mechanisms, which would otherwise be borne as out-of-pocket payments.

3.3. Experimental Setup

To simulate and investigate the impact of digital prosthetics on the baseline behavior, we introduced dynamics in the market subsystem module. This was done by setting the parameter value of Relative External Resources (RER) Size above 0 from month 96 for an assumed duration of 180 months (year 2018 to 2033) to exogenously kick start the dynamics. This simulates the deployment of external funding streams to support initial market growth prior to self-sufficiency. Moreover, the Innovation Developed and Knowledge Diffused stocks were initialized at 0.01 to push them out of unstable equilibrium.
As mentioned, given the conceptual nature of the market subsystem, we have introduced several assumptions in the parameter values that would result in estimation errors. Therefore, we ran a global sensitivity analysis with combined variations in all the parameters that the model is sensitive to (as identified in Table 2). The experimental results, in turn, show the confidence intervals (up to 95%) of the key indicators from 1000 runs based on Sobol Sequence sampling method [68]. A total of 1000 runs was sufficient to fully explore the state space of the stocks in the market subsystems. This experiment gives us the full range of possibilities for digital prosthetics market growth and thus enables us to observe the corollary effects on the more empirical prosthetics care system.

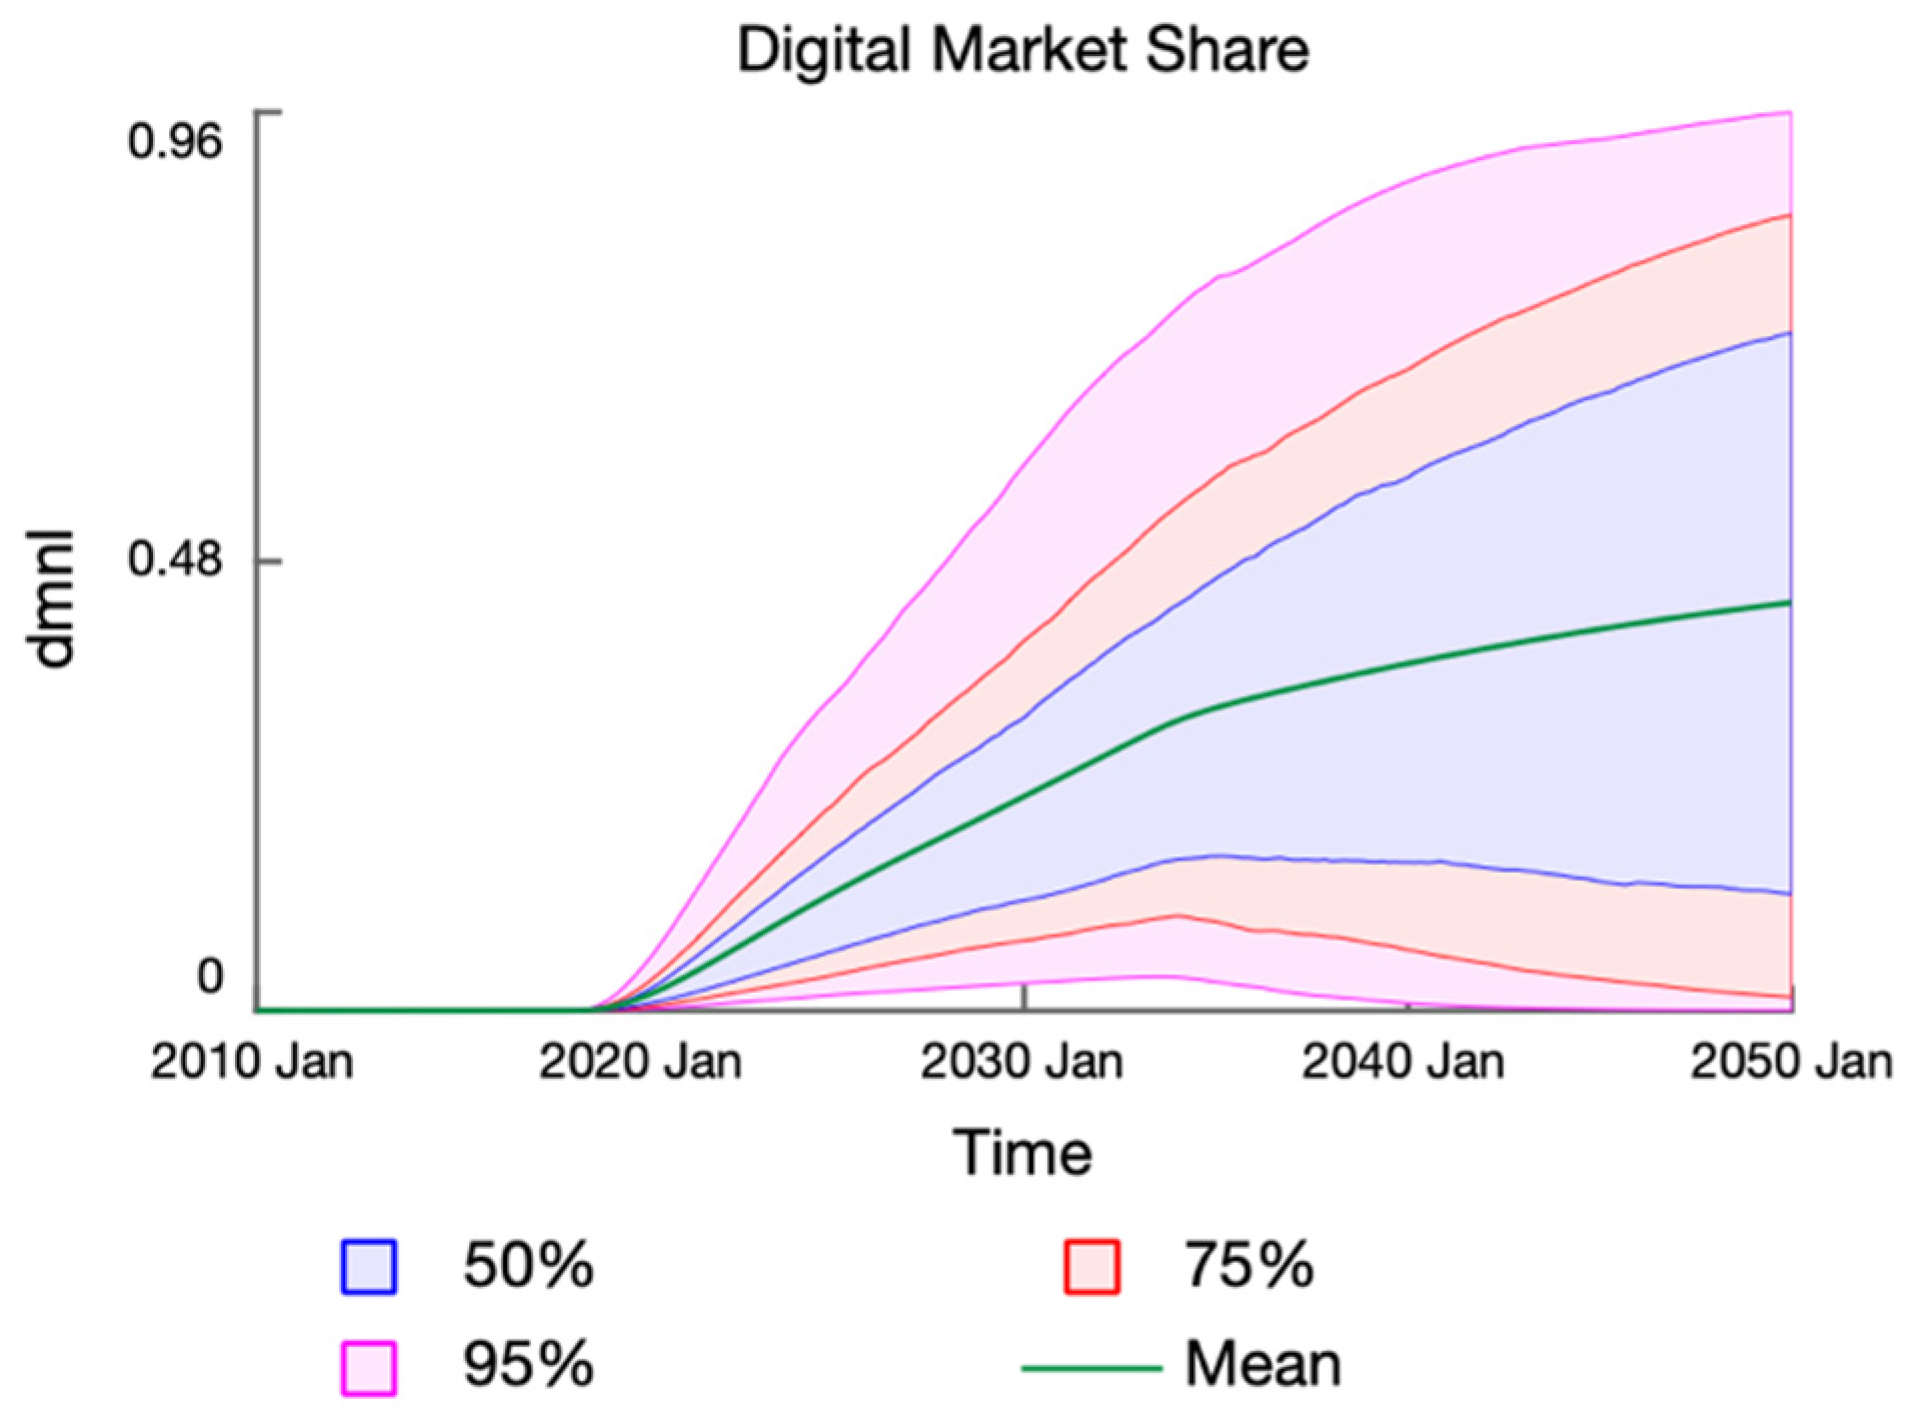
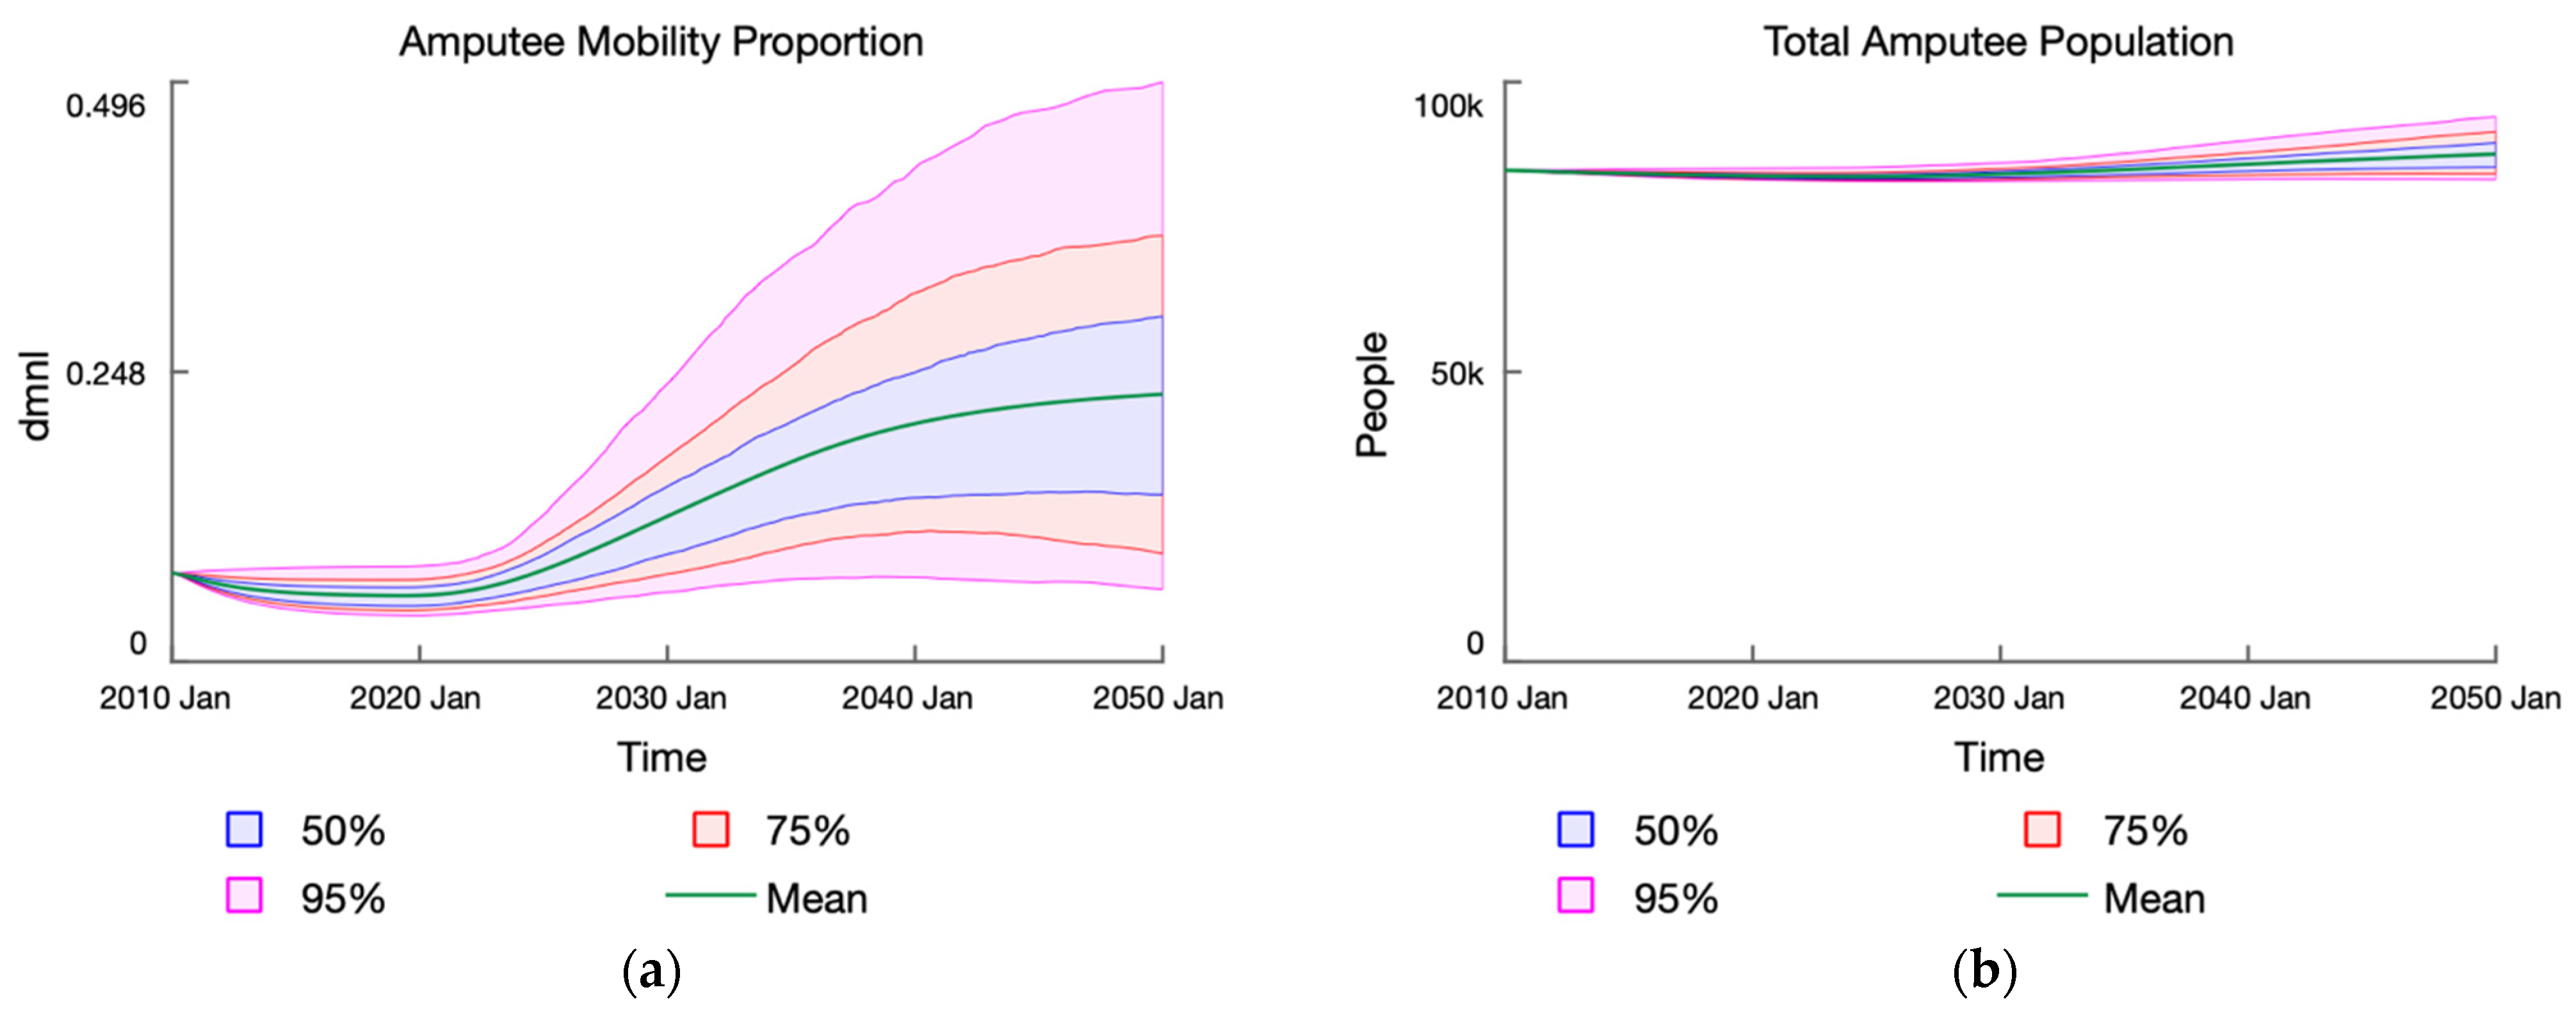
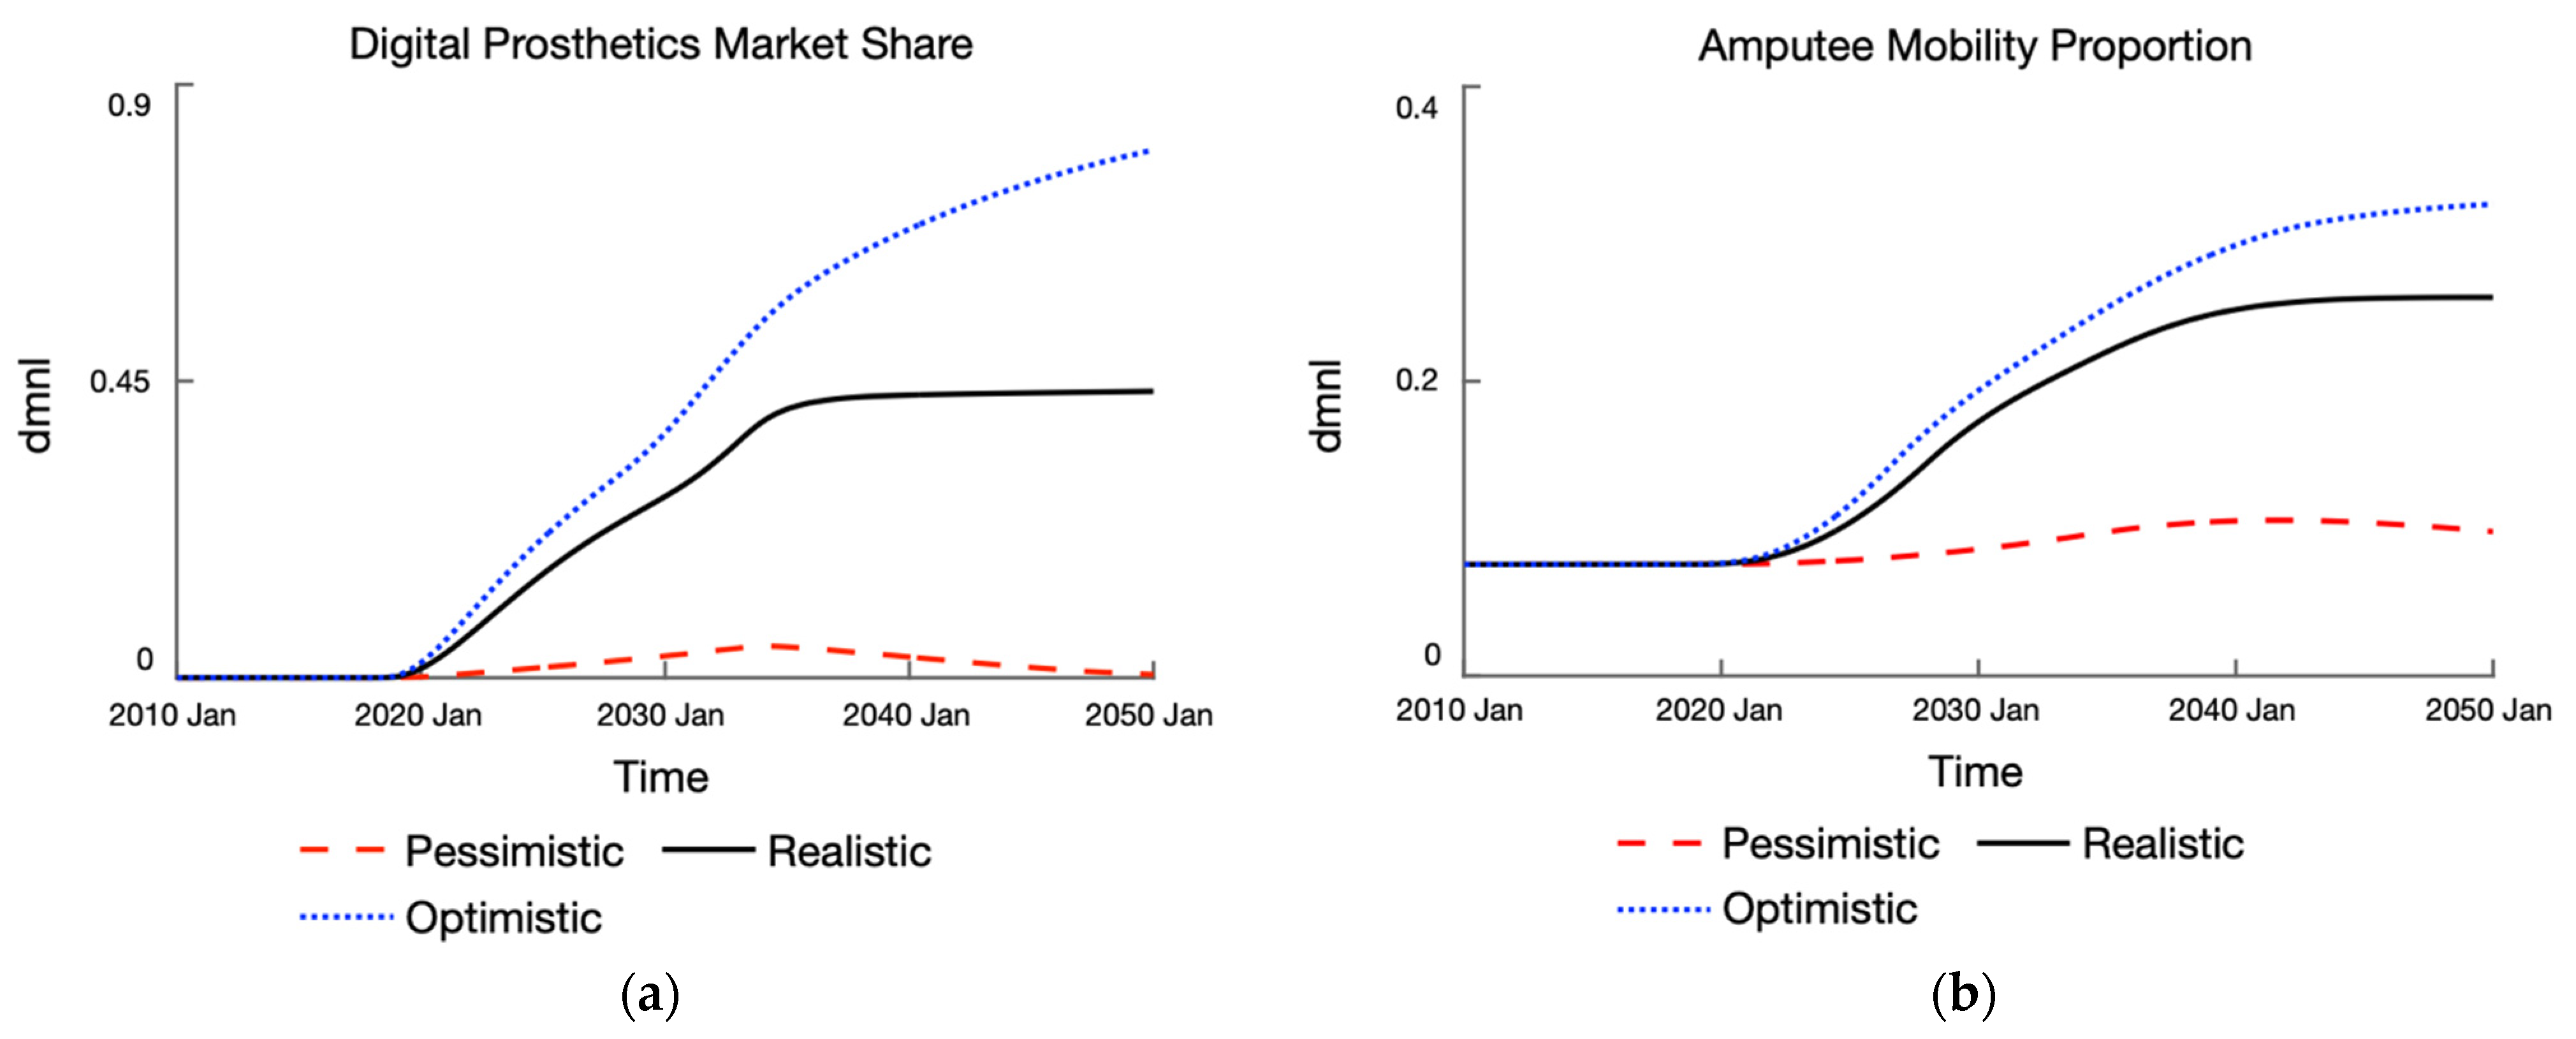
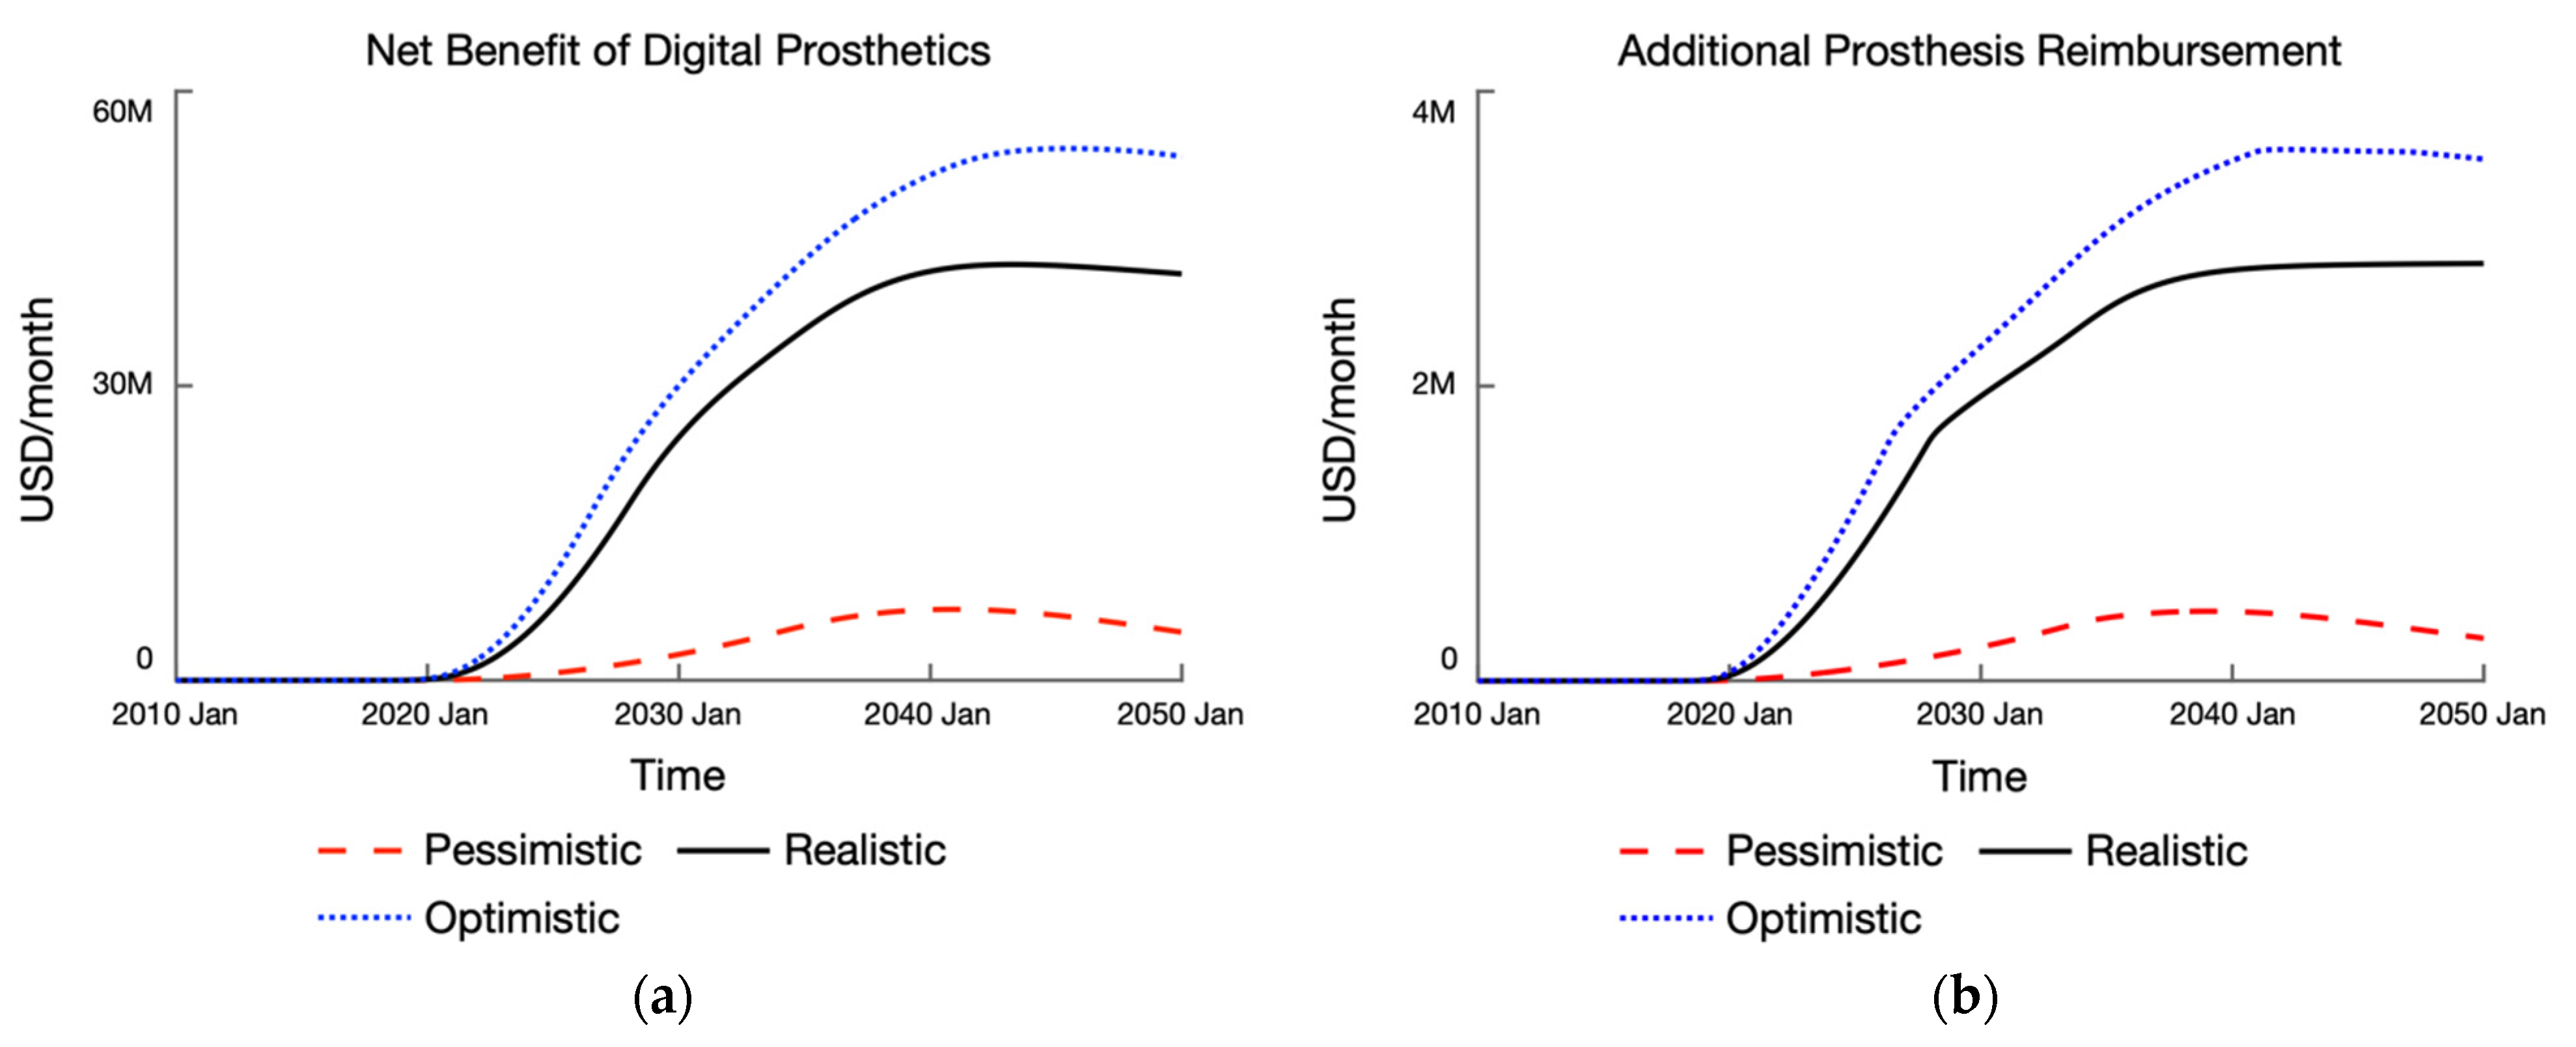
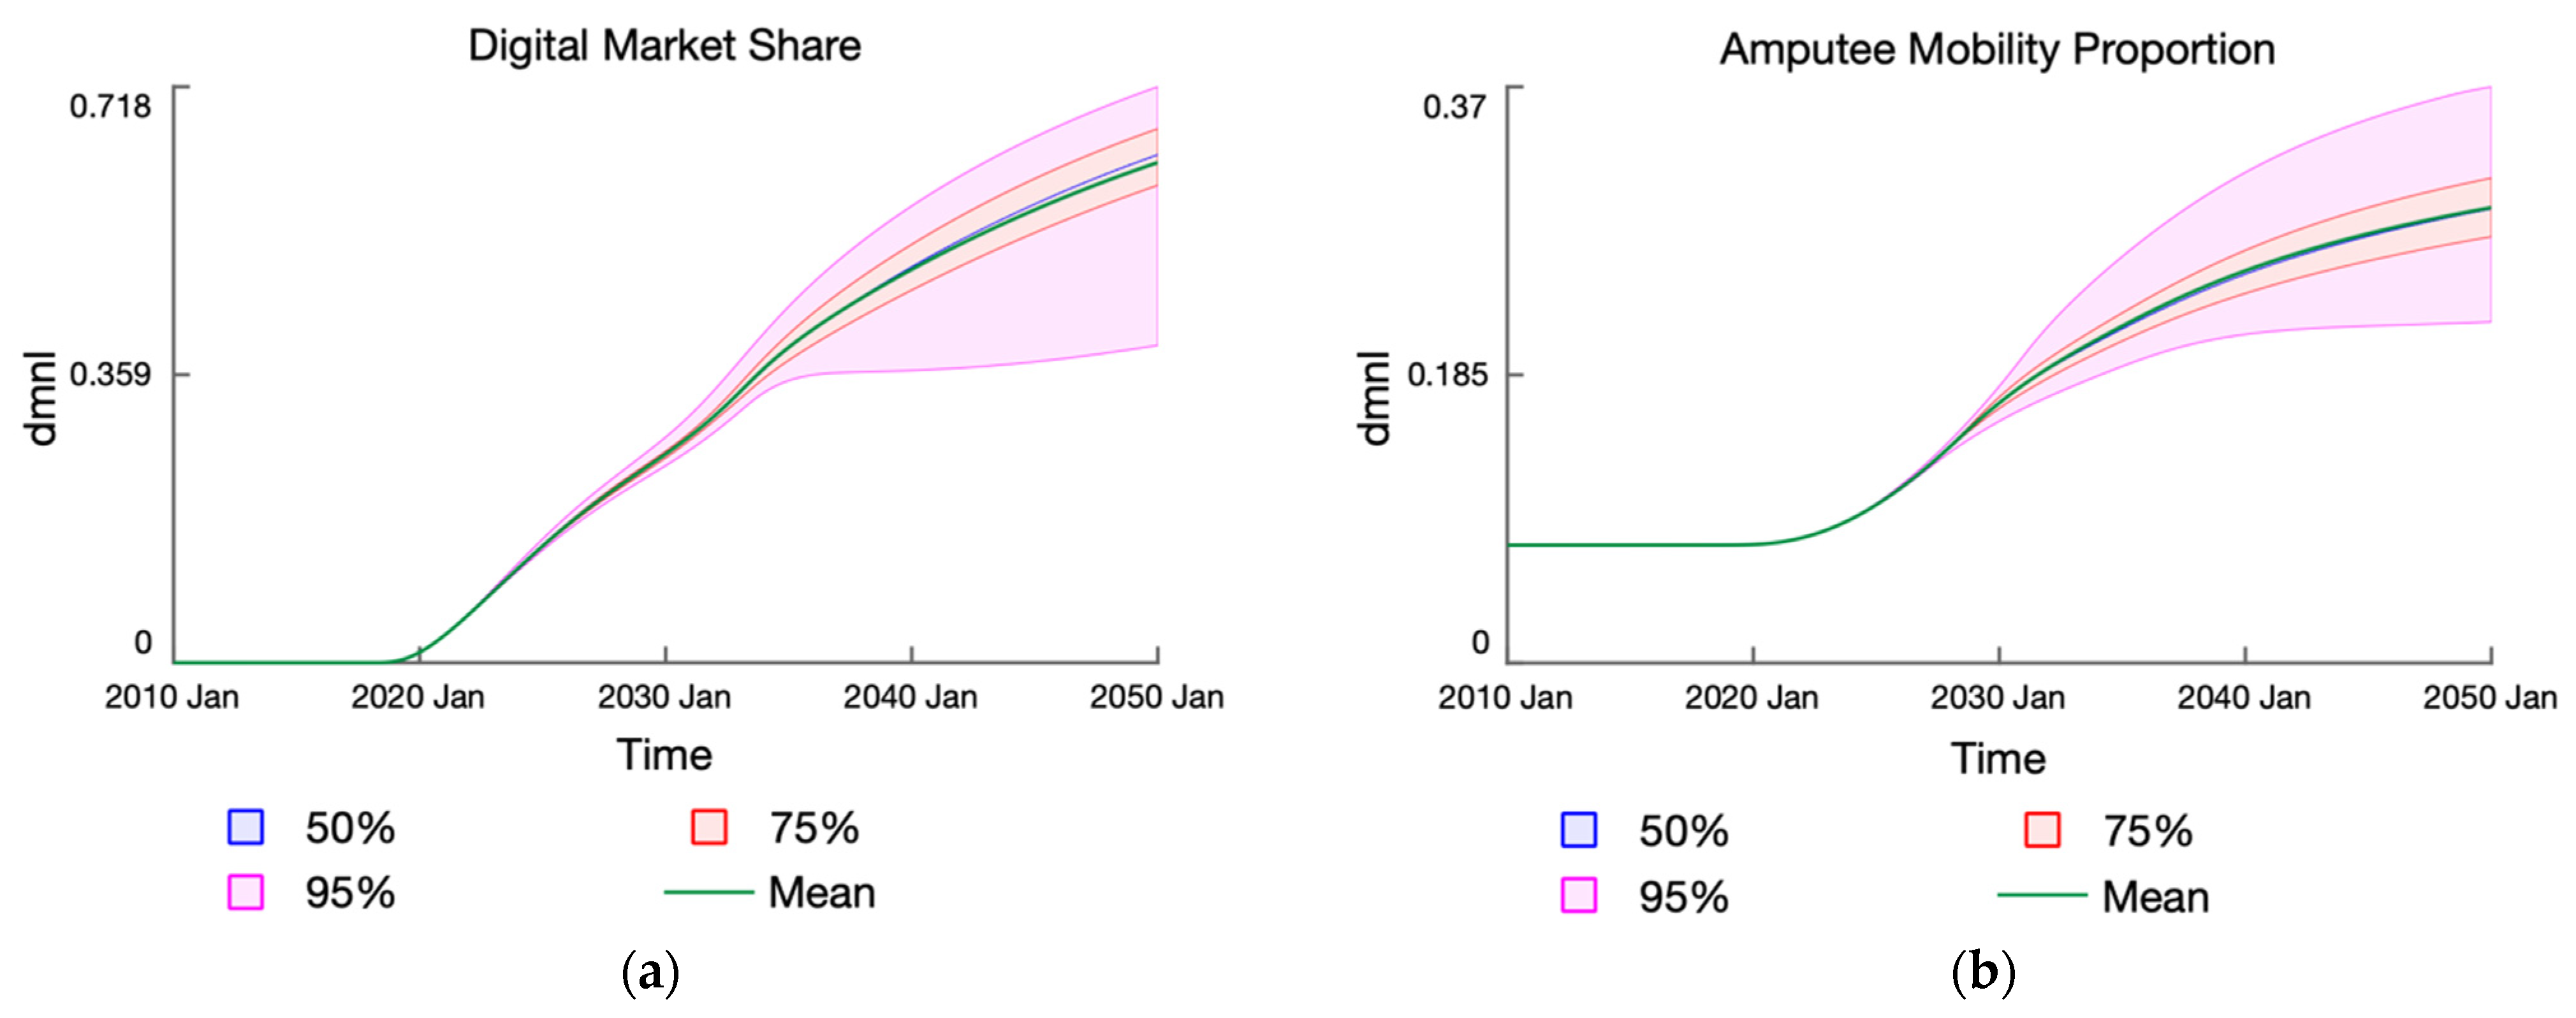
3.4. Experimental Results

Given its known sensitivity, the model produces a range of market growth for digital prosthetics, from 0.03% to 96% market share by 2050 with a mean of 43.6% (Figure 3). In general, with a RER size of more than 0, the External Engine loop (R14) powers the endogenous market formation processes that allows the Digital Market Share to start growing. However, as R14 loop is cut off by year 2033, we observe three behavioral patterns: (1) steady decline, (2) a much slower albeit continued growth, or (3) sustained growth. The sustainability of market growth is ultimately dependent on the strength of the Internal Engine (R15) and the System Legitimacy (R17) loops in endogenously generating sufficient internal market resources.
Nevertheless, we can observe the impact of digital prosthetics market growth on the amputee population and mobility outcomes. As digital prostheses are introduced to the prosthetics care system, Figure 4a shows an increase in the mobility proportion from the baseline of 7% to a mean of 23% by 2050 (range: 6.2–50%). The introduction of digital prosthetics not only increases the existing service capacity, but also results in more successful fittings—a synergistic product of the Digital Growth (R3 and R4) and Prosthetics Attractiveness (R8 and R9) loops. The Digital Growth loops enable more amputees to enter the prosthetics care system either as a new entrant or a re-adoptee, whereas the Prosthetics Attractiveness loops discourages amputees in the fitting process from dropping out and encourages previous dropouts to re-adopt a device. In turn, more amputees achieve mobility. The increased mobility further leads to improved health outcomes, including a lower mortality risk. In this sense, the expansion of digital prosthetics prevents more deaths, which accounts for the increase in the amputee population from the baseline of 84.8 K to an average of 87.6 K individuals by 2050 (range: 83.2 K–94 K) as seen in Figure 4b.
Additionally, we observe that the mobility proportion develops similarly to the digital market share; if the market share were to decline after year 2033, so would the mobility proportion. However, the mobility proportion develops at slower pace and changes to a smaller extent. This is due to (1) the multiple delays involved in the aging chains of the fitting process and (2) the effect of the Access Constraint loops (B2, B3 and B4) from prosthetics accessibility that limits the number of amputees according to available service capacity.
As for the prosthetics accessibility, it increases for the first of half the simulation duration before declining again, which consequently limits the growth of the mobility proportion. With reference to Figure 5, the peak of the mean accessibility is about 44% some time in 2028 (range: 13.6% to 100%), which eventually declines to 20% by 2050 (range: 2.8% to 93.6%). In general, the accessibility ratio increases as the digital market grows and adds additional service capacity to the existing level. In conditions where there is limited market growth, we observe that the accessibility declines around the time when the exogenous funding is cut-off in year 2033. However, under more optimistic market growth conditions, we observe that the accessibility peaks prior to the cut-off time and declines thereafter. This is due to the higher volume of demand for replacing degraded prostheses generated by the Prosthesis Lifecycle loop (R1). Prostheses have a lifecycle of 3 years on average, and hence there is a captive consumer base that will continue to shore up fitting demand—more so when the proportion of fitted amputees is high. As seen in Figure 5, the total accessibility may increase to the maximum (100%) in instances where parameters enable a rapid and large expansion of digital clinics (e.g., Sensitivity of Clinics to Market Size) to meet the demand for fittings. Even then, it declines by the tail end of the simulation for the reasons described.
As a result of the developments in the prosthetics care system, we can further assess the impact on the health-related economic indicators. The economic productivity of amputees follows a similar development to the mobility proportion since employed amputees make up a fraction of those who are mobile. Figure 6a shows and increase in the monthly productivity of amputees from an average of USD14 M to USD43 M by year 2050 (range: USD11.5 M to USD97.7 M). Again, these figures are underestimates that only partially captures the true economic contribution of amputees. Whereas Figure 6b shows a reduction in the monthly economic cost incurred, decreasing from USD210 M to USD202 M on average (range: USD289 M to USD211 M). The economic cost per capita reduces as the mobility proportion increases because mobile amputees incur smaller health care costs, social payments, and opportunity costs for their families. However, note that effect from the per capita cost reduction has been counteracted by the overall increase in amputee population size from improved health outcomes (less deaths). In this sense, the reduction in total economic cost is not as pronounced as the per capita reduction in economic cost. Based on these figures, we can further anticipate the net benefit of digital prosthetics service provision: the sum of the additional economic productivity and the amount of reduction in economic cost. The average net social benefit is then calculated to be a mean of USD37 M per month.

3.5. Scenario Setup

The experimental results have shown that there are three fundamental behavior modes within the range of possibilities for digital market growth. To better visualize the differentiated impact on the prosthetics care system, we developed three hypothetical scenarios for digital market growth. First, a pessimistic scenario to represent the growth and steady decline. Second, a realistic scenario wherein the digital market experiences a much slower rate of growth after external funding is cut off. Third, an optimistic scenario to represent the sustained market growth throughout the simulation duration.
To this end, we conducted a sensitivity analysis with only the parameters that the model is behaviorally sensitive to (see Table 2) for a total of 50 runs. From these runs, we selected the set of parameter values that produced the appropriate behavior mode for each of the scenarios. These values are reported in Table 4.
The set of parameter values for the pessimistic scenario results in a condition where there is a low level of resources flowing in the market subsystem. With a relatively lower RER size, the External Engine loop (R14) has a weaker reinforcing effect in the pessimistic scenario as compared to the other two. The weight of entrepreneurial activity modulates the level of market infrastructure development. A higher weight implies that infrastructure development is more dependent on the level of entrepreneurial activity in the system than the volume of resources available for market formation. Not only is there a low level of resources to begin with, but the market infrastructure development is also not as reactive to those resources in the pessimistic scenario. On the other end, in the optimistic scenario there are ample of resources in the system for market formation. A relatively lower weight on entrepreneurial activity further implies that market development is stimulated by the resources available. The realistic scenario represents a more likely median between the two extremes.

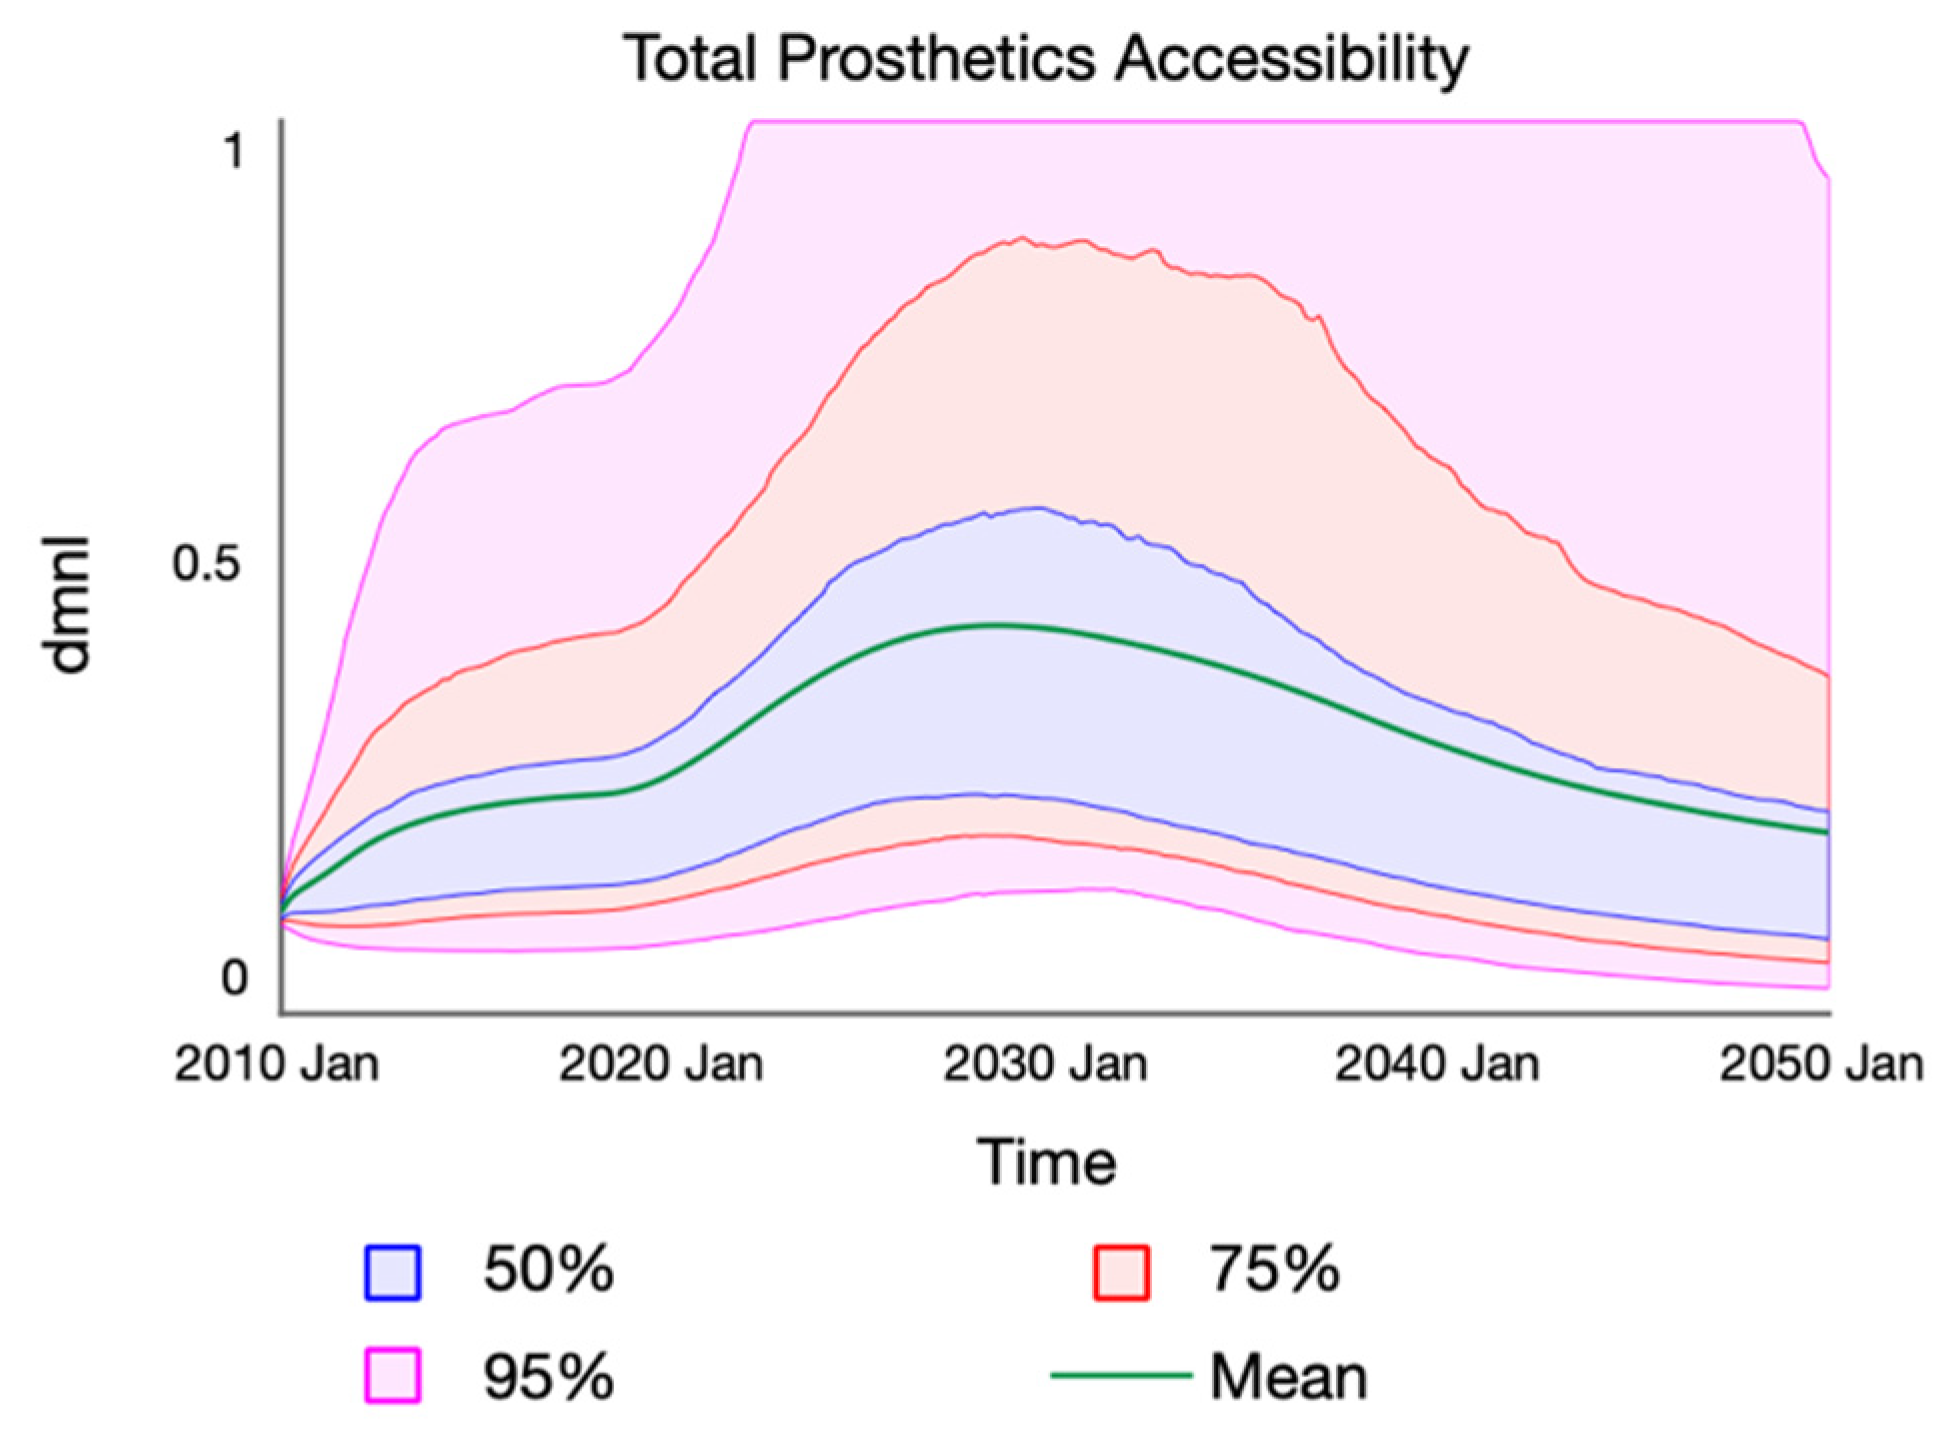
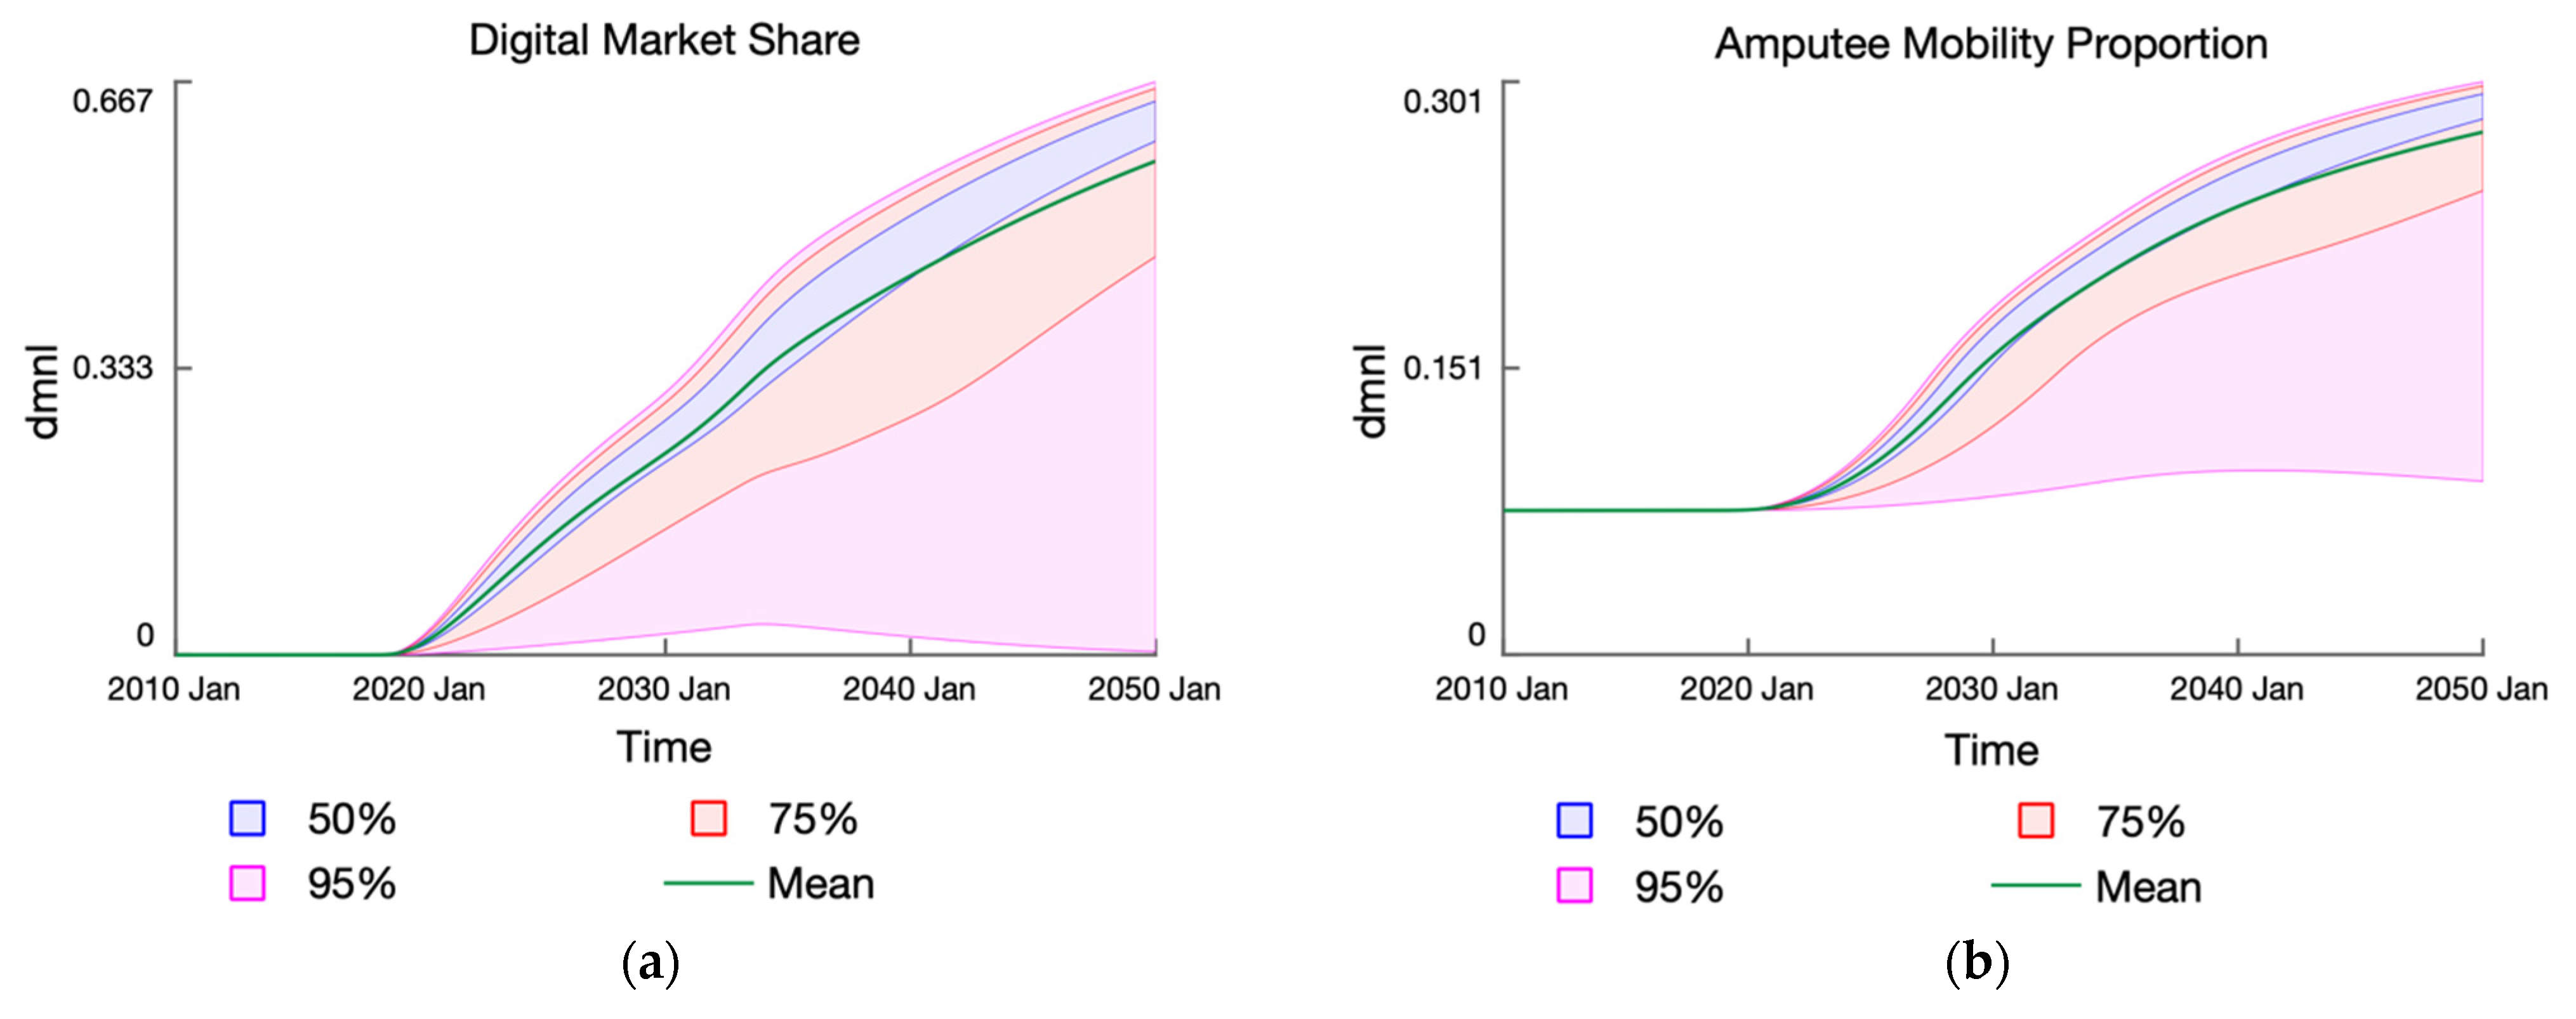
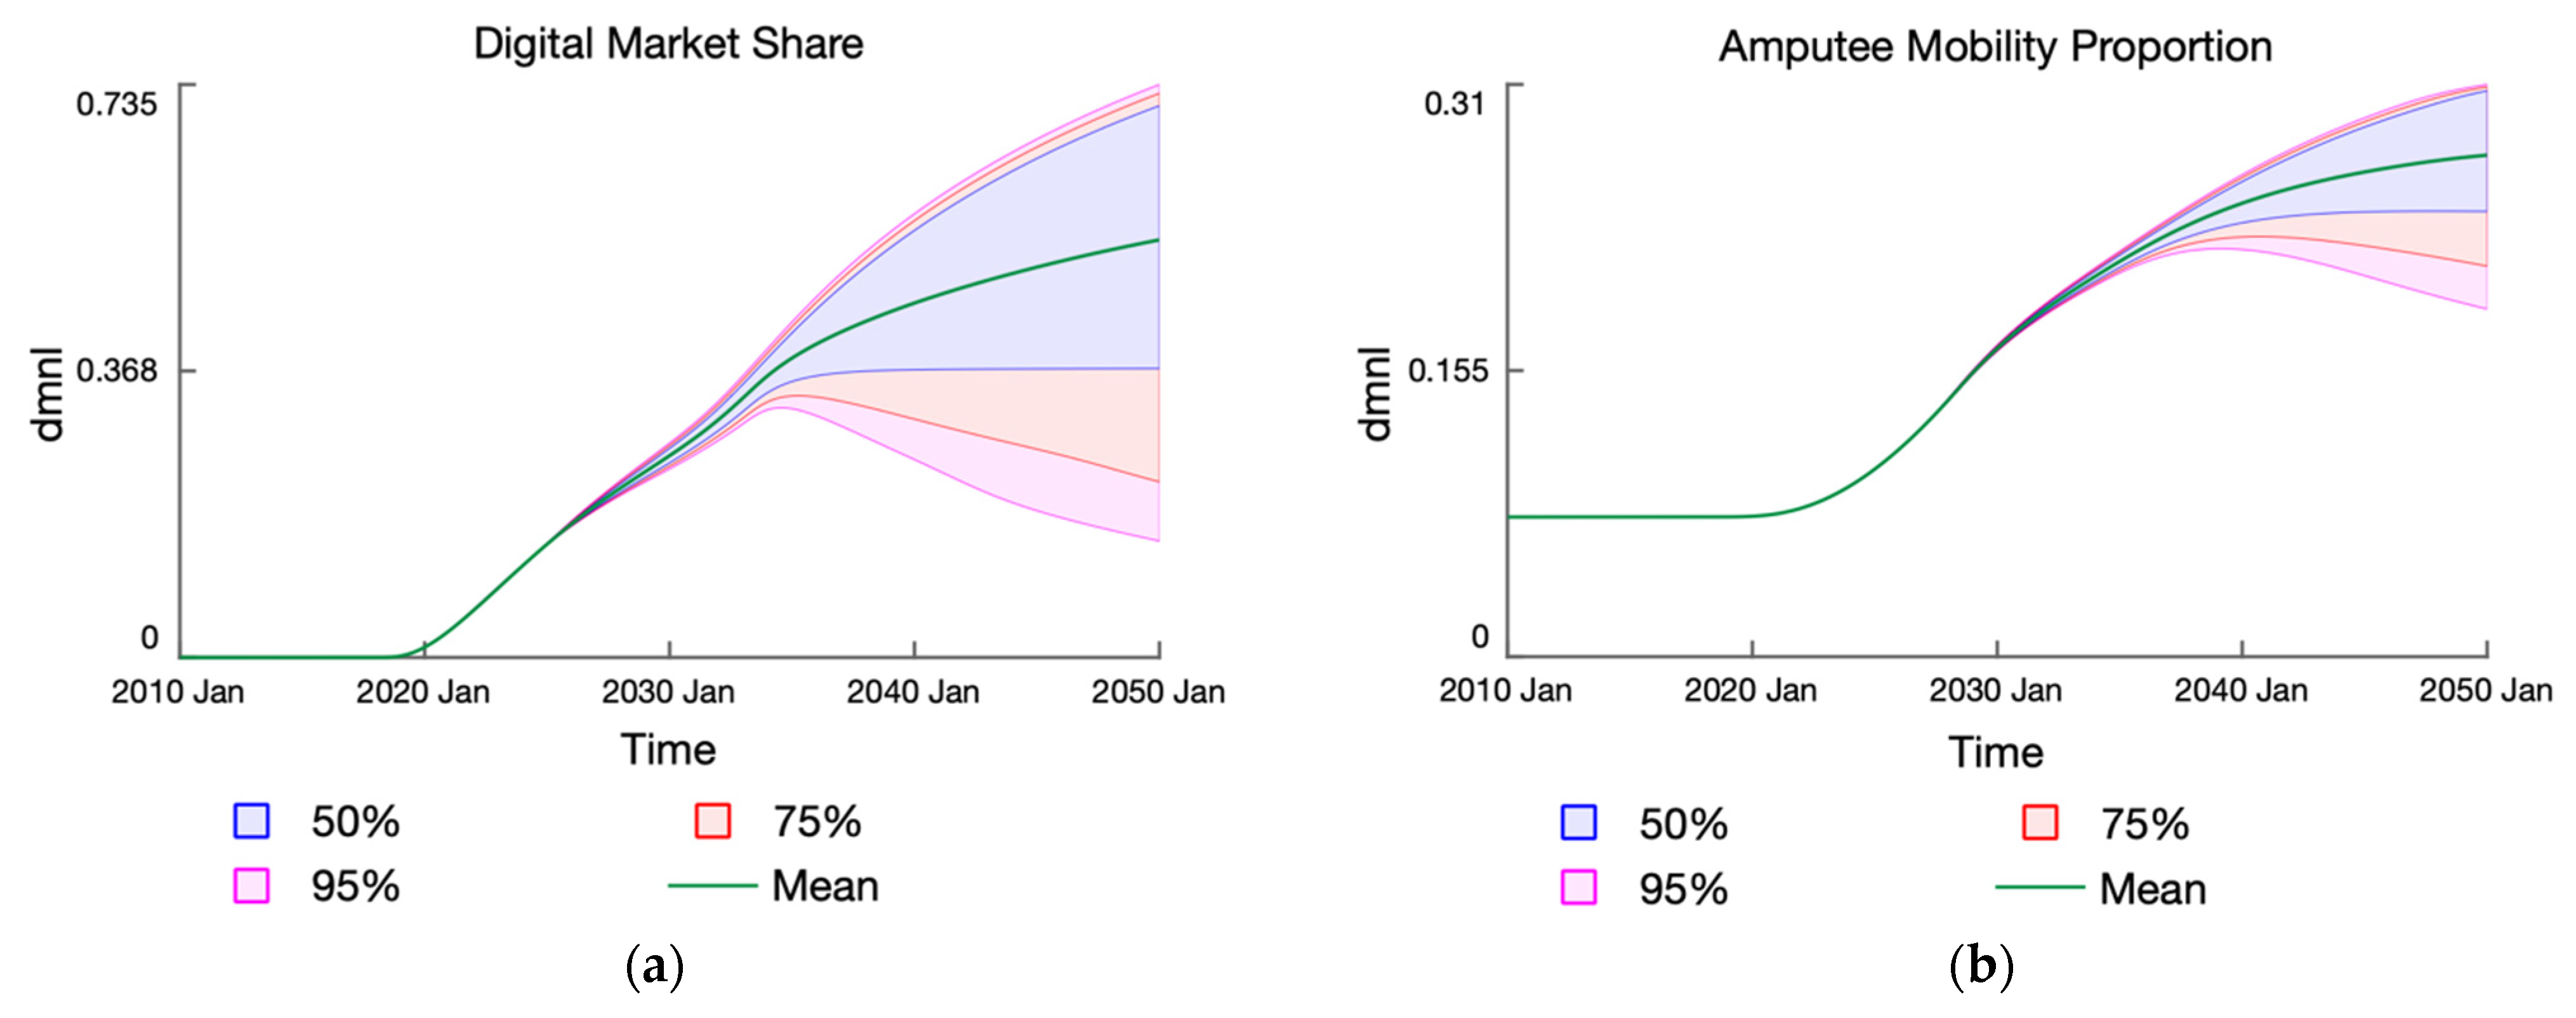
3.6. Scenario Results

We reproduced the three behavior patterns representing the varied conditions for digital prosthetics market growth (see Figure 7a). Under pessimistic market growth conditions, the market share of digital prosthetics growths to a maximum of about 5% before declining to 0.5% by 2050. Under the realistic scenario, the digital market share increases to 36% in 2033 and thereafter increases gradually to 43% by 2050. Whereas digital prosthetics experiences sustained growth in the optimistic scenario, capturing 80% of the market share by 2050.
Based on these three hypothetical market growth scenarios, we can observe the relative impact on the amputee mobility outcome in Figure 7b. In general, the mobility proportion follows the same behavioral pattern as the digital market share. The proportion increases as market share increases and vice versa. The gap between the realistic and optimistic scenarios for amputee mobility is disproportionately smaller than the gap for the digital prosthetics market share. This is due to the dampening effect of the Access Constraint loops (B2, B3 and B4) as explained before. Amputee mobility is being constrained by the fitting capacity that is unable to meet the demand. By further expanding digital fitting capacity, we can strengthen the effect of the Market Access loops (R5 and R6) to better counteract the constraint loops. In this sense, we can anticipate an even higher mobility proportion in the optimistic scenario than the 32% mobility observed in Figure 7b.
As for the health-related economic indicators, we can now graphically represent the net benefit of digital prosthetics service provision compared to the baseline behavior (Figure 8a). In all three scenarios, the introduction of digital prosthetics results in a positive net benefit. A 0.5% digital market share in 2050 still yields a net benefit of USD5 M per month in the pessimistic scenario. This figure is USD41 M and USD53 M for the realistic and optimistic scenario, respectively. Moreover, we can compare the scale of the net benefit to that of the additional prosthesis reimbursement (Figure 8b). The additional reimbursement is the difference between the total costs for prosthesis services and the baseline costs. In contexts where prosthetics services are covered by national health care systems, digital market growth increases the total costs borne by the state in terms of insurance reimbursements as the volume fittings increases over time. Nevertheless, additional costs incurred in that instance is far outweighed by the net benefit accrued—on average by a factor of 15 across all scenarios.

4. Discussion

In summary, our simulation model allows exploring the range of mobility outcomes for the amputee population given different market growth conditions for digital prosthetics. We observed in all experimental scenarios that an increase in digital prosthetics market share was associated with improved mobility outcomes. Specifically, there was an increase in the mobility proportion, an increase in total economic productivity, a decrease in total economic costs and an overall positive net benefit from digital prosthetics even under pessimistic conditions. Our model could, thus, serve as a tool for health policy planners to explore a shift in prosthetics service provision to better mitigate the accessibility problem and bolster the social impact of prosthesis usage.
Furthermore, our model contributes to the growing body of public health modeling literature within the system dynamics field. To the best of our knowledge, this model is the first application of simulation modeling to the domain of amputee patient-care continuum and prosthetics service provision. Our work builds on and integrates elements of existing SD models on TIS and medical technologies diffusion and adoption [32,33,36], which we have adapted to anticipate the growth of the emerging digital prosthetics. In doing so, our model presents an internally consistent theory of the complex interactions between the health care system and the market formation subsystem and provides a feedback-rich explanation for the dynamics of prosthetics service provision and amputee mobility.

4.1. Strategic Insights

The main insights from our work can be summarized as follows:
  • While the External Engine loop provides the initial fuel for the various endogenous market formation processes, the System Legitimacy loop ultimately determines the trajectory of market growth for digital prosthetics. This loop generates internal resources from the market to sustain the growth in entrepreneurial activities, market infrastructure, perceived legitimacy of digital prosthetics, and its market size.
  • The Digital Growth loops and Prosthesis Attractive loops are the key drivers for improving prosthetic accessibility and enabling mobility. With a higher market share of digital prosthetics, more amputees can receive prosthetics services and are incentivized to remain in or re-adopt prosthetics care.
  • The Market Access loops are particularly important for driving the expansion of prosthetics clinics and service capacity, thus improving prosthetics accessibility over time. The strength of this loop determines the extent of the counteracting effect on the Access Constraint loops, which limits the mobility proportion.
  • To best ensure the sustainability of the digital prosthetics market over the longer term, investment is needed in this emerging technological system to garner sufficient resources and momentum for sustained market growth. As seen in the sensitivity analyses, the model is behaviorally sensitive to parameters related to the internal and external resources in the market subsystem. High-leverage policies would thus seek to influence the resource flows in the system.
  • Investments in digital prosthetics could improve accessibility and ameliorate the underuse of prosthesis amongst amputees, which enables mobility. Importantly, this results in a positive net benefit for society in terms of higher economic productivity and reduced economic costs.
  • Besides the economic value of individuals, improving mobility appears to improve health, also preventing more amputee deaths over time.
  • To maximize the impact on the mobility outcomes and net benefit of prosthetics services, policy planning must ensure that service capacity is expanded to meet fitting demand. The scenario analysis revealed that prosthetics accessibility is limited by service capacity even under optimistic market growth conditions. Policy planners should be cognizant of the effect of Prosthesis Lifecycle loop, which drives the pressure on fitting demand as the mobility outcomes improve over time.

4.2. Limitations and Further Research

The main limitation of the top-level health care system pertains to modelling individual predispositions or decision points. Specifically, the propensity to dropout from the fitting process or readopt a prosthesis. They remain as simplifications (estimated average fractional rates) that could benefit from further work. Such predispositions are not simply functions of attractiveness, but also dependent on a broad array of individual factors, including mental health state, level of social support, and occurrence of limb pain [69]. In addition, we have excluded individual factors related to quality of life for amputees [70]—which is particularly difficult to operationalize without the involvement of amputees in the model building process. Including groups of amputees, through Group Model Building [71], could be a potent avenue for further research in this field. This could lead to a more robust model boundary that includes individual predispositions as well as quality of life measures.
The partially conceptual nature of the model further precludes it from generating numerically accurate estimates of indicators. Though numerical estimation is beyond the scope of this paper, further modelling work could be carried out to improve the model’s ability to do so. Here, a much larger research scope is required to empirically study the digital prosthetics market growth that should involve robust data collection for parameterization. Additionally, the boundary of the subsystem could be expanded to include fitting capacity adjustment structures that are more responsive to market dynamics (demand, supply, profits, etc.).
Nevertheless, our model in its current iteration provides a structural explanation for digital prosthetics growth and reasonable projected developments under different conditions. It further generates qualitatively and directionally indicative results of digital prosthetics’ impact on key amputee mobility and health-related socio-economic outcomes. The strategic insights from our findings could further provide decision support for health policy planning. To that end, further work should expand on these insights in a more accessible language for relevant decision makers.

Supplementary Materials

The following supporting information can be downloaded at: https://www.mdpi.com/article/10.3390/systems11010022/s1, File S1: Model Documentation.

Author Contributions

Conceptualization, J.K.R., W.C., C.J.H., P.G. and B.K.; methodology, J.K.R.; validation, J.K.R., W.C., C.J.H., P.G. and B.K.; formal analysis, J.K.R.; investigation, J.K.R.; data curation, J.K.R.; writing—original draft preparation, J.K.R.; writing—review and editing, J.K.R., W.C., C.J.H., P.G. and B.K.; visualization, J.K.R.; supervision, P.G. and B.K.; project administration, J.K.R. All authors have read and agreed to the published version of the manuscript.

Funding

This research received no external funding.

Data Availability Statement

Data is contained within the article or Supplementary Material.

Acknowledgments

The authors would like to thank Christina Gkini, Claudiu Eduard Nedelciu, and Derek Chan for their review of earlier iterations of this work.

Conflicts of Interest

The third author, C.J.H., is the chief technology officer (CTO) of ProsFit Technologies with a vested interest in digital prosthetics service provision. Nevertheless, research independence of the primary researcher (J.K.R.) has been codified in the collaboration agreement and no compensation is provided for this research. C.J.H. had no input in the formal analysis and conclusions drawn from the simulation results.

Appendix A. Feedback Loop Descriptions

Here, we present the detailed feedback loop descriptions extracted from an earlier version of this work [30]. Each description includes the causal pathway of the feedback loop. The arrow symbol (à) represents a causal link between two variables. (+) indicates a positive polarity, while (–) indicates a negative polarity. Polarities simply indicate the directionality of the correlation. For instance, “A à(–) B à(+) C” should be interpreted as such: when A increases, B decreases, and in turn C decreases. Here, the positive polarity between B and C indicates that both vary in the same direction.
Prevention Pressure (B1): PAD Amputation à(+) PAD Prevention Programs à(–) PAD Incidence à(+) PAD Population
                                             à(+) PAD Amputation
This balancing feedback loop represents the prevention pressure faced by public health agencies to address the prevalence of PAD. As PAD-related amputation rates increases over time, we expect reporting from medical professionals to raise the alarms for stepping up efforts towards primary prevention. This is observed, for instance, in trend studies of PAD incidence and risk factors, calling for better detection and prevention interventions [57,58]. With increased reporting, we can expect more resources directed towards prevention interventions such as screening, smoking cessation, nutritional and activity programs [57]. In the long run, such interventions could lead to a decrease in PAD incidence rate. Indeed, there is evidence that PAD incidence have declined in the UK, which have been attributed to the uptake of prevention strategies [58]. A declining PAD incidence would lead to a reduction of the PAD Population over time, which would eventually decrease the PAD Amputation Rate. Since an initial increase in amputation rate ends up with an eventual decrease in amputation rate, this feedback loop has a negative polarity overall and is thus described as a balancing loop.
Prosthesis Lifecycle (R1): Amputees in Prosthetic Care à(+) Successful Fitting à(+) Full Mobility à(+) Prosthesis
     Degradation à(+) Awaiting Replacement à(+) Prosthesis Replacement à(+) Amputees in Prosthetic Care
This loop describes the lifecycle that is part of the lifelong holistic care for amputees successfully fitted with a prosthesis [59]. As more amputees enter the prosthetic care continuum from the primary care sector, there will be more people who are successfully fitted with a prosthesis thus increasing the number of amputees with full mobility. However, the prosthesis device has an average lifespan of three years [16,59]. Hence, over time, prosthesis degradation increases the number of amputees awaiting replacement of their devices before re-entering the prosthetic care continuum to be fitted for a new device again. In this regard, this loop represents a growing pressure emanating from our best efforts to successfully fit individuals with a prosthesis. While this closed aging chain engenders a reinforcing mechanism, that transitions amputees through different stages of prosthetic care, it does not endogenously accumulate the stocks without an exogenous inflow to the Amputees in Prosthetics Care stock. As more amputees enter the prosthetics fitting stage from elsewhere, the more the other stocks in this aging chain get filled.
Prosthetics Re-entry (R2): Amputees in Prosthetic Care à(+) Abandon Prosthesis à(+) Limited Mobility à(+) Readopt
                                  Prosthesis à(+) Amputees in Prosthetic Care
R2 represents the Prosthetic Care Re-entry process for amputees. Not all amputees who enter the care continuum end up with a prosthesis; some individuals dropout from the fitting process or some abandon the device due to an unsuccessful fit [16,60]. Hence, with more people in the continuum abandoning prosthesis, there will be more people who are left with limited mobility due to the lack of a prosthesis device. However, more amputees might later decide to readopt a prosthesis, thus re-entering the prosthesis fitting process. Similarly, the reinforcing effect of this loop is dependent on an exogenous inflow of amputees entering the closed aging chain.
Digital Growth (R3): Amputees in Digital Prosthetic Care à(+) Successful Fitting à(+) Perceived Relative Success of
 Digital Fitting à(+) Digital Market Size à(+) Digital Market Share à(+) Digital Prosthesis Referral à(+) Amputees in
                                           Digital Prosthetic Care
R3 is a reinforcing loop that represents the hypothesis for the market growth of digital prosthetics. As more amputees get referred to a digital prosthetic clinic and more people become successfully fitted with a prosthesis with better outcomes, we expect favorable word-of-mouth diffusion about the success of digital prosthesis [61]. This is captured with the Perceived Relative Success of Digital Fitting, which represents the mental perceptions of people’s comparison of success between the digitally fitted prosthesis and traditional plaster-casted device. Over time, we expect the attractiveness of digital fitting to grow the digital market size and thus the market share of the digital prosthetics relative to traditional. With a higher market share, more amputees are probabilistically to be referred to a digital prosthetist and thus driving up the number of amputees in the digital prosthetic care continuum as opposed to the traditional one.
  Digital Growth (R4): Amputees in Digital Prosthetic Care à(+) Successful Fitting à(+) Perceived Relative Success of
Digital Fitting à(+) Digital Market Size à(+) Digital Market Share à(+) Digital Prosthesis Readoption à(+) Amputees in
                                           Digital Prosthetic Care
Similarly, the R4 loop drives up the number of amputees in Digital Prosthetic Care by way of readoption. As the digital market share increases, potential re-adoptees looking to restart their prosthetic fitting journey are more likely to seek out a digital prosthetist. The assumption here is that as digital fittings experience more success, people are more likely to be motivated to try the digital process and experience a similar success as others [61,62]. Thus, more re-adoptees enter the digital prosthetic care continuum as opposed to the traditional one.
Access Constraint—B2, B3 and B4 Loops
Access Constraint (B2): Amputees in Prosthetic Care à(+) Fitting Demand à(–) Prosthetic Accessibility à(+) Prosthesis
                                    Referral à(+) Amputees in Prosthetic Care
The balancing feedback loop B2 counteracts the reinforcing Digital Growth loops. As more Amputees in Prosthetic Care are attracted to the digital prosthesis fitting process, the Fitting Demand for digital prosthesis increases. In turn, this limits availability of resources and limits Prosthetic Accessibility if demand outweighs the fitting capacity, which then reduces the amount of people who can enter the prosthesis fitting process. Hence, the Amputees in Prosthetic Care declines to a level lower than it otherwise would have been. Through this balancing feedback, B2 dampens the strength of the R3 and R4 loops.
Access Constraint (B3): Prosthesis Readoption à(+) Subtotal Re-adoptees à(+) Fitting Demand à(–) Prosthetic
                                 Accessibility à(+) Prosthesis Readoption
Access Constraint (B4): Amputees Awaiting Replacement à(+) Fitting Demand à(–) Prosthetic Accessibility à(+)
                         Prosthesis Replacement à(+) Amputees Awaiting Replacement
Fitting Demand is not solely determined by the number of Amputees in Prosthetic Care. Amputees who have previously abandoned the fitting process and those seeking to replace their degraded prosthesis device also make up the demand. Hence, B3 captures a similar mechanism whereby more Prosthesis Readoption brings up the demand and consequently reduces the Prosthetic Accessibility. B4, on the other hand, reduces the Accessibility through the Prosthesis Replacement process. All three balancing loops work in concert to counteract the reinforcing loops seeking to increase the demand for digital prosthesis fitting.
Market Access (R5): Amputees in Prosthetic Care à(+) Successful Fitting à(+) Perceived Relative Success of Digital
     Fitting à(+) Digital Market Size à(+) Fitting Capacity à(+) Prosthetic Accessibility à(+) Prosthesis Referral à(+)
                                          Amputees in Prosthetic Care
The Market Access loops, however, interplay with the balancing Access Constraint loops described above. In the longer term, these loops work to increase the Fitting Capacity so as to improve the Prosthetic Accessibility that was driven down by increased demand. With reference to R5 loop, when more Amputees in Prosthetic Care get successfully fitted with the prosthesis and the perceived success of digital prosthesis relative to traditional increases, the digital market share grows. The growth in market share is likely to lead to the expansion of digital prosthetic clinics, which in turn drives up the Fitting Capacity. Hence, with more capacity, more people have access to prosthetic services, and thus the care continuum can accommodate a larger number of new amputees seeking a prosthesis.
Market Access (R6): Amputees in Prosthetic Care à(+) Successful Fitting à(+) Perceived Relative Success of Digital
     Fitting à(+) Digital Market Size à(+) Fitting Capacity à(+) Prosthetic Accessibility à(+) Readopt Prosthesis à(+)
                                           Amputees in Prosthetic Care
Market Access (R7): Amputees in Prosthetic Care à(+) Successful Fitting à(+) Perceived Relative Success of Digital
   Fitting à(+) Digital Market Size à(+) Fitting Capacity à(+) Prosthetic Accessibility à(+) Prosthesis Replacement à(+)
                                         Amputees in Prosthetic Care
Likewise, R6 enables a larger number of people seeking to readopt the prosthesis fitting process to enter the Prosthetic Care, whereas R7 enables more people waiting to replace their old prosthesis to re-enter the care continuum at any one point in time. However, it must be noted that increasing capacity involves a delay as it takes time to assess the market and set up new clinics. Hence, the effects of Market Access loops are delayed.
Prosthesis Attractiveness (R8): Amputees in Prosthetic Care à(+) Successful Fitting à(+) Perceived Relative Success of
            Digital Fitting à(–) Dropout Rate à(+) Abandon Prosthesis à(–) Amputees in Prosthetic Care
Prosthesis Attractiveness (R9): Amputees in Prosthetic Care à(+) Successful Fitting à(+) Perceived Relative Success of
           Digital Fitting à(+) Re-adoption Rate à(+) Readopt Prosthesis à(+) Amputees in Prosthetic Care
As previously described, when people perceive digital prosthesis to be more successful than traditional ones, the attractiveness of digital prosthesis is expected to increase through word-of-mouth diffusion. However, a negative experience with the new technology would reduce the consideration and available market. [61]. Hence, R8 captures the process by which a higher attractiveness translates to a lower dropout rate as individuals might be more motivated to see through the process and experience a similar success as others. This could lead to fewer people abandoning the prosthesis fitting process and therefore increasing the number of Amputees in Prosthetic Care to a level higher than it otherwise would have been. Concurrently, R9, works to increase the re-adoption rate amongst those who have previously abandoned the process. The higher attractiveness of digital fitting would then increase the number of people readopting a prosthesis and thus re-entering the prosthetic care continuum.
Prosthesis Abandonment (B5): Amputees in Prosthetic Care à(+) Successful Fitting à(+) Perceived Relative Success of
     Digital Fitting à(–) Dropout Rate à(+) Abandon Prosthesis à(+) Limited Mobility à(+) Readopt Prosthesis à(+)
                                          Amputees in Prosthetic Care
This balancing feedback loop counteracts the effects of R2 and R9, by draining the number of people available for entering readoption process. When more amputees enter the digital prosthetics care stage, more individuals are fitted with a digital prosthesis. As a result, the perceived attractiveness of digital prosthetics increases. Amputees are therefore less likely to dropout from digital prosthetics fitting. In turn, the Limited Mobility stock does not accumulate as much as it otherwise would have. This takes away the effect of R2 and R9 since fewer amputees are available for the re-adoption process. Regardless, this is a constructive effect that reduces rates of prosthesis abandonment and yields better overall mobility outcomes.
Technology Development (R10): Innovation Developed à(+) Guidance of Search à(+) Resources to R&D à(+) Innovation
                                   Development à(+) Innovation Developed
This feedback loop represents the process of technological knowledge development, typical of research and development (R&D), required for any TIS to grow [35,63]. As more innovation is developed, the Guidance of Search for the technology increases. Guidance of search refers to the “visibility and clarity” of the state of the art [35] (p. 423) that reflects the “promises and expectations of the emerging technology” [63] (p. 56). It helps in the priority-setting process for R&D resource allocation and “thus the direction of technological change” [35] (p. 423). Hence, in this context, increased Guidance of Search for the digital solutions in prosthetic fittings, would help increase the Resources to R&D, which would enable further Innovation Development that increases the Innovation Developed even more [62].
Knowledge Diffusion (R11): Knowledge Diffused à(+) Guidance of Search à(+) Resources to R&D à(+) Knowledge
                                    Diffusion à(+) Knowledge Diffused
Knowledge Diffusion, R11 loop, refers to process by which various actors in the TIS interact and exchange knowledge and thus establish “a mutual understanding” that enables institutions to gradually adjust to new technologies [63] (p. 55). Since Guidance of Search is also “an interactive and cumulative process of exchanging ideas” [35] (p. 423), it increases with more Knowledge Diffused [36]. In turn, this works to increase the Resources to R&D, which further enables more Knowledge Diffusion.
Knowledge Erosion (B6): Knowledge Diffused à(+) Guidance of Search à(+) Resources to R&D à(+) Innovation Development
                                    à(+) Knowledge Decay à(–) Knowledge Diffused
B6 loop represents the process of Knowledge Erosion, which counteracts R11. Knowledge Diffused can become “obsolete over time (due to new technological developments, etc.)” [38] (p. 4). When knowledge diffusion increases guidance of search, and thus secures more resources for R&D to further develop innovation, previously diffused knowledge become outdated, and thus increases the Knowledge Decay. In turn, this drains the body of Knowledge Diffused.
Innovation Attractiveness (R12): Innovation Developed à(+) Perceived Legitimacy à(+) Entrepreneurial Activity à(+)
      External Funding à(+) Total Resources à(+) Resources to R&D à(+) Innovation Development à(+) Innovation
                                                  Developed
According to Hekkert et al. [35] and Surrs [63], entrepreneurs are central to any TIS. Entrepreneurs refer to actors within the system whose “actions are directed at conducting market-oriented experiments with an emerging technology” [63] (p. 54). The Innovation Attractiveness loop represents the process of attracting new entrepreneurs to the system through innovation. When the Innovation Developed increases, technological legitimacy of the innovation system increases [36]. As potential entrants perceive the legitimacy of the emerging technology positively, they are more willing to enter the market, thus increasing the Entrepreneurial Activity. Entrepreneurial activities indicate the health and sustainability of an innovation system [35]. Higher levels of Entrepreneurial Activity thus increase the Total Resources in the system by way of attracting more External Funding or resources from private or public actors [36,63]. In turn, more resources become available for R & D, which spurs further development of innovation that increases the attractiveness to entrepreneurs even more.
Knowledge Attractiveness (R13): Knowledge Diffused à(+) Perceived Legitimacy à(+) Entrepreneurial Activity à(+)
  External Funding à(+) Total Resources à(+) Resources to R&D à(+) Knowledge Diffusion à(+) Knowledge Diffused
R13 loop works in a similar mechanism in attracting entrepreneurs. Technological legitimacy is a function of both Innovation Developed and Knowledge Diffused. The more knowledge about the technological innovation diffused in various networks, the higher the perceived legitimacy of the technology. Loops R12 and R13, thus, work concurrently and in concert to shore up the attractiveness of the emerging technology to potential market actors.
External Engine (R14): Entrepreneurial Activity à(+) External Funding à(+) Total Resources à(+) Resources to Market
                                  Development à(+) Entrepreneurial Activity
The External Engine loop represents the effect of external funding in reinforcing the growth of entrepreneurial activity within the emerging market. As explained previously, Entrepreneurial Activity can build confidence in the prospect of investment, thus increasing funding and resources from external actors, either private funders or governmental bodies. This increases the Total Resources available for market development. External backing reduces the perceived entrepreneurial risks involved, and consequently is better able to attract further entry into the market to spur even more Entrepreneurial Activity [36,63].
Internal Engine (R15): Entrepreneurial Activity à(+) Market Infrastructure à(+) Market Size à(+) Internal Resources
      from Market à(+) Total Resources à(+) Resources to Market Development à(+) Entrepreneurial Activity
While the external engine stimulates entrepreneurial activity temporarily, the Internal Engine endogenously generates internal (“financial, material, human capital”) resources over the longer term through market formation to become self-sufficient [63] (p. 57). With reference to R15, increased Entrepreneurial Activity leads to the development of Market Infrastructure [39]. Entrepreneurs contribute to the “development of formal market rules, establishment of intermediary networks, the building of infrastructure, or the development of formal regulations” [38] (p. 1837). Through establishing the Market Infrastructure for market formation, entrepreneurial activity “contribute to the creation of a demand for the emerging technology” [63] (p. 56). This increases the Market Size for the technology that generates Internal Resources from the Market. In turn, with more Total Resources in the innovation system, Entrepreneurial Activity can further flourish by attracting more entrants to the system.
System Building (R16): Perceived Legitimacy à(+) Entrepreneurial Activity à(+) Market Infrastructure à(+) Perceived
                                                    Legitimacy
Previously, we discussed how innovation diffusion increases the technological legitimacy of the emerging technology. Here, we consider market legitimacy, which stems from established market structures [36]. When market infrastructure is developed, it reduces market formation uncertainty and the perceived cost to participation [39]. With reference to R16, as the Perceived Legitimacy of the emerging technology increases, more entrepreneurs are willing to overcome perceived risks and enter the market. Consequently, the development of Market Infrastructure increases with the growth of Entrepreneurial Activity. This feeds back into increasing the market legitimacy of the emerging technology.
System Legitimacy (R17): Entrepreneurial Activity à(+) Market Size à(+) Internal Resources from Market à(+) Total
                Resources à(+) Resources to Market Development à(+) Market Infrastructure à(+)
                             Perceived Legitimacy à(+) Entrepreneurial Activity
The System Legitimacy loop, R17, encompasses the aforementioned smaller loops R15 and R16, and “constitutes the most powerful self-reinforcing loop, potentially able to drive the whole system” [36] (p. 1838). Following the previous explanations provided for the individual links between variables, we observe that when Entrepreneurial Activity increases Market Size through market formation, Internal Resources from the Market burgeon and increase the Total Resources. This translates to more Resources for Market Development, which enables further development of Market Infrastructure. Consequently, the market legitimacy of the technological innovation flourishes, and thus begets even more Entrepreneurial Activity.
Resistance (R18): Regime Resistance à(–) Perceived Legitimacy à(+) Entrepreneurial Activity à(+) Market
                               Infrastructure à(–) Regime Resistance
Market formation of a new technology is bound to precipitate “resistance from actors with interests in the incumbent” regime [63] (p. 57). This Resistance is captured in R18. Regime Resistance decreases the market legitimacy of the emerging technology, for instance “when regime actors try to influence public discourses, or lobby against favourablefavorable support” [36] (p. 1837). In turn, entrepreneurs might be less willing to enter the market due to higher perceived risks, thus reducing the Entrepreneurial Activity to a lower level than it otherwise would have been. In turn, there will be less Market Infrastructure development to counter Regime Resistance, which further emboldens resistance given the inverse relationship. The underlying mechanism for the negative link is supported by the fact that market infrastructure enables the system “to become less dependent on external dynamics and counter-balance regime-resistance” [36] (p. 1838). Importantly, R18 could work in a virtuous or vicious manner, depending on whosever perspective, either working to reinforce more resistance or reduce it.
Sailing Ship (B7): Perceived Legitimacy à(+) Entrepreneurial Activity à(+) Market Infrastructure à(+) Market Size à(+)
                       Sailing Ship Effect à(+) Regime Resistance à(–) Perceived Legitimacy
As the emerging market grows and competes with the incumbent regime, resistance could also come in the form of innovation. Given the new threat, regime actors would “increase their efforts to improve the performance of the existing regime through innovation” [36] (p.1838). This “response aimed at improving the incumbent technology” is referred to as the sailing-ship effect [64,65] (p. 593). The Sailing Ship effect is thus represented in the balancing loop, B7. When the Perceived Legitimacy of the emerging technology increases, which attracts more entrepreneurial activity and thus market formation, the Sailing Ship Effect increases. This contributes to a stronger Regime Resistance, which consequently reduces the Perceived Legitimacy of the emerging technology. This loop thus seeks to counteract the effect of the System Legitimacy loop, R17.
In the top-level health care system, we assumed that the Perceived Relative Success of Digital Fitting will lead to an increase in Digital Market Size, thus masking the underlying structure between that link. Here, we consider the conceptual model in the Market Formation subsystem that could possibly explain how exactly the two variables are linked. Since R3 and R4 share a similar pathway in the subsystem, we only comment on R3.
Digital Growth (R3): Amputees in Digital Prosthetic Care à(+) Successful Fitting à(+) Perceived Relative Success of
     Digital Fitting à(+) Digital Fitting Reputation à(+) Perceived Legitimacy à(+) Entrepreneurial Activity à(+) Market
    Infrastructure à(+) Digital Market Size à(+) Digital Market Share à(+) Digital Prosthesis Referral à(+) Amputees in
                                           Digital Prosthetic Care
When the perceived relative success of digital fittings increases, we expect the emerging digital technology for prosthesis fitting to start amassing a reputation. This formed reputation improves technological legitimacy, which would attract more Entrepreneurial Activity to the emerging technological innovation system. Hence, the System Legitimacy loop works to increase the Market Infrastructure as well as Market Size for digital prosthetics. Consequently, the Digital Market Share rises to compete with the traditional prosthetics industry. The Digital Growth loops and the System Legitimacy loop thus work in tandem to increase the number of Amputees in Digital Prosthetic Care.
Market Access (R5): Amputees in Prosthetic Care à(+) Successful Fitting à(+) Perceived Relative Success of Digital
       Fitting à(+) Digital Fitting Reputation à(+) Perceived Legitimacy à(+) Entrepreneurial Activity à(+) Market
Infrastructure à(+) Digital Market Size à(+) Prosthetic Clinics à(+) Fitting Capacity à(+) Prosthetic Accessibility à(+)
                             Prosthesis Referral à(+) Amputees in Prosthetic Care
Similarly, we expect the interaction of the Market Access loops and the System Legitimacy loop. As Digital Fitting Reputation forms over time and builds the Digital Market Size, through the same pathway described above, we expect the expansion of digital prosthetic clinics that increases the Fitting Capacity. This improves the Market Access in the digital prosthetic continuum, which enables more people to be fitted with a prosthesis and improves the overall mobility outcomes.

Appendix B. Sensitivity Analysis Results

Figure A1. Confidence plots of (a) digital prosthetics market share and (b) amputee mobility proportion sensitivity to variations in Relative External Resources Size (range: 1–9).
Systems 11 00022 g0a1
Figure A2. Confidence plots of (a) digital prosthetics market share and (b) amputee mobility proportion sensitivity to variations in Market Size Threshold (range: 0.025–0.075).
Systems 11 00022 g0a2
Figure A3. Confidence plots of (a) digital prosthetics market share and (b) amputee mobility proportion sensitivity to variations in Sensitivity of Resources to Market Size (range: 0.5–1.5).
Systems 11 00022 g0a3
Figure A4. Confidence plots of (a) digital prosthetics market share and (b) amputee mobility proportion sensitivity to variations in Weight of Entrepreneurial Activity (range: 0.25–0.75).
Systems 11 00022 g0a4

References

  1. World Health Organization. WHO Standards for Prosthetics and Orthotics: Part 1; World Health Organization: Geneva, Switzerland, 2017. [Google Scholar]
  2. Moxey, P.W.; Gogalniceanu, P.; Hinchliffe, R.J.; Loftus, I.M.; Jones, K.J.; Thompson, M.M.; Holt, P.J. Lower Extremity Amputations—A Review of Global Variability in Incidence: Lower Extremity Amputations-a Global Review. Diabet. Med. 2011, 28, 1144–1153. [Google Scholar] [CrossRef] [PubMed]
  3. Ahmad, N.; Thomas, G.N.; Gill, P.; Torella, F. The Prevalence of Major Lower Limb Amputation in the Diabetic and Non-Diabetic Population of England 2003–2013. Diabetes Vasc. Dis. Res. 2016, 13, 348–353. [Google Scholar] [CrossRef] [PubMed]
  4. Geertzen, J.; van der Linde, H.; Rosenbrand, K.; Conradi, M.; Deckers, J.; Koning, J.; Rietman, H.S.; van der Schaaf, D.; van der Ploeg, R.; Schapendonk, J.; et al. Dutch Evidence-Based Guidelines for Amputation and Prosthetics of the Lower Extremity: Amputation Surgery and Postoperative Management. Part 1. Prosthet. Orthot. Int. 2015, 39, 351–360. [Google Scholar] [CrossRef] [PubMed]
  5. Kohler, F.; Cieza, A.; Stucki, G.; Geertzen, J.; Burger, H.; Dillon, M.P.; Schiappacasse, C.; Esquenazi, A.; Kistenberg, R.S.; Kostanjsek, N. Developing Core Sets for Persons Following Amputation Based on the International Classification of Functioning, Disability and Health as a Way to Specify Functioning. Prosthet. Orthot. Int. 2009, 33, 117–129. [Google Scholar] [CrossRef] [PubMed] [Green Version]
  6. Criqui, M.H.; Aboyans, V. Epidemiology of Peripheral Artery Disease. Circ. Res. 2015, 116, 1509–1526. [Google Scholar] [CrossRef] [PubMed] [Green Version]
  7. Meffen, A.; Pepper, C.J.; Sayers, R.D.; Gray, L.J. Epidemiology of Major Lower Limb Amputation Using Routinely Collected Electronic Health Data in the UK: A Systematic Review Protocol. BMJ Open 2020, 10, e037053. [Google Scholar] [CrossRef]
  8. Belch, J.J.F. Critical Issues in Peripheral Arterial Disease Detection and ManagementA Call to Action. Arch. Intern. Med. 2003, 163, 884. [Google Scholar] [CrossRef]
  9. Akarsu, S.; Tekin, L.; Safaz, I.; Göktepe, A.S.; Yazıcıoğlu, K. Quality of Life and Functionality after Lower Limb Amputations: Comparison between Uni- vs. Bilateral Amputee Patients. Prosthet. Orthot. Int. 2013, 37, 9–13. [Google Scholar] [CrossRef]
  10. Horgan, O.; MacLachlan, M. Psychosocial Adjustment to Lower-Limb Amputation: A Review. Disabil. Rehabil. 2004, 26, 837–850. [Google Scholar] [CrossRef]
  11. Roberts, T.L.; Pasquina, P.F.; Nelson, V.S.; Flood, K.M.; Bryant, P.R.; Huang, M.E. Limb Deficiency and Prosthetic Management. 4. Comorbidities Associated With Limb Loss. Arch. Phys. Med. Rehabil. 2006, 87, 21–27. [Google Scholar] [CrossRef]
  12. Darter, B.J.; Hawley, C.E.; Armstrong, A.J.; Avellone, L.; Wehman, P. Factors Influencing Functional Outcomes and Return-to-Work After Amputation: A Review of the Literature. J. Occup. Rehabil. 2018, 28, 656–665. [Google Scholar] [CrossRef] [PubMed]
  13. Stewart, C.C.; Berhaneselase, E.; Morshed, S. The Burden of Patients With Lower Limb Amputations in a Community Safety-Net Hospital. J. Am. Acad. Orthop. Surg. 2022, 30, e59–e66. [Google Scholar] [CrossRef] [PubMed]
  14. Pasquina, P.F.; Carvalho, A.J.; Sheehan, T.P. Ethics in Rehabilitation: Access to Prosthetics and Quality Care Following Amputation. AMA J. Ethics 2015, 17, 535–546. [Google Scholar] [CrossRef] [PubMed] [Green Version]
  15. Raichle, K.A.; Hanley, M.A.; Molton, I.; Kadel, N.J.; Campbell, K.; Phelps, E.; Ehde, D.; Smith, D.G. Prosthesis Use in Persons with Lower- and Upper-Limb Amputation. JRRD 2008, 45, 961–972. [Google Scholar] [CrossRef] [PubMed]
  16. ProsFit Technologies. Solution to Mobility and Quality of Life for Millions of Amputees at Scale; ProsFit Technologies JSC: Sofia, Bulgaria, 2022; (Unpublished). [Google Scholar]
  17. Wyss, D.; Lindsay, S.; Cleghorn, W.L.; Andrysek, J. Priorities in Lower Limb Prosthetic Service Delivery Based on an International Survey of Prosthetists in Low- and High-Income Countries. Prosthet. Orthot. Int. 2015, 39, 102–111. [Google Scholar] [CrossRef] [PubMed]
  18. Silva, K.; Rand, S.; Cancel, D.; Chen, Y.; Kathirithamby, R.; Stern, M. Three-Dimensional (3-D) Printing: A Cost-Effective Solution for Improving Global Accessibility to Prostheses. PMR 2015, 7, 1312–1314. [Google Scholar] [CrossRef]
  19. Kozbunarova, A. ProsFit: The Startup That Aims To Democratize the Prosthetic Industry. Trending Topics 2019. Available online: https://www.trendingtopics.eu/prosfit-prosthetic-industry-democratization-pandofit/ (accessed on 28 December 2022).
  20. Hutchison, A. Distributed Care: The Third Dimension! LinkedIn 2020. Available online: https://www.linkedin.com/pulse/distributed-care-third-dimension-alan-hutchison/ (accessed on 28 December 2022).
  21. Sterman, J. Business Dynamics: Systems Thinking and Modeling for a Complex World; Irwin/McGraw-Hill: Boston, MA, USA, 2000; ISBN 978-0-07-231135-8. [Google Scholar]
  22. Hovmand, P.S. Community Based System Dynamics; SpringerLink; Springer: New York, NY, USA, 2014; ISBN 978-1-4614-8763-0. [Google Scholar]
  23. Richardson, G.P. Core of System Dynamics. In Encyclopedia of Complexity and Systems Science; Meyers, R.A., Ed.; Springer: Berlin, Heidelberg, 2019; pp. 1–10. ISBN 978-3-642-27737-5. [Google Scholar]
  24. Forrester, J.W. Principles of Systems; Pegasus Communications, Inc.: Waltham, MA, USA, 1968; ISBN 978-1-883823-41-2. [Google Scholar]
  25. Richardson, G.P. Reflections on the Foundations of System Dynamics: Foundations of System Dynamics. Syst. Dyn. Rev. 2011, 27, 219–243. [Google Scholar] [CrossRef]
  26. Sohn, T.-W.; Surkis, J. System Dynamics: A Methodology for Testing Dynamic Behavioral Hypotheses. IEEE Trans. Syst. Man. Cybern. 1985, SMC-15, 399–408. [Google Scholar] [CrossRef]
  27. Darabi, N.; Hosseinichimeh, N. System Dynamics Modeling in Health and Medicine: A Systematic Literature Review. Syst. Dyn. Rev. 2020, 36, 29–73. [Google Scholar] [CrossRef] [Green Version]
  28. Davahli, M.R.; Karwowski, W.; Taiar, R. A System Dynamics Simulation Applied to Healthcare: A Systematic Review. IJERPH 2020, 17, 5741. [Google Scholar] [CrossRef] [PubMed]
  29. Homer, J.B.; Hirsch, G.B. System Dynamics Modeling for Public Health: Background and Opportunities. Am. J. Public Health 2006, 96, 452–458. [Google Scholar] [CrossRef] [PubMed]
  30. Rajah, J.K. Enabling Mobility for Persons with Major Lower-Limb Amputations: A Model-Based Study of the Impact of Digital Prosthetics Service Provision on Mobility Outcomes. Master Thesis, University of Bergen, Bergen, Norway, 2022. [Google Scholar]
  31. Rajah, J.K.; Hutchison, C.; Chernicoff, W.; Gonçalves, P. The Dynamics of Prosthetics Care Continuum for Persons with Amputation. In Proceedings of the International Conference of the System Dynamics Society 2022, Frankfurt, Germany, 19 July 2022. [Google Scholar]
  32. Paich, M.; Peck, C.; Valant, J.J. Pharmaceutical Product Strategy; CRC Press: Boca Raton, FL, USA, 2004; ISBN 978-0-203-49252-9. [Google Scholar]
  33. Homer, J.B. A Diffusion Model with Application to Evolving Medical Technologies. Technol. Forecast. Soc. Change 1987, 31, 197–218. [Google Scholar] [CrossRef]
  34. Uriona, M.; Grobbelaar, S.S. Innovation System Policy Analysis through System Dynamics Modelling: A Systematic Review. Sci. Public Policy 2019, 46, 28–44. [Google Scholar] [CrossRef]
  35. Hekkert, M.P.; Suurs, R.A.A.; Negro, S.O.; Kuhlmann, S.; Smits, R.E.H.M. Functions of Innovation Systems: A New Approach for Analysing Technological Change. Technol. Forecast. Soc. Change 2007, 74, 413–432. [Google Scholar] [CrossRef] [Green Version]
  36. Walrave, B.; Raven, R. Modelling the Dynamics of Technological Innovation Systems. Res. Policy 2016, 45, 1833–1844. [Google Scholar] [CrossRef]
  37. Wicki, S.; Hansen, E.G. Clean Energy Storage Technology in the Making: An Innovation Systems Perspective on Flywheel Energy Storage. J. Clean. Prod. 2017, 162, 1118–1134. [Google Scholar] [CrossRef]
  38. Walrave, B.; Raven, R. Modelling the Dynamics of TIS-Model Appendix. Res. Policy 2016, 45, 1833–1844. [Google Scholar]
  39. Lee, B.H.; Struben, J.; Bingham, C.B. Collective Action and Market Formation: An Integrative Framework. Strat Mgmt. J. 2018, 39, 242–266. [Google Scholar] [CrossRef]
  40. Forrester, J.W. Industrial Dynamics; M.I.T. Press: Cambridge, MA, USA, 1961; ISBN 978-0-262-06003-5. [Google Scholar]
  41. Király, G.; Miskolczi, P. Dynamics of Participation: System Dynamics and Participation-An Empirical Review. Syst. Res. Behav. Sci. 2019, 36, 199–210. [Google Scholar] [CrossRef] [Green Version]
  42. McCardle-Keurentjes, M.H.F.; Rouwette, E.A.J.A.; Vennix, J.A.M.; Jacobs, E. Potential Benefits of Model Use in Group Model Building: Insights from an Experimental Investigation. Syst. Dyn. Rev. 2018, 34, 354–384. [Google Scholar] [CrossRef]
  43. Office for National Statistics Population Estimates and Deaths by Single Year of Age for England and Wales and the United Kingdom, 1961 to 2014; UK Statistics Authority: London, UK, 2015.
  44. Office for National Statistics. Long-Term International Migration 2.07, Age and Sex, UK and England and Wales; UK Statistics Authority: London, UK, 2020.
  45. Office for National Statistics United Kingdom Population Mid-Year Estimate; UK Statistics Authority: London, UK, 2021.
  46. Office for National Statistics 2020-Based Interim National Population Projections; UK Statistics Authority: London, UK, 2022.
  47. Office for National Statistics Age-Specific Fertility Rates (ASFRs) and Total Fertility Rates (TFRs) for UK-Born and Non-UK-Born Women Living in the UK, Scotland and Northern Ireland: 2004 to 2020; UK Statistics Authority: London, UK, 2022.
  48. Office for National Statistics. Mortality Rates (Mx), 2020-Based Principal Projection, UK (Ages 0 to 125 Years, 1961 to 2120); UK Statistics Authority: London, UK, 2022.
  49. Vascular Services Quality Improvement Programme. In 2015 Annual Report of the National Vascular Registry; Healthcare Quality Improvement Partnership: London, UK, 2015.
  50. Vascular Services Quality Improvement Programme. In 2016 Annual Report of the National Vascular Registry; Healthcare Quality Improvement Partnership: London, UK, 2016.
  51. Vascular Services Quality Improvement Programme. In 2017 Annual Report of the National Vascular Registry; Healthcare Quality Improvement Partnership: London, UK, 2017.
  52. Vascular Services Quality Improvement Programme. In 2018 Annual Report of the National Vascular Registry; Healthcare Quality Improvement Partnership: London, UK, 2018.
  53. Vascular Services Quality Improvement Programme. In 2019 Annual Report of the National Vascular Registry; Healthcare Quality Improvement Partnership: London, UK, 2019.
  54. Vascular Services Quality Improvement Programme. In 2020 Annual Report of the National Vascular Registry; Healthcare Quality Improvement Partnership: London, UK, 2020.
  55. Global Burden of Disease Collaborative Network. Global Burden of Disease Study 2019 (GBD 2019) Results; Institute for Health Metrics and Evaluation: Seattle, WA, USA, 2020. [Google Scholar]
  56. Hutchison, C. ProsFit Health Economics Model; ProsFit Technologies JSC: Sofia, Bulgaria, 2021; (Unpublished Data Set). [Google Scholar]
  57. Farndon, L.; Stephenson, J.; Binns-Hall, O.; Knight, K.; Fowler-Davis, S. The PodPAD Project: A Podiatry-Led Integrated Pathway for People with Peripheral Arterial Disease in the UK—A Pilot Study. J. Foot Ankle. Res. 2018, 11, 26. [Google Scholar] [CrossRef] [PubMed]
  58. Cea-Soriano, L.; Fowkes, F.G.R.; Johansson, S.; Allum, A.M.; García Rodriguez, L.A. Time Trends in Peripheral Artery Disease Incidence, Prevalence and Secondary Preventive Therapy: A Cohort Study in The Health Improvement Network in the UK. BMJ Open 2018, 8, e018184. [Google Scholar] [CrossRef] [PubMed] [Green Version]
  59. Rheinstein, J.; Carroll, K.; Stevens, P. Prosthetic Care for the Mangled Extremity. In The Mangled Extremity; Pensy, R.A., Ingari, J.V., Eds.; Springer International Publishing: Cham, Switzerland, 2021; pp. 257–283. ISBN 978-3-319-56647-4. [Google Scholar]
  60. Davie-Smith, F.; Hebenton, J.; Scott, H. A Survey of the Lower Limb Amputee Population in Scotland: 2015 Full Report; Scottish Physiotherapy Amputee Research Group: Scotland, UK, 2018. [Google Scholar]
  61. Chernicoff, W.; Naumov, S.; Sarkani, S.; Holzer, T. Modeling Market Dynamics in a Super Octane Ethanol Fuel Blend-Vehicle Power-Train System: Understanding the Role of Consumer Perception in Ethanol Market Growth. JPCS 2014, 1, 110–137. [Google Scholar] [CrossRef]
  62. Nieuwenhuijsen, J.; de Almeida Correia, G.H.; Milakis, D.; van Arem, B.; van Daalen, E. Towards a Quantitative Method to Analyze the Long-Term Innovation Diffusion of Automated Vehicles Technology Using System Dynamics. Transp. Res. Part C Emerg. Technol. 2018, 86, 300–327. [Google Scholar] [CrossRef] [Green Version]
  63. Suurs, R.A.A. Motors of Sustainable Innovation: Towards a Theory on the Dynamics of Technological Innovation Systems; Utrecht University: Utrecht, the Netherlands, 2009. [Google Scholar]
  64. De Liso, N.; Arima, S.; Filatrella, G. The “Sailing-Ship Effect” as a Technological Principle. Ind. Corp. Change 2022, 30, 1459–1478. [Google Scholar] [CrossRef]
  65. De Liso, N.; Filatrella, G. On Technology Competition: A Formal Analysis of the ‘Sailing-Ship Effect’. Econ. Innov. New Technol. 2008, 17, 593–610. [Google Scholar] [CrossRef]
  66. Senge, P.M.; Forrester, J.W. Tests for Building Confidence in System Dynamics Models. In System Dynamics; Legasto, A.A., Forrester, J.W., Lyneis, J.M., Eds.; North-Holland Publishing Company: Amsterdam, the Netherlands, 1980; pp. 209–228. [Google Scholar]
  67. Barlas, Y. Formal Aspects of Model Validity and Validation in System Dynamics. Syst. Dyn. Rev. 1996, 12, 183–210. [Google Scholar] [CrossRef]
  68. Burhenne, S.; Jacob, D.; Henze, G.P. Sampling Based on Sobol′ Sequences for Monte Carlo Techniques Applied to BuildingSimulations. In Proceedings of the Proceedings of the Building Simulation 2011: 12th Conference of International Building Performance SimulationAssociation, Sydney, Australia, 14 November 2011; pp. 1816–1823. [Google Scholar]
  69. Webster, J.B.; Hakimi, K.N.; Williams, R.M.; Turner, A.P.; Norvell, D.C.; Czerniecki, J.M. Prosthetic Fitting, Use, and Satisfaction Following Lower-Limb Amputation: A Prospective Study. JRRD 2012, 49, 1493. [Google Scholar] [CrossRef]
  70. Pell, J.P.; Donnan, P.T.; Fowkes, F.G.R.; Ruckley, C.V. Quality of Life Following Lower Limb Amputation for Peripheral Arterial Disease. Eur. J. Vasc. Surg. 1993, 7, 448–451. [Google Scholar] [CrossRef] [PubMed]
  71. Andersen, D.F.; Richardson, G.P.; Vennix, J.A.M. Group Model Building: Adding More Science to the Craft. Syst. Dyn. Rev. 1997, 13, 187–201. [Google Scholar] [CrossRef]
Figure 1. Simplified feedback structure of the amputee health care system. The sign on each link (+/−) indicates the polarity of the relationship between the connected two variables.
Systems 11 00022 g001
Figure 2. Simplified feedback structure of market subsystem. The sign on each link (+/−) indicates the polarity of the relationship between the two connected variables.
Systems 11 00022 g002
Figure 3. Confidence plot of the market share of the digital prosthetics service.
Systems 11 00022 g003
Figure 4. (a) Confidence plot of the proportion of eligible amputees who are fitted with a prosthesis; (b) Confidence plot of the total amputee population.
Systems 11 00022 g004
Figure 5. Confidence plot of the total accessibility of prosthetics services in terms of ability to meet total demand.
Systems 11 00022 g005
Figure 6. (a) Confidence plot of the undiscounted monthly economic productivity rate in terms of GDP per capita from amputees returning to work; (b) Confidence plot of the undiscounted monthly economic cost incurred for the total amputee population.
Systems 11 00022 g006
Figure 7. (a) Comparative graphs of the digital prosthetics market share under three growth scenarios; (b) Comparative graphs of the proportion of eligible amputees who are fitted with a prosthesis under three scenarios.
Systems 11 00022 g007
Figure 8. (a) Comparative graphs of the undiscounted net benefit of digital prosthetics under three growth scenarios; (b) Comparative graphs of the undiscounted additional prosthesis reimbursement cost incurred under three scenarios.
Systems 11 00022 g008
Table 1. Data sources used for model parameterization.
Data SourceDescription
UK Office for National Statistics [43,44,45,46,47,48]UK population estimates for fertility rate and mortality rate
Healthcare Quality Improvement Partnership [49,50,51,52,53,54]UK National Vascular Registry statistics on PAD-related major lower limb amputations and clinical outcomes
Global Burden of Disease Collaborative Network [55]UK estimates for yearly prevalence and incidence estimates on PAD as well as lower limb amputations from injuries as a cause between 2010 and 2019
ProsFit Technologies [56]UK health economics data for estimating economic costs and net benefit of prosthetic service provision
Table 2. Parameters resulting in model sensitivity.
Model SectorParameterRangeSensitivity
Prosthetic CareReference Dropout Fraction (Eligible for Prosthesis)0.01–0.50Numerical
Reference Dropout Fraction (Initial Device)0.01–0.50Numerical
Reference Dropout Fraction (Matured Limb)0.01–0.50Numerical
Reference Readoption Fraction0.01–0.50Numerical
Market FormationMarket Size Threshold0.025–0.075Behavioral *
Relative External Resources Size0–9Behavioral *
Sensitivity of Clinics to Market Size0.25–0.75Numerical
Sensitivity of Resources to Market Size0.5–1.5Behavioral *
Steepness Effect of Total Resources on EA1.25–3.75Numerical
Steepness Effect of EA on Market Infrastructure0.2–0.6 Numerical
Steepness Effect of Legitimacy on EA0.2–0.6Numerical
Steepness Effect of Total Resources on Infrastructure1.25–3.75Numerical
Time to Adjust Clinics12–36Numerical
Time to Adjust Entrepreneurial Activity6–18Numerical
Time to Adjust Market Infrastructure30–90Numerical
Time to Adjust Market Size12–36Numerical
Time to Perceive Legitimacy6–18Numerical
Weight of Entrepreneurial Activity0.25–0.75Behavioral *
Weight of Perceived Legitimacy0.25–0.75Numerical
Innovation DiffusionTime to Decay30–90Numerical
* Refer to Appendix B for the confidence plots of the model’s sensitivity.
Table 3. Baseline results of key indicators.
IndicatorResultUnits
Total Amputee Population84.8 KPeople
Medically Eligible Amputee Population71.9 KPeople
Amputees fitted with Prosthesis5.5 KPeople
Amputee Mobility Proportion0.07Dimensionless
Prosthetics Accessibility0.12Dimensionless
Economic Productivity14 MUSD/Month
Economic Cost210 MUSD/Month
Prosthesis Reimbursement1.94 MUSD/Month
Table 4. Behaviorally sensitive parameters and corresponding values for each scenario.
ParameterPessimisticRealisticOptimisticRemarks
Relative External Resources Size1.274.788.02The higher the figure, the larger the size of the external resources brought in from entrepreneurial activity relative to a certain normal size.
Market Size Threshold0.040.050.05The threshold is the base value of the Relative Market Size, which determines how much the internal resources generated by market grows beyond the normal amount. A higher threshold means that the nascent market must grow to a larger extent before becoming profitable.
Sensitivity of Resources to Market Size1.200.720.95A sensitivity of less than 1 results in a less than proportional change in the Relative Internal Resources to changes in the Relative Market. Conversely, a sensitivity of more than 1 results in a more than proportional relative change.
Weight of Entrepreneurial Activity0.650.320.27The smaller the value, the more weight is placed on the effect of total resources available for market development on market infrastructure than on the effect of entrepreneurial activities, vice versa.
Disclaimer/Publisher’s Note: The statements, opinions and data contained in all publications are solely those of the individual author(s) and contributor(s) and not of MDPI and/or the editor(s). MDPI and/or the editor(s) disclaim responsibility for any injury to people or property resulting from any ideas, methods, instructions or products referred to in the content.

