1. Introduction
Environmental deterioration and resource scarcity have become more and more commonly the result of inadequate resource endowment and the environment’s constrained carrying capacity. The closed-loop supply chain (CLSC), which considers the environmental and economic advantages, has become a hot topic of discussion among the government, businesses, and academics to prevent resource loss and waste, safeguard the ecological environment, and satisfy people’s consumption demands [
1,
2,
3]. Remanufacturing, a vital component of the closed-loop supply chain, may successfully lower resource demand, increase the usage of waste goods, and lessen waste pollution to the environment [
4]. It is of great significance to achieve the goal of green, environmental, and sustainable development [
5,
6]. Therefore, a growing number of nations have created laws and regulations that are obligatory for manufacturers to follow to fulfill their obligations to safeguard the environment, particularly in the fields of waste management, recycling, and remanufacturing [
7,
8]. For instance, “Extended Producer Responsibility” (EPR), which actively encourages manufacturers to participate in the remanufacturing process, mandates that producers shall bear the liability of resources and the environment from the production process to the entire life cycle of products, especially recycling and waste disposal [
9,
10].
To promote the in-depth implementation of sustainable development, scholars have discussed the positive significance of remanufacturing by manufacturers [
11,
12,
13,
14], and some manufacturers have also engaged in remanufacturing, such as Fujifilm Company (Tokyo, Japan) and Weichai Power Co., Ltd. (Shandong, China). However, in practice, only a few skilled manufacturers are involved in remanufacturing production due to a shortage of remanufacturing technology, management expertise, equipment, and talent, and most manufacturers cannot successfully carry out remanufacturing business at the same time [
15,
16]. Thus, they implement design for remanufacturing (DfRem) to take environmental responsibility. For instance, Fujifilm Company (Tokyo, Japan) uses the DfRem to minimize resource consumption and waste creation throughout the life cycle of copiers by three times [
17]. The Eastman Kodak Company (Rochester, NY, USA) replaced plastic parts with stainless steel parts in copiers for design for remanufacturing [
18]. More businesses, such as Xiaomi Corporation (Beijing, China), Apple Inc. (Cupertino, CA, USA), and Dell, Inc. (Landrock, TX, USA), have begun to pay attention to environmental preservation in recent years and have raised the standard for recyclable remanufacturing when designing and manufacturing digital products.
Additionally, there are many third-party remanufacturers in the market, including Chalco Shandong Co., Ltd. (Shandong, China), Repeat-O-Type, a Wayne, NJ-based ink company, and Kinki Industrial Co., Ltd. (Miki City, Hyogo Prefecture, Japan). They may offer to recycle and remanufacture services for numerous businesses and have more sophisticated technology and equipment, forming economies of scale. Remanufacturers supply more than 90% of the market’s recycling volume. Remanufacturing has become the main force in the remanufacturing industry. Moreover, design for remanufacturing determines the remanufacturability of two-thirds of waste goods. The manufacturer’s remanufacturing design, which is crucial for resource recycling, emission reduction, and environmental responsibility, greatly influences how efficient and successful the remanufacturing process will be.
In this context, the DfRem not only raises the cost of production for manufacturers but also lowers the cost of recovery and remanufacturing for remanufacturers, yielding to the “free rider” phenomenon. At the same time, remanufactured goods will reduce the market share of new goods. Therefore, manufacturers frequently opt for the bare minimum or even fake DfRem rather than implementing high-level DfRem [
19]. Thus, it is currently a pressing issue to resolve how to successfully resolve the conflict between manufacturers and remanufacturers while keeping a high level of DfRem. The majority of the existing studies propose that manufacturers can decrease the level of DfRem or set patent license fees to deal with the threat of remanufacturers from the perspective of competition. Rarely is it considered if there is a chance for mutually beneficial collaboration from the standpoint of cooperation. Will collaboration between manufacturers and remanufacturers raise the standard of DfRem in addition to competition? What conditions of such collaboration are both parties ready to accept? How should the two sides work together? How would these metrics alter from the competitive mode in terms of DfRem, earnings, CLSC’s overall profit, waste product recycling rate, etc.? The questions mentioned above are addressed in this study. In contrast to previous research, many of these studies examine the optimal decision for manufacturers and remanufacturers from a competitive standpoint, such as reducing the design level for remanufacturing or raising patent barriers. This article tries to investigate the possibilities of reducing the disagreement between the two parties and generating mutual benefits and win–win outcomes from the standpoint of cooperation. This article contrasts the collaboration mode with the competition mode, establishes the boundary conditions for manufacturers and remanufacturers to choose competition or cooperation, and provides a framework for both sides to make decisions. This paper discusses the competition strategy between manufacturers and remanufacturers and attempts to view both sides of the game as farsightedness. It views the maximization of the total revenue of two cycles as the decision-making goal of both sides when solving the model, in contrast to the existing literature, which primarily assumes that decision makers are short-sighted.
The remainder of this paper is structured as follows.
Section 2 provides a succinct summary of the literature.
Section 3 describes the problem under consideration.
Section 4 describes the notation and assumptions. In
Section 5, the results of the Stackelberg equilibrium are derived for the competition models with patent protection (Model A), competition models without patent protection (Model B), and cooperation models (Model C).
Section 6 compares and analyzes the Stackelberg equilibrium results of the three models. In
Section 7, numerical analysis is used to compare the equilibrium results and validate the above conclusions.
Section 8 concludes this paper.
2. Literature Review
2.1. The Influence of DfRem on the Remanufacturing System
With the worldwide attention to environmental problems [
20], the DfRem has attracted the attention of some scholars. DfRem refers to the fact that manufacturers consider the remanufacturability level when designing new products to make the products more conducive to recycling and remanufacturing. Some scholars have discussed the positive significance of DfRem. For example, Ijomah et al. [
21] believed that the efficiency and effectiveness of the remanufacturing process largely depended on the initial DfRem and proposed a series of operational steps to improve the stability of DfRem. Magrab et al. [
22] believed that DfRem is not only conducive to remanufacturing the waste products but also to assembling, testing, and repairing the products. According to Adem et al.’s [
23] suggestion, the DfRem should decide if two-thirds of the waste products may be manufactured.
In addition, more scholars studied the influence of DfRem on the remanufacturing system. For example, Wu et al. [
24] established the game model between the manufacturer and remanufacturer and pointed out that manufacturers could cope with the threat of remanufacturers by controlling DfRem (mainly adjusting the disassembly level of products). Furthermore, they further analyzed the influence of different price strategies of remanufacturers on the competitive relationship. In their study [
25] of the effects of product component commonality on the CLSC in the two remanufacturing modes (remanufacturing by manufacturers and remanufacturers), Subramanian et al. also identified the ideal product component commonality and the related conditions in the two modes. The cost reductions from remanufacturing that Zhu et al. [
26] proposed have a significant effect on the CLSC. Adem et al. [
23] created a game model between original manufacturers and remanufacturers and discovered that when the original manufacturers have a stronger competitive position, they are more likely to change the quality design of new products to limit the remanufacturer, and when they have a weaker competitive position, they are more likely to limit the number of new products. Xiao et al. [
27] studied the influence of government production taxes on manufacturers and remanufacturers based on DfRem and proposed that manufacturers can adjust product design to change the recycling quantity of waste products, and they further obtained the conditions that the government production tax should meet when encouraging original manufacturers to choose a high level of DfRem. Xia [
28] established the game model to analyze the influence of different government subsidies on DfRem. Moreover, the effect of proactive DfRem on the mechanism of competition between original manufacturers and remanufacturers was explored by Xia et al. [
29]. Liu et al. [
30] constructed a two-period decision model (remanufacturing by manufacturers and remanufacturers), obtained the optimal product design strategy and production decision, and studied the impact of product modularization design on the decisions of the manufacturers and the remanufacturers. Qiao et al. [
31] studied the optimal price and quality of new and remanufactured products based on game theory and discussed how manufacturers should adjust product quality in different markets. They found that when the original manufacturers compete with the remanufacturers, the original manufacturers should not lower the quality design of the products.
The above studies indicate that it is very effective to limit remanufacturers by lowering the level of DfRem, and they also offer crucial advice for manufacturers on how to deal with outside competition. It remains an unsettled issue as to how to effectively solve the contradiction between manufacturers and remanufacturers while maintaining a high level of DfRem.
2.2. Competition between Manufacturer and Remanufacturer
The research on the competition relationship between manufacturers and remanufacturers has been relatively mature. For example, Ferguson and Toktay [
32] studied the optimal pricing strategy for the remanufacturing system in oligopolistic and competitive conditions, and pointed out that monopolists might employ intimidation to keep competitors out of the market. In response to competitive challenges from remanufacturers, Ferguson et al. researched the recovery tactics of manufacturers and argued that producers may block remanufacturers from entering by remanufacturing or prematurely recycling waste items. Zhu et al. [
33] established a competitive game model between manufacturers and remanufacturers based on government price subsidies and discussed the optimal decisions before and after subsidies. According to Shi et al.’s [
34] research on the effect of consumers’ willingness to pay for remanufactured goods on the dynamic competition between manufacturers and remanufacturers, manufacturers should select an appropriate production rate to gain an advantage, and remanufacturers should increase consumers’ willingness to increase profits. According to Chen et al. [
35], the original manufacturers frequently prevent remanufacturers from performing any form of product recycling, restoration, or remanufacturing. Chai et al. [
36] studied the optimal competitive strategy of original manufacturers in the face of remanufacturers’ threat and environmental regulation from the perspective of carbon emission cap and trade policy.
The above literature mainly studies the optimal competitive strategies between manufacturers and remanufacturers in various backgrounds. In addition, more scholars have studied the competition between manufacturers and remanufacturers from the perspective of patent protection. For example, Xiong et al. [
37] established a closed-loop supply chain model protected by patents, discussed the optimal decision of nodal enterprises in decentralized and centralized conditions by using game theory, and proposed that manufacturers could set licensing fees to weaken remanufacturers’ competitive position. Yi et al. [
38] analyzed the influence of the fixed patent license fee mode and unit product patent license fee mode on the equilibrium solution of each decision variable and the optimal profit of the closed-loop supply chain. Zhu et al. [
39] studied the influence of original manufacturers’ patent protection on remanufacturers’ technological innovation strategy by using game theory. Cao et al. [
40] constructed a game model composed of manufacturers, remanufacturers, and the government and analyzed the impact of patent protection and government regulation on all parties. Zhao et al. [
41] constructed a Stackelberg game model between original equipment manufacturers (OEM) and remanufacturers in the patent licensing model, discussed the impact of OEM’s green innovation efforts on the decision makers and the supply chain system, and further designed the coordination mechanism of fixed patent fees.
The above studies covered how manufacturers used DfRem or patent protection to address the issues posed by remanufacturers from a competitive standpoint. It is rarely discussed whether there is the possibility of cooperation and mutual benefit from the perspective of cooperation. In addition to the competition, will the cooperation between manufacturers and remanufacturers improve DfRem? Under what conditions are both parties willing to accept such cooperation? How should the two sides cooperate? How will the DfRem, the profits, the overall profit of CLSC, the recycling rate of waste products, etc. change compared to the competition mode? Further research on these issues is still required.
2.3. Cooperation between the Manufacturer and Remanufacturer
Some studies on the cooperation between manufacturers and remanufacturers provide key enlightenment for our research. Wang et al. [
42] studied the optimal price strategy of the two parties in the cooperation mode (the manufacturers sell the products remanufactured by the manufacturers) and provided the necessary conditions for both parties to cooperate. Wu et al. [
43] studied the equilibrium decision of manufacturers and remanufacturers in two cooperation modes (technology licensing and joint venture establishment) and compared the two cooperation modes. Sun et al. [
44] studied the optimal strategy of manufacturers and remanufacturers in two competitive modes and cooperation modes. Wang et al. [
45] constructed a competition and cooperation game model between manufacturers and remanufacturers in the background of carbon emission constraints and different consumer preferences and discussed the impact of a carbon tax on supply chain decisions. In a cooperative mode of outsourced remanufacturing, Xia et al. [
46] investigated the impact of DfRem on the supply chain and examined the effects of two different remanufacturing cost-bearing models (manufacturer-borne DfRem costs and remanufacturer-borne DfRem costs) on the DfRem effort, recovery rate, profit, and other factors.
However, there are still shortcomings in these studies. These studies examine various power-dominated market structures’ cooperation and competitive modes, respectively. For example, Wang et al. [
42] regarded remanufacturers as the dominant leader in the remanufacturing market. Sun et al. [
44] also believed that the remanufacturers have the pricing power of remanufactured products’ resale prices when they cooperate. However, it is more common that the manufacturers are the dominant leader in the market and have the right to set the price in reality. Furthermore, these studies do not consider the dual influence of DfRem and patent protection on the decision making of both parties. Only Xia et al. [
29] investigated DfRem’s impact on the CLSC in the cooperative mode of outsourced remanufacturing; however, they did not contrast the cooperative and competitive modes.
Given this, and considering DfRem, this paper respectively studies the optimal game strategy between the manufacturer and remanufacturer in the competition model with patent protection, the competition model without patent protection, and the cooperation model. We want to know if, in comparison to the competition model, the collaboration model can boost not only the level of DfRem but also the revenues of the two parties and CLSC. We also learn more about the factors that influence game strategy selection, and we ultimately offer crucial theoretical advice that will help the two sides develop a co-opetition plan in practice. The innovation of this study is as follows: first, in the competition model, we study the influence of both the level of DfRem and patent protection on the strategy of manufacturers and remanufacturers, which is more in line with reality. Second, we explore the cooperation model in the background of the manufacturers as the market leader, that is, the manufacturers actively improve the level of DfRem and do not charge remanufacturers patent licensing fees to promote remanufacturers recycling and remanufacturing. However, manufacturers purchase the remanufactured goods rather than remanufacturers selling them. Finally, manufacturers consistently sell both new and remanufactured products, and they also set the resale price of remanufactured products. Third, in terms of model solving, we regard manufacturers and remanufacturers as farsighted. They always consider the impact of the decisions that are made in the first period on their profits in the second period, and they regard maximizing the total profit of the two periods as their decision goal.
3. Problem Description
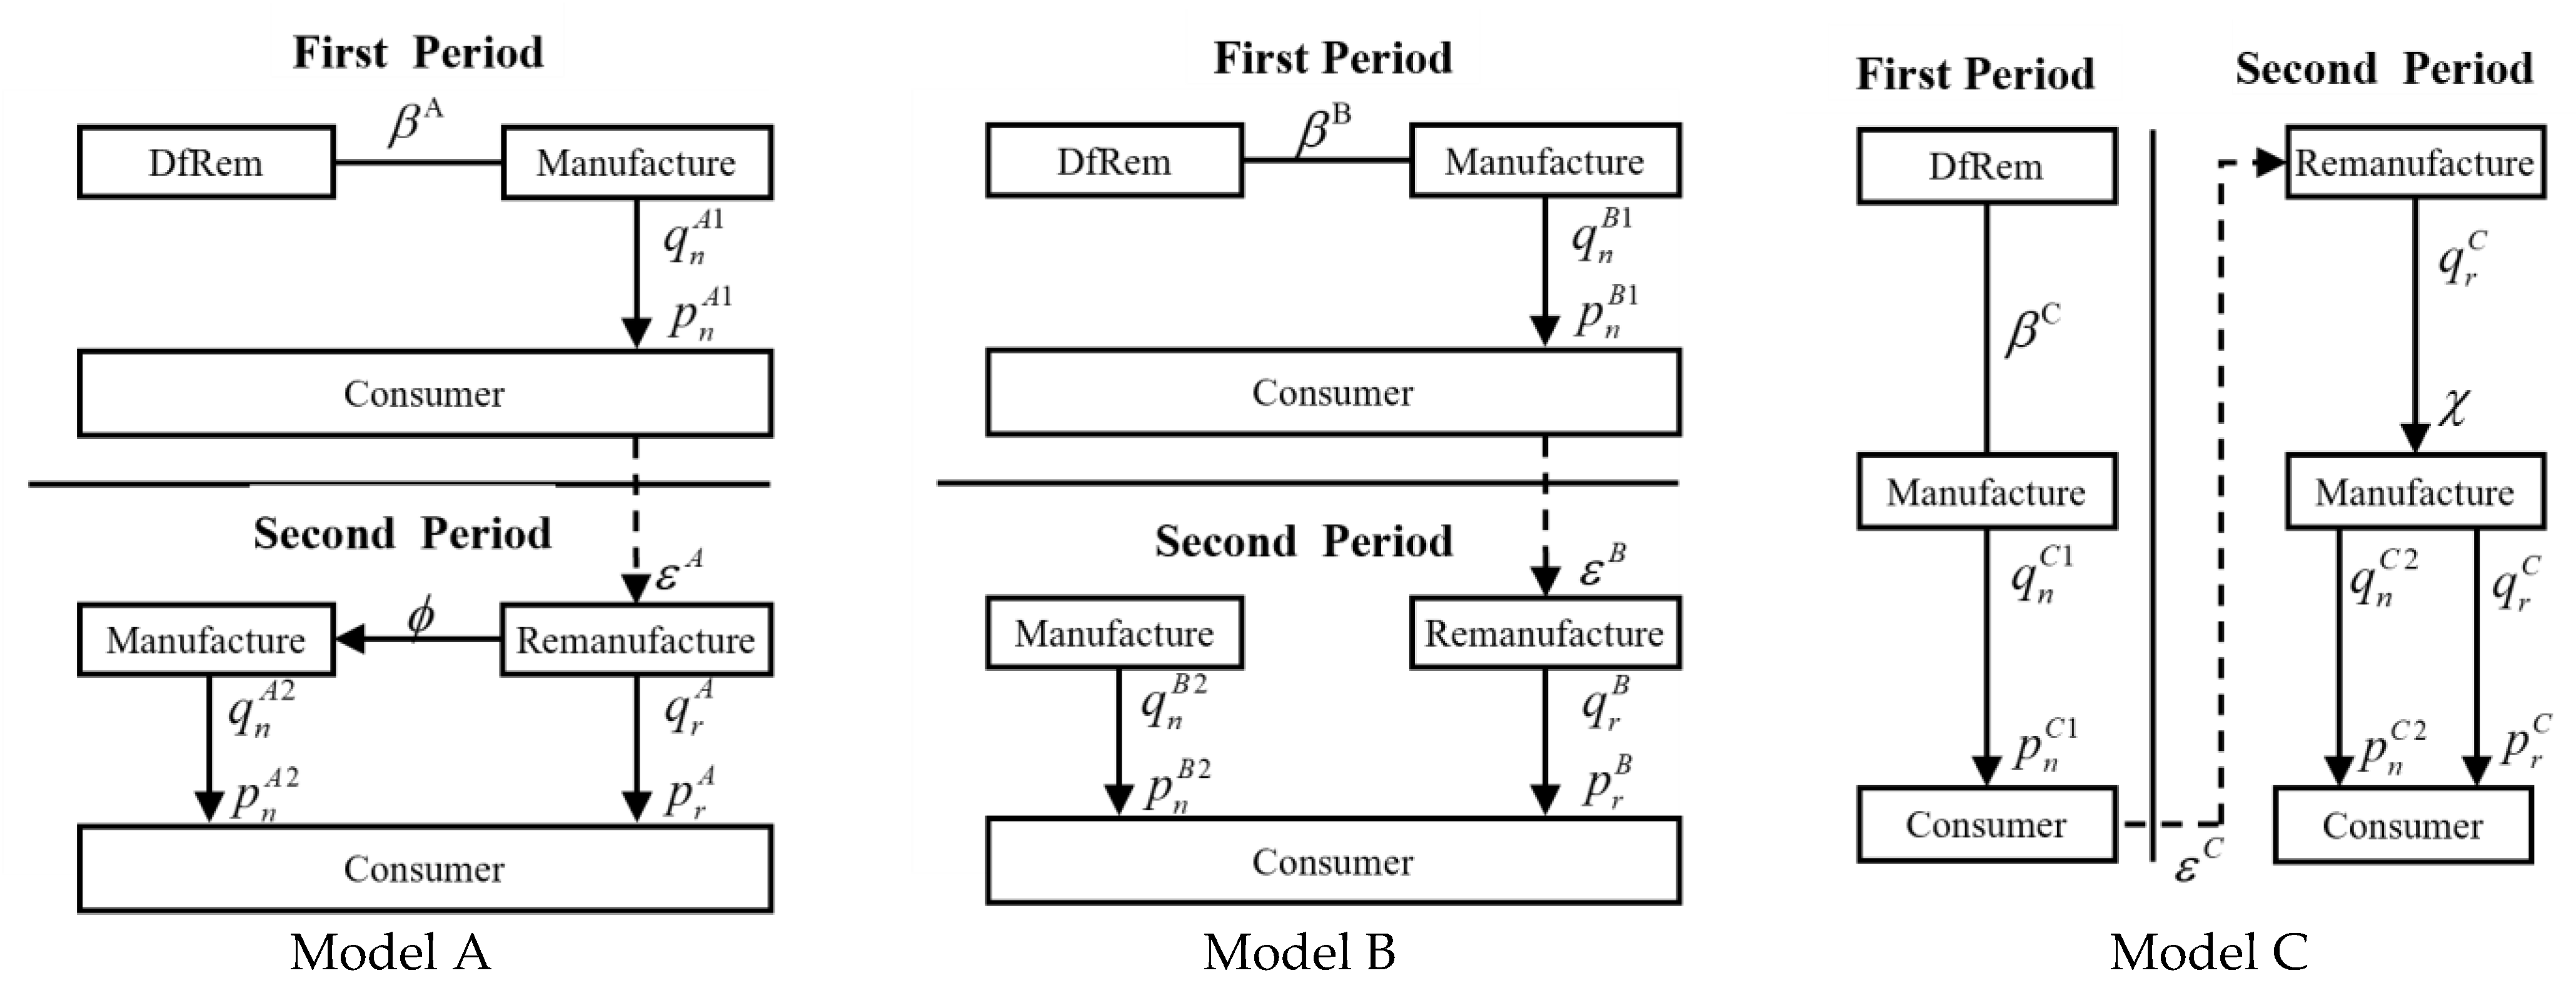
In this work, a manufacturer (M) and a remanufacturer (R) make up the two-period closed-loop supply chain (CLSC) system. Hereafter, we will refer to M as him and R as her to keep the statement short. Model A is a competition model with patent protection, Model B is a competition model without patent protection, and Model C is a cooperation model. These models are created while taking into account the DfRem.
Figure 1 depicts these remanufacturing game models.
These three models only have M performing DfRem in the first period while maintaining the same product design in the second. During the second period, R must pay patent licensing fees to M before remanufacturing and selling in Model A. For example, businesses such as Sany Heavy Industry Co., Ltd. (Beijing, China) and The Peterbilt Company (Washington, DC, USA) permit remanufacturing enterprises to conduct recycling and remanufacturing through patent authorization [
40]. In Model B, R is free to engage in remanufacturing and sales activities without paying M any royalties for the use of its patents (for instance, ink firm Repeat-O-Type (Wayne, NJ, USA) reproduces Hewlett-Packard Company (Palo Alto, CA, USA) ink cartridges [
30]). In Model C, R resells all the remanufactured goods to M, who then evenly sells both new and remanufactured goods. M controls the resale price of the remanufactured goods in this scenario.
4. Notation and Assumptions
Table 1 displays the definitions of the parameters used in this article. Models A, B, and C are denoted by the parameters
, respectively. Where
respectively represent the first period and the second period.
In particular, the DfRem cost is a quadratic function of the level of DfRem, which is
[
15,
46]. The profit of DfRem to new products and remanufactured products is a linear function of the levels of DfRem, which, respectively, are
and
.
The research makes the following assumptions to make the analysis feasible.
Assumption 1. Under symmetric and complete information, M and R want to maximize two-period profits; both of them make long-term decisions, and M is the game’s leader;
Assumption 2. This study temporarily disregards the uncertainty of end-of-life product recycling to simplify the model and assumes that all recycled end-of-life products can be remanufactured because each end-of-life product has a different level of end-of-life. Additionally, the cost of recycling waste products is a quadratic function of the number of end-of-life products, which is [27];
Assumption 3. Consumers’ willingness to pay for remanufactured products is in the range of
, and the range of end-of-life product recycling rates is
. R remanufactures all end-of-life products, and all remanufactured products are released onto the market in the second period;
Assumption 4. According to the consumer utility theory, in the first period, the relationship between the price and demand of new products is ; in the second period, the relationship between the price and demand of new products is , and the relationship between the price and demand of remanufactured products is;
Assumption 5. The unit production cost of remanufactured products is less than the unit production cost of new products, which is ; the profit of DfRem to unit remanufactured products (for example, it is conducive to recycle end-of-life products and remanufacture remanufactured products) is more than the profit of DfRem to unit new products (for example, it is conducive to assemble, clean, and upgrade new products), which is .
5. Remanufacturing Game Model
5.1. Model A: Competition Model with Patent Protection
In Model A, the decision sequence of
M and
R is as follows: in the first stage,
M decides the level of DfRem (
) and the price of the new products in first period (
); in the second stage,
M decides the price of the new products in the second period (
) and the unit patent license fee (
); in the third stage,
R decides the recycling rate of end-of-life products (
) based on
M’s decision-making situation. The total profit function of
M, the second period profit function of
M, and the profit function of
R, respectively, are formulated as:
Inverse induction is used to solve Model A:
In the third stage, solve the optimization problem of
R’s profit.
can be obtained by taking the second derivative of Equation (3) with respect to
, so
is a concave function with respect to
, and Equation (3) has an optimal solution. According to the first-order condition of Equation (3), the reaction function of
can be solved as
According to
,
and Equation (4), the reaction functions of
and
can be solved as
In the second stage, solve the optimization problem of
M’s profit in the second period. By substituting Equations (5) and (6) into Equation (2), the Hesse matrix of
can be solved as
Because of
and
,
is a concave function of
and
. According to the first-order condition of
, the reaction functions of
and
can be solved as
By substituting Equations (8) and (9) into Equations (4)–(6), the reaction functions of
,
, and
can be solved as
According to Equation (8), Equation (11), and
, the reaction function of
can be solved as
In the first stage, solve the optimization problem of
M’s total profit. By substituting Equations (8)–(11) into Equation (1), the Hesse matrix of
can be solved as
Proposition 1. In Model A, when the concavity condition is satisfied, and
can be solved as
Certification 1. According to Equation (14),
can be obtained by solving
. Because
is negative definite,
is a concave function of
and
.
and
can be obtained by simultaneously solving
and
.
By substituting Equations (15) and (16) into Equation (8) to Equation (11),
,
,
,
,
,
can be solved as
Proposition 2. In Model A,
should be satisfied if we want to ensure
.
Certification 2. According to the concavity condition of Proposition 1 and
,
can be obtained. Then, we can solve
to prove Proposition 2.
Proposition 2. Indicates that if and only if
is satisfied, the remanufacturing business can be carried out; otherwise, the R will exit the market. Because this paper studies the competition and cooperation game between M and R, we only consider that
is satisfied.
5.2. Model B: Competition Model without Patent Protection
In Model B, the decision sequence of
M and
R is as follows: in the first stage,
M decides the level of DfRem (
) and the price of the new products in first period (
); in the second stage,
M decides the price of the new products in the second period (
); in the third stage,
R decides the recycling rate of end-of-life products (
) based on
M’s decision-making situation. The total profit function of
M, the second period profit function of
M, and the profit function of
R, respectively, are formulated as:
Since the above issue is a dynamic game with complete information, Model B is solved via inverse induction. The approach to solving the problem is the same as Model A, which is not covered in this article. The optimal solutions and Proposition 3 of Model B are obtained as follows:
Proposition 3. In Model B, if the concavity condition is satisfied,
and
can be solved.
5.3. Model C: Cooperation Model
In Model C, the decision sequence of M and R is as follows: in the first stage, M decides the level of DfRem (
) and the price of the new products in first period (
); in the second stage, M decides the price of the new products in the second period (
) and the unit resale price of remanufactured products (
); in the third stage, R decides the recycling rate of end-of-life products (
) based on M’s decision-making situation. The total profit function of M, the second period profit function of M, and the profit function of R, respectively, are formulated as:
Since the above issue is a dynamic game with complete information, Model C is solved via inverse induction. The approach to solving the problem is the same as Model A, which is not covered in this article. The optimal solutions and Proposition 4 of Model C are obtained as follows:
Proposition 4. In Model C, if the concavity condition
is satisfied,
and
can be solved.
6. Comparative Analysis of Equilibrium Results
Proposition 5. On the basis of the concave condition, the optimal prices of the new product in the first period under the three models are.
Certification 5. According to Proposition 1,2,3,4 and the expressions of
,
,
, we can know
,
. Furthermore,
is used to compare
and
.
From Proposition 2, we can prove that the numerator of Equation (40) is greater than 0. From Proposition 1 and Proposition 4, we can also prove that the denominator of Equation (40) is greater than 0. So, Equation (40) is greater than 0, and can be proved. So, Proposition 5 is proved.
According to Proposition 5, M does not have a patent but does have the channel dominating right in Model B. M can only reduce the number of recyclable waste products by increasing the price of new products in the first period so as to limit the output of remanufactured products from the source. However, under Model A, even though M needs to bear the cost of DfRem, he may shift the cost by charging for patent licensing because they have acquired the patent rights, thereby preventing R from free-riding. Similarly, in Model C, where M has the authority to determine the resale price of the remanufactured product, M may alter the resale price given to R to prevent the remanufactured product from eroding the market share of the new product. Therefore, under Models A and C, M is more inclined to set relatively low pricing for new products in the first period to provide R with more waste products and, ultimately, increase their own profit. The fact that M would set a lower new product price in the first period in Model C compared to Model A shows that the pricing power of the resale price of the remanufactured product plays a more crucial role than the function of the patent in coping with the problems of R.
Proposition 6. On the basis of the concave condition, (1) the optimal prices of the new product in the second period under the three models are. (2) In Model A and Model C, the optimal price of the new products in the second period is the same as the optimal price in the first period, which is.
Certification 6. (1) This proof process is similar to Certification 5. (2) Simplifyand, and subtract from to prove . Similarly, can also be proved. So, Proposition 6 is proved.
According to proposition 6, M must bear the cost of DfRem in Model B, even if he possesses the channel’s dominating right but no patent rights. To make the remanufactured products less competitive in this situation, M must reduce the price of the new products in the second phase. In contrast, M can successfully stop R from free-riding in Model A and Model C and prevent remanufactured products from snatching market share from new products. As a result, M just needs to maintain the pricing of the new items from the first period rather than lowering it.
Proposition 7. On the basis of the concave condition, the optimal levels of DfRem under the three models are.
Certification 7. According to Proposition 1–4 and the expressions of, , , we can know that,. Furthermore,is used to compareand.
From Proposition 2, we can prove that the numerator of Equation (41) is less than 0. From Proposition 1 and Proposition 4, we can also prove that the denominator of Equation (41) is greater than 0. So, Equation (41) is less than 0, and can be proved. So, Proposition 7 is proved.
According to Proposition 7, as compared to the other two models, M in Model B has the channel’s dominating right but does not hold any patents, and he also has to pay for free. At this point, M’s profit will suffer since he cannot effectively limit R. To safeguard his rights and earnings, M will thus reduce the degree of DfRem or even refuse to conduct DfRem. Furthermore, compared with Model A, M is more willing to design for remanufacturing in Model C. It also suggests that, in terms of boosting the firm, the synergistic effect of M and R is more effective than the competing impact of patent limitations.
7. Numerical Simulation
Because of the complexity of the models, numerical analysis is used to compare the prices, the levels of DfRem, the recovery rates, the profits, etc. in the three models and verify the correctness of the models and properties. On the basis of all concavity conditions, referring to the literature [
44,
46], we assume that the relevant parameters in the CLSC are:
. The numerical simulation results of the three models are shown in
Table 2.
Based on
Table 2, it is clear that, in Model B, new product prices are the highest in the first period and the lowest in the second, as compared to the other two models. It is demonstrated that M tends to use price-off promotions to raise the market competitiveness of the new product and increase the price of new products in the first period when M does not have patent protection, which also verifies Propositions 5,6. At the same time, Model B has the lowest DfRem level. It is demonstrated that M will actively reduce the level of DfRem to stop R from free-riding, supporting Proposition 7. Although M’s and CLSC’s profits are the lowest in Model B, R’s profit is the highest. It is demonstrated that, despite M’s active efforts to counter the threat of remanufacturing, they have been ineffective. Both CLSC and M’s profits have substantially decreased. Because of the lack of patent protection, R has a more significant profit. The price of remanufactured goods is lowest in Model B, even though the number of remanufactured products and the recycling rate are both at their maximum levels. It is demonstrated that R has the highest recycling rate since it actively recycles and remanufactures end-of-life products. Because customers can buy new items and remanufactured products for less money, it is more conducive to green development and more advantageous to them.
The profits of M, R, and CLSC are all greater In Model C compared to Model A. It is shown that although M has obtained the right to sell remanufactured products at the cost of losing patent rights, he has not lost their leading position in the Stackelberg game and can still protect his own profit by adjusting the resale price of remanufactured products. Furthermore, it shows that the dual function of the channel dominance and pricing power of resale price is more significant than the dual role of channel dominance and patent rights. Model C has the highest level of DfRem at the same time. It is demonstrated that the synergistic effects of M and R improve DfRem more than the competitive effect of a single patent limitation, supporting Proposition 7. Furthermore, it is better for the environment and customers because Model C’s recycling rate is greater and its prices for new and remanufactured items are both lower. Finally, from the standpoint of CLSC’s profit, Model C’s profit is higher than that of Models A and B, demonstrating that collaboration is a superior option for ensuring CLSC’s steady development.
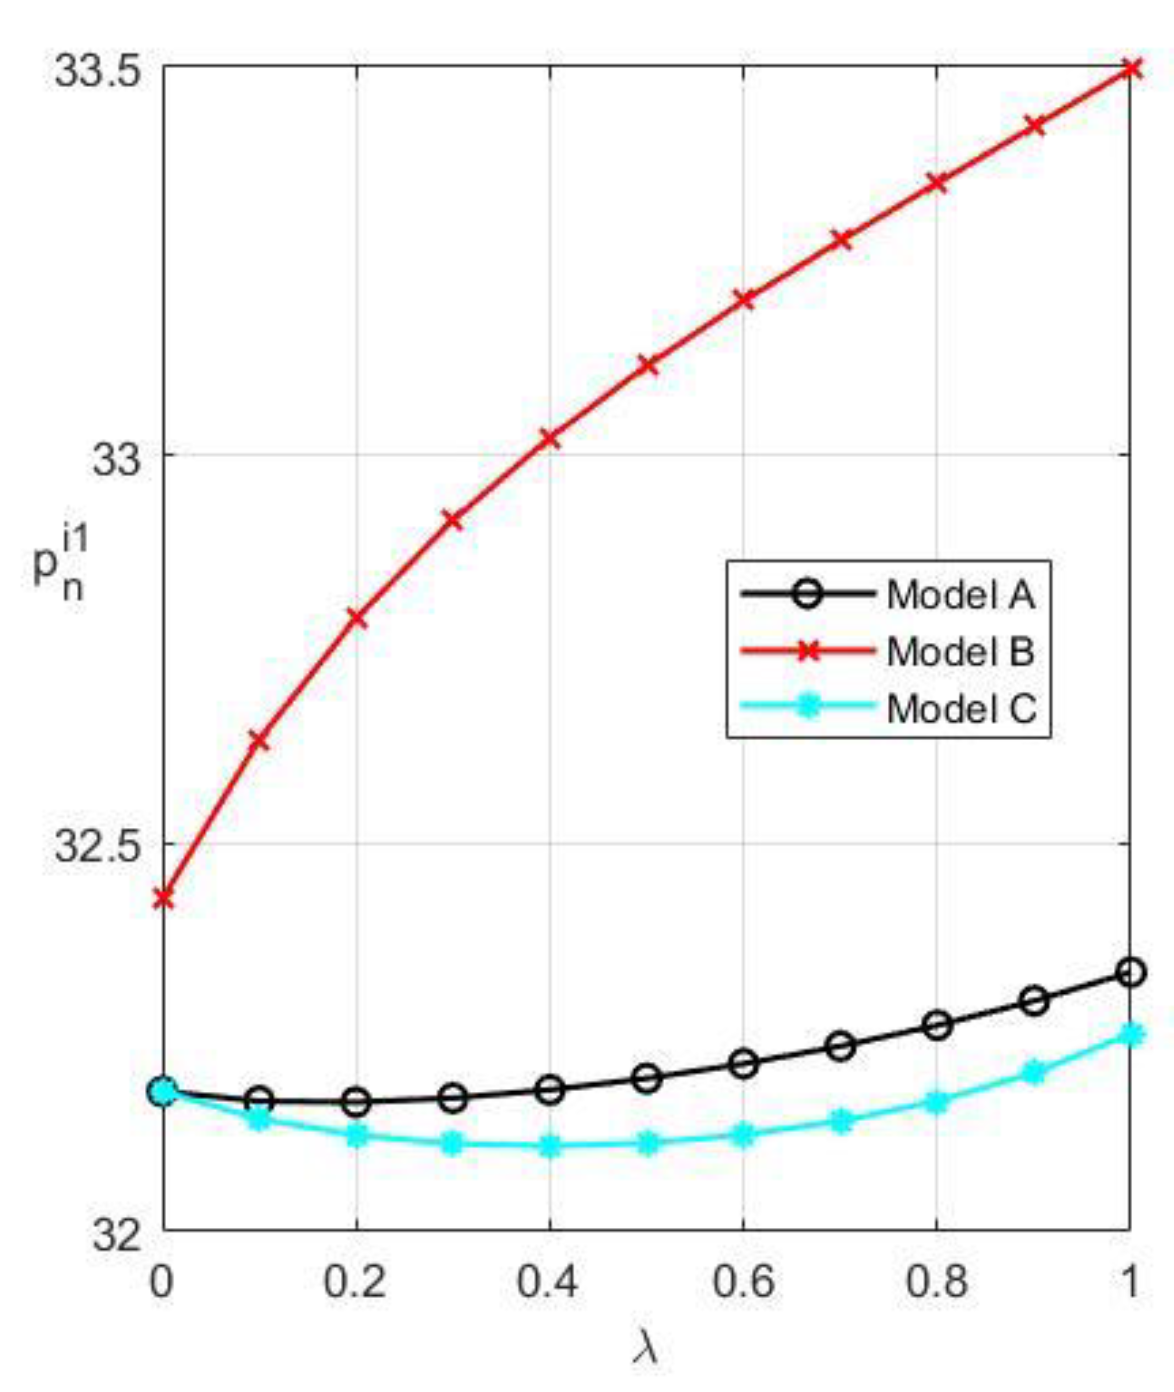
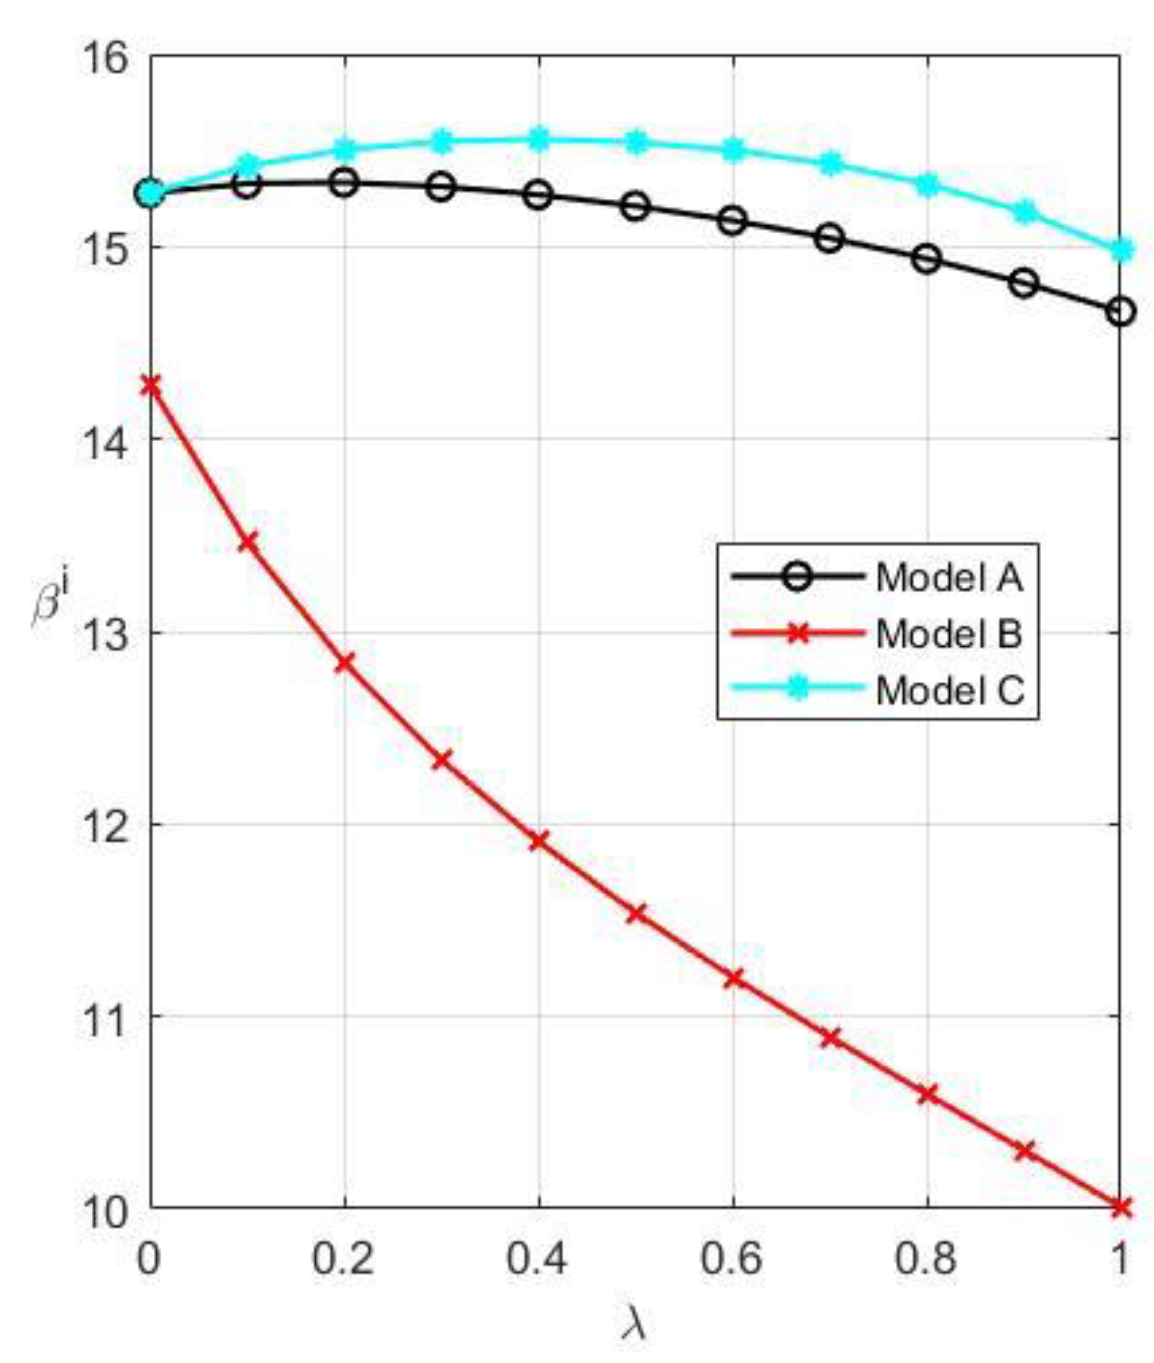
As demonstrated in
Figure 2 and
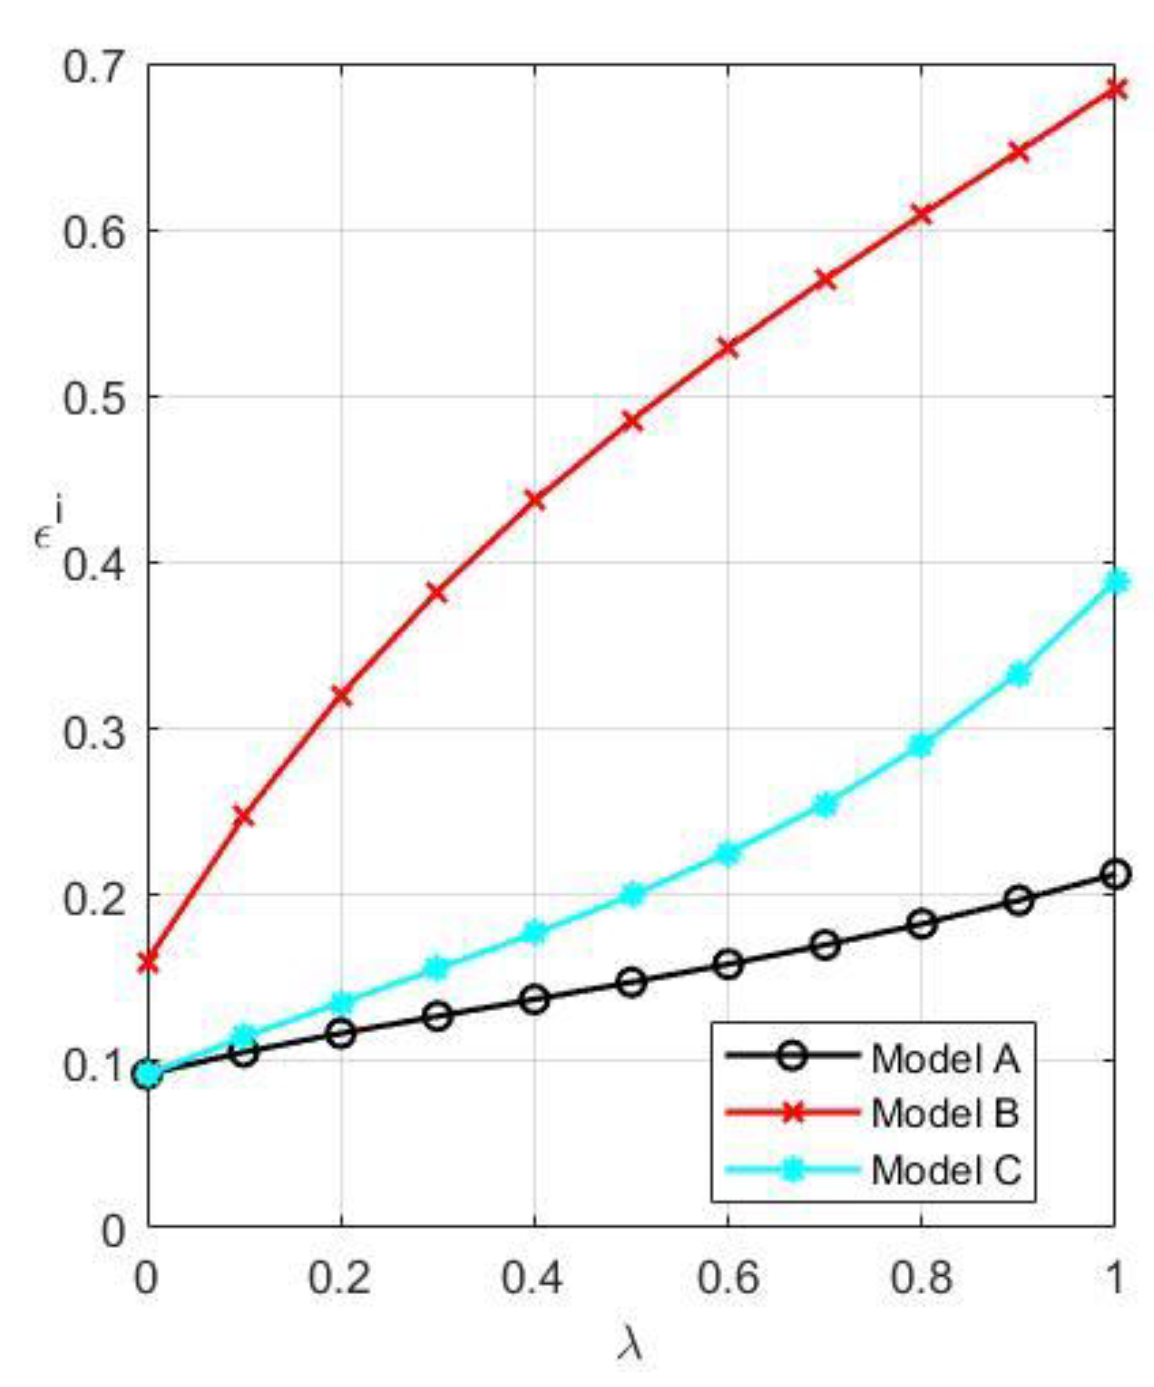
Figure 3, Model B’s new product prices in the first period climb progressively. This is because when customer willingness increases, the competitiveness of remanufactured goods will also rise. However, since he does not have enough authority to safeguard his rights and interests, M will limit the production of remanufactured products by increasing the price of new products in the first phase and lowering the level of DfRem. New product prices in Models A and C initially drop and subsequently rise throughout the first period. This is so that M can utilize his patent and resale price rights to defend his rights and interests. M encourages recycling and remanufacturing by decreasing the price of new products in the first period and raising the level of DfRem, which is also advantageous to his profits when consumer willingness grows within a certain range. However, the loss caused to M by the remanufactured products will surpass the profit it delivers, and M will need to raise the price once again and reduce the level of DfRem to safeguard his interests when the customer’s willingness exceeds a critical threshold value. Additionally, Model C’s first-period price for new products is cheaper than Model A’s, supporting Proposition 5. Additionally, Model C has a higher level of DfRem than Model A, which supports Proposition 7.
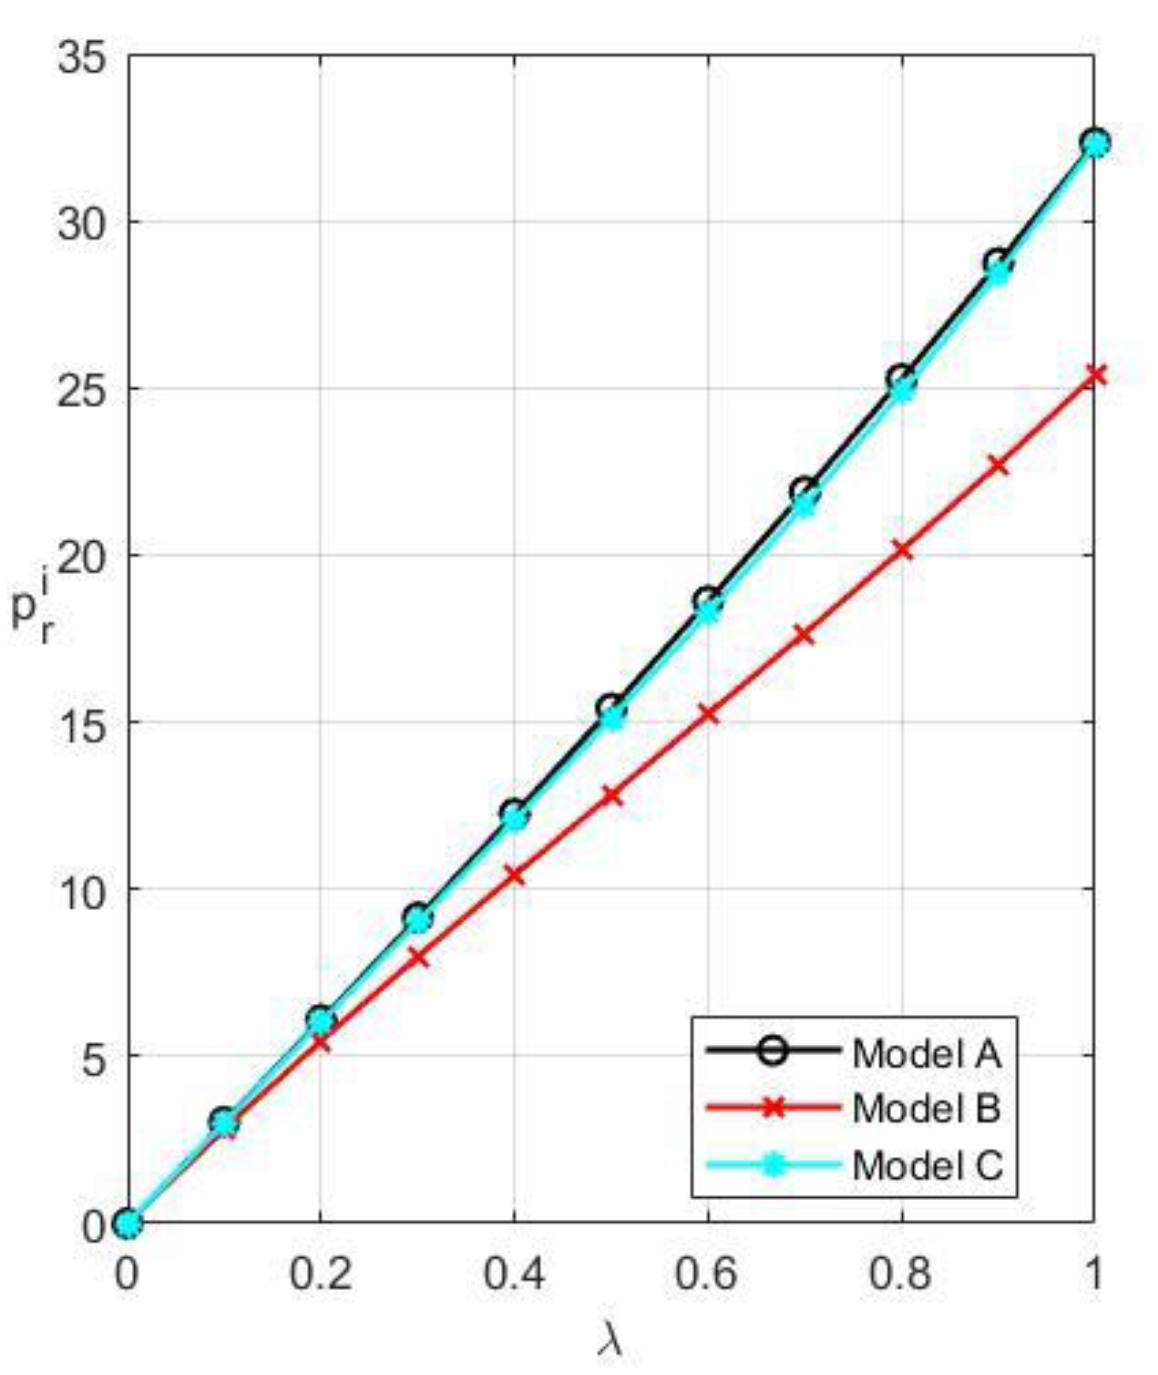
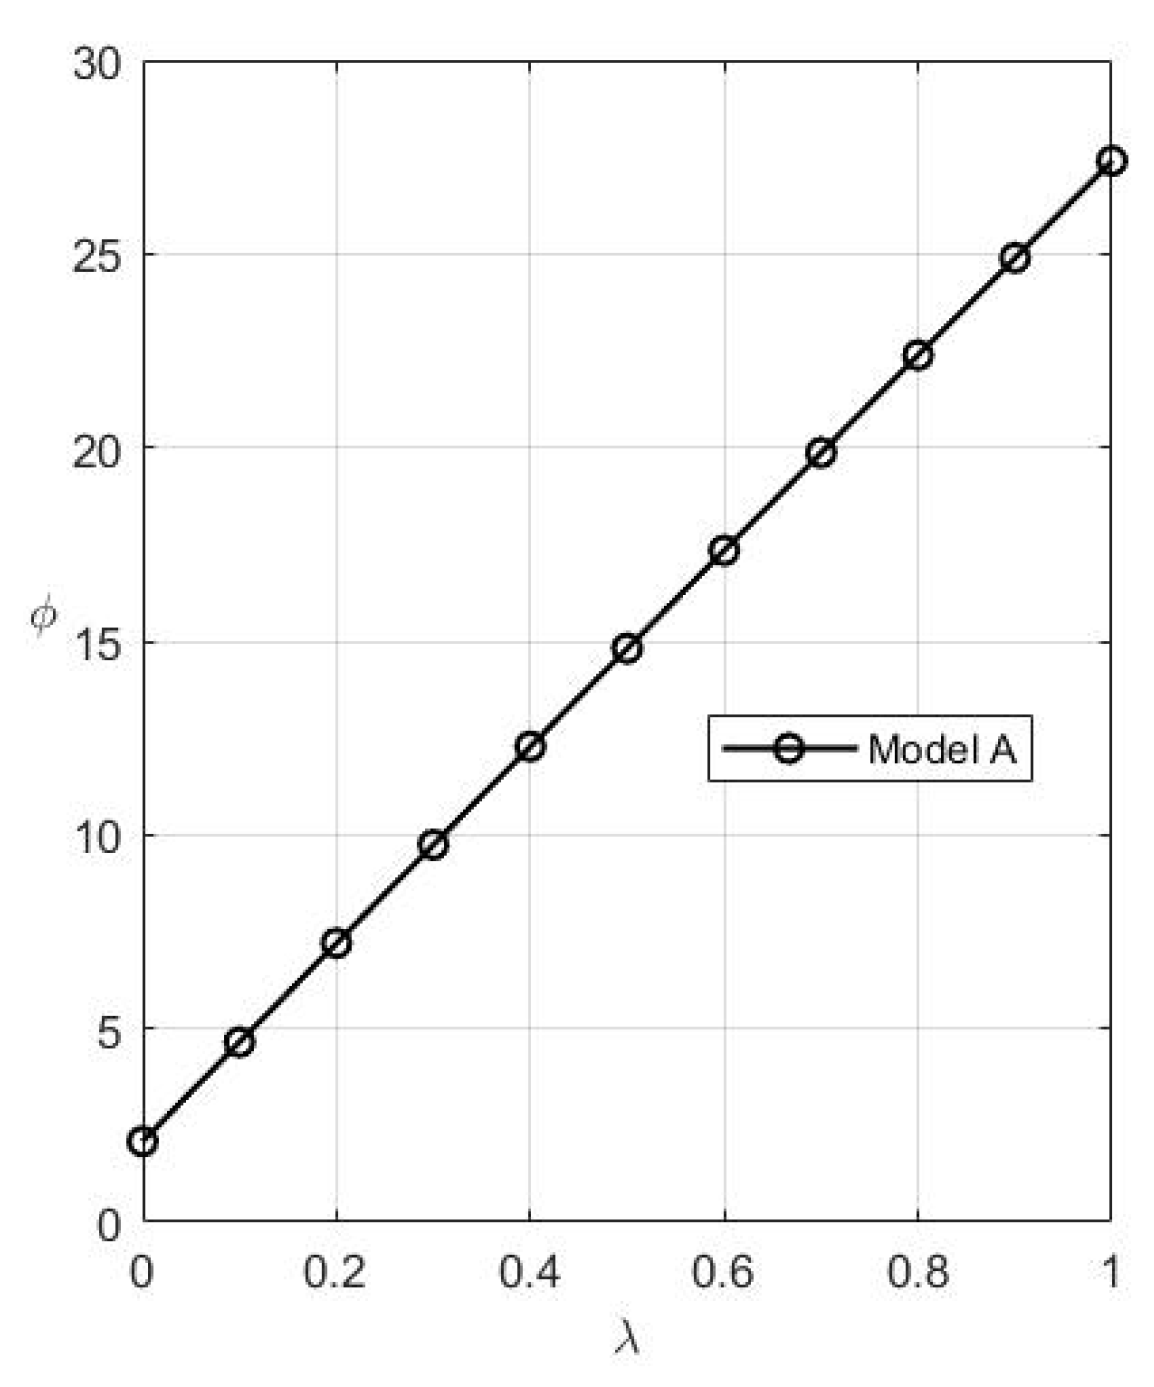
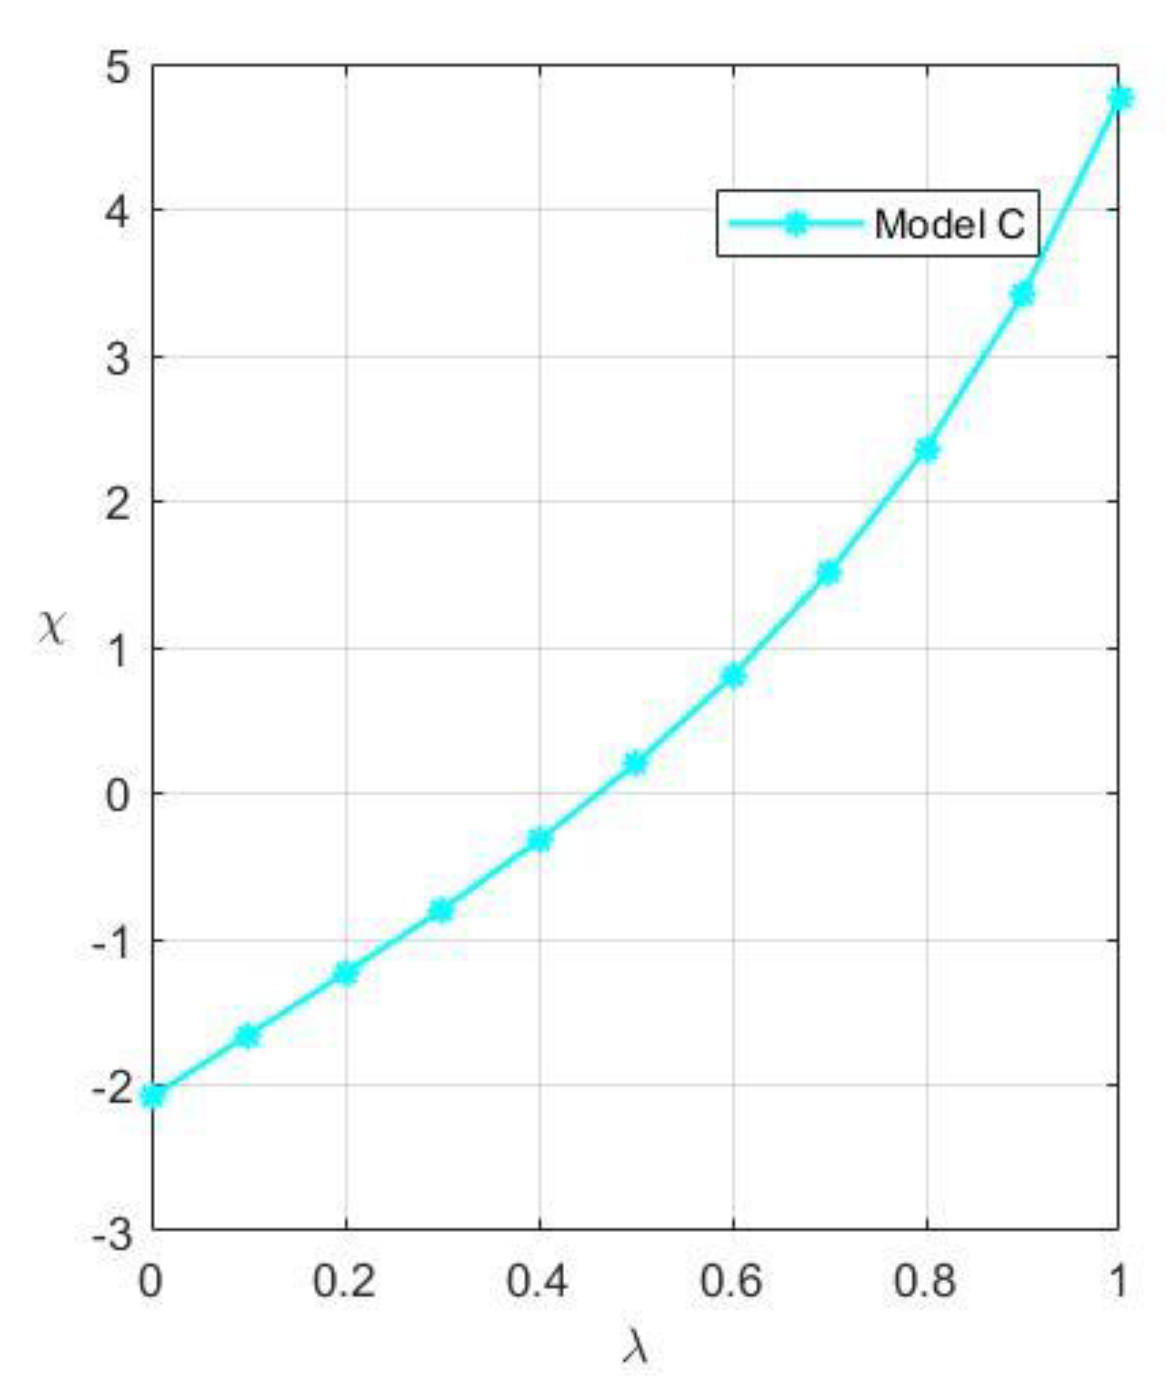
The price of remanufactured products, the unit resale price of remanufactured products, the unit patent licensing fee, and the recycling rate are all positively connected with customers’ willingness to pay, as shown in
Figure 4,
Figure 5,
Figure 6 and
Figure 7. This is because as consumers become more aware of remanufactured products, R’s negotiating power improves, increasing the selling price and resale price of remanufactured products proportionally. This also encourages the growth of remanufacturing by remanufacturers. However, M will raise the cost of patent licensing to limit R at this time.
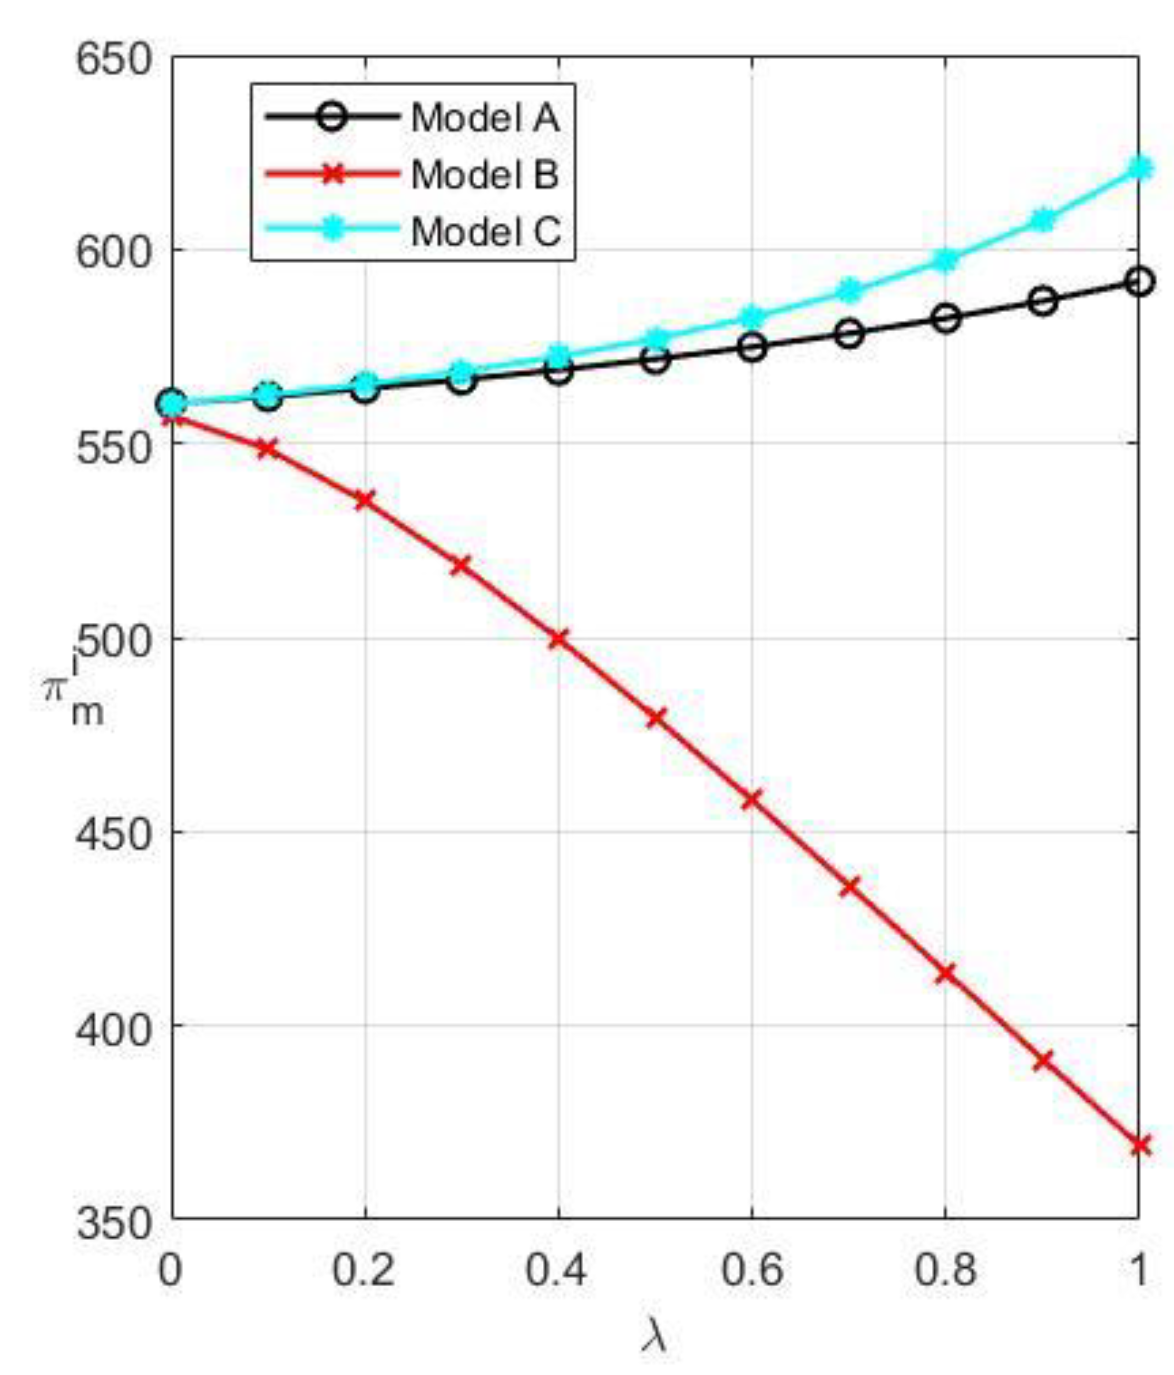
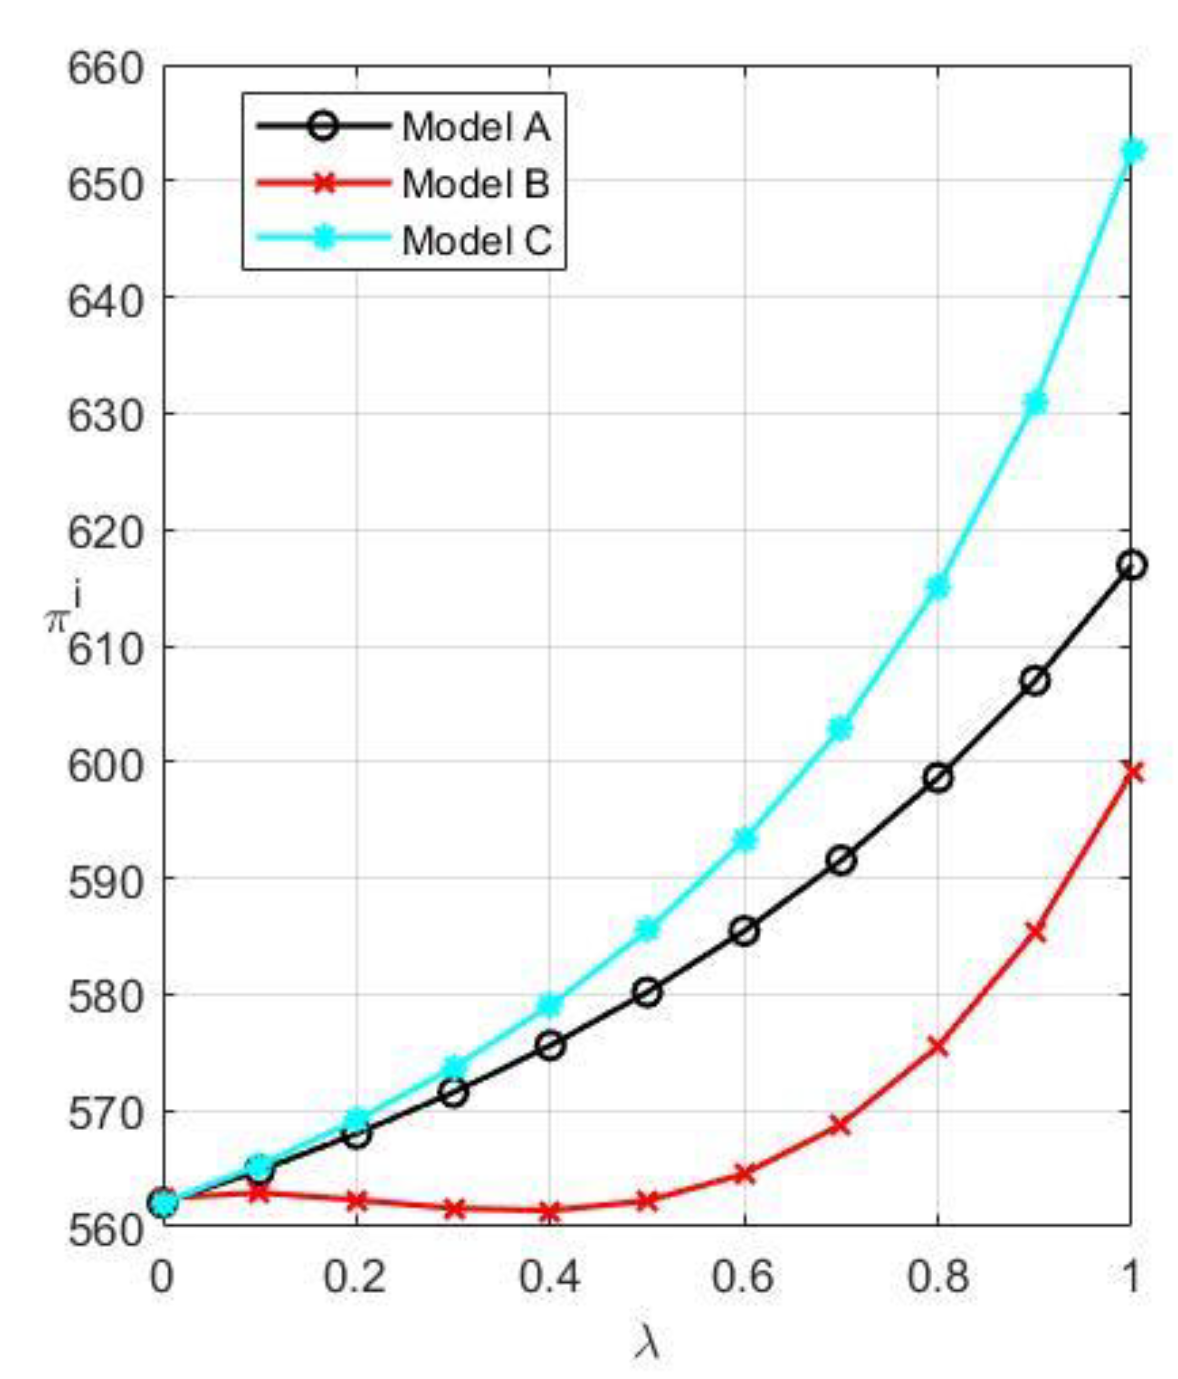
The overall profit of M is the largest in Model C and the lowest in Model B, as shown in
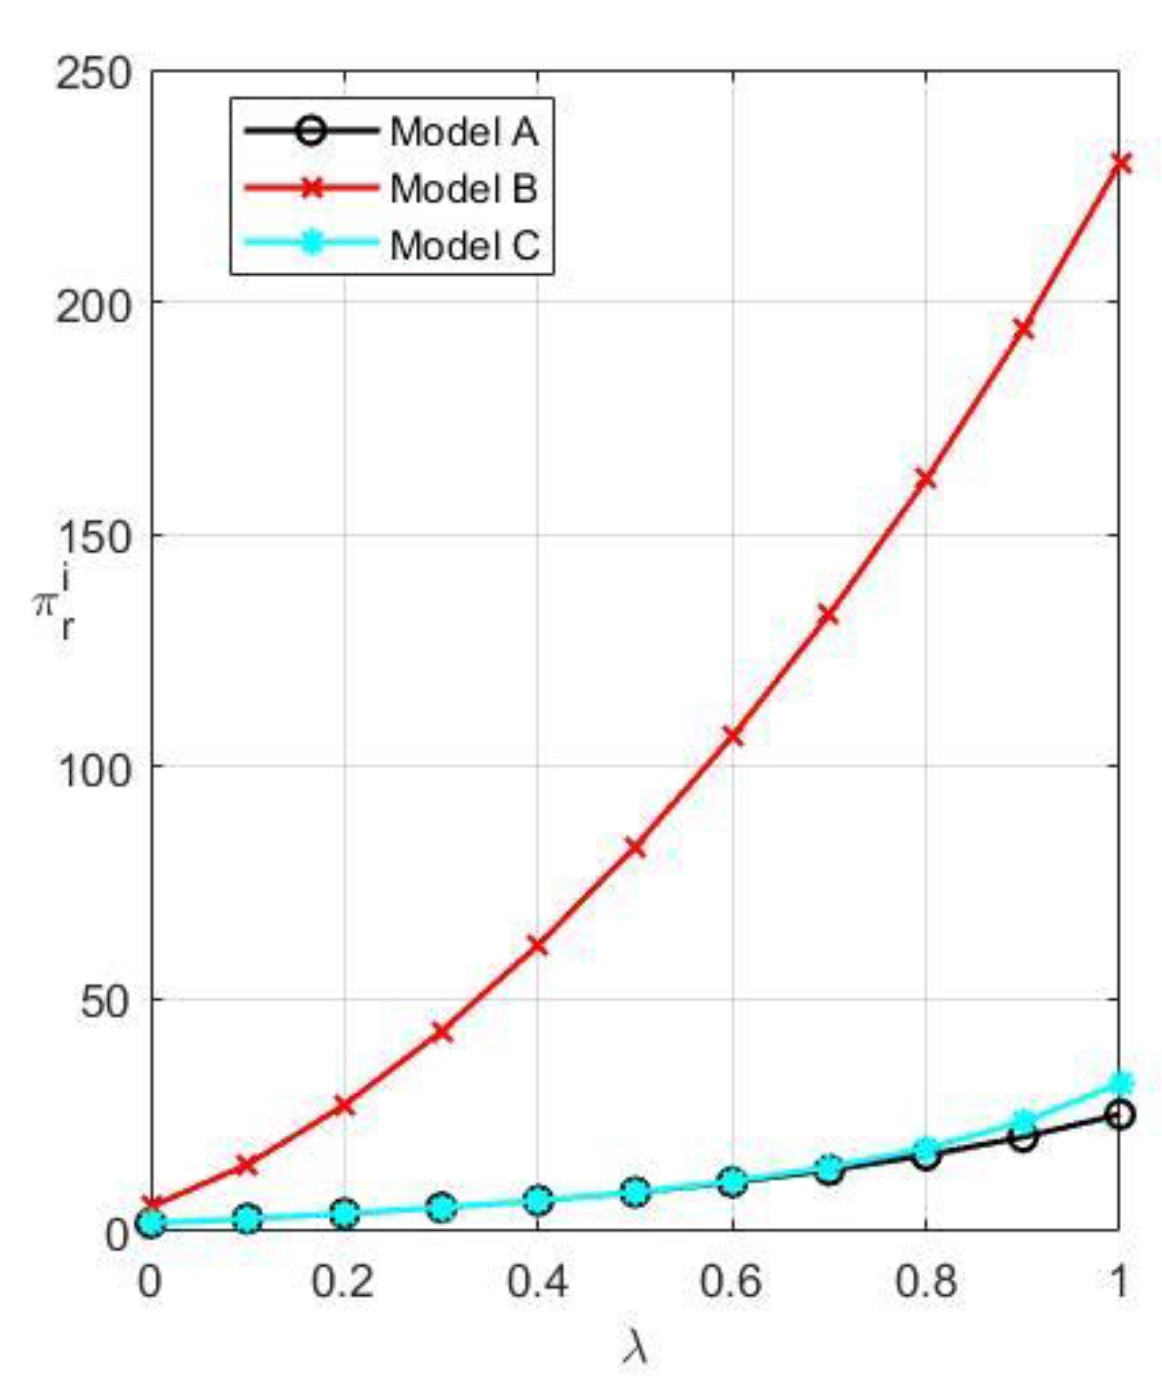
Figure 8. Additionally, M’s total profit steadily rises in Models C and A, while it gradually declines in Model B as customer willingness grows. The overall profit of R is the largest in Model B and the lowest in Model A, as shown in
Figure 9. In addition, M’s profit grows steadily in all three models as consumer willingness rises. The above phenomenon demonstrates that M favors collaboration anytime it is possible, but R will only collaborate when M holds the patent rights. Therefore, M should grasp the patent rights while actively seeking collaboration rather than promoting patent protection to oppose R. R will not have the intention to work with M until M obtains the patent rights. The two parties should now collaborate to increase the market acceptance of remanufactured products. Conversely, both parties should try to increase consumers’ willingness to pay for their products if M is unable to get patent protection. As observed in
Figure 10, collaboration is a better option to ensure the steady growth of CLSC. From the perspective of the profit of CLSC, the profit in Model C is the greatest and the lowest in Model B.
8. Conclusions
We consider the two-period closed-loop supply chain system composed of a manufacturer (M) and a remanufacturer (R). Three models—competition with patent protection, competition without patent protection, and the collaboration model—are constructed by considering the DfRem. These three models are solved using inverse induction, and numerical simulation is used to compare the prices, the DfRem levels, the recovery rates, the profits, and other aspects of the three models. In addition, we examine how different equilibrium solutions are impacted by consumers’ willingness to pay for remanufactured products. We have come to four conclusions. First, collaboration is more effective than the competition in raising DfRem standards. Second, the remanufacturer will only work with the manufacturer if the manufacturer has patent rights. In addition, the remanufacturer will work to increase the market acceptance of the remanufactured products to boost profits. Third, manufacturers are more inclined to collaborate. At the same time, they will utilize their patent rights to compel remanufacturers to work with them. Later, they will concentrate on increasing the market’s awareness of remanufactured products. Finally, cooperation is a better option to guarantee the steady growth of CLSC.
Manufacturers must complete the task of remanufacturing design under the weight of policy and environmental responsibility, while remanufacturers profit from its outcomes and create a free-rider effect, which is the main cause of the conflict between manufacturers and remanufacturers and the low level of remanufacturing design. As remanufacturers enter the market, some market shares are also divided, endangering the interests of manufacturers. Thus, manufacturers will also set high patent barriers on remanufacturers, which restricts the growth of remanufacturing. The conclusion of this research has brought some management enlightenment to manufacturers. First, manufacturers should aggressively employ remanufacturing design, since, despite its higher initial cost, it may ultimately benefit both the economy and the environment. Second, manufacturers should avoid using their channel dominance and patent rights to compete with remanufacturers and erect obstacles to patent protection, since this is detrimental to their long-term stable development and the establishment of the closed-loop supply chain. Instead, manufacturers should foster collaboration with remanufacturers by utilizing the benefits of patents. The findings of this study have given remanufacturers some management insight. First, remanufacturing design does not always result in a higher profitability for remanufacturers when manufacturers have channel dominance and patent rights. Therefore, even though the remanufacturer has little voice, it needs to take the manufacturer’s demand for cooperation seriously. It will be more beneficial to increase the remanufacturer’s profit to give up the sales rights of remanufactured products, resell all the remanufactured products to the manufacturer, or accept the contract of the cost-sharing of remanufacturing design under the cooperative mode. Second, remanufacturers should also focus their efforts on advertising and promotion campaigns to enhance the acceptance of remanufactured products.
As indicated, the following is an overview of the novel contributions in this paper: (1) The competition model takes into account how the DfRem and patent protection may affect M and R’s co-opetition strategy, which is more in line with reality; (2) We investigate a new method of cooperation for both parties against the background of the manufacturer being the market leader; (3) The maximizing of the total return for the two periods is treated as the decision-making objective of each side of the game in terms of solving the model, and the impact of a choice on the second period is taken into account while deciding in the first period; (4) The study will encourage manufacturers to support design for remanufacturing, foster the growth of remanufacturing, and foster mutually beneficial relationships between manufacturers and remanufacturers.
Significant opportunities exist for future research. First, we only consider the CLSC system composed of a manufacturer and a remanufacturer. In reality, more CLSC systems are composed of manufacturers, retailers, and remanufacturers, so we will increase the member of the CLSC system in future research. Furthermore, due to the uncertainty of market demand in reality, enriching the model in the environment of uncertain demand will also be the direction of future research.


