Article

What’s the Madder? Characterization of Old Fashioned Alizarin/Aluminum Red Pigments Using Liquid and Solid-State NMR

1
Department of Chemistry, UCIBIO, Faculty of Sciences and Technology, Universidade NOVA de Lisboa, 2829-516 Caparica, Portugal
2
Department of Conservation and Restoration, LAQV-REQUIMTE, Faculty of Sciences and Technology, Universidade NOVA de Lisboa, 2829-516 Caparica, Portugal
3
Department of Chemistry, CICECO, Universidade de Aveiro, 3810-193 Aveiro, Portugal
*
Authors to whom correspondence should be addressed.
Colorants 2023, 2(4), 601-617; https://doi.org/10.3390/colorants2040031
Submission received: 9 June 2023 / Revised: 23 July 2023 / Accepted: 25 August 2023 / Published: 30 September 2023

Abstract

:
This work provides significant insight into the molecular structure of alizarin lake pigments used by artists in the past. To characterize two red powders, lakes 1 and 2, obtained by complexation of 1,2-dihydroxy anthraquinone (alizarin) with Al3+, a multi-analytical approach was designed based on solid and liquid state Nuclear Magnetic Resonance Spectroscopy (NMR), Fourier-Transform Infrared Spectroscopy (FTIR), Mass Spectrometry (MS) and Density Functional Theory (DFT) calculations. Lake 1 was synthesized according to literature and compared with lake 2, a reproduction of an artist’s pigment. FTIR showed Al3+ coordinated to oxygens in C1 and C9, and that in lake 2 the -OH groups in C2 are protonated, being responsible for its low solubility. 1H-NMR proved that lake 2 is formed by two tautomers [Al(Aliz-2-H-)2(OH)(H2O)] and [Al(Aliz-10-H-)2(OH)(H2O)], the latter being the major species. SS-NMR was the only technique that got insight into the Al3+ coordination, octahedral for both lakes. It confirmed the existence of two species in lake 2, in a 5:1 ratio. Both are amorphous “open structures”, resulting in fewer constraints for the ligands and in a large variety of geometries. SS-NMR allowed the analysis of the red pigments without preparation, which is a unique advantage for their study in artworks.

Graphical Abstract

1. Introduction

Colors have always been important to humankind. They were crucial for the survival of our species, have significant social meanings, and are intimately related to art production [1]. In the early ages, humans started to explore colored materials and later produced their own. Among the different colors, red was particularly important, since it is the color of blood and thereby symbolizes life and death [2]. To know more about the importance of red in the past, its symbolic meaning, and how it was used to embody power and prestige, reference works by Pastoureau, Gage, and Brusatin are highly recommended [3,4,5]. A historical source of natural red dyes is the roots of plants belonging to Rubiaceae or the madder family, particularly Rubia tinctorum [6,7]. The roots of these plants contain considerable amounts of the coloring principle 1,2-dihydroxyanthraquinone (alizarin) in the form of its glycoside precursor ruberythric acid and aglycones [8,9,10]. Since antiquity, madder extracts have been used to dye fabric using a process called mordanting [11]. This process consists of the pre-treatment of fabric with a metal ion, which allows for the binding of the chromophore to the textile. Alum (AlK(SO4)2) was a very common mordant because of its availability and especially because of the brightness of the resulting colors [12]. This mordant also plays a role in the final hue, which can range from orange–red, red, pink, and purple [8]. The addition of alum or other suitable metallic salts to madder extracts results in the precipitation of a fine powder called lake pigment, which is widely used in paintings [13,14,15,16]. At the end of the 19th century, madder was almost entirely replaced by synthetic alizarin [17].
Although alizarin lake pigments are considered to be among the organic dyes that are most resistant to light-induced fading, they are prone to photodegradation [16,18,19,20,21]. Therefore, it is essential to know their chemical composition, how they bind to the support, and their degradation mechanisms to better preserve their artwork. The challenge is that the different substrates and procedures employed in the preparation of lakes, as well as the various biological sources used in natural dyes, result in a large range of potential chemical compositions. This is probably one of the reasons why so many different structures have been proposed by researchers in the last 100 years [22,23,24,25,26,27,28,29,30]. The molecular structure often considered a reference is the one proposed by Kiel and Heertjes [24], where the aluminum atom is coordinated to two alizarin ligands through one carbonyl group and the adjacent phenolate (1,9 coordination). A hydroxyl group and possibly a water molecule are also coordinated to the metal center (Figure 1).
In different complexes containing Sn [31], Ru [32,33,34,35], Zr [36], Ti [37], Ca [38], Mg [39], Zn [39], and Cu [39], alizarin can also behave as a catechol, coordinating to the metal through the two phenolate groups (1,2 coordination). In fact, in some cases, these two forms of coordination are interconvertible in solution depending on the pH of the medium [13,19].
Although the 1,9 coordination is most commonly attributed to aluminum–alizarin lakes, in 1994, Wunderlich et al. obtained an X-ray structure of a dimeric complex [{Al(L)2(μ-OH)(μ-Ca)}2], L = aliz2−, where the aluminum atom occupies both phenolate (1,2) positions [26]. The two monomers are bonded by the Ca2+ ions, which coordinate to a pair of alizarinates through oxygens in positions C1 and C9 and the μ-OH ligands. Despite these results, some authors continued to support the 1,9 coordination of aluminum based on infrared and UV-visible spectroscopy, mass spectrometry [28], and solid-state NMR [27]. However, in most cases, lakes are synthesized using procedures that do not resemble those employed in ancient times. For instance, solid-state NMR studies have been performed on compounds obtained from the reaction between alizarin and Al2(SO4)3 in basic conditions and collected in a hot aqueous solution. Clearly, the solubility in warm water is a great disadvantage for a pigment. The general structure proposed by Soubayrol for these lakes is presented in Figure 1, and the compound with sodium counter-ions (here named as lake 1) was synthesized according to the literature. This compound is used for comparison in this work.
Recently, as an approximation of traditional recipes, Zhuang et al. studied the structure of non-stoichiometric alizarin lake pigments (Az/Al3+ = 1:5 to 1:200) prepared at pH = 7 using 27Al and 13C magic angle spinning (MAS) NMR. They proposed that Al3+ complexed with alizarin at the phenolate (1,2) positions forms major hexa- and minor penta- and tetra-coordination structures [15].
However, we know based on ancient recipes that lake pigments were precipitated in solutions with pH values near 5–6 [22,40]. To reproduce these conditions, alum (AlK(SO4)2) was added to a basic solution of alizarin until a red powder started to precipitate close to a pH value of 5 (cf. Experimental Section, lake 2). Lakes prepared following this method are insoluble in water and in most organic solvents but are soluble in DMF and DMSO and partially soluble in ethanol.
Lakes 1 and 2 are both amorphous red powders. In this work, they were characterized using solid and liquid state NMR, FTIR, and ESI-MS. Overall, this work will support breakthroughs in characterizing the intrinsically complex structures of madder reds as well as optimizing analytical tools for identifying madder reds in artworks, particularly using in situ techniques [8,21].

2. Materials and Methods

2.1. Synthesis of the Alizarin Complexes and NMR Characterization

Colorants 02 00031 i001
Lake 1. Aluminum–alizarin lake 1 was prepared according to procedures described in the literature [27].
1H NMR (DMSO-d6 solution): δ 8.36 (d, 3JHH = 8.0 Hz, H8, 2H); 8.03 (d, 3JHH = 8.0 Hz, H5, 2H); 7.75 (t, 3JHH = 8.0 Hz, H7, 2H); 7.69 (t, 3JHH = 8.0 Hz, H6, 2H); 7.36 (d, 3JHH = 8.0 Hz, H4, 2H); 6.25 (d, 3JHH = 8.0 Hz, H3, 2H); 3.34 (s, H2O, 5H); 3.10 (s, Al-OH, 1H). 13C{1H} (DMSO-d6 solution): δ 182.7 (C9), 179.6 (C10), 168.3 (C2), 162.1 (C1), 135.5 (C5q), 134.8 (C8q), 132.2 (C6 or C7), 132.1 (C7 or C6), 126.1 (C8), 125.6 (C5), 121.7 (C4), 118.6 (C4q), 113.6 (C1q), 111.7 (C3).
208.5 MHz 27Al MAS: δ 25.9; 19.4
Lake 2. Aluminum–alizarin lake 2 was prepared following a simplified version of procedures described in ancient treatizes. Alizarin (0.05 g; 0.2 mmol) was dissolved in 500 mL of distilled water and basified to pH 11 with a few drops of 3.3 m NaOH (aq). Complete dissolution of the dye was achieved through sonication and magnetic stirring. A 0.2 m solution of AlK(SO4)2 (or 0.5 m AlCl3) was added dropwise while stirring until the precipitation of a fine red powder was detected (around pH 5). The mixture was left undisturbed still for a few hours and then vacuum filtered. The bright red solid was repeatedly washed with distilled water and dried at 110 °C for over 12 h. Approximately 0.06 g of dark-red powder was obtained.
1H NMR (DMSO-d6 solution; M and m refer to the major and minor species, respectively): δ 8.06–8.13 (superimposed m, H8M + H5M + H8m + H5m, 6H); 7.75 (m, JHH = 3 Hz, H6m + H7m, 2H); 7.69 (m, JHH = 3 Hz, H6M + H7M, 4H); 7.48 (d, 3JHH = 8.0 Hz, H4m, 1H); 7.41 (d, 3JHH = 8.0 Hz, H4M, 2H); 6.63 (d, 3JHH = 8.0 Hz, H3m, 1H); 6.34 (d, 3JHH = 8.0 Hz, H3M, 1H); 3.31 (s, H2O, 83H). 13C{1H} (DMSO-d6 solution): δ 182.0 (C9m), 181.4 (C9M), 180.9 (C10m), 180.3 (C10M), 167.9 (C2M), 165.7 (C2m), 161.7 (C1M), 159.4 (C1m), 135.9 (C5qM or C8qM), 135.3 (C5qm or C8qm), 134.5 (C8qM or C5qM), 134.1 (C8qm or C5qm), 132.8 (C6m or C7m), 132.5 (C7m or C6m), 132.2 (C6M or C7M), 131.8 (C7M or C6M), 126.1(C5m or C8m), 126.0 (C5M or C8M), 125.8 (C8m or C5m), 125.6 (C8M or C5M), 121.0 (C4qm), 120.7 (C4M), 120.4 (C4m), 119.7 (C4qM), 115.0 (C1qm), 114.1 (C1qM), 113.2 (C3m), 111.8 (C3M).
208.5 MHz 27Al MAS: δ ca. 39; ca. 14; ca. 8.6

2.2. NMR Spectroscopy

NMR measurements were performed at room temperature using a Bruker Avance III 400 MHz spectrometer for liquid-state NMR and a Bruker Avance III 800 MHz spectrometer for solid-state NMR. For the liquid-state NMR experiments, deuterated dimethyl sulfoxide (DMSO-d6), 99.8% D, supplied by Eurisotop, Cambridge Isotope Laboratories, Inc. (Tewksbury, MA, USA), was used. The 1H diffusion-ordered spectroscopy (DOSY) assays were obtained using the stimulated echo pulse sequence with a bipolar sine-shaped gradient pulse and eddy current delay before the detection (pulsed field gradient spin echo—PFGSE). For each of the 1H DOSY experiments, 32 spectra were acquired with increasing gradient strengths (incremented in a linear ramp from 5% to 98% of a maximum gradient strength of 0.54 Tm–1) with 32 K data points, a spectral width of ∼4800 Hz, a 1 s relaxation delay, an eddy current delay set to 5 ms, and a gradient delay of 1–2 ms. The magnetic field pulsed gradient length (δ) and diffusion time (Δ) used for the different measurements were optimized in each experiment in order to achieve an effective signal attenuation corresponding to 3% of the signal intensity at a maximum gradient strength (98%). The DOSY spectra were obtained after performing a standard Fourier transform, phase correction, and baseline correction of the F2 dimension using the Bruker Topspin software package (version 3.6).

2.3. Micro-Fourier Transform Infrared Spectroscopy

Infrared analyses were performed using a Nicolet Nexus spectrophotometer coupled to a Continuμm microscope (15× objective) with an MCT-A detector. The spectra were collected in transmission mode in 50 µm2 areas with a resolution 4 or 8 cm−1 and 128 scans using a Thermo diamond anvil compression cell. A background was acquired before obtaining each sample spectrum. The CO2 absorption at ca 2400–2300 cm−1 was removed from the acquired spectra (4000–650 cm−1). To improve the robustness of the results, at least two spectra were acquired in different areas for each sample.

2.4. Mass Spectrometry

The mass spectra were acquired in the positive-ion mode using a 500-MS ion-trap mass spectrometer with electronspray ionization (ESI) (Varian, Palo Alto, CA, USA). ESI-MS analyses were performed in methanol, but a few drops of DMF had to be added to lake 2 to dissolve all the material. The operating parameters were optimized for the sample ScMF1 as follows: the spray needle voltage was set to ±5.7 kV, nitrogen was used both as the nebulizing and drying gas (35 psi and 15 psi, respectively), the drying gas temperature was 350 °C, the capillary voltage was 157 V for positive ions, and an RF loading of 94 V was used.

2.5. DFT Calculations

The structures of lake 1 [{Al(Aliz2−)2(μ-OH)}2]4−, Kiel and Heertjes lake with Na+, [Al(Aliz2−)2(μ-OH)]Na2, lake 2 tautomer 2M [Al(Aliz-10-H)2(OH)(H2O)] and lake 2 tautomer 2 m [Al(Aliz-2-H)2(OH)(H2O)] were build using the Spartan 14v112 (2013) Wavefunction, Inc., Irvine software. Equilibrium Geometry and NMR chemical shifts were calculated using the EDF2 Density Functional model with the 6–31G* basis set.

3. Results

3.1. Mass Spectrometry Characterization

For lake 1, the most intense peak in negative mode corresponded to formula [AlL2(OH)]H·(H2O)2 (m/z = 557), and a low intensity signal at m/z = 1137 was attributed to the dimer [Al2L4(OH)2]H2Na·(H2O)4. In the positive mode, both the monomer [AlL2(OH)]HNa2·(H2O)2 (m/z = 603) and dimer [Al2L4(OH)2]H2Na3·(H2O)4 (m/z = 1183) show the most intense peaks. These results corroborate Kiel and Heertjes’ structure as well as the dimer proposed by Soubayrol (Figure 1), although some of the sodium ions seem to be replaced by protons during ionization.
Sanyova used this same technique to analyze 1:2 aluminum–alizarin gelling solutions and obtained evidence of a three-dimensional gel network where the monomer is [Al(LH)2(OH)]·(H2O)3. According to the author, this structure not only confirms the 2:1 aliz:Al ratio of the complex, but also suggests that the O in position C2 is protonated, which means that the site for complex formation is on the oxygens in positions C1 and C9. Nevertheless, it is possible that protonation of alizarin occurs during the ionization process.
For lake 2, the most intense peaks correspond to species containing coordinated DMF, such as [AlL(LH)(DMF)]Na (m/z = 600), [AlL(DMF)(H2O)] (m/z = 356), [Al2L2(CH3O)(DMF)] (m/z = 634), [Al(LH)2(DMF)] (m/z = 578), and [Al2L2(OH)(DMF)], m/z = 620). For the less intense peaks, the ratio of aliz:Al was not constant, likely due to the degradation of the species containing coordinated solvent.

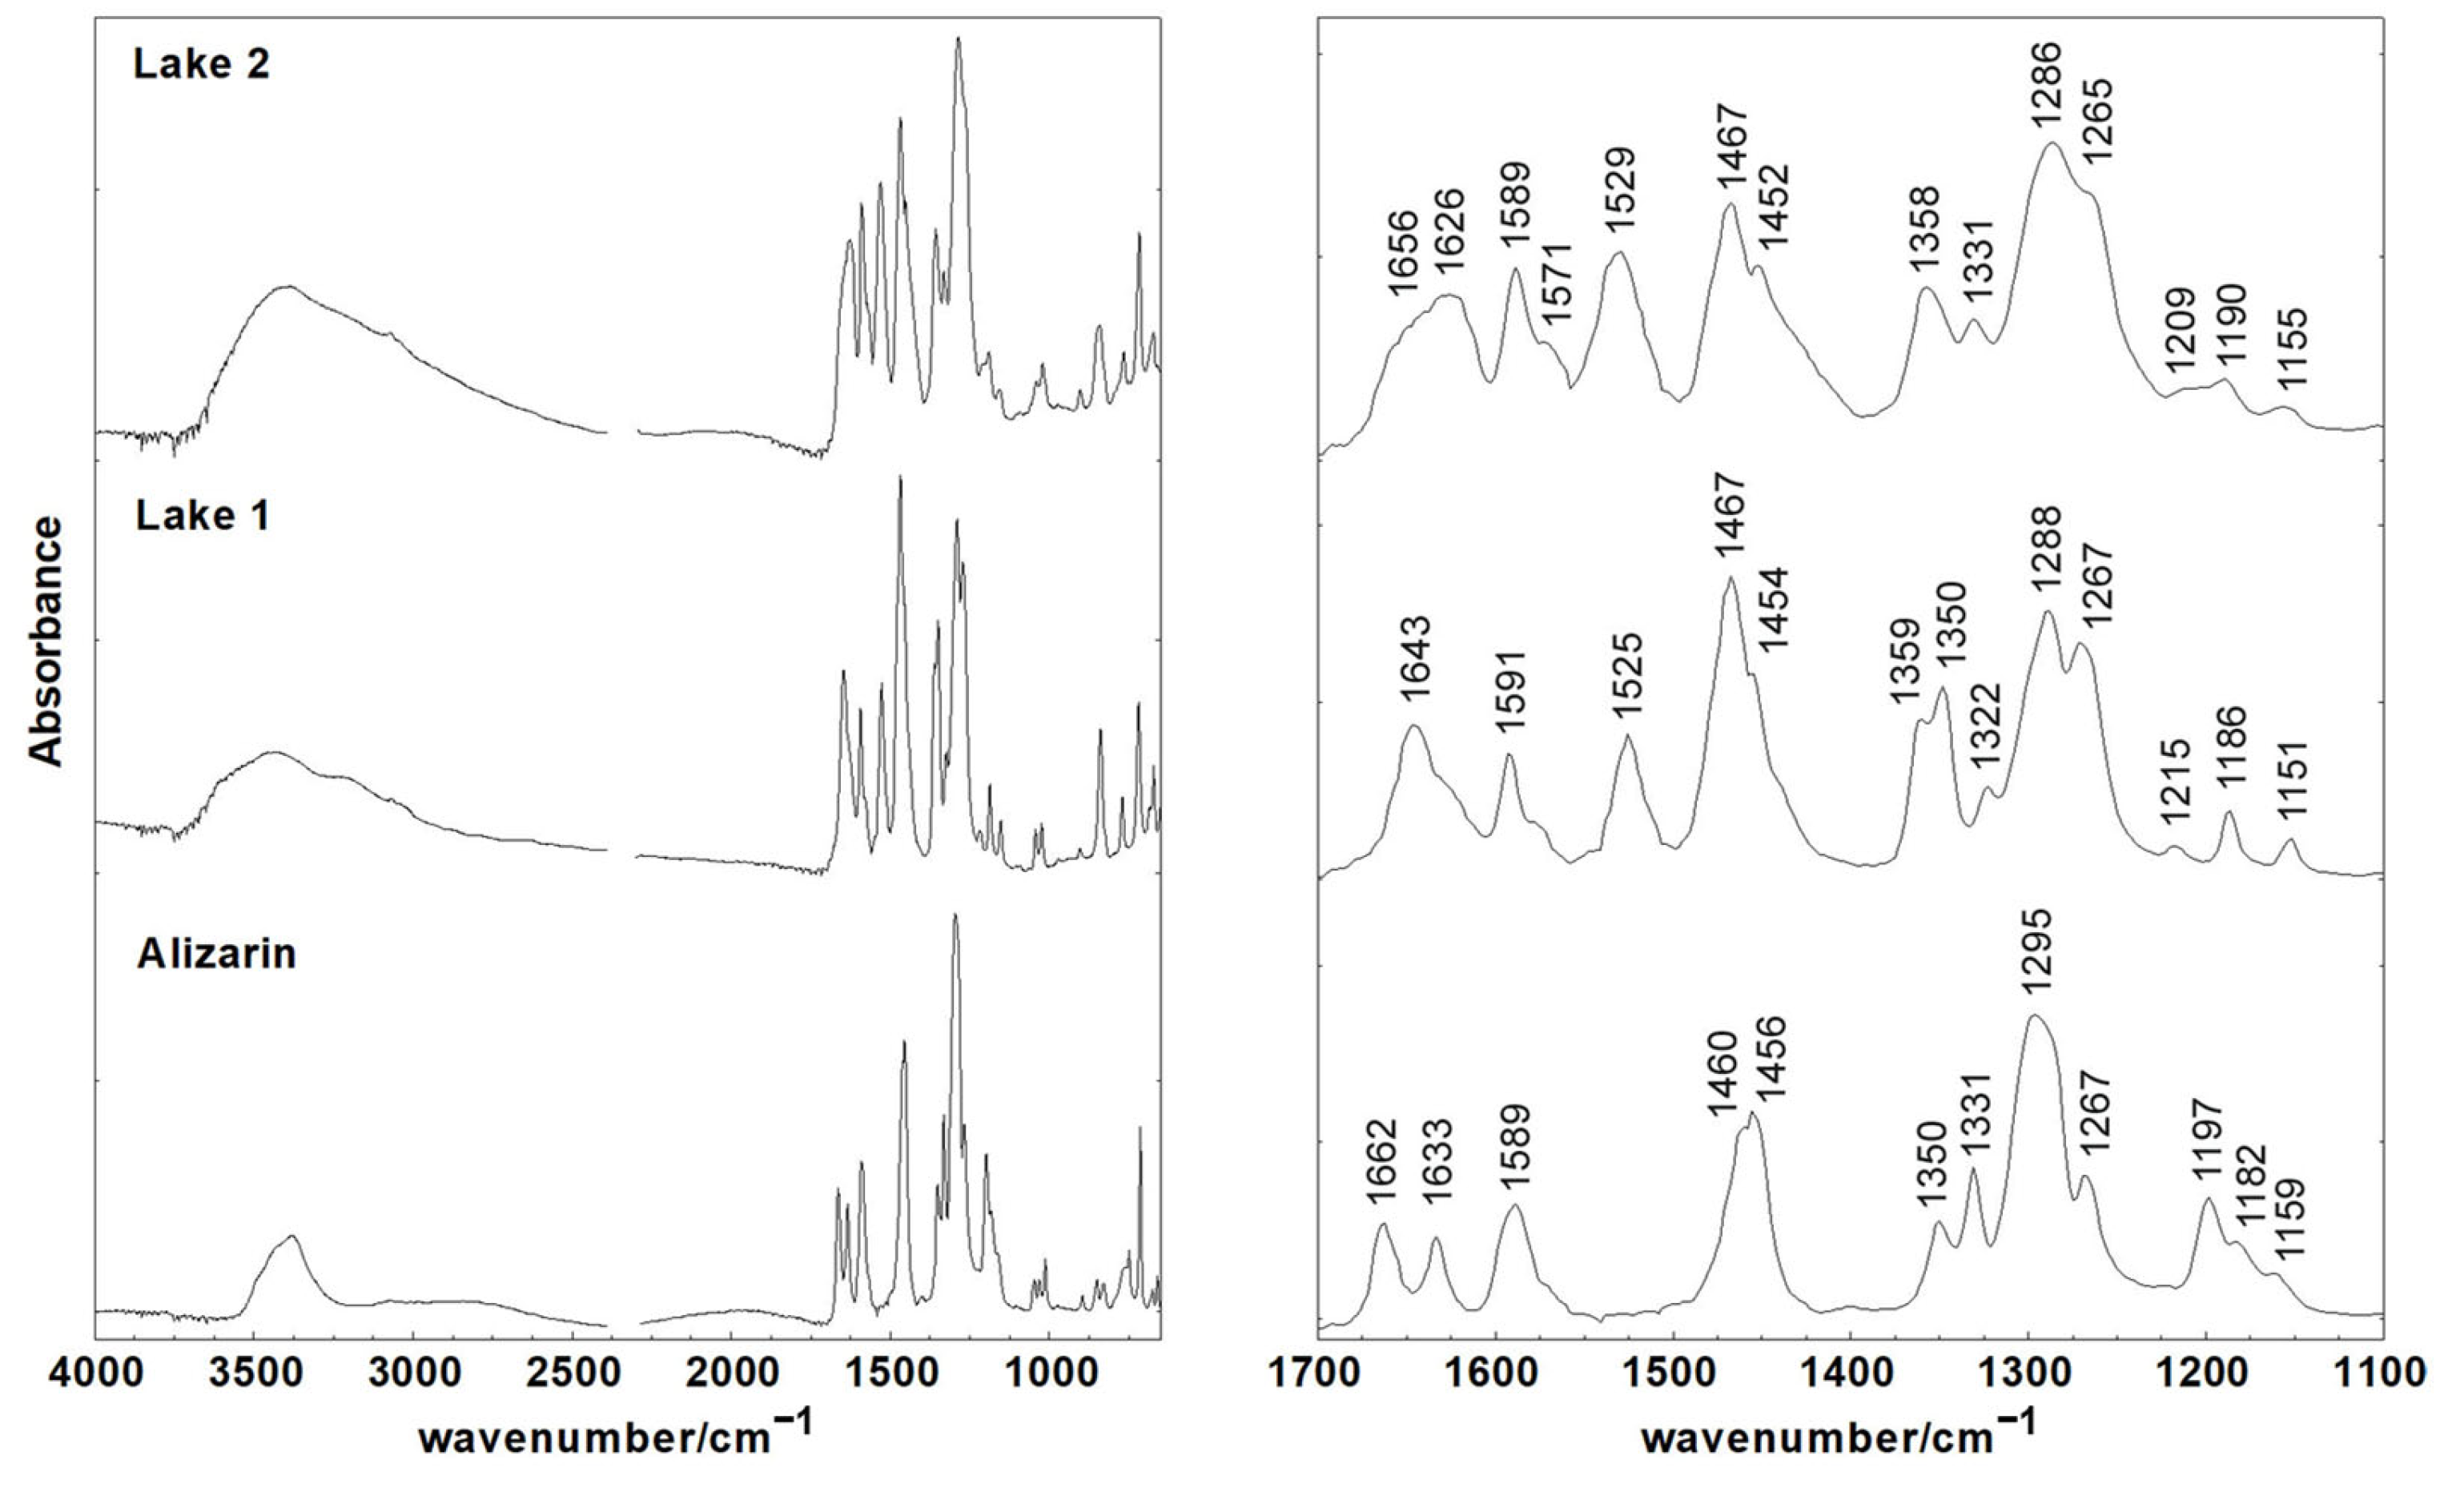
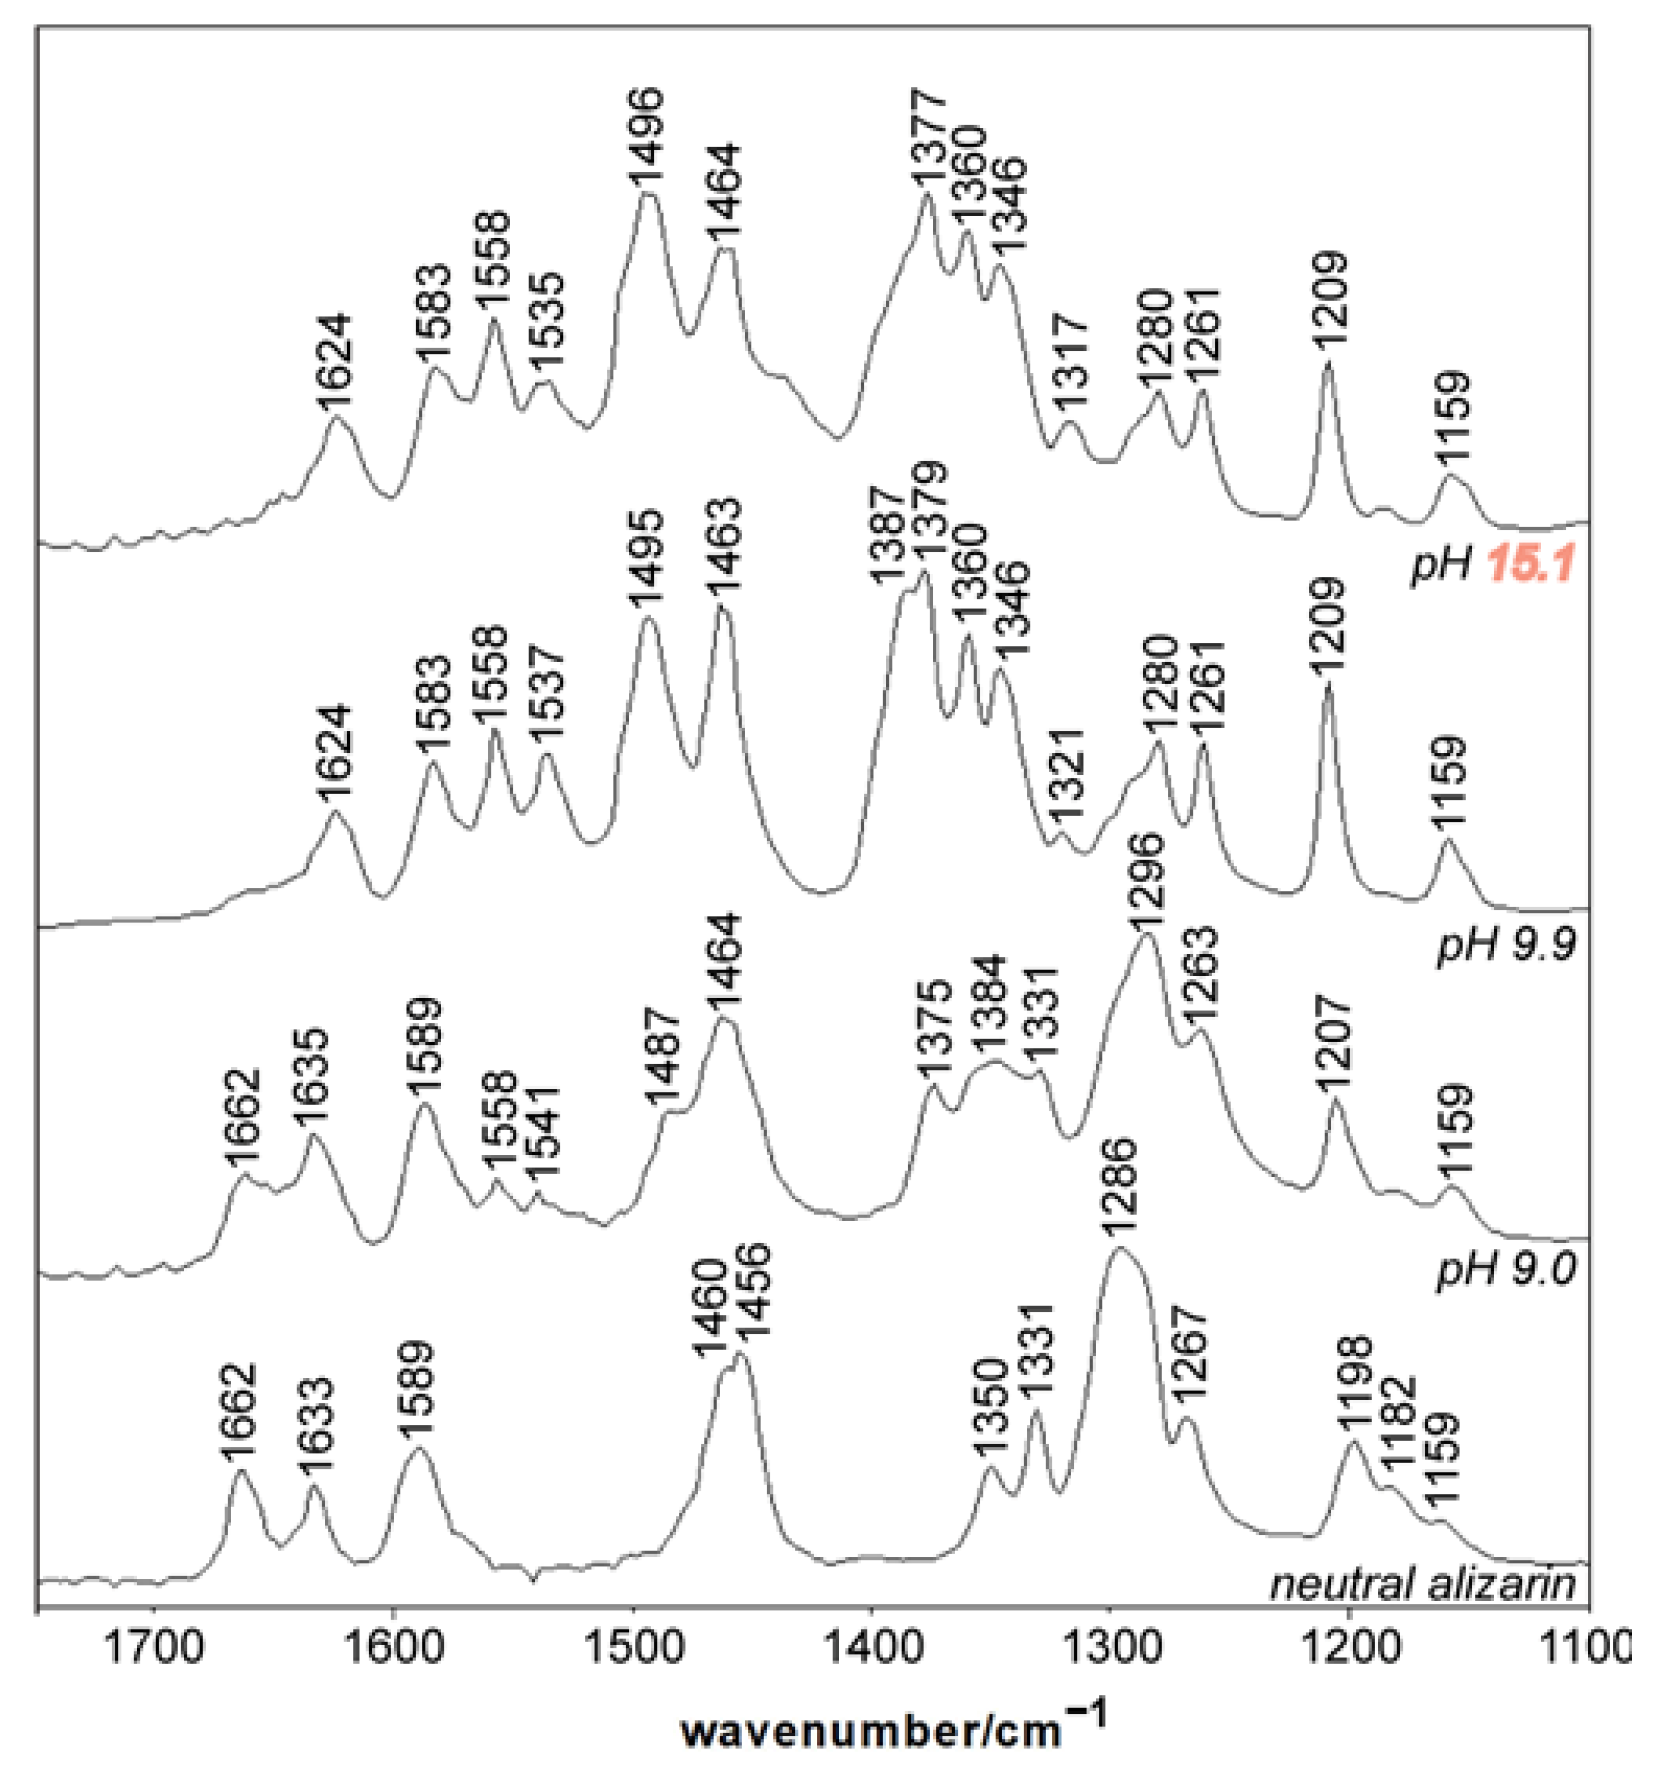
3.2. Characterization of Alizarin Lake Pigments by Infrared Spectroscopy

The infrared spectra of alizarin and the corresponding lakes are presented in Figure 2, and the most important absorption frequencies are listed in Table 1. The assignments of the alizarin bands were based on the literature [41].
The broad and intense band near 3400 cm−1 results from the vibration of hydration water and alizarin 2C–OH groups, when present. In neutral alizarin, the two carbonyl groups have distinct absorption bands due to the molecule asymmetry: 10–CO stretching band appears at 1662 cm−1, while 9–CO stretching vibration is shifted to lower frequencies at 1633 cm−1. This shift has been justified by contradictory hypotheses [41,42,43] and will be addressed by this team in a future publication.
It is well known that the coordination of alizarin to a metal center or the formation of alizarinate salts results in only one carbonyl stretching band in the frequency range where these groups appear in neutral alizarin [28,31,32,33,34,35,38]. One possibility is that the two carbonyls become equivalent as a consequence of the salt formation in the phenolate groups combined with an equivalent electronic resonance between the 1–, 2–CO- and 9–, 10–CO groups [38]. Another possibility is the disappearance, or at least a pronounced shift, in the 9–CO vibration band as a result of the metal coordination to oxygens 1 and 9, which would give rise to a chelate ring vibration with a completely different frequency. In fact, lake 1 exhibits only one carbonyl band, which is slightly shifted to lower frequencies (1643 cm−1) compared to free alizarin. Lake 2 shows broad multiple bands covering the entire region between 1660 and 1620 cm−1. These bands can be assigned to the uncoordinated 10–CO group, and the more complex pattern of lake 2 is likely because this pigment is an amorphous mixture of different species, as will be shown later.
Additionally, both lakes present an intense band near 1530 cm−1 that is absent in alizarin’s spectrum. This feature is characteristic of acetylacetonate-like complexes [35], suggesting that alizarin is, in fact, coordinated to aluminum through carbonyl 9–C=O and the adjacent phenolate group 2–CO [31,32,44,45,46]. The other possibility for aluminum coordination, involving the two phenolate groups 1–CO and 2–CO, is expected to give a pattern similar to metal–oxalate complexes. These compounds exhibit characteristic bands near 1433–1388 cm−1 and 1302–1236 cm−1, corresponding to νs(C–O) + ν(C–C) and νs(C–O) + ν(O–C=O), respectively [46]. In both lakes, the absence of any band in the first interval and the presence of one band near 1530 cm−1, which is not expected for metal–oxalate complexes, indicate that aluminum is coordinated to the oxygens in positions C1 and C9.
The differences between the infrared spectra of lakes 1 and 2 are subtle and consist mainly of intensity variations in C=O and COH vibration bands, which are sensitive to deprotonation. To follow this effect in the chromophore, sodium hydroxide was added to a solution of alizarin in DMSO containing residual water, and aliquots were taken at different pH values: 9.0, 9.9, and 15.1. After that, the solvent was evaporated to dryness and the infrared spectra of the solid residues were collected (Figure 3).
According to the alizarin titration curve obtained from a DMSO-d6 solution containing residual water (Figure S1), the dissociation constant of the most acidic hydroxyl group 2–OH (pKa1) was between 8 and 9, and the one corresponding to hydroxyl 1-OH (pKa2) was 11.6. This means that the extract obtained at pH 9.0 should contain a mixture of neutral (AlizH2) and monoanionic alizarin forms (AlizH), although the red color of the ionic species prevails. At approximately pH 14, only the dianionic species Aliz2− exists in solution, which explains the blue color of this extract. At pH 9.9, we expect a mixture of mono- and dianionic species, resulting in a violet solution.
Above pH 9, the deprotonation of the 2-OH group results in the fading of one carbonyl band, and at the same time, the appearance of new bands near 1558, 1540 and 1490 cm−1. Similar observations were made for 1,2-dihydroxyanthraquinone-3-sulphonate (alizarin red S or ARS) [47]. Following the same interpretation that Holmgren et al. [48] provided for this compound, we can assume that the band at 1624 cm−1 corresponds to carbonyl 9–CO, and the disappearance of the 10–CO band, together with the newly observed vibrations, is the result of an equilibrium involving the resonance structures presented in Figure 4, which resemble those proposed by Bloom for neutral alizarin [43]. This modification in the resonance system also results in strong absorption bands between 1380 and 1340 cm−1. The further deprotonation of phenol 1-OH at higher pH values only influences the intensities of some bands and induces small frequency shifts.
In summary, removing alizarin β–OH hydrogen will result in the appearance of bands near 1496 and 1380–1340 cm−1 and the diminishing of the bands near 1290 cm−1. In the same way, the bands at 1467, 1359, and 1350 cm−1 are somewhat more intense in lake 1 than in lake 2, as shown in Figure 2. It also appears that the band near 1288 cm−1 is slightly less intense in lake 1 than in lake 2, although the differences are not very clear. These observations indicate that lake 2 may contain species with protonated alizarin ligands. Nevertheless, the differences in the infrared spectra of both lakes are not very evident, likely because the metal complexation to phenolate 1, even if 2–OH group is protonated, induces a large electronic delocalization in the aromatic system that leads to a structure which is very similar to the dianionic alizarin form. However, other important evidence lies in the absorption band at 1331 cm−1. This band is present in neutral alizarin, but shifts to a less intense band near 1320 cm−1 in the extract obtained at pH 9.9, in which the species AlizH and Aliz2− coexist. As a result, this band can be attributed to the vibration of the 2–COH group. In fact, DFT calculations predict an intense band at 1333 cm−1 only for complexes with protonated 2–OH groups, corresponding to ν(CC) + ν(2–CO) + δ(2–COH). Lake 2 shows one band at 1331 cm−1, like neutral alizarin, while in lake 1, this band is shifted to 1322 cm−1 (Figure 2). This suggests, once again, that the “traditionally made” lake 2 may contain complexes with protonated 2–OH groups. This explains two important pictorial properties of these materials: the semi-protonated complexes are responsible for the lower solubility in water and brighter red colors of lake 2, whereas lake 1 presents a violet hue and is sparingly soluble in water.
For both lakes, dissolution in DMSO does not seem to change the overall pattern of the infrared spectra, even though the resolution is increased, indicating that the lakes’ nature is maintained in solution. Although some of the subtle differences between the two lakes vanish in these conditions, the bands at 1469 and 1345 cm−1 are still more intense in lake 1, in agreement with a bis-anionic alizarin form.

3.3. Characterization of Alizarin Lake Pigments using Proton NMR Spectroscopy

The proton NMR spectra of lakes 1 and 2 in DMSO-d6 show that a single compound forms the former, while the latter contains two different species with an approximately 1:2 ratio, considering that both of them have the same number of alizarin ligands (cf. Experimental Section and Figure S3. There is no evidence of exchange processes between the two species present in lake 2 up to 353 K, and the ratio between them is not affected by temperature. We will denote the complex with higher intensity resonances as 2M (from major) and the one with lower intensities as 2m (from minor). All the resonances were assigned based on COSY, NOESY, HMQC, and HMBC techniques.

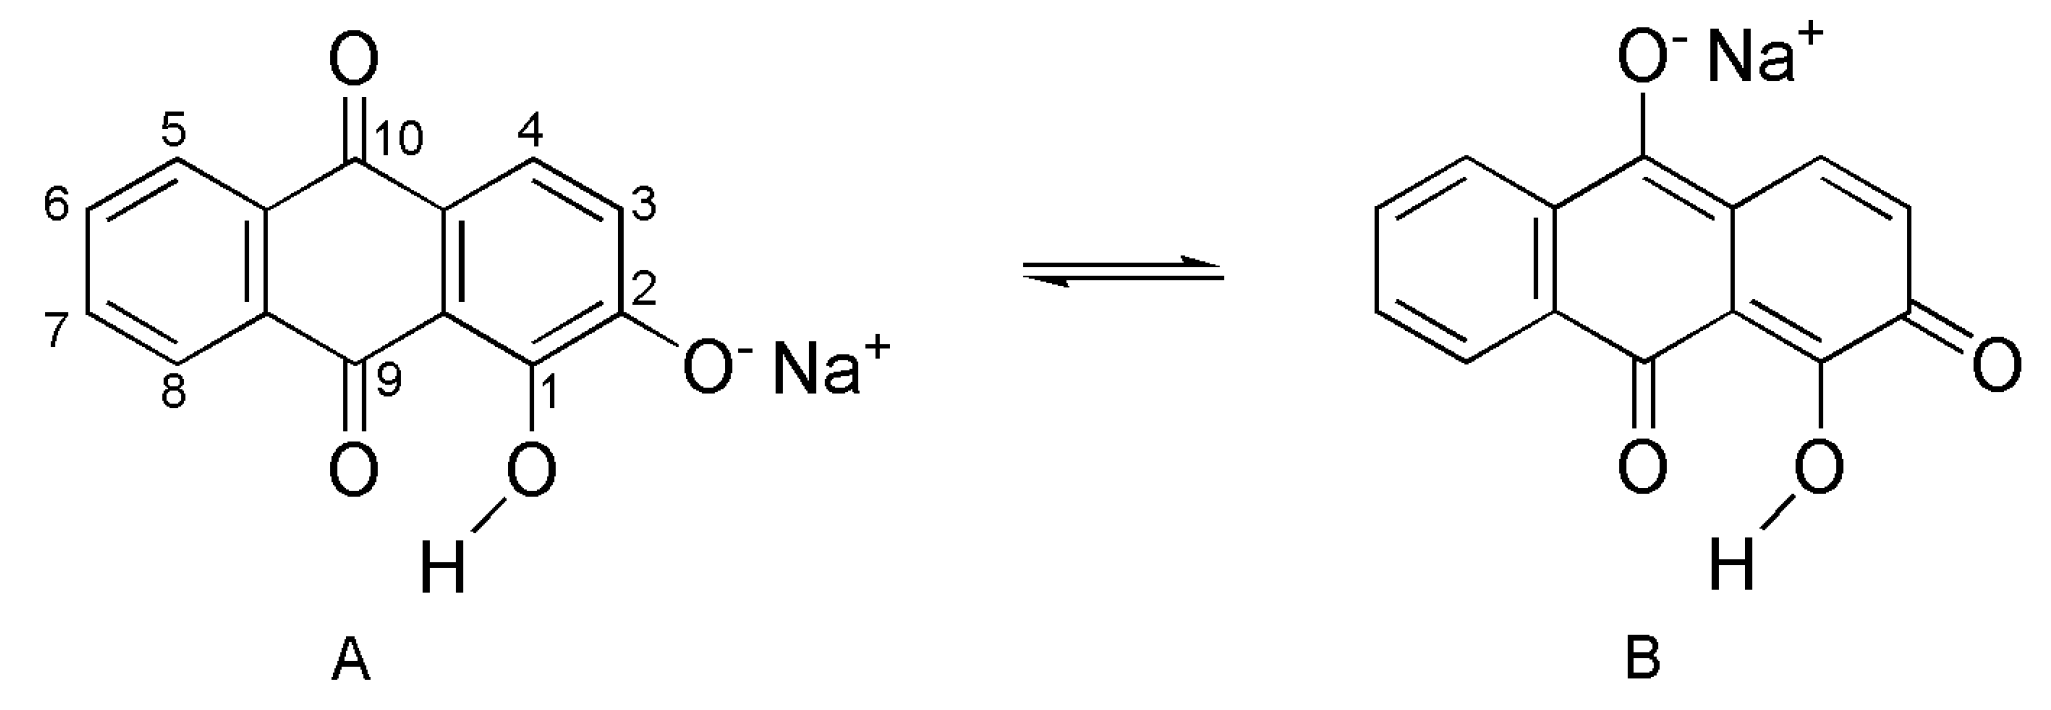
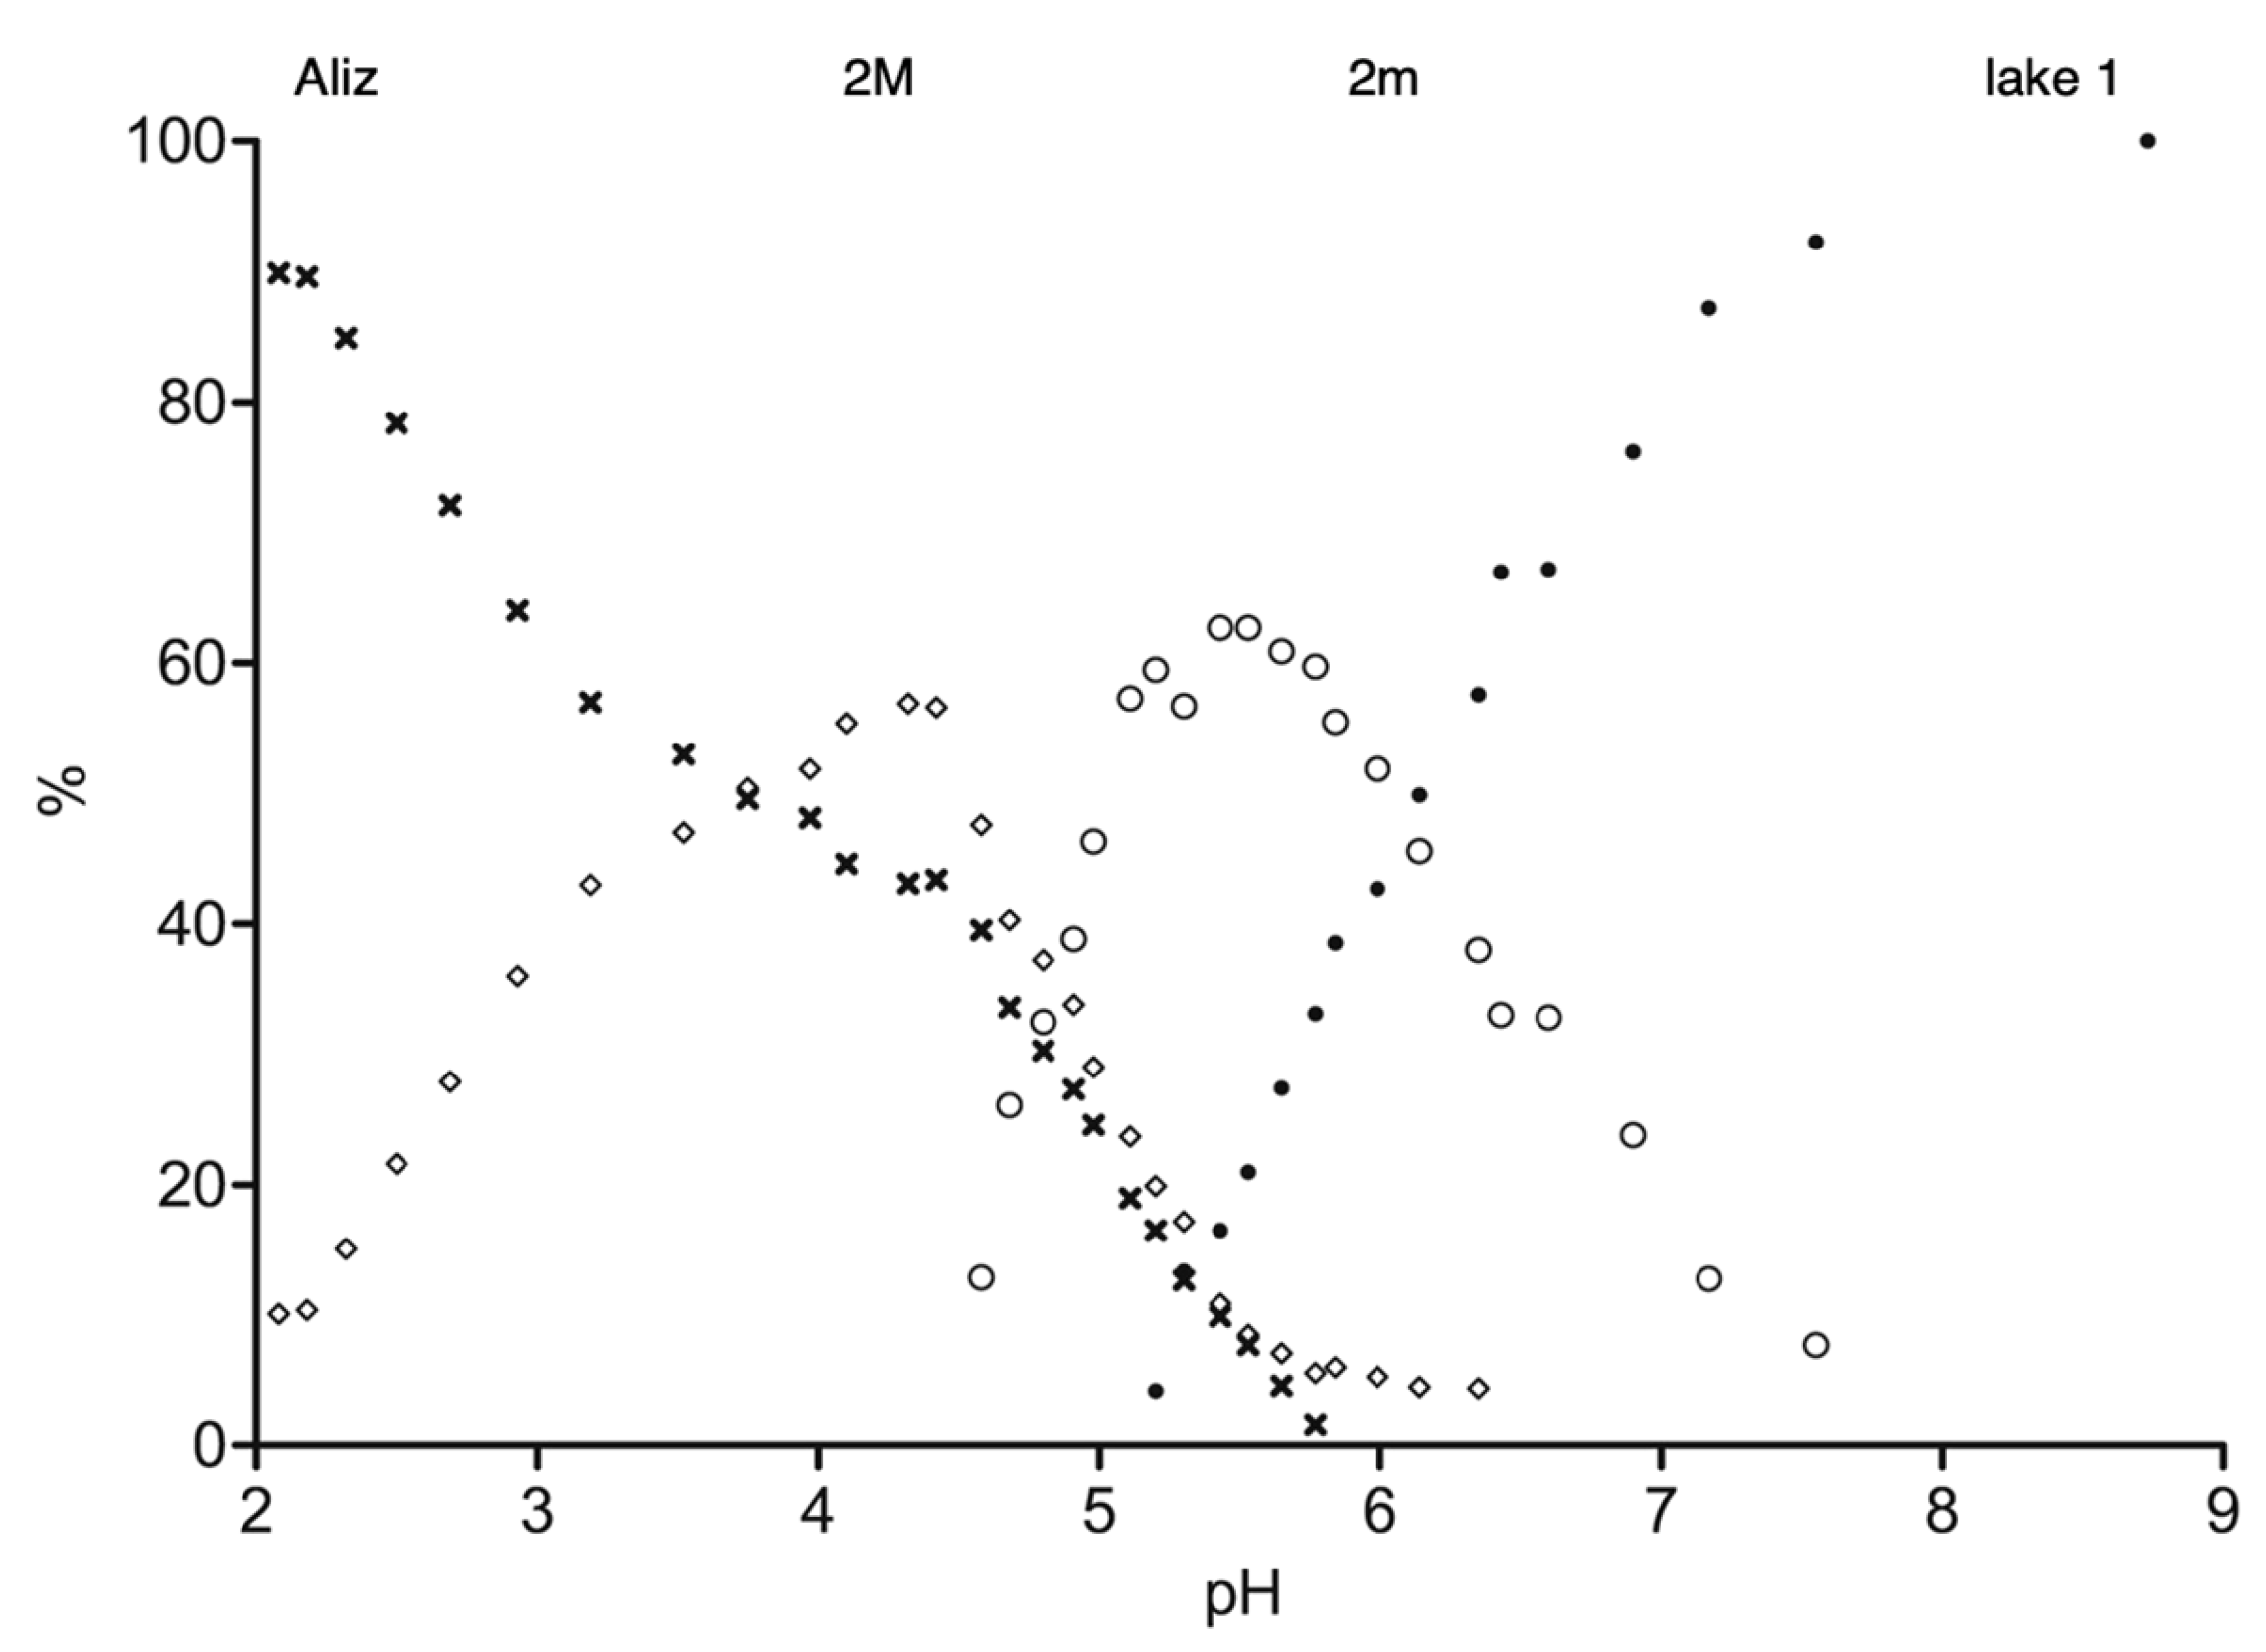
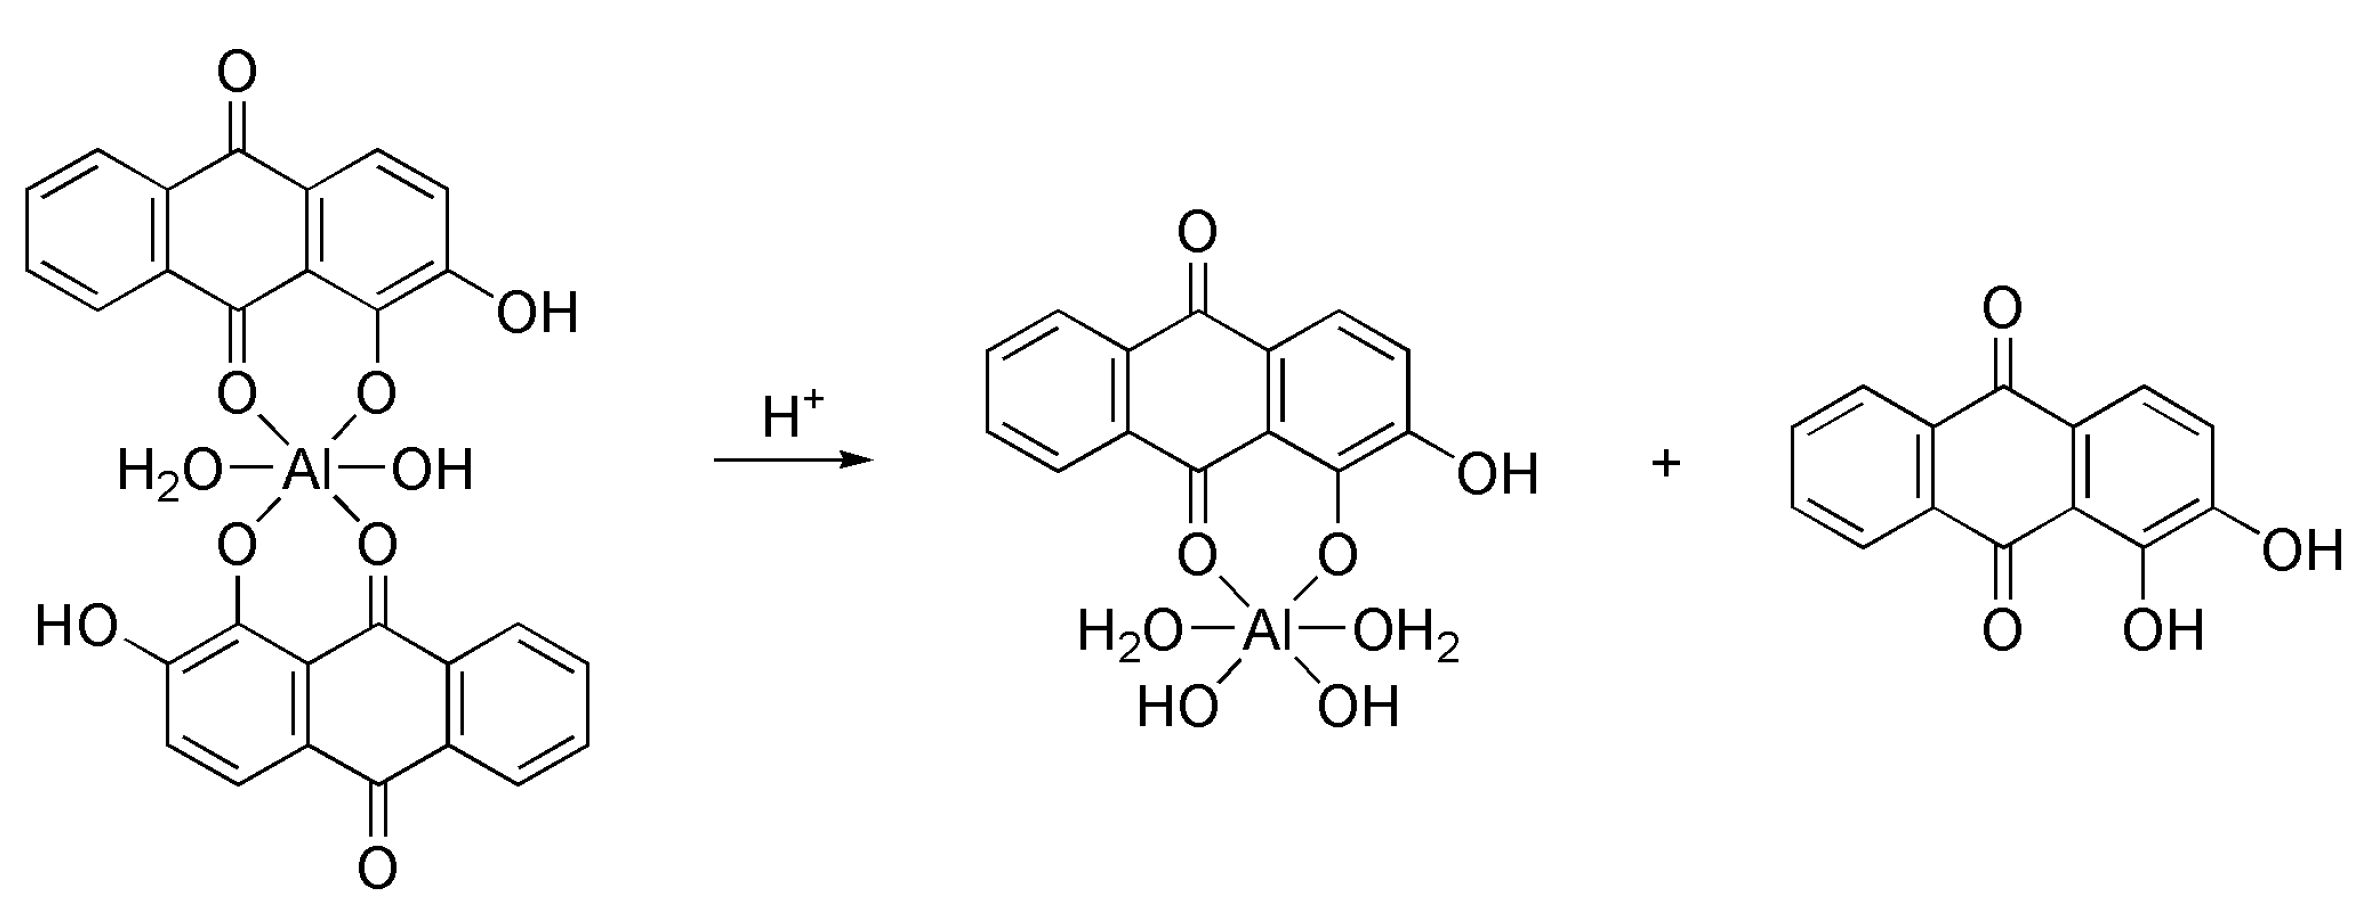
3.3.1. Interconversion between Lake 1 and 2 as a Function of pH

In solution, lake 1 and the two species present in lake 2 convert to each other when the pH changes, as seen in Figure 5, Figures S2 and S3. When a DCl solution is added to lake 1, species 2M starts to form at approximately pH 8, although some of its resonances are broad, possibly due to exchange processes, with small amounts of alizarin formed during the process. Near pH 6, complex 2 m is formed, and both species coexist until pH 4.5. Since precipitation of the lake pigment in aqueous solutions occurs between pH 5 and 5.5, a mixture of two different species is obtained instead of a single compound. Further addition of acid will result in the full protonation of the alizarin ligands and destruction of the complexes.
There is an evident downfield shift of proton H3 (and, on a smaller scale, in H4) when acid is added to lake 1, resulting in species 2M and 2m, as shown in Figure S2. Likewise, when both lakes are mixed in the same DMSO-d6 solution, the chemical shift of H3 in lake 1 (6.24 ppm) is shifted to higher fields compared to 2M (δ 6.44), specially 2m (δ 6.64). Another important change occurs in protons H5 and H8. While these two resonances are fairly separated in lake 1 with a difference of 0.3 ppm, in lake 2, the difference in chemical shifts is small (0.04 ppm in 2M) or even nonexistent (in 2m).
As can be seen in Figure S4, the reverse changes are observed when NaOD is added to alizarin in DMSO-d6. The chemical shift of H3 is highly influenced by the nature of the neighboring 2–OH group, shifting to higher fields when this group is deprotonated. This suggests that the main difference between lake 1 and both lake 2 species is that the uncoordinated 2–phenolate group is protonated in the second case. On the other hand, in free alizarin protons, H5 and H8 seem to be only affected by the nature of phenol 1, since the difference in their chemical shifts is maintained after the deprotonation of phenol 2 (near pH 9) and only increases when the less acidic group (1–OH) is ionized above pH 12. However, this does not explain the differences between lakes 1 and 2, as in these species, phenolate 1 must be necessarily ionized in order to coordinate with the aluminum atom.
The evidence suggests that lake 1 is formed by an anionic alizarin:aluminum complex, like the dimer [{Al(Aliz2−)2(μ-OH)}2]4− proposed by Soubayrol [27]. Although it has been detected through ESI-MS analyses performed on methanol solutions, it is not evident that the dimeric structure is maintained in a strong solvating agent like DMSO. This subject will be discussed below. On the other hand, lake 2 is likely formed by two neutral complexes with alizarin ligands containing one protonated phenol group. For the moment, we will consider the simplest model and assume that 2M is a neutral complex formed upon the protonation of the uncoordinated 2–phenolate groups of lake 1, as shown in Figure 1. We will also consider that this complex is a monomer, since the hydroxyl bridges would likely be destroyed in acid conditions, giving [Al(AlizH)2(OH)(H2O)] as a possible formula for 2M. If we now look at the speciation diagram shown in Figure 5, it seems that species 2m results from the conversion of the precursor 2M with release of one alizarin molecule, as shown in Scheme 1. This suggests that 2m is a mono-alizarin complex, for example, [Al(AlizH)(OH)2(H2O)2]. However, we know that the simple addition of NaOD to lake 2 will result in the conversion of 2m into 2M and afterwards into lake 1 without requiring the addition of alizarin excess, as shown in Figure 5. If 2m is a mono-alizarin complex, then its conversion into 2M in the conditions described previously is only possible through a disproportionation reaction with the formation of Al(OH)3. This equilibrium is controlled by the solubility of alumina, which is highly dependent on the pH of the medium. This would explain the interconversion of the two species when the acidity of the solution is changed.

3.3.2. Proton Diffusion Ordered Spectroscopy Experiments (1H-DOSY)

Proton diffusion ordered spectroscopy experiments (1H-DOSY) do not agree with the hypothesis presented earlier. This 2D technique allows us to determine the diffusion coefficients of the different species, then estimate their hydrodynamic volumes. In DMSO-d6 at 298 K, both species of lake 2 have approximately the same diffusion coefficients (D {10−10 m2.s−1} = 1.61 for 2M and 1.56 for 2m), as can be seen in Figure S5. This means that they have approximately the same volume, discarding the possibility of 2m being a mono-alizarin complex. When we performed a 1H-DOSY experiment on a DMSO-d6 solution containing a mixture of both lakes with approximately equimolar amounts (Figures S6 and S7), it became clear that lake 1 is larger than both lake 2 species, since it has a lower diffusion coefficient (D {10−10 m2.s−1} = 1.23 for 1, 1.40 for 2M and 1.29 for 2m). Based on this spectrum, it also seems that complex 2m is slightly larger than 2M, given the fact that the diffusion coefficient is lower in the first case. Nevertheless, when both lakes are mixed in the same solution, species 2M is noticeably favored, while the concentration of 2m is drastically reduced. This fact and the overlaying of the different resonances introduce a large error in the determination of the diffusion coefficient of 2m.
The ratio D2M/D1 = 1.14 determined from the mixture of lakes is inversely proportional to the ratio of the hydrodynamic radii of the corresponding species. The DFT-optimized structures obtained for the possible dimer 1 [{Al(Aliz2−)2(μ-OH)}2]4− and the suggested monomer 2M [Al(AlizH)2(OH)(H2O)] give an approximate ratio r1dim/r2M = 1.27, which is larger than the experimental value, as shown in Figure 6. However, according to the same calculations, the monomeric anionic complex is smaller than [Al(AlizH)2(OH)(H2O)] (r1mon/r2M = 0.99), which suggests that it may exist as a dimer in DMSO.
The 1H-DOSY experiments show that species 2M and 2m have approximately the same volume; therefore, it is plausible that they are isomers of some kind. In principle, the fact that they do not convert into each other when the temperature is raised excludes the possibility of them being simple cis, trans isomers, since the difference in their energies is expected to be relatively small. On the other hand, the fact that the equilibrium between the two species is pH-controlled supports the hypothesis that they may be tautomers with different dissociation constants. As was discussed before, in free alizarin, there is an important contribution from the resonance structure, where 10–CO has increased its phenolate nature and, consequently, 2–C=O gains a carbonyl character. Therefore, it is reasonable to assume that protonation may occur both in the 2–CO and 10–CO groups, depending on the pH, thus giving two tautomeric complexes: [Al(Aliz-2-H)2(OH)(H2O)] and [Al(Aliz-10-H)2(OH)(H2O)], as shown in Figure 1.

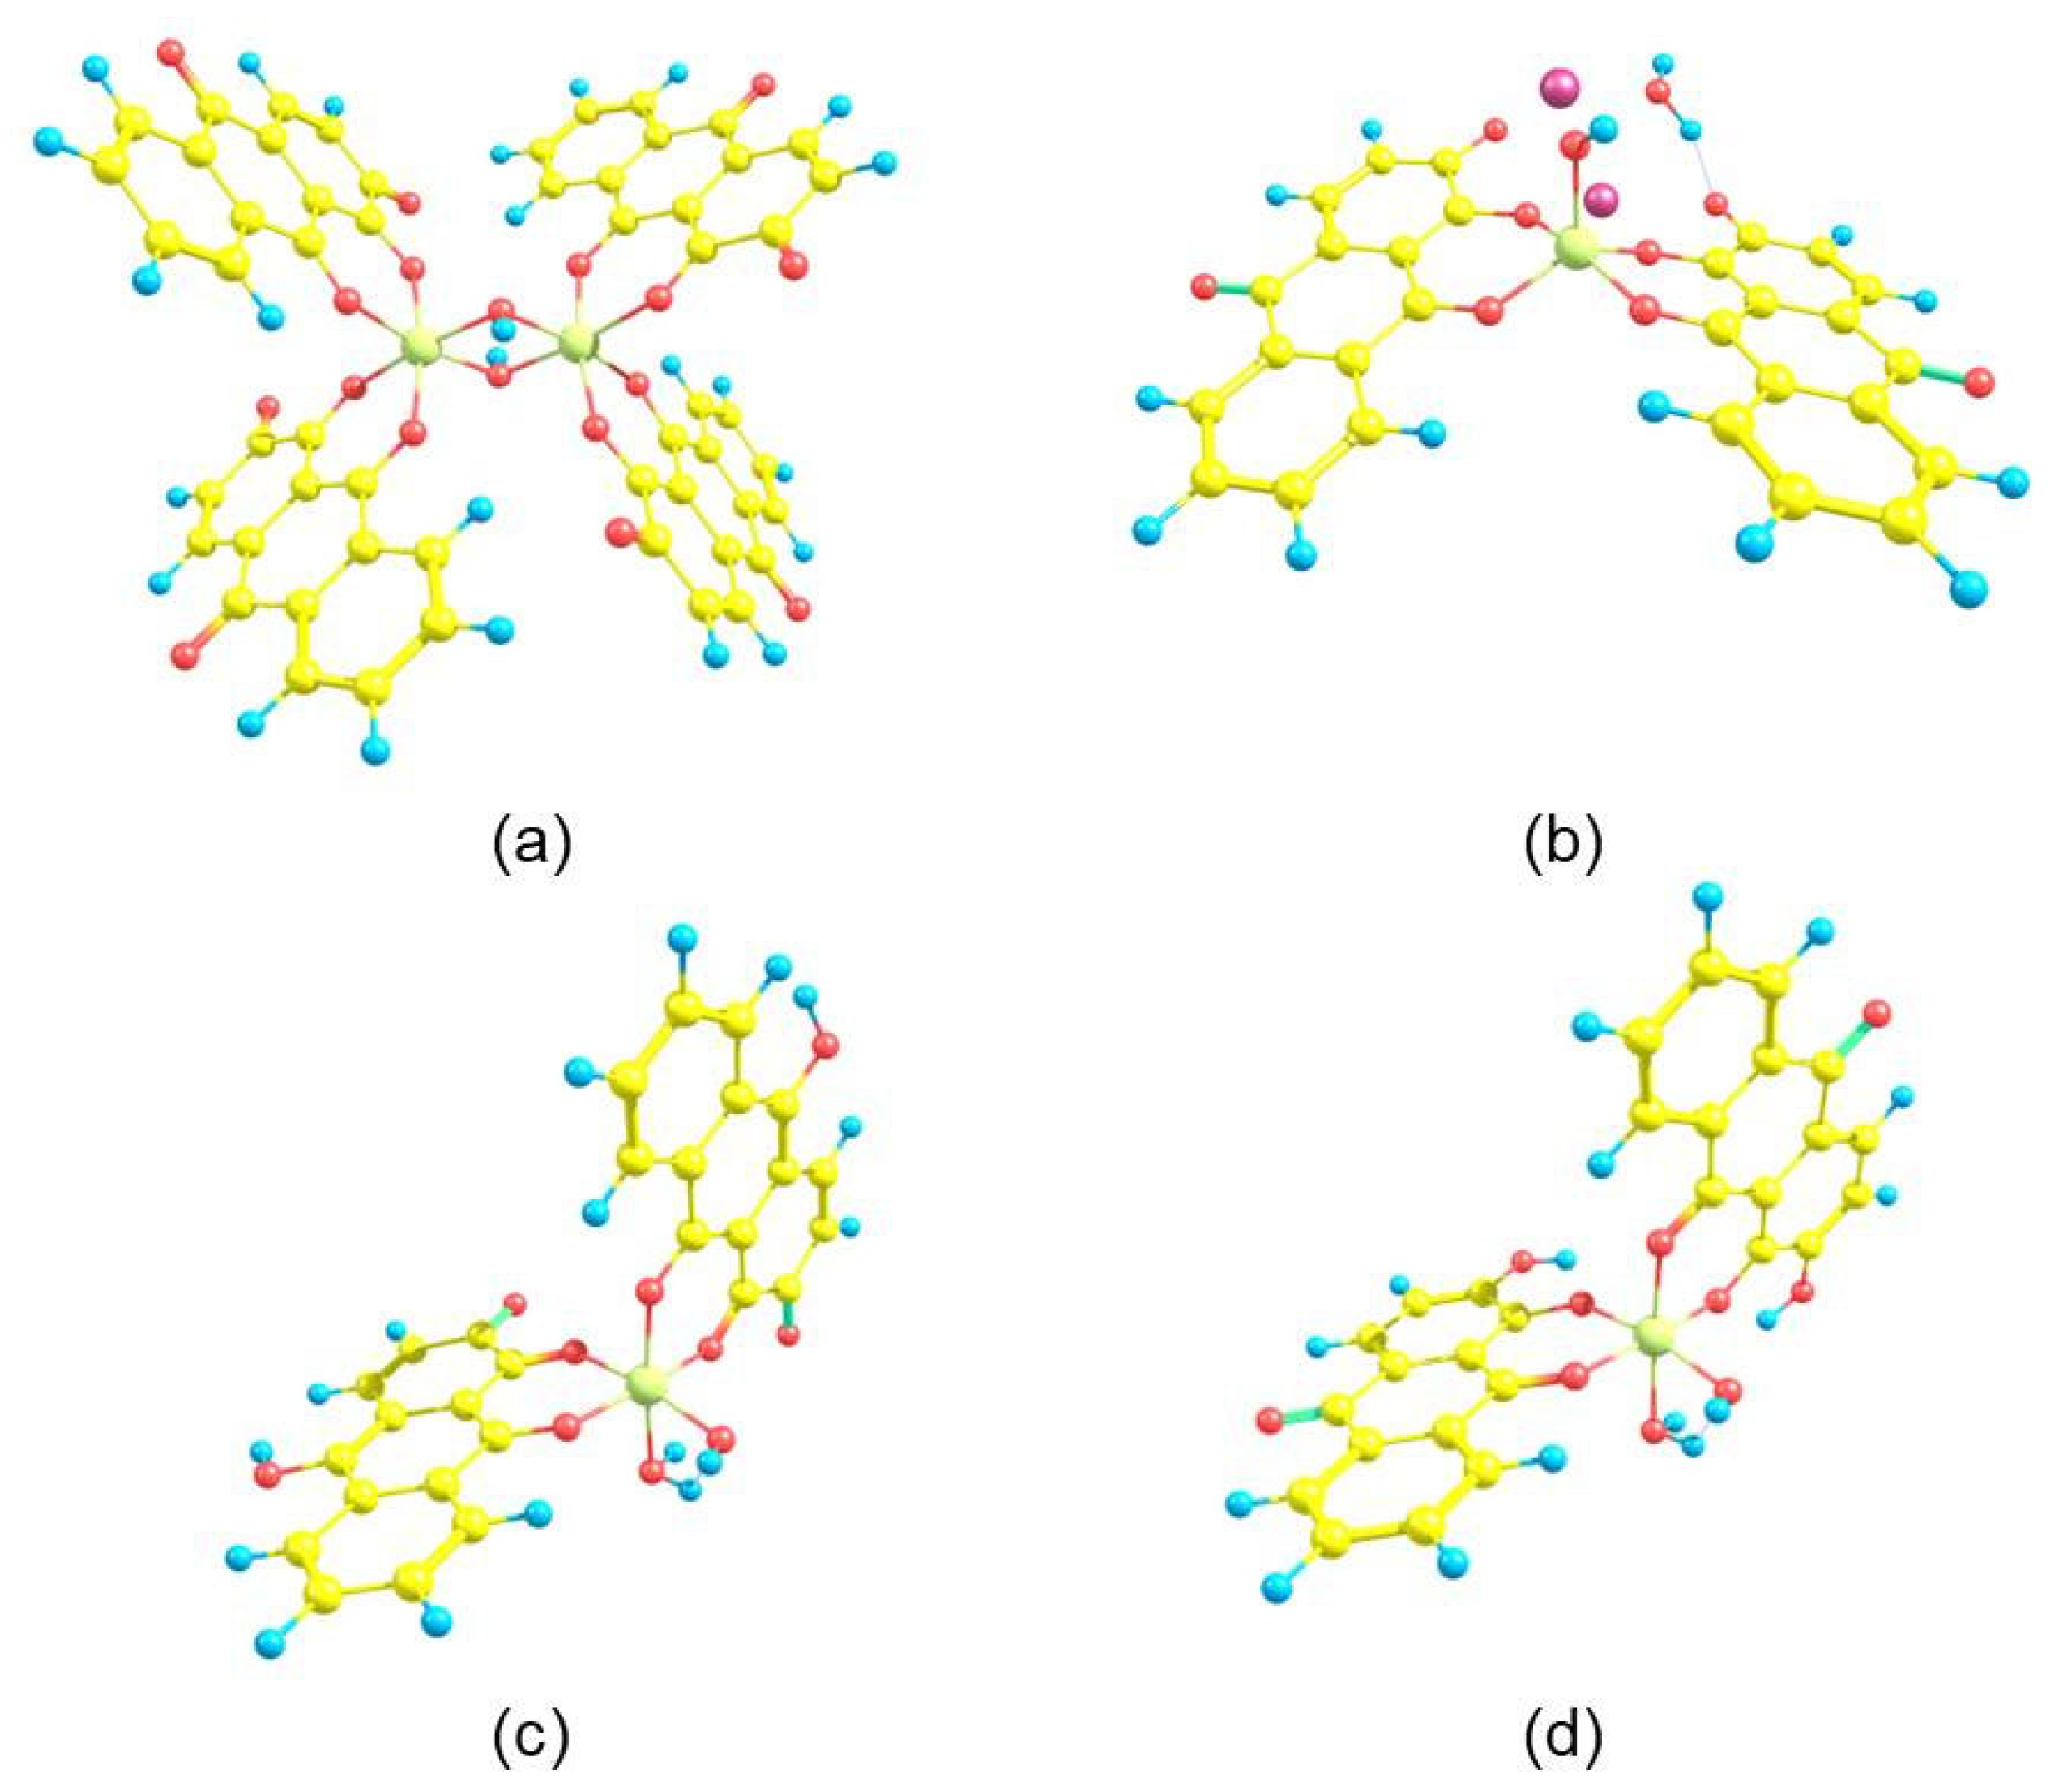
3.3.3. Prediction of Alizarin Lake Pigments NMR Chemical Shifts by Density Functional Theory

DFT-optimized structures were obtained for lake 1, Kiel and Heertjes lake with Na+, and the two tautomers in lake 2, as shown in Figure 1. The molecular structures are presented in Figure 6, and the corresponding theoretical chemical shifts are listed in Table 2. The optimized structure of lake 1 shows two octahedral aluminum centers, with the equatorial positions occupied by oxygens positioned at the C9 and C10 positions of different alizarin molecules. This structure is lower in energy than the one where the same positions are occupied by oxygens in position C10 of both alizarins (ΔE = 4.8 kJ·mol−1). The disposition of the ligands is kept in the tautomers 2–OH and 10–OH, and the difference between their calculated energies is large (ΔE = 133.9 kJ·mol−1). This agrees with the absence of exchange processes between the two species present in lake 2 at high temperatures.
It must be stressed that the DFT NMR prediction is made for static molecules in gas phase, whereas in solution, they are dynamic and interact with each other. This necessarily influences the nuclei chemical shifts. For instance, according to the calculations, all structures present two sets of chemically non-equivalent alizarins, while the experimental spectra show only one type of ligand for each compound. This means that the complexes are either more symmetric in solution, or the ligands are rapidly exchanging between them.
Proton H3 (and H4, on a smaller scale) is shifted to lower fields in the tautomers 2–OH (δ 6.86) and 10–OH (6.05) compared to the anionic form of lake 1 (5.08). These data reproduce the experimental observations fairly well and suggest that species 2M (δH3 = 6.34) and 2m ((δH3 = 6.63) correspond to tautomers 10–OH and 2–OH, respectively. In other words, it is possible that the protonation of lake 1 first occurs in the oxygen in position C10, giving the tautomer [Al(Aliz-10-H)2(OH)(H2O)], while the structure with the phenol group placed in position 2—[Al(Aliz-2-H)2(OH)(H2O)]—is only favored at lower pH values. Nevertheless, some of the features of the carbon spectra do not agree with the DFT calculations. For instance, an obvious downfield shift of C10 was expected in the tautomer 10–OH that was not observed in 2M or any of the other species, and the upfield shift of C1 and C2 in 2m was not as pronounced as was expected for tautomer 2–OH.
In agreement with the experimental data, the calculations also show that protons H5 and H8 in the aluminum complexes are sensitive to the protonation of the phenolate groups. In the anionic complex of lake 1, these two resonances are well separated (ΔδH5/H8 = 1.3), while in tautomer 2–OH, the difference in chemical shifts is small (ΔδH5/H8 = 0.11). The same behaviour was observed between lake 1 (ΔδH5/H8 = 0.3) and 2m (ΔδH5/H8 ≈ 0), although the discrepancy between the values was not as evident. These resonances are also closer in tautomer 10–OH (ΔδH5/H8 = 0.9), even though the chemical shift of H5 is very unequal in the two alizarin moieties.

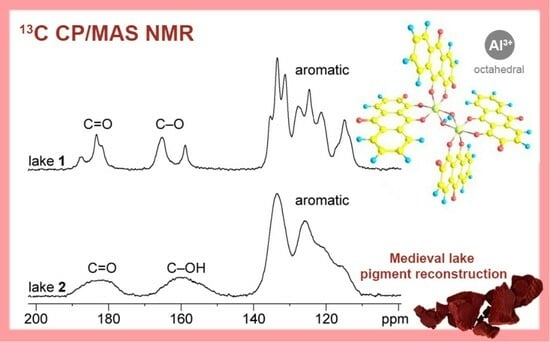
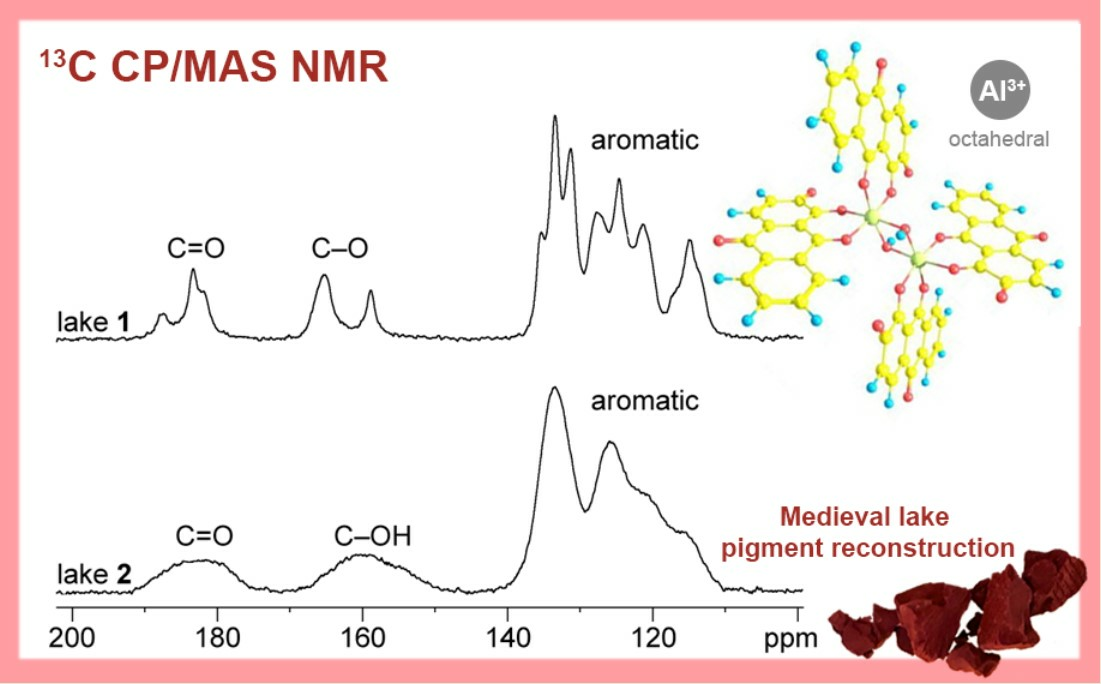
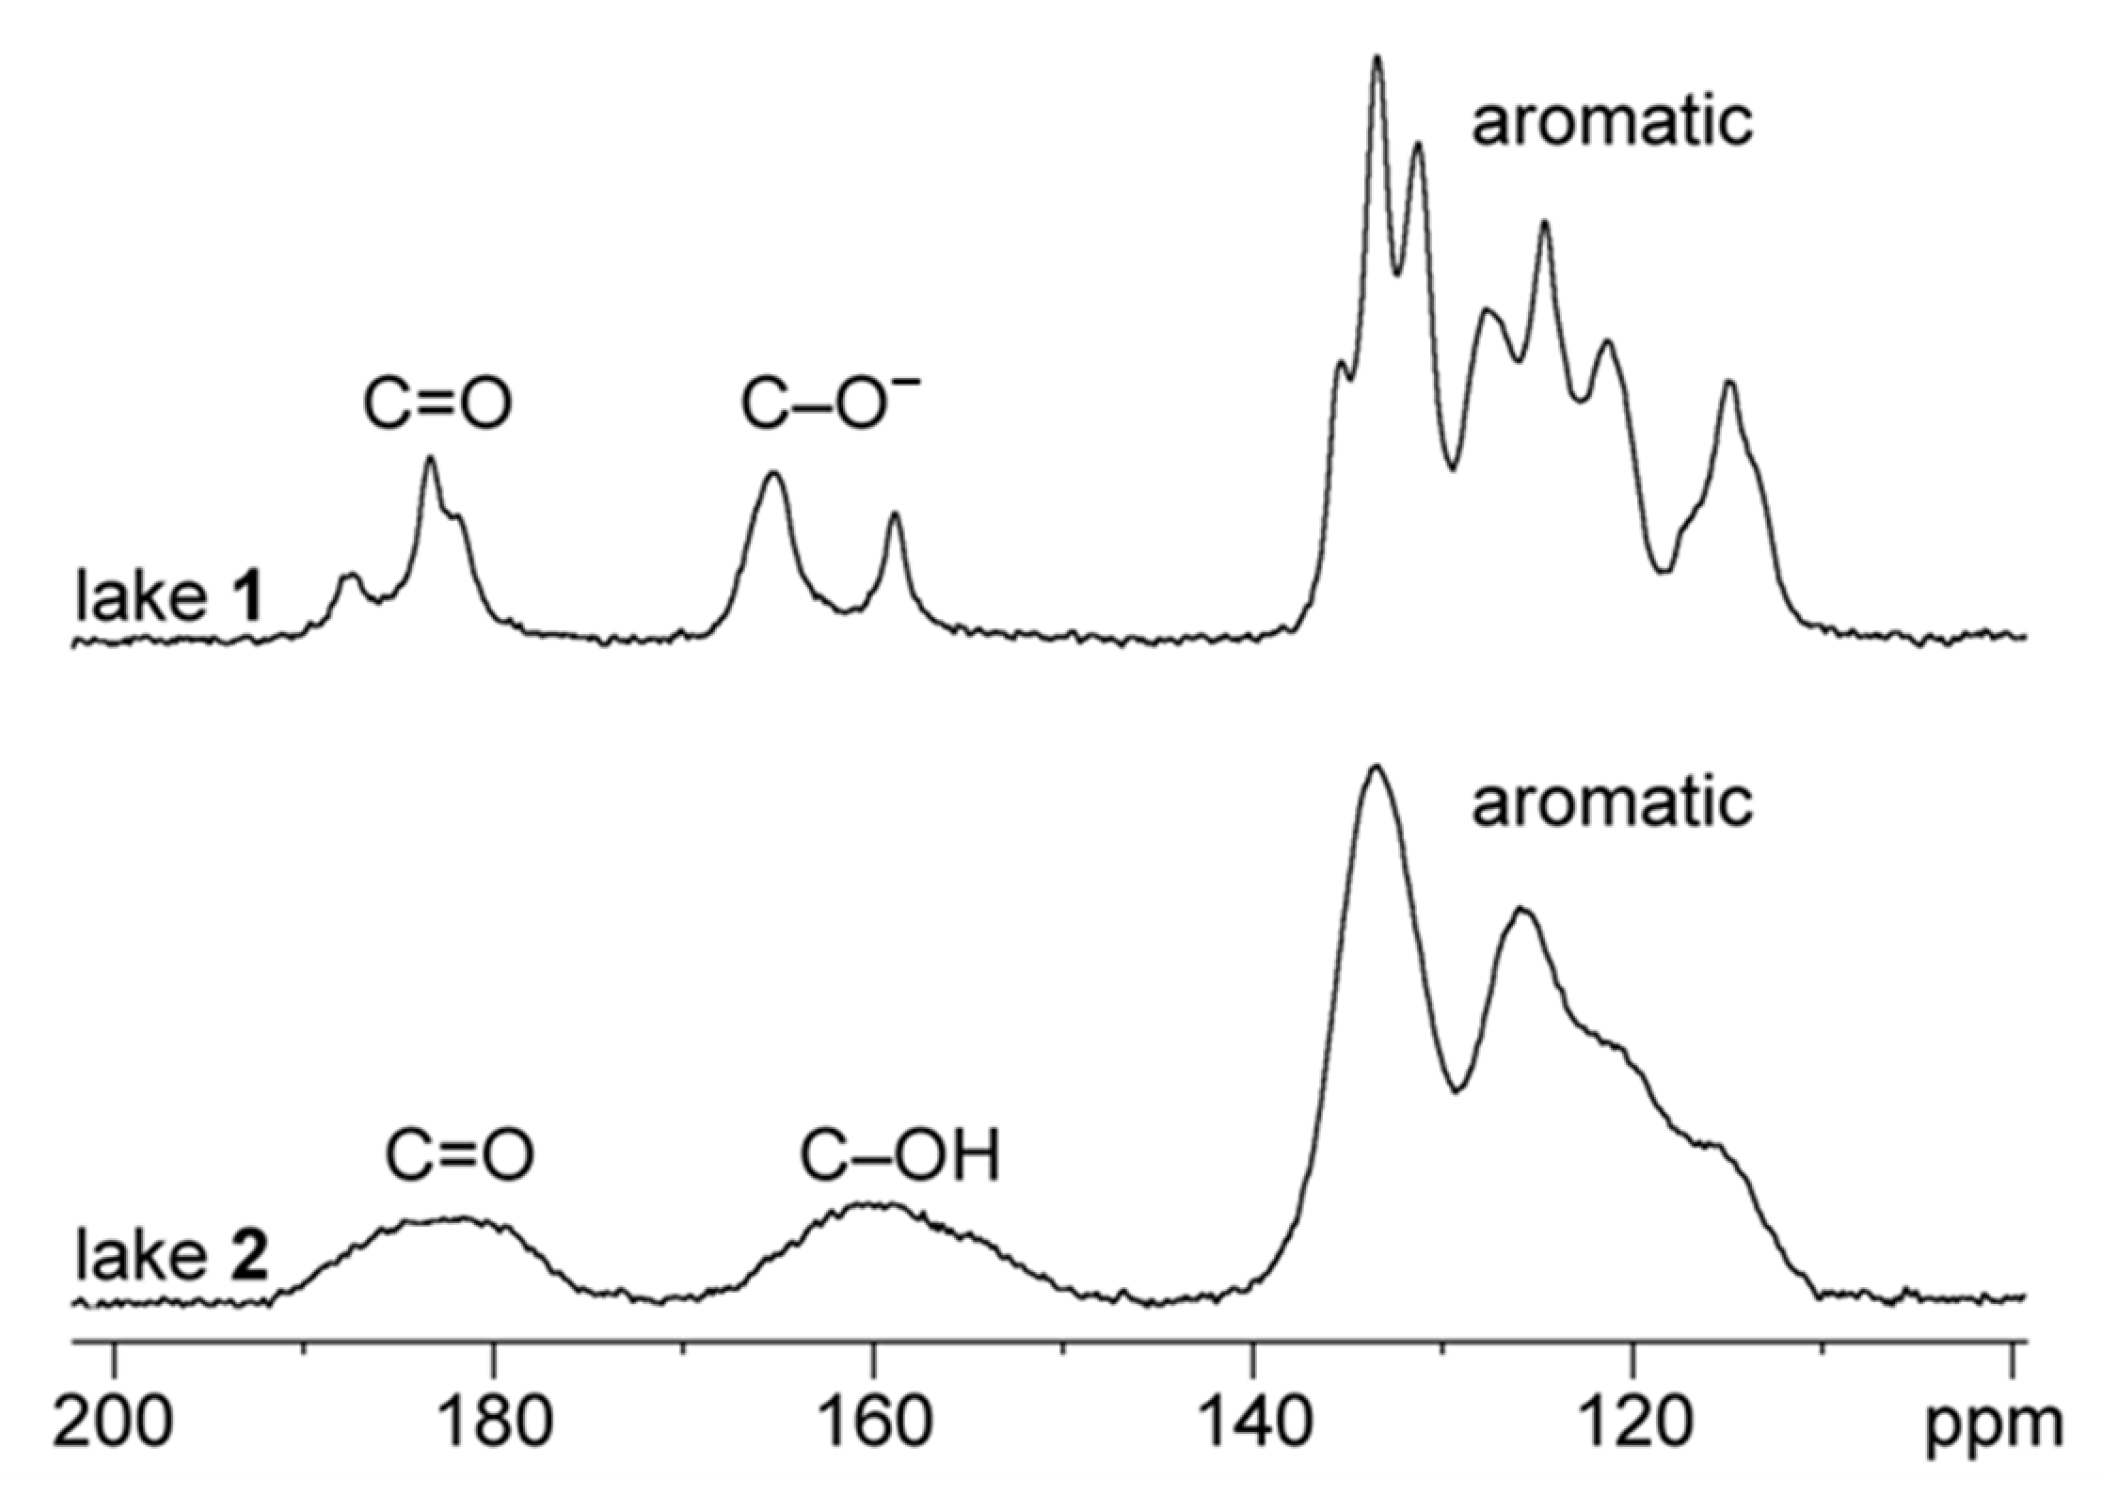
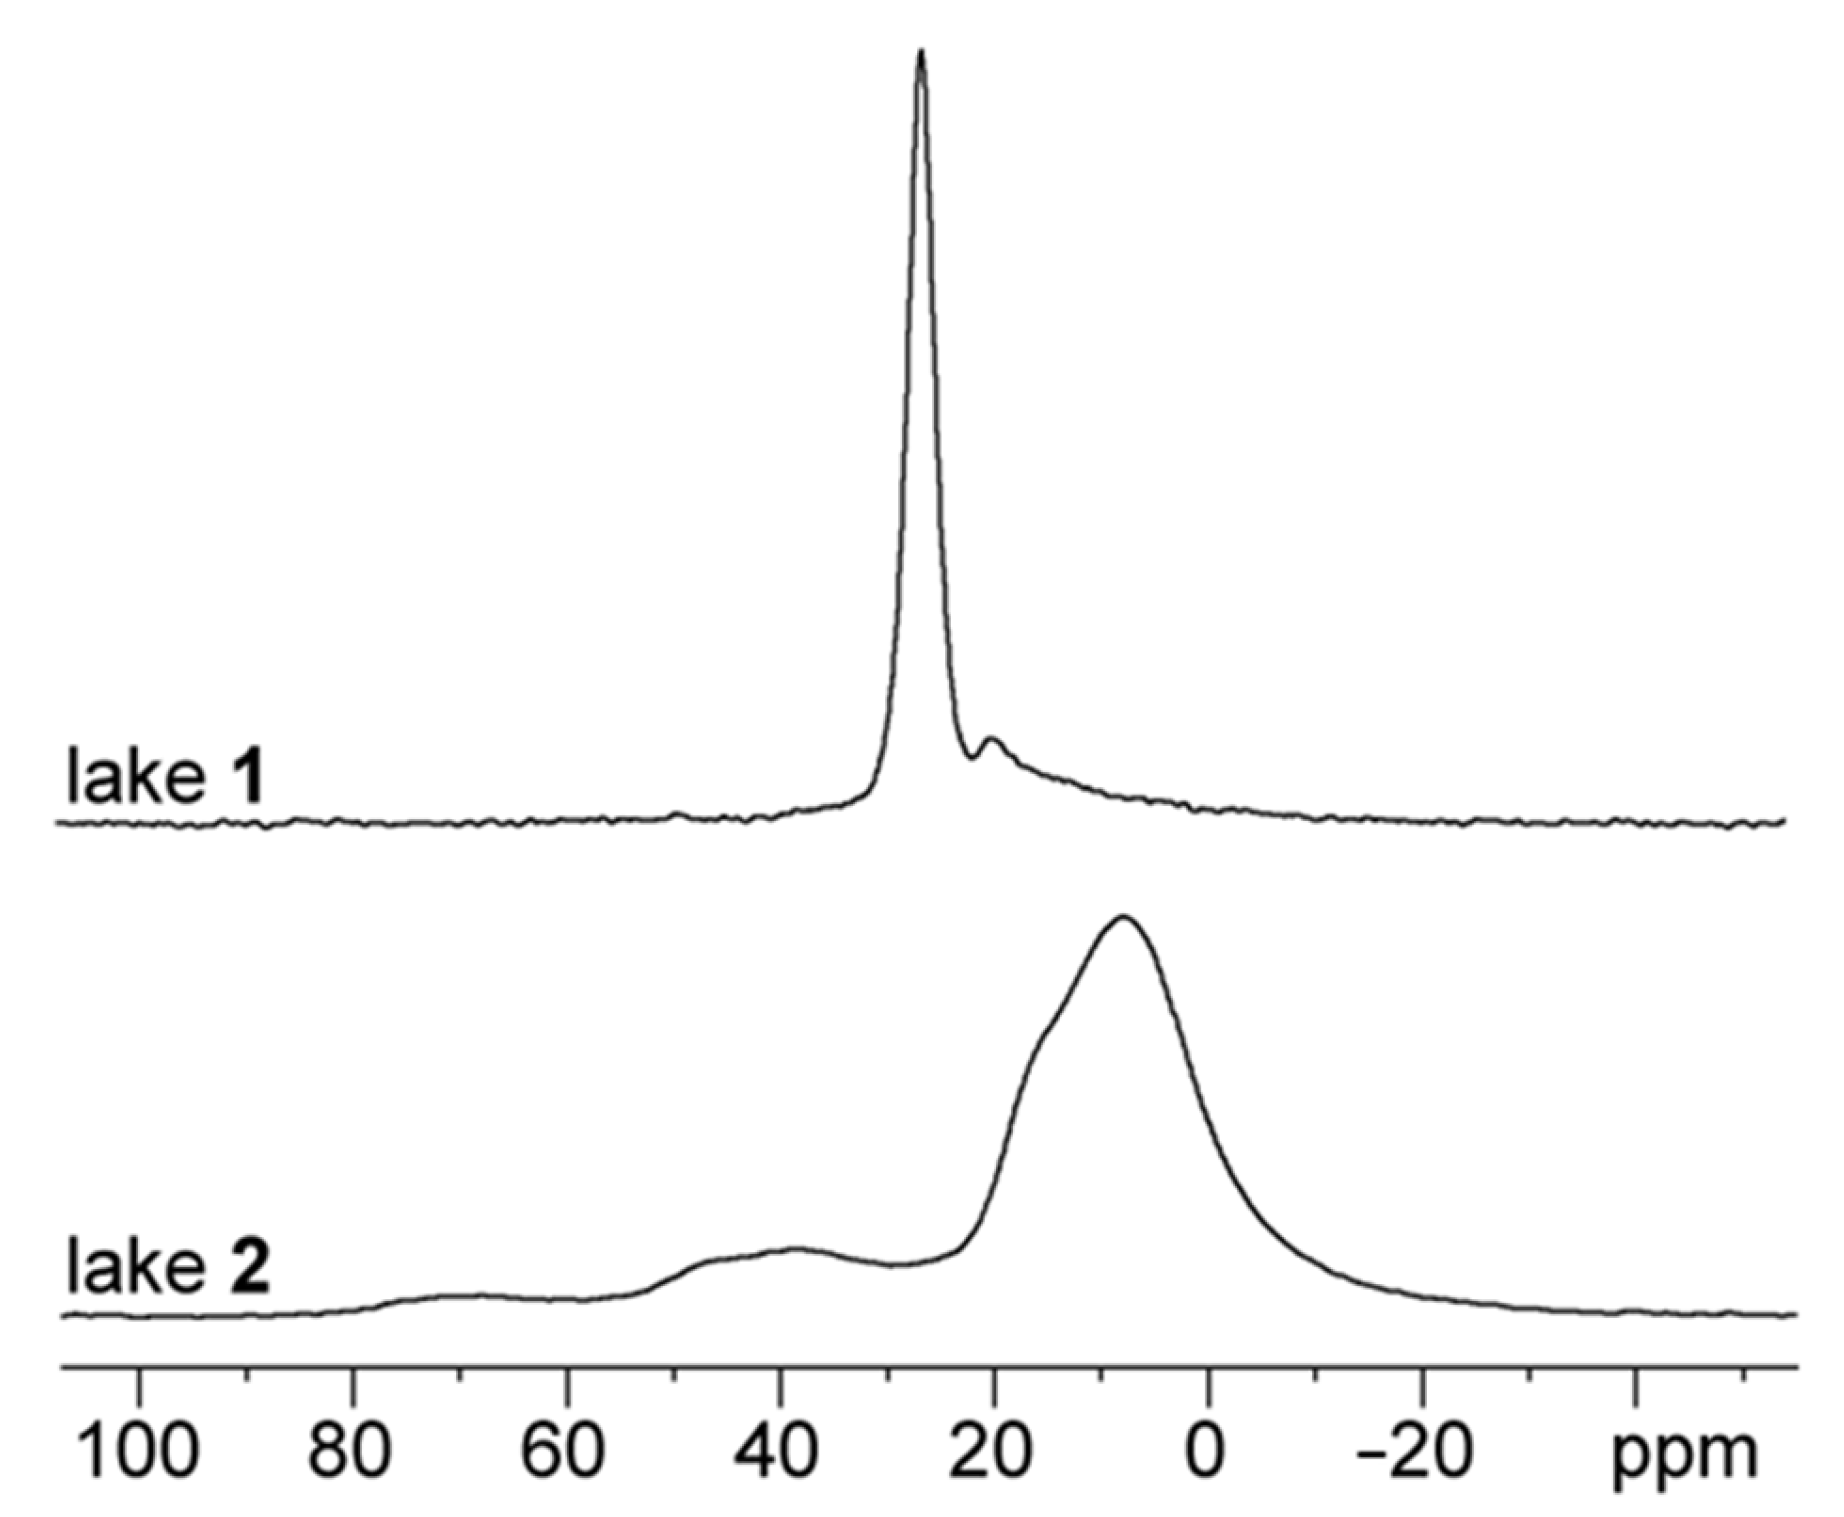
3.4. Characterization of Alizarin Lake Pigments using Solid-State (SS) NMR Spectroscopy

Liquid state NMR provided important information about the possible structures of the species present in the different lakes. In particular, it showed that lake 1 is formed by an anionic alizarin:aluminum complex, and that lake 2 is possibly formed by a mixture of two tautomers with phenol groups in positions C2 and C10, as shown in Figure 1. However, because lake pigments are used as solid dispersions in a matrix, it is essential to know more about their solid-state composition. For this reason, lakes 1 and 2 were analyzed using solid-state (SS) NMR, which has two main advantages: first, it allows us to analyze the true pigment without any kind of preparation, free from interactions with other substances like solvents, and secondly, a sample used for SS-NMR can be almost totally recovered without adulteration, which is crucial when analyzing historic pigments, which areoften rare and precious.
The 13C CP/MAS spectrum of lake 2 presents three regions with extremely broad resonances, which are characteristic of an amorphous material corresponding to carbonyl, phenolate, and aromatic carbons, as shown in Figure 7. The same pattern was obtained for lake 1, but in this case, the resonances were narrower and better resolved, indicating a higher degree of crystallinity.
The chemical shift of an aluminum nucleus is extremely sensitive to the coordination number, geometry, and symmetry near the metal, giving us important information about the structure of solid pigments. For instance, tetrahedral and octahedral aluminum compounds are usually easy to distinguish from each other, since the metal is more deshielded in the first case. Therefore, in Al–O environments, tetrahedral aluminum will give resonances near 50–80 ppm, and an octahedral aluminum will appear near −10 to 15 ppm. Penta-coordinated aluminum will fall between these ranges, at approximately 30–40 ppm [39]. The identification of the coordination number is relatively straightforward in well-defined crystalline compounds, but it can become more complicated for non-crystalline compounds such as the alizarin lakes, in particular lake 2.
Lake 1 shows one resonance at 25.9 ppm with Δν½ = 630 Hz, assigned by Soubayrol et al. [27] to an octahedral aluminum, as shown in Figure 8. It is possible that in the solid state, lake 1 is formed by an oligomeric network of formula {[Al(Aliz2−)2(μ-OH)]Na4}n. According to the authors, for this particular lake, the chemical shift of aluminum is above the normal limit for an octahedral geometry due to the distortion introduced in the coordination sphere as a result of a closed structure. For the case of Na+ and Ca2+ lakes, it was suggested that the alizarins are folded in such a way that they form a sandwich structure with two benzene rings inside which cations are confined. In lake 1, there is also an extremely broad resonance near 19 ppm that may correspond to some inorganic impurity. For instance, the thermodynamically stable form of alumina (α-Al2O3) gives one resonance near 16 ppm corresponding to the octahedral aluminum [15,16].
Lake 2 presents two superimposed broad resonances between 0–20 ppm that are very well separated in the 27Al 3QMAS spectrum, as shown in Figure 8. The deconvolution of the one-dimensional spectrum gives a ratio of approximately 5 between the two-main species, which does not correspond to the one obtained in DMSO. However, we must consider that the pigment was precipitated from an aqueous solution, and that the equilibrium between the two possible tautomers is certainly affected by the solvent. Furthermore, the solubility of both species may not be the same. Compared to lake 1, the most intense resonances are now considerably broader and shifted to higher fields. The increase in the linewidth is the result of a less crystalline material formed by less symmetric molecules, and the upfield shift can be explained by the presence of open-structure complexes. In fact, Soubayrol et al. noticed that the aluminum resonances of lakes containing larger cations [18] like K+ and Ba2+ are broader and appear in the typical range for octahedral geometries. It was explained that these cations are too large to fit in the benzene sandwiches, resulting in less strained open structures. For lake 2 an open structure would be expected since the alizarins are protonated and do not have counter-ions to form benzene sandwiches. In effect, lake 2 does not show any resonance in the 23Na MAS spectrum, unlike lake 1. These open structures will result in fewer constraints on the ligands giving broader resonances in a large variety of geometries. Lake 2 also presents broad and less intense resonances between 30–40 ppm that likely correspond to penta-coordinated aluminum compounds.

4. Conclusions

The multi-analytical approach carried out has shown that the two alizarin lakes, lake 1 and lake 2, have different structures. In lake 2, which is representative of a medieval lake, proton NMR studies show that the oxygen in position C2 is protonated, and there are two different complexes for which we propose the structures depicted in Figure 1. Both forms of lake 2 are neutral complexes and are therefore insoluble, which is why they are named lake pigments and were used as such in paintings. Contrary to lake 2, lake 1 is an anionic structure in which the hydroxyl group in position C2 is deprotonated. The solid-state NMR data are in agreement with an oligomeric network of formula {[Al(Aliz2−)2(μ-OH)]Na4}n. Based on this evidence, this work proves that lake 1 does not represent a medieval red lake pigment, as described in technical written sources such as medieval treatizes.
Importantly, solid-state NMR was the only technique that could provide direct insight into the metal ion coordination, which was octahedral for both alizarin complexes, enabling their study in the solid state. The results confirmed the existence of two species in lake 2 in a ratio of 5:1. Both are amorphous open structures, resulting in fewer constraints for the ligands, with a large variety of geometries (including penta-coordinated aluminum compounds).
The fact that solid-state NMR allows for the analysis of the pigment without preparation and free from interactions with solvents is a unique advantage for the study of insoluble pigment lakes used in the past. It is important to note that the sample could be recovered. For these reasons, solid-state NMR will play an important role in this field, especially with the constant development of new probes requiring smaller and smaller amounts of sample.
Within the research project REDiscover (REDiscovering madder colors: science and Art for the preservation and creation of cultural heritage) [49], we will continue the study of these precious pigments by reproducing them following recipes found on the Winsor and Newton (W&N) Archive Database, which is a primary source of information on the practices of one of the leading paint manufacturers of the 19th century [8]. In the 19th c., W&N conducted research to develop high-quality materials for artists, including madder red lake pigments, thus providing an excellent start to studying these red lakes. Both pigment reconstructions and W&N’s historical materials will be artificially aged using light, enabling us to test the potentials and limitations of solid-state NMR and other innovative techniques [49,50]. This will allow a deeper understanding of their chemistry and stability, impacting new conservation and authentication strategies.

Supplementary Materials

The following supporting information can be downloaded at: https://www.mdpi.com/article/10.3390/colorants2040031/s1, Figure S1: Titration curve of alizarin in DMSO-d6 containing residual water (c = 10.6 mg.ml−1; 0.044 mmol.ml−1) using NaOD solution in D2O (c = 0.33 mmol.ml−1) at 298K; Figure S2: 1H NMR spectra (DMSO-d6) of lake 1 with increasing volumes of DCl (c = 0.24 mmol/mL). “M” and “m” refer to species 2M and 2m, respectively, and “A” stands for alizarin; Figure S3: 1H NMR spectra (DMSO-d6) of lake 2 with increasing volumes of NaOD (c =0.33 mmol/mL) and comparison with lake 1; Figure S4: 1H chemical shifts of alizarin as a function of pH in DMSO-d6 solution containing residual water; Figure S5: H-DOSY spectrum of lake 2 in DMSO-d6, at 298K; Figure S6: H-DOSY spectrum of a mixture of lakes 1 and 2 in DMSO-d6, at 298K; Figure S7: H-DOSY spectrum of lake 1 in DMSO-d6, at 298K.

Author Contributions

Conceptualization, M.J.M. and E.J.C.; methodology, M.J.M., E.J.C., V.O., L.C.S. and L.M.; validation, M.J.M., E.J.C. and L.M.; formal analysis, M.J.M., E.J.C., V.O., L.C.S. and L.M.; investigation, M.J.M., E.J.C., V.O., L.C.S. and L.M; resources, M.J.M. and E.J.C.; data curation, E.J.C. and M.J.M.; writing—original draft preparation, L.C.S., V.O. and M.J.M.; writing—review and editing, M.J.M. and E.J.C.; supervision, M.J.M., E.J.C. and L.M.; project administration, M.J.M. and E.J.C.; funding acquisition, M.J.M. and E.J.C. All authors have read and agreed to the published version of the manuscript.

Funding

This research was funded by the Portuguese Science Foundation (FCT/MCTES) grants to Leonel C. Silva (SFRH/BPD/40505/2007) and Vanessa Otero (2020.00647.CEECIND). It was conducted in collaboration with the Associate Laboratory for Green Chemistry—LAQV (UIDB/50006/2020; UIDP/50006/2020) and the REDiscover project (2022.02909.PTDC). The NMR spectrometers used in this study are part of the National NMR Facility, which is supported by FCT-Portugal (ROTEIRO/0031/2013–PINFRA/22161/2016) and co-financed by FEDER through COMPETE 2020, POCI, PORL, and FCT through PIDDAC.

Institutional Review Board Statement

Not applicable.

Informed Consent Statement

Not applicable.

Data Availability Statement

The data presented in this study are available on request from the corresponding author.

Acknowledgments

We would like to thank Ana Claro for her contribution to the synthesis of the lakes and to the interpretation of the infrared spectra. Artur Neves is gratefully acknowledged for having updated the introduction and preparing the version using the colorants template.

Conflicts of Interest

The authors declare no conflict of interest.

References

  1. Kuehni, R.G. Color: An Introduction to Practice and Principles, 2nd ed.; Wiley-Interscience: Hoboken, NJ, USA, 2004. [Google Scholar]
  2. Paterson, I. A Dictionary of Colour; Thorogood Publishing Ltd.: London, UK, 2004. [Google Scholar]
  3. Pastoureau, M. Rouge. Histoire D’une Couleur; Éditions du Seuil: Paris, France, English version by Princeton University Press.
  4. Gage, J. Color in Art; Thames & Hudson: London, UK, 2006. [Google Scholar]
  5. Brusatin, M. Storia dei Colori; Einaudi: Torino, Italy, 1983. [Google Scholar]
  6. Cardon, D. Natural Dyes, Sources, Tradition, Technology and Science; Archetype Publications: London, UK, 2007. [Google Scholar]
  7. Chenciner, R. Madder Red—A History of Luxury and Trade; Curzon Press: London, UK, 2000. [Google Scholar]
  8. Veiga, T.; Moro, A.J.; Nabais, P.; Vilarigues, M.; Otero, V. A First Approach to the Study of Winsor & Newton’s 19th-Century Manufacture of Madder Red Lake Pigments. Heritage 2023, 6, 3606–3621. [Google Scholar]
  9. Shahid, M.; Wertz, J.; Degano, I.; Aceto, M.; Khan, M.I.; Quye, A. Analytical methods for determination of anthraquinone dyes in historical textiles: A review. Anal. Chim. Acta 2019, 1083, 58–87. [Google Scholar] [PubMed]
  10. Derksen, G.C.; Naayer, M.; van Beek, T.A.; Capelle, A.; Haaksman, I.K.; van Doren, H.A.; de Groot, Æ. Chemical and Enzymatic Hydrolysis of Anthraquinone Glycosides from Madder Roots. Phytochem. Anal. 2003, 14, 137–144. [Google Scholar] [CrossRef] [PubMed]
  11. Melo, M.J. History of Natural Dyes in the Ancient Mediterranean World. In Handbook of Natural Colorants; Bechtold, T., Mussak, R., Eds.; Wiley: Chichester, UK, 2009; pp. 3–20. [Google Scholar]
  12. Borgard, P.; Brun, J.-P.; Picon, M. L’Alun de Méditerranée; Publications du Centre Jean Bérard: Naples, Italy, 2005. [Google Scholar]
  13. Kirby, J. Paints, Pigments, Dyes. In Medieval Science, Technology and Medicine: An Encyclopedia; Glick, T., Livesey, S.J., Wallis, F., Eds.; Taylor & Francis Group: Boca Raton, FL, USA, 2005; pp. 379–383. [Google Scholar]
  14. Innocenti, S.; Ricci, M.; Quintero Balbas, D.; Fontana, R.; Striova, J.; Becucci, M. Surface-enhanced Raman spectroscopy for madder lake detection in painting layers. Eur. Phys. J. Plus 2023, 138, 381. [Google Scholar] [CrossRef]
  15. Trigueiro, P.; Pereira, F.A.R.; Guillermin, D.; Rigaud, B.; Balme, S.; Janot, J.-M.; dos Santos, I.M.G.; Fonseca, M.G.; Walter, P.; Jaber, M. When anthraquinone dyes meet pillared montmorillonite: Stability or fading upon exposure to light? Dyes and Pigments 2018, 159, 384–394. [Google Scholar] [CrossRef]
  16. Zhuang, G.; Pedetti, S.; Bourlier, Y.; Jonnard, P.; Méthivier, C.; Walter, P.; Pradier, C.-M.; Jaber, M. New Insights into the Structure and Degradation of Alizarin Lake Pigments: Input of the Surface Study Approach. J. Phys. Chem. C 2020, 124, 12370–12380. [Google Scholar] [CrossRef]
  17. Brunello, F. L’Arte Della Tintura Nella Storia Dell Umanitá (The Art of Dyeing in the History of Mankind); Neri Pozza Editore: Vicenza, Italy, 1968. [Google Scholar]
  18. Grazia, C.; Clementi, C.; Miliani, C.; Romani, A. Photophysical properties of alizarin and purpurin Al(iii) complexes in solution and in solid state. Photochem. Photobiol. Sci. 2011, 10, 1249–1254. [Google Scholar] [CrossRef]
  19. Melo, M.J.; Claro, A. Bright light: Microspectrofluorimetry for the characterization of lake pigments and dyes in works of art. Acc. Chem. Res. 2010, 43, 857–866. [Google Scholar] [CrossRef]
  20. Claro, A.; Melo, M.J.; Schäfer, S.; de Melo, J.S.S.; Pina, F.; van den Berg, K.J.; Burnstock, A. The use of microspectrofluorimetry for the characterization of lake pigments. Talanta 2008, 74, 922–929. [Google Scholar] [CrossRef]
  21. Melo, M.J.; Nabais, P.; Vieira, M.; Araújo, R.; Otero, V.; Lopes, J.; Martín, L. Between past and future: Advanced studies of ancient colours to safeguard cultural heritage and new sustainable applications. Dyes and Pigments 2022, 208, 110815. [Google Scholar] [CrossRef]
  22. Parry, E.J.; Coste, J.H. The Chemistry of Pigments; Greenwood and Co.: London, UK, 1902. [Google Scholar]
  23. Beech, W.F.; Drew, D.K. Structure of the Aluminum Lakes of Some Azo-Dyes and Alizarin. J. Chem. Soc. 1940, 603–607. [Google Scholar] [CrossRef]
  24. Kiel, E.G.; Heertjes, P.M. Metal Complexes of Alizarin II—The Structure of Some Metal Complexes of Alizarin other than Turkey Red. J. Soc. Dye. Colour. 1963, 79, 61–64. [Google Scholar] [CrossRef]
  25. Kiel, E.G.; Heertjes, P.M. Metal Complexes of Alizarin I-The Structure of the Calcium-Aluminium Lake of Alizarin. J. Soc. Dye. Colour. 1963, 79, 21–27. [Google Scholar] [CrossRef]
  26. Wunderlich, C.; Bergerhoff, G. Konstitution und Farbe von Alizarin-und Purpurin-Farblacken. Chem. Ber. 1994, 127, 1185–1190. [Google Scholar] [CrossRef]
  27. Soubayrol, P.; Dana, G.; Man, P.P. Aluminium-27 solid-state NMR study of aluminium coordination complexes of Alizarin. Magn. Reson. Chem. 1996, 34, 638–645. [Google Scholar] [CrossRef]
  28. Sanyova, J. Spectroscopic Studies (Ftir, Sims, Es-Ms) on the Structure of Anthraquinone-Aluminium Complexes. In Dyes in History and Archaeology; Kirby, J., Ed.; Archetype Publications Ltd.: London, UK, 2008; pp. 208–213. [Google Scholar]
  29. Attree, G.F.; Perkin, A.G. Reduction products of the hydroxyanthraquinones. Part XII. J. Chem. Soc. Resumed 1931, 144–173. [Google Scholar] [CrossRef]
  30. Fierz-David, H.E.; Rutishauser, M. Die Zusammensetzung und Konstitution des Türkischrotes. Helv. Chim. Acta 1940, 23, 1298–1311. [Google Scholar] [CrossRef]
  31. Deb, B.K.; Ghosh, A.K. Chelated compounds and derivative of β-alkoxycarbonylalkyltin chlorides—5-arylazo-8-quinolinolates, alizarinates, and thiocyanate: Preparation and spectroscopic studies. Can. J. Chem. 1987, 65, 1241–1246. [Google Scholar] [CrossRef]
  32. DelMedico, A.; Pietro, W.J.; Lever, A.B.P. Linkage isomers of alizarin-bis(bipyridine)ruthenium(II). Inorg. Chim. Acta 1998, 281, 126–133. [Google Scholar] [CrossRef]
  33. DelMedico, A.; Fielder, S.S.; Lever, A.B.P.; Pietro, W.J. Rational Design of a Light-Driven Molecular Switch Incorporating an Alizarin-Ru(bpy)2 Fragment. Inorg. Chem. 1995, 34, 1507–1513. [Google Scholar] [CrossRef]
  34. Churchill, M.R.; Keil, K.M.; Bright, F.V.; Pandey, S.; Baker, G.A.; Keister, J.B. Linkage and Redox Isomerism in Ruthenium Complexes of Catecholate, Semiquinone, and o -Acylphenolate Ligands Derived from 1,2-Dihydroxy-9,10-anthracenedione (Alizarin) and Related Species: Syntheses, Characterizations, and Photophysics. Inorg. Chem. 2000, 39, 5807–5816. [Google Scholar] [CrossRef]
  35. Churchill, M.R.; Keil, K.M.; Gilmartin, B.P.; Schuster, J.J.; Keister, J.B.; Janik, T.S. Linkage and Redox Isomerism in Ruthenium Complexes of Catecholate, Semi-quinone, and o -Acylphenolate Ligands Derived from Tri- and Tetrahydroxy-9,10-anthracenediones. Inorg. Chem. 2001, 40, 4361–4367. [Google Scholar] [CrossRef] [PubMed]
  36. Zittel, H.E.; Florence, T.M. Voltammetric and spectrophotometric study of the zirconium-Alizarine Red S complex. Anal. Chem. 1967, 39, 320–326. [Google Scholar] [CrossRef]
  37. Jayaweera, P.M.; Jayarathne, T.A.U. Acid/base induced linkage isomerization of alizarin red adsorbed onto nano-porous TiO2 surfaces. Surf. Sci. 2006, 600, L297–L300. [Google Scholar] [CrossRef]
  38. Moriguchi, T.; Yano, K.; Nakagawa, S.; Kaji, F. Elucidation of adsorption mechanism of bone-staining agent alizarin red S on hydroxyapatite by FT-IR microspectroscopy. J. Colloid Interface Sci. 2003, 260, 19–25. [Google Scholar] [CrossRef] [PubMed]
  39. Doskocz, M.; Kubas, K.; Frąckowiak, A.; Gancarz, R. NMR and ab initio studies of Mg2+, Ca2+, Zn2+, Cu2+ alizarin complexes. Polyhedron 2009, 28, 2201–2205. [Google Scholar] [CrossRef]
  40. 27Vitorino, T.; Melo, M.J.; Carlyle, L.; Otero, V. New insights into brazilwood lake pigments manufacture through the use of historically accurate reconstructions. Stud. Conserv. 2016, 61, 255–273. [Google Scholar] [CrossRef]
  41. Cañamares, M.V.; Garcia-Ramos, J.V.; Domingo, C.; Sanchez-Cortes, S. Surface-enhanced Raman scattering study of the adsorption of the anthraquinone pigment alizarin on Ag nanoparticles. J. Raman Spectrosc. 2004, 35, 921–927. [Google Scholar] [CrossRef]
  42. Hilbert, G.E.; Wulf, O.R.; Hendricks, S.B.; Liddel, U. The Hydrogen Bond between Oxygen Atoms in Some Organic Compounds. J. Am. Chem. Soc. 1936, 58, 548–555. [Google Scholar] [CrossRef]
  43. Bloom, H.; Briggs, L.H.; Cleverley, B. Physical properties of anthraquinone and its derivatives. Part I. Infrared spectra. J. Chem. Soc. Resumed 1959, 178–185. [Google Scholar] [CrossRef]
  44. Nakamoto, K.; McCarthy, P.J.; Ruby, A.; Martell, A.E. Infrared Spectra of Metal Chelate Compounds. II. Infrared Spectra of Acetylacetonates of Trivalent Metals. J. Am. Chem. Soc. 1961, 83, 1066–1069. [Google Scholar] [CrossRef]
  45. Nakamoto, K.; Martell, A.E. Infrared Spectra of Metal-Chelate Compounds. I. A Normal Coordinate Treatment on Bis-(Acetylacetonato)-Cu(II). J. Chem. Phys. 1960, 32, 588–597. [Google Scholar] [CrossRef]
  46. Mikami, M.; Nakagawa, I.; Shimanouchi, T. Far infra-red spectra and metal—Ligand force constants of acetylacetonates of transition metals. Spectrochim. Acta A 1960, 23, 1037–1053. [Google Scholar] [CrossRef]
  47. Fujita, J.; Martell, A.E.; Nakamoto, K. Infrared Spectra of Metal Chelate Compounds. VI. A Normal Coordinate Treatment of Oxalato Metal Complexes. J. Chem. Phys. 1962, 36, 324–331. [Google Scholar] [CrossRef]
  48. Holmgren, A.; Wu, L.; Forsling, W. Fourier transform infrared and Raman study of Alizarin Red S adsorbed at the fluorite–water interface. Spectrochim. Acta Part A Mol. Biomol. Spectrosc. 1999, 55, 1721–1730. [Google Scholar] [CrossRef]
  49. REDiscover. Available online: https://www.instagram.com/rediscover_2023/ (accessed on 27 September 2023).
  50. Tissier, R.-C.; Rigaud, B.; Thureau, P.; Huix-Rotllant, M.; Jaber, M.; Ferré, N. Stressing the differences in alizarin and purpurin dyes through UV-visible light absorption and 1H-NMR spectroscopies. Phys. Chem. Chem. Phys. 2022, 24, 19452–19462. [Google Scholar] [CrossRef] [PubMed]
Figure 1. Alizarin structures proposed by Kiel and Heertjes, by Soubayrol et al. (lake 1), and by this work: the two possible tautomers that comprise lake 2.
Colorants 02 00031 g001
Figure 2. Infrared spectra of alizarin and lakes 1 and 2 in the solid state.
Colorants 02 00031 g002
Figure 3. Infrared spectra of the residues obtained after solvent (DMSO) evaporation of alizarin solutions at different pH values.
Colorants 02 00031 g003
Figure 4. Possible resonance structures for alizarin above pH 9 (sodium hydroxide was added to a solution of alizarin in DMSO containing residual water, and aliquots were taken for analysis).
Colorants 02 00031 g004
Figure 5. Speciation diagram based on 1H NMR resonance integrals (H3) of species formed upon addition of DCl to lake 1. Alizarin (×), 2M (◊), 2m (°), lake 1 (•).
Colorants 02 00031 g005
Scheme 1. Transformation of the main compound in lake 2 (2M) into alizarin and a mono-alizarin complex.
Colorants 02 00031 sch001
Figure 6. DFT-optimized structures of (a) lake 1 [{Al(Aliz2−)2(μ-OH)}2]4−, (b) Kiel and Heertjes lake with Na+, [Al(Aliz2−)2(μ-OH)]Na2, (c) lake 2 tautomer 2M [Al(Aliz-10-H)2(OH)(H2O)], and (d) lake 2 tautomer 2m [Al(Aliz-2-H)2(OH)(H2O)].
Colorants 02 00031 g006
Figure 7. 100.6 MHz 13C CP/MAS spectra of solid lakes 1 and 2.
Colorants 02 00031 g007
Figure 8. 208.5 MHz 27Al MAS spectra of solid lakes 1 and 2.
Colorants 02 00031 g008
Table 1. Selected infrared wavenumbers (cm−1) of free alizarin and lakes 1 and 2.
AlizarinLake 1Lake 2IR Assignments *
ca. 3400 ν(OH)
ca. 3400ca. 3400ν(OH)
ca. 3000ca. 3200ca. 3200ν(CH)
166216431657–1625ν(10-CO) + δ(CCC)
1633 ν(9-CO)
158915911589ν(CC)
15711571ν(CC)
15251529ν(CC)
146014671467ν(CO) + ν(CC) + δ(CH)
145614541452ν(CC) + δ(2-COH) + δ(CH)
13591358ν(CC) + δ(COH)
13501350 ν(CC) + δ(1-COH)
1331 1331ν(CC)
1322 ν(CC)
129512881286ν(2-CO) + ν(CC) + δ(CCC)
126712671265ν(CO) + ν(CC)
12161209δ(CH) + δ(CCC)
1197 ν(CC) + δ(CH) + δ(CCC)
118211861190ν(CC) + δ(CH) + δ(CCC)
115911511155ν(CC) + δ(CH)
* ν—stretching; δ—bending.
Table 2. NMR chemical shifts predicted using DFT for the different complexes.
Predicted Chemical Shift (ppm)
Lake 1Kiel and Heertjes LakeLake 2, 2mLake 2, 2M
H34.89; 5.27 (5.08)6.66; 6.62 (6.64)6.82; 6.89 (6.86)5.97; 6.13 (6.05)
H47.05; 7.20 (7.12)7.75; 7.82 (7.78)7.71; 7.74 (7.72)6.61; 7.87 (7.24)
H57.61; 7.66 (7.64)8.28; 8.23 (8.26)8.31; 8.24 (8.28)8.15; 7.04 (7.60)
H66.66; 6.39 (6.52)7.65; 7.66 (7.66)7.68; 7.57 (7.62)7.61; 7.44 (7.52)
H77.69; 6.45 (7.07)7.51; 7.48 (7.50)7.58; 7.40 (7.49)7.55; 7.30 (7.42)
H89.77; 8.12 (8.94)8.45; 8.45 (8.45)8.23; 8.11 (8.17)8.52; 8.47 (8.50)
C1166.0; 167.8 (166.9)159.5; 156.3 (157.9)151.7; 152.0 (151.8)163.7; 164.8 (164.2)
C2169.8; 170.6 (170.2)161.8; 163.9 (162.8)149.0; 148.6 (148.8)173.4; 173.8 (173.6)
C3109.6; 110.4 (110.0)119.7; 116.7 (118.2)111.4; 116.6 (114.0)120.2; 120.6 (120.4)
C9170.6; 166.6 (168.8)180.3; 182.6 (181.4)178.3; 177.6 (178.0)168.7; 166.7 (167.7)
C10162.1; 160.4 (161.2)169.1; 168.4 (168.8)172.6; 172.7 (172.6)142.0; 139.2 (140.6)
Average values in parentheses.
Disclaimer/Publisher’s Note: The statements, opinions and data contained in all publications are solely those of the individual author(s) and contributor(s) and not of MDPI and/or the editor(s). MDPI and/or the editor(s) disclaim responsibility for any injury to people or property resulting from any ideas, methods, instructions or products referred to in the content.

