1. Introduction
The discovery of new blue colorants is a challenging task in the industry of foods and beverages. Plenty of available red, yellow, and orange dyes are based on carotenoids and linear-bond conjugated molecules. The blue ones are relatively rare, encompassing only a small group of conjugated aromatic π-bond species with heteroatoms, such as flavonoids, quinones, and azulenes. Although anthocyanins are also rather common dyes, they span a wide range of colors depending on the pH. In high-acid beverage products, they display typical pink or violet colors.
Our interest in the subject came up by surprise in our study of the coordination chemistry of strontium ranelate. Strontium ranelate is an old antiosteoporotic drug, for the treatment of post-menopausal osteoporosis in women and men [
1,
2], exhibiting a promising use in osteoarthritis treatment [
3,
4]. It increases the cartilage matrix formation without affecting resorption [
5] and also provides analgesia in arthritis by inhibiting the release of inflammatory cytokines into the joints [
6]. However, the drug was suspended a few years ago, after the report of a slight increase in the risk of cardiovascular events.
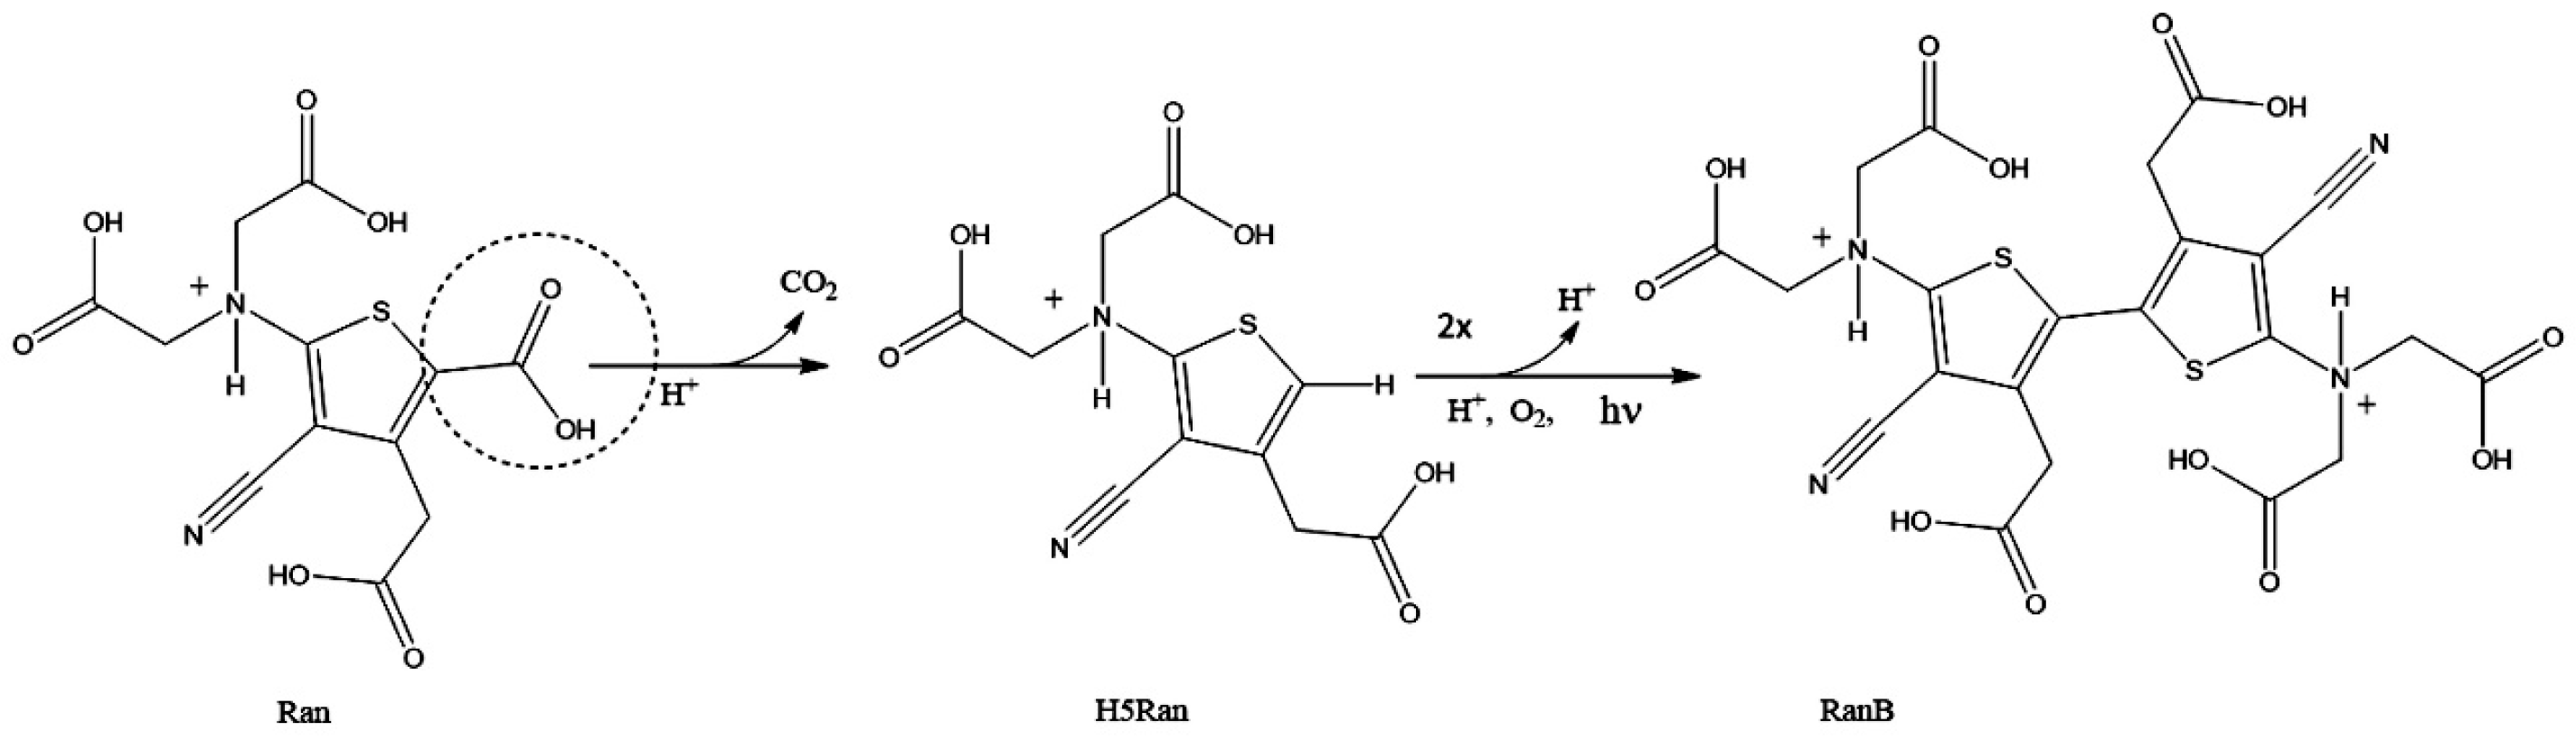
In our attempts to isolate ranelic acid from strontium ranelate treatment with hydrochloric acid (e.g., 6 M), we observed the formation of a vivid blue color in solution after exposing it to sunlight, at room temperature, under normal conditions. The reactions proceed very slowly and can be better performed in a hood, under UV light, using an open Petri dish (
Figure 1). The blue color was ascribed to a new dye, denoted ranelate blue, or RanB [
7].
As shown in
Figure 1, this blue dye has a dithiophene structure encompassing two carboxylates, two nitriles, and two iminodiacetate groups. The dye has already been isolated, and its analytical and structural characterization (elemental analysis, NMR, high-resolution mass spectroscopy) is in complete agreement with the proposed structure [
7].
Surprisingly, despite being spontaneously generated in the dissolution of the SrRan antiosporotic medicine in hydrochloric acid, the blue compound has never been studied before as a dye or colorant agent. Pursuing this task, in this work, we started elucidating the photophysics and photochemical behavior of the RanB dye and explored its interaction with lanthanoid metals, particularly Tb
3+ ions [
8]. It should be noticed that although lanthanoid elements exhibit rather similar chemical properties, their optical behavior is quite distinct, showing in many cases luminescence, up-conversion, and persistent luminescence properties. In particular, terbium ions, Tb
3+, glow green when exposed to UV light, and in the past, they were used in white fluorescence lamps and monitors based on cathode ray tubes [
9]. Modern uses of terbium also explore this emission for medical purposes, similar as in fluoroimmunoassays [
10] and luminescent sensors [
11]. Another interesting application is in calcium fluoride-doped matrices for thermoluminescence devices [
12] or in calcium tungstates for improving the luminescence in X-ray intensified screens [
13].
Exploratory cell viability assays for several ranelate species have already been reported in our previous work [
7] and were refined in this work using endothelial cell cultures (HUVEC) and the MTT method. In the range of concentrations from 0.15 to 150 μg mL
−1, the RanB species exhibited no significant effect on the cell viability, even under exposition to sunlight. Now, this has been confirmed using Kefir cultures treated with RanB. In addition, RanB has revealed a good performance as a blue staining agent for yeasts in Kefir. Because of its non-toxic nature, in association with its strong blue color and yellow emission characteristics, RanB can be a versatile dye for many industrial and biological applications, e.g., as cell markers or coloring agents in food and paints.
2. Materials and Methods
Phosphate-buffered saline (PBS), (3-(4,5-dimethylthiazol-2-yl)-2,5-diphenyltetrazolium bromide) (MTT), and all other reagents were of analytical grade and were employed as supplied from Sigma-Aldrich and Merck.
Strontium ranelate (SrRan) is available from several sources, including Sigma/Aldrich (St. Louis, MO, USA). In this work, it was isolated from medicinal Protos
® sachets obtained from drugstores [
7]. Anal. Calcd (found) for Sr
2(ran).9(H
2O) C
12H
24N
2O
17SSr
2, MM 875.6; C, 21.46 (21.33); H, 3.38 (3.58); N, 4.09 (4.15). Lithium ranelate (LiRan) was prepared from SrRan, by treating it with lithium carbonate, as previously reported [
7]. Anal. Calcd (found) for Li
4Ran.4H
2O, C
12H
14Li
4N
2O
12S, MM 438.07; C, 33.32 (32.90); H, 3.04 (3.22); N, 6.44 (6.39).
2.1. Synthesis of RanB
A total of 5 g of strontium ranelate was dissolved in a 100 mL 6 mol/L HCl solution and transferred to a Petri dish kept in the hood, under darkness, at room temperature, for 1 week. The ranelate species undergoes acid-assisted decarboxylation at the C5 position of the thiophene ring, generating the so-called H5Ran species [
7], which crystallizes and can be isolated by filtration under dim light. The crystals were washed with cold ethanol and dried for 1 h in the dissector. In the presence of light, the crystals become gradually blue.
To isolate the blue RanB product, the H5Ran crystals were dissolved in 100 mL of 6 mol/L HCl solution, transferred to a Petri dish, and kept under stirring in the air, for 12 h under a UV lamp (λ = 365 nm 5.5 mW/cm2). The deep blue solution was filtered through a sintered glass and the volume was reduced to 20 mL under vacuum. This solution was cooled down to 4 °C and filtered again. The blue solution was treated three times with 75 mL of ethyl acetate, and the decanted blue solution was collected and evaporated to dryness under a vacuum.
All the ranelate species employed in this work are non-toxic and can be manipulated and discarded under normal, ambient conditions.
2.2. Detection of Tb3+
The experiments were carried out in acetonitrile. A total of 500 µL of the RanB solution was added at 1.5 mL of the Tb3+ solution of known concentration. The measurement was taken at λexc = 368 nm, after 10 min, to ensure the equilibrium of the system.
2.3. Measurements
The absorption spectra were recorded on a Hewlett-Packard HP-8453 diode-array spectrophotometer, with a quartz cuvette (10 mm). Emission spectra and fluorescence lifetime were obtained with a Quanta Master 300 Photon Technology spectrofluorometer. Darkfield hyperspectral microscopy images were obtained with a CytoViva® (Auburn, AL, USA) ultra-resolution imaging system, composed of a special arrangement mounted on an Olympus BX51 microscope.
2.4. Theoretical Calculations
DFT and TD-DFT calculations were performed at the MO6-2X level97 using cc-PVTZ98 functions in Gaussian0915, running on an Octa-core Intel Processor i7-4790K CPU @ 4.00 GHz, 16 GB DDR3 2666 MHz and SSD 512 GB. The attempts involved several days of processing, leading to an orthogonal arrangement for the thiophene rings, which is not compatible with the NMR [
7] and spectroscopic data. In parallel, semiempirical ZINDO/S calculations were carried out using the Hyperchem 8.05 computational package, combining MM+ geometry and CI calculations, through iterative optimization cycles up to a convergence limit of about 10
−5 kcal Å
−1 mol
−1. As demonstrated by Gorelski and Lever [
14] and according to our own experience, there is a good agreement between the two methods. In the present case, contrasting with the DFT calculations, the semiempirical approach led to optimized geometries with planar configuration, in just a few seconds of computation. The electronic spectra were generated from single CI excitations in an active space involving 20 frontier molecular orbitals (10 highest occupied and 10 lowest unoccupied MOs). Because of the consistent results and practicality, the Zindo/S results were maintained in the spectroscopic discussion.
2.5. Cell Viability Assays
Human umbilical vein endothelial cells (HUVEC) were cultured in Roswell Park Memorial Institute 1640 medium (RPMI; Thermo Fischer, Waltham, MA, USA) supplemented with 10% fetal bovine serum (FBS; Thermo Fischer), 100 IU/mL penicillin, and 100 μg/mL streptomycin (Thermo Fischer). The cells were cultured under standard conditions in a humidified incubator at 37 °C with 5% CO2.
To verify cell viability alteration, HUVEC cells (5.0 × 10⁴ cells per well of culture plate-48 wells) were cultured in increasing concentrations of different ranelate compounds for 72 h. RanB was incubated at final concentrations of 0.15, 1.5, 15, and 150 µg/mL, and the percentage of viable cells was determined by the MTT colorimetric method. This method can assess the cell metabolic activity through the NAD(P)H-dependent oxidoreductase enzymes which are capable of reducing the tetrazolium dye (MTT), yielding formazan as a purple insoluble product. After incubation, cells were washed twice with warm PBS and then incubated by MTT (25 µg/mL) dissolved in cell medium for 2 h. The cell medium was discarded and the formazan crystals generated by viable cells were dissolved in 200 µL of DMSO. The percentage of viable cells was determined from the absorbance reading at 550 nm relative to the absorbance of control cells (taken as 100% viability), using a SpectraMax i3 Multi-Mode Detection System from Molecular Devices.
3. Results and Discussion
RanB is easily obtained in a one-pot procedure, just by mixing strontium or lithium ranelate with 6 M HCl and leaving it under the sun or UV light and air. The reaction involves the decarboxylation of ranelic acid at the C5 position, generating the H5Ran form [
15] which crystallizes in the dark or converts into RanB in the presence of light, as shown in
Scheme 1.
3.1. Electronic Spectra and Theoretical Simulation
The RanB species is very attractive because of the deep blue color, which is stable in an aqueous solution, resisting strong acids (e.g., HCl 6 M) and direct exposition to sunlight for long periods of time. The UV-Vis spectrum of RanB exhibits an intense absorption peak at 648 nm, as shown in
Figure 2.
The electronic properties were investigated with the aid of theoretical calculations and were found to be dependent on the molecular geometry involving the coupling of the thiophene rings. DFT and TD-DFT calculations were exhaustively performed at the MO6-2X level97 using cc-PVTZ98 functions in Gaussian0915. Despite the long time involved in the calculations, the optimized geometries always led to an orthogonal configuration for the thiophene rings, and the theoretical spectra departed completely from the experimental ones. Alternative calculations were carried out employing the ZINDO/S method, from the classical Hyperchem program.
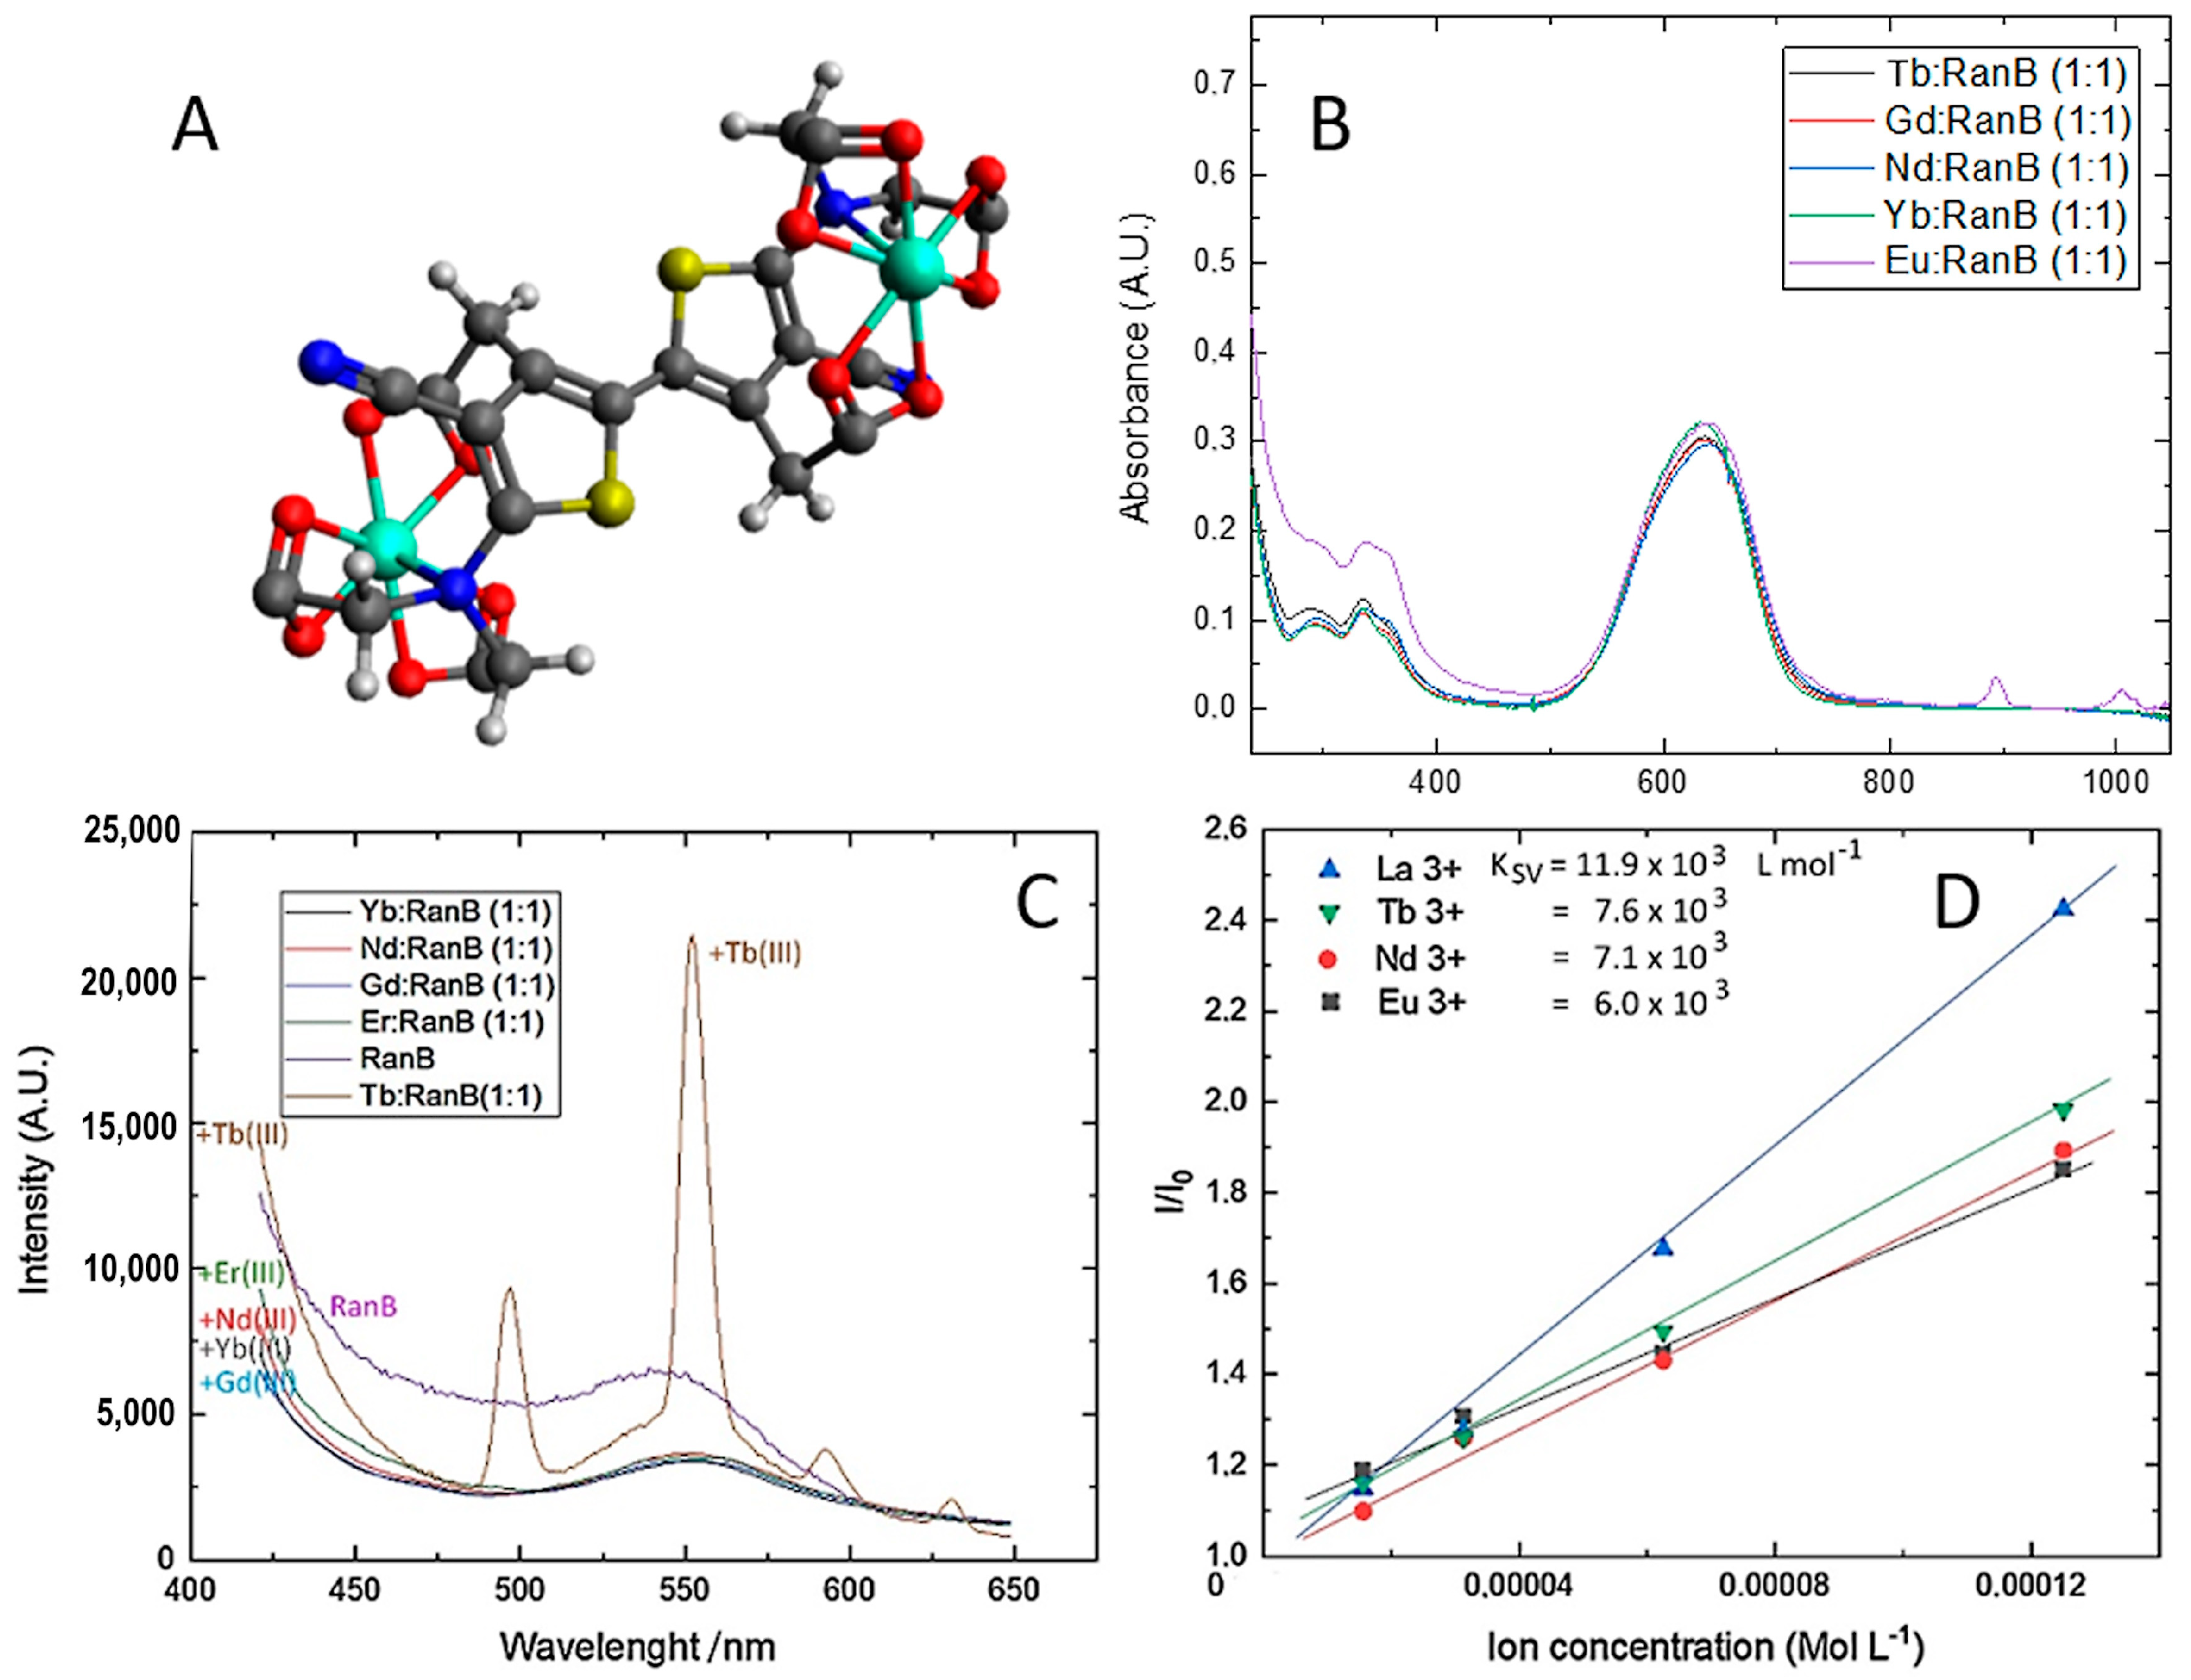
To our surprise, the Hyperchem calculations led consistently to a planar geometry, as shown in
Figure 3, requiring just a few seconds of processing. It should be noted that the planar RanB molecule exhibits an inversion center, corresponding to a C
i symmetry, turning the electronic transitions restricted by Laporte’s rule. However, considering the molecular complexity, including vibronic coupling mechanisms and the dynamic interactions with the solvent, the inversion center seems to be little relevant in our case.
The ZINDO/S calculations were able to reproduce the strong electronic band in the visible, as summarized in
Table 1. The relevant molecular orbitals were plotted in
Figure 4, showing their relative energies and the 2D orbital contours involved. The strong absorption band at 648 nm corresponds to the HOMO(105)→LUMO (106) transition and seems to involve electronic migration and reorientation of the dipole moment to the center of the molecule. The observed weak shoulder (deconvoluted) around 597 nm is ascribed to the MO105→MO107 transition and seems to involve substantial electron density migration to the isonitrile groups in the excited state (see
Figure 4). The electronic band expected at 480 nm is theoretically consistent with a spin-forbidden MO105→MO107 transition estimated at 474 nm. The remaining bands are relatively less intense, but a special comment should be addressed to the theoretical transition at 363 nm, corresponding to MO(105)→MO(115) excitation. This transition involves the reorientation of the electron density from the central thiophene rings (see MO105) to the peripheral carboxylate groups (see MO115) and will be important for understanding the interaction of RanB with Tb
3+ ions.
3.2. Electronic Spectra and Theoretical Simulation
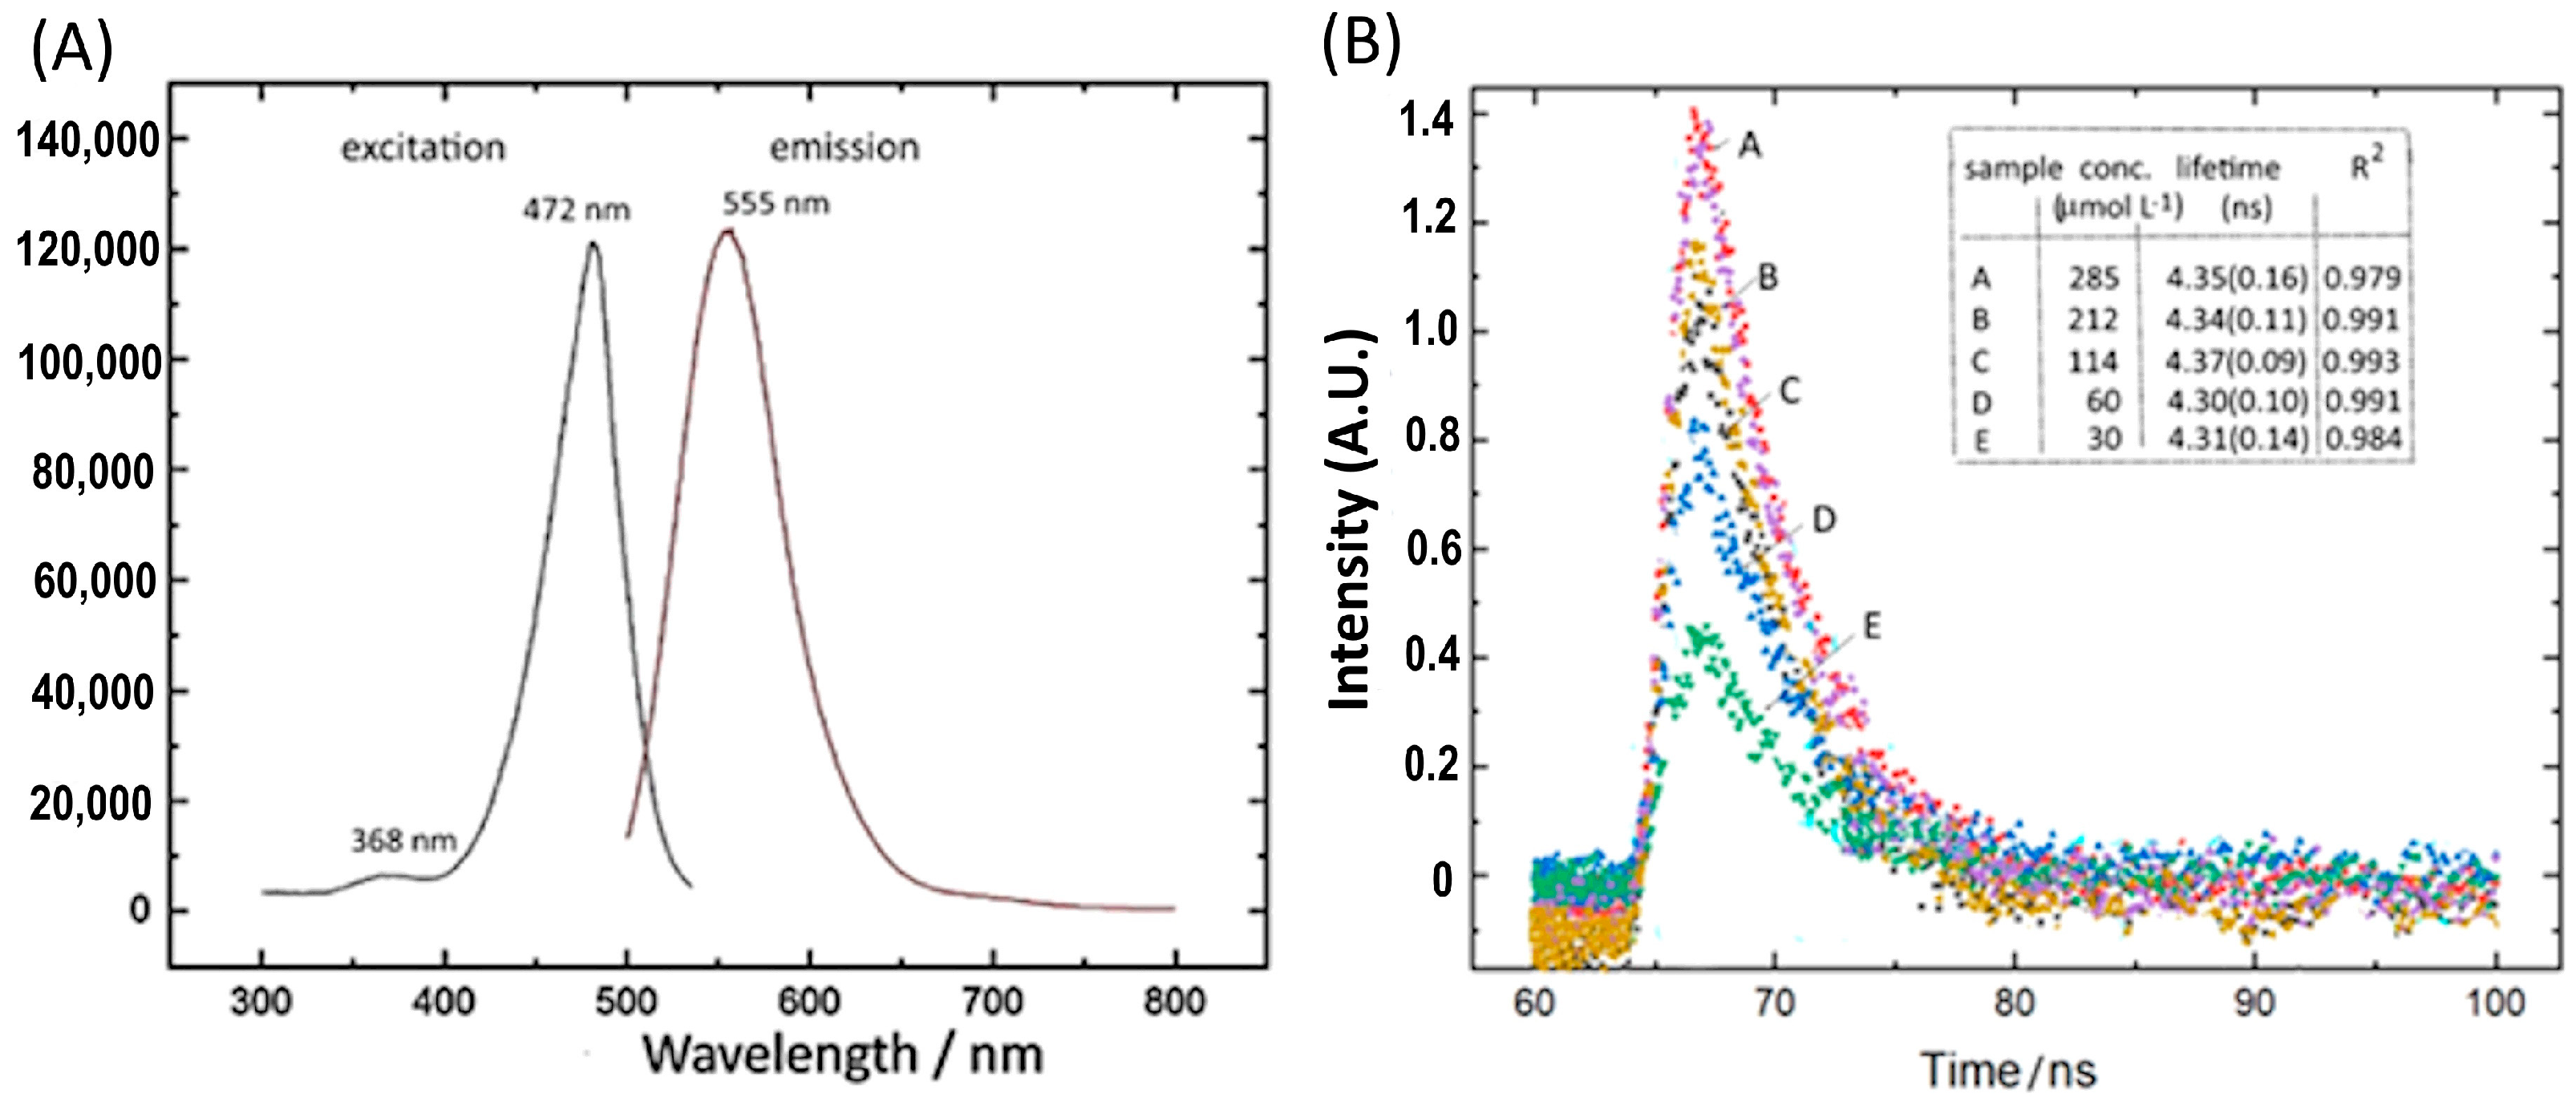
RanB exhibits a fluorescence emission peak with maximum intensity at 555 nm and the excitation spectrum has an excitation peak at 472 nm. The observed emission quantum yields were typically 0.503 (±0.02) at room temperature. The lack of emission above 600 nm indicates that the LUMO(106)→HOMO(105) transition is not involved in the fluorescence spectrum. Instead, the excitation coincides with the spin-forbidden HOMO(105)→LUMO(107) band, predicted at 472 nm. Therefore, the LUMO107 level is the best candidate for the observed fluorescence emission at 555 nm.
It should be noted that the energy gap between the LUMO107 (6.56 eV) and LUMO106 (6.11 eV) levels seems to be large enough to prevent internal conversion to the lowest level. If the energy conversion between LUMO107 and LUMO106 were efficient, the fluorescence emission would occur at 648 nm or above, and this has not been observed. Similarly, comparing the theoretical energy levels in the sequence LUMO108 (7.23 eV), LUMO109 (7.74 eV), LUMO 110 (7.81 ev), LUMO111 (7.87 eV), LUMO 112 (7.91 eV), LUMO113 (8.09 eV), LUMO114 (8.20 eV), and LUMO115 (8.37 eV), one can see that there are significant energy gaps only between LUMO107, LUMO108, and LUMO109 (around 0.5–0.6 eV). This explains the weak excitation peak at 368 nm (
Figure 5A), involving the LUMO105-LUMO115 transition, indicating that the internal conversion from LUMO 115 to LUMO 107, is poorly effective, in agreement with the occurrence of the mentioned energy gaps along the LUMO levels sequence.
The absorption and emission scheme for RanB is summarized in the Jablonski diagram of
Figure 6 (the energy transfer scheme for terbium ions has also been included for the sake of brevity and will be discussed later).
The lifetime of the excited state and the fluorescence quantum yield using fluoresceine [NaOH] = 0.1 mol L
−1 as standard (Qy
st = 0.925), were measured at 480 nm and 486 nm, respectively, at different concentrations, as shown in
Figure 5B. The measured lifetime of 4.3 ± 0.1 ns does not vary with the concentration, and the kinetics can be fitted by a single exponential decay. This means that only a single species is involved in the emission, allowing to exclude any possible molecular aggregate or impurities, in the system.
The emission spectra were also investigated under a nitrogen and oxygen atmosphere, yielding identical results. That means that no energy of the excited state is being transferred to the oxygen molecules and that RanB cannot generate singlet oxygen.
3.3. Solvent Effects in the Electronic Absorption and Emission Spectra
The electronic spectra are only slightly influenced by the solvent. As shown in
Table 2, in a protic medium, the absorption peak is red-shifted, and in an aprotic apolar medium, the absorption peak is blue-shifted. In aprotic solvents, the shift can be correlated to the β Kamlet-Tarf term (hydrogen bond acceptor term). As the hydrogen bond acceptor propriety of the solvent increases, the peak is more red-shifted. That means in great HB acceptor solvents, the excited state is better stabilized, and energy between the ground state and exited state is decreased. The emission spectra follow the same tendency with the exception of THF.
3.4. Interaction of RanB with Lanthanoid Ions
Because of the several hard and soft coordinating groups, RanB is expected to be a universal ligand for metal ions, by analogy with EDTA. However, its coordination chemistry has not been reported yet. In this work, we focused on the lanthanoid series, because of their expected affinities to the carboxylate groups of RanB, and of the possibility of exploring energy transfer processes with europium and terbium ions.
The electronic spectra of RanB in the presence of neodymium, gadolinium, erbium, ytterbium, europium, and terbium can be seen in
Figure 7B. The changes in the absorption band of RanB are small, but significant, indicating the complexation of the lanthanoid ions with the carboxylate groups at pH 6.0. By increasing the pH, the complexation is expected to be enhanced, involving the iminodiacetate groups which act as tridentate species. A special composition can be derived using the ratio [RanB]/[Ln
3+] = 2, corresponding to a neutral binuclear complex (
Figure 7A).
As shown in
Figure 7C, it is possible to see that, in every case, the emission of the pigment, when excited at 360 nm, is partially quenched. To know if this is a dynamic or static quenching, the Stern-Volmer constant was calculated for all the lanthanoids. As one can see in
Figure 7D the Ksv of Eu
3+, Nd
3+ and Tb
3+ are almost the same, as expected, since the chemical properties of lanthanoids are very similar. As shown in
Figure 7D, the Stern-Volmer curve is linear, and that indicates this is a dynamic quenching [
16].
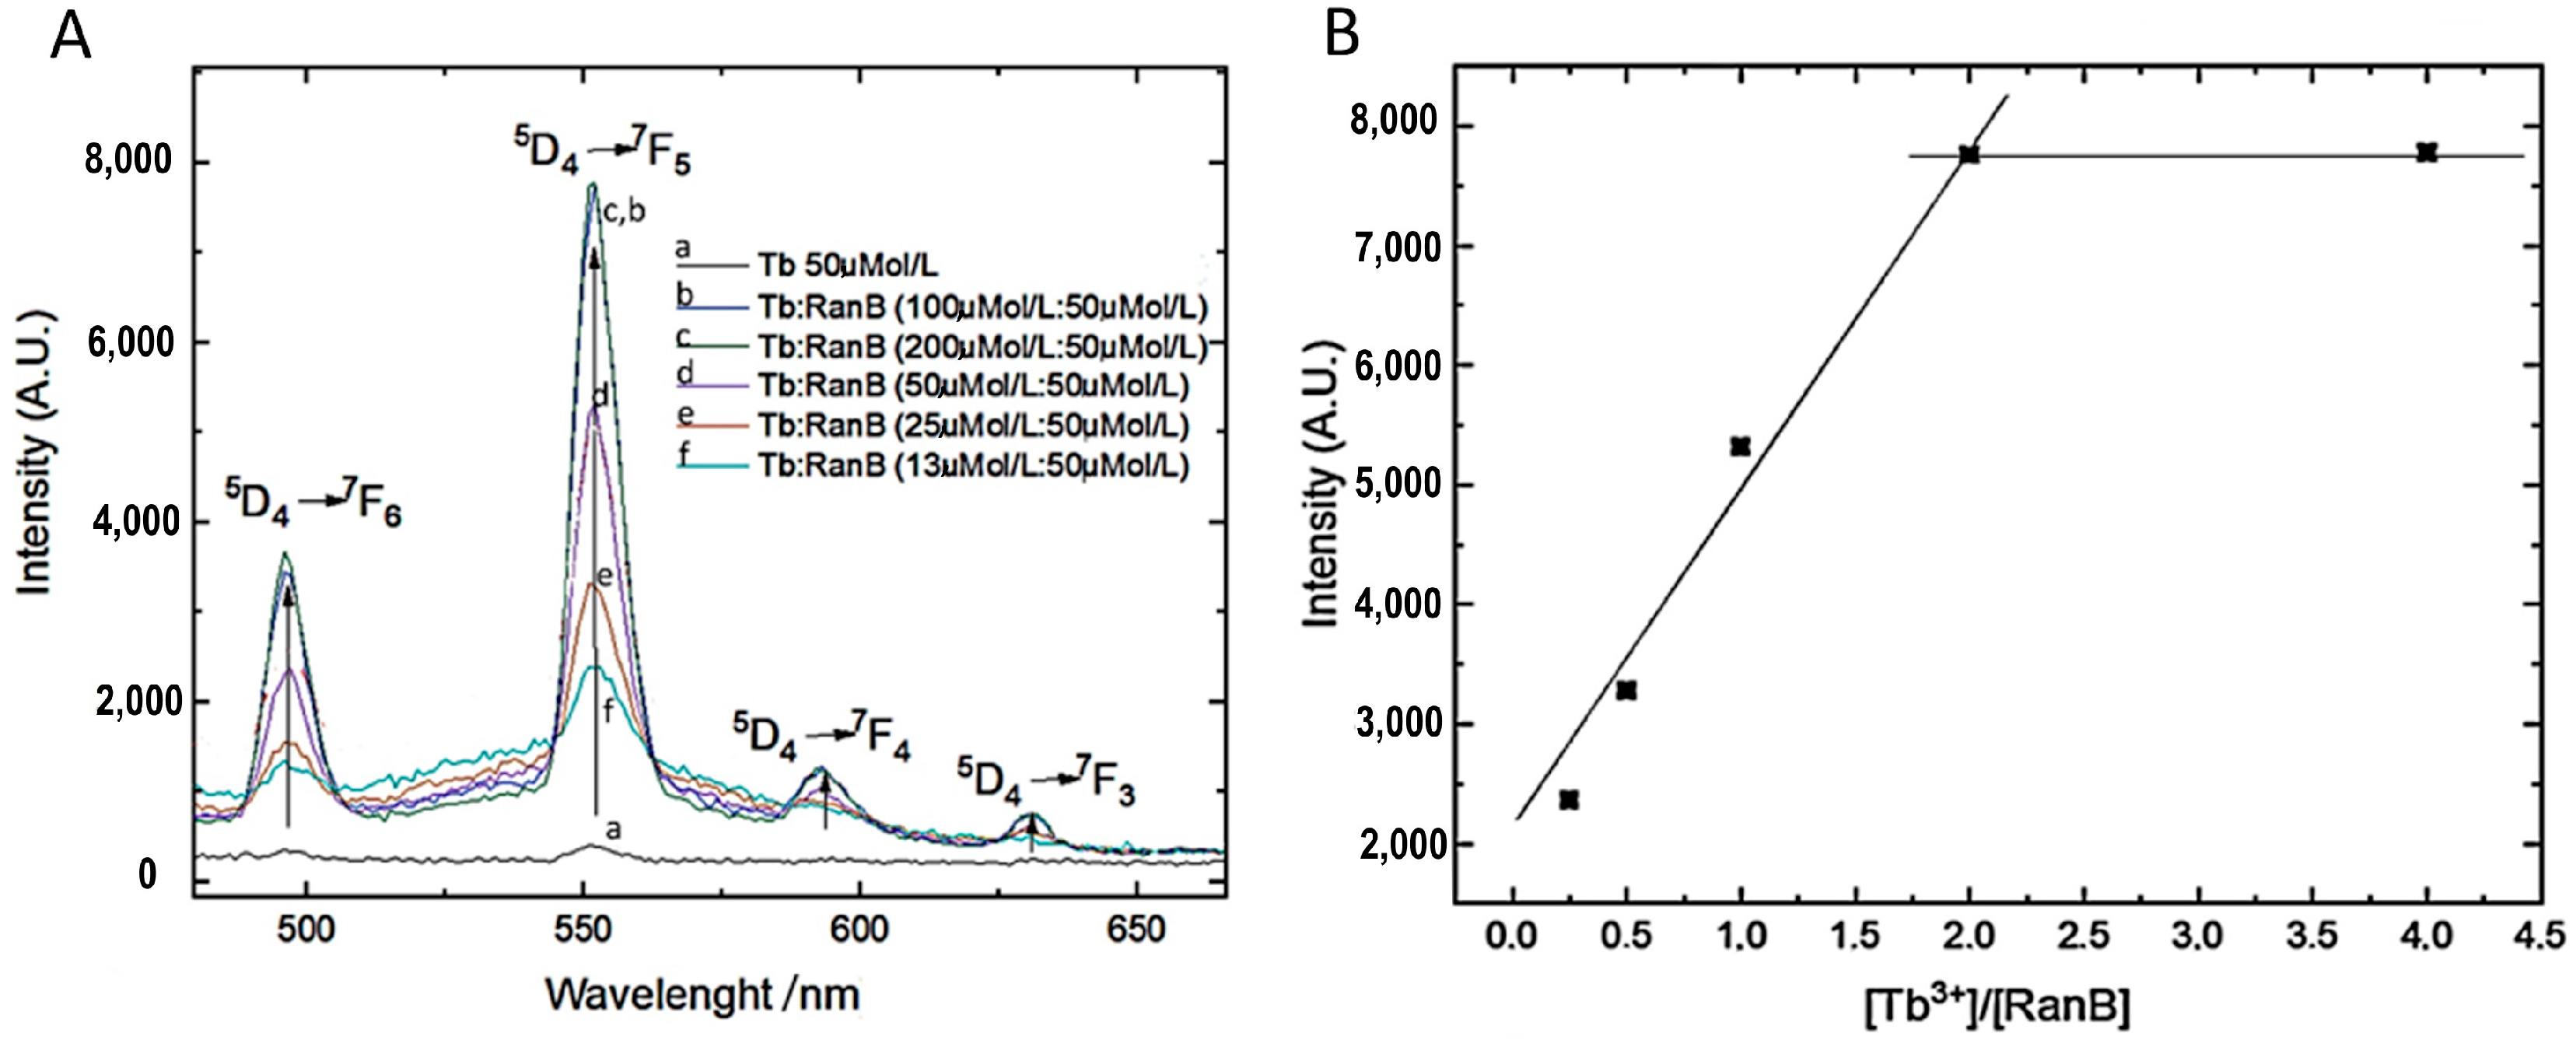
The emission and excitation spectra of RanB:Tb
3+ (1:1) in acetonitrile are shown in
Figure 8 The excitation spectra contain 2 main signals. The first one is the one at 470 nm. When excited at this wavelength, it is not possible to detect the sharp emission of Tb
3+. This means that either the RanB cannot transfer energy to the metal ion or the emission of free RanB hides the emission of the terbium. The second peak is the one at 368 nm. When excited at this wavelength, it is possible to see the sharp peak of Tb
3+. This is the energetic level that transfer energy to the metallic center, and this ion emits in agreement with the energy levels of the Tb
3+ ions [
17,
18,
19] shown in
Figure 5.
As the relation of Tb3+/RanB grows, the intensity of the peaks grows in a linear way until it reaches a ratio of 2.
In
Figure 8A it is possible to see how the emission spectra change with the variation in the proportion of RanB and Tb
3+. The emission peaks of Tb
3+ grow as the Tb
3+/RanB concentration rate grows. However, that reaches a limit at the rate Tb
3+/RanB = 2. This limit was expected as the RanB has 6 carboxylic acids to be ionized and Tb
3+ has a charge of 3+. It is also possible to see in the emission spectra the RanB emission.
3.5. RanB Toxicity Assays
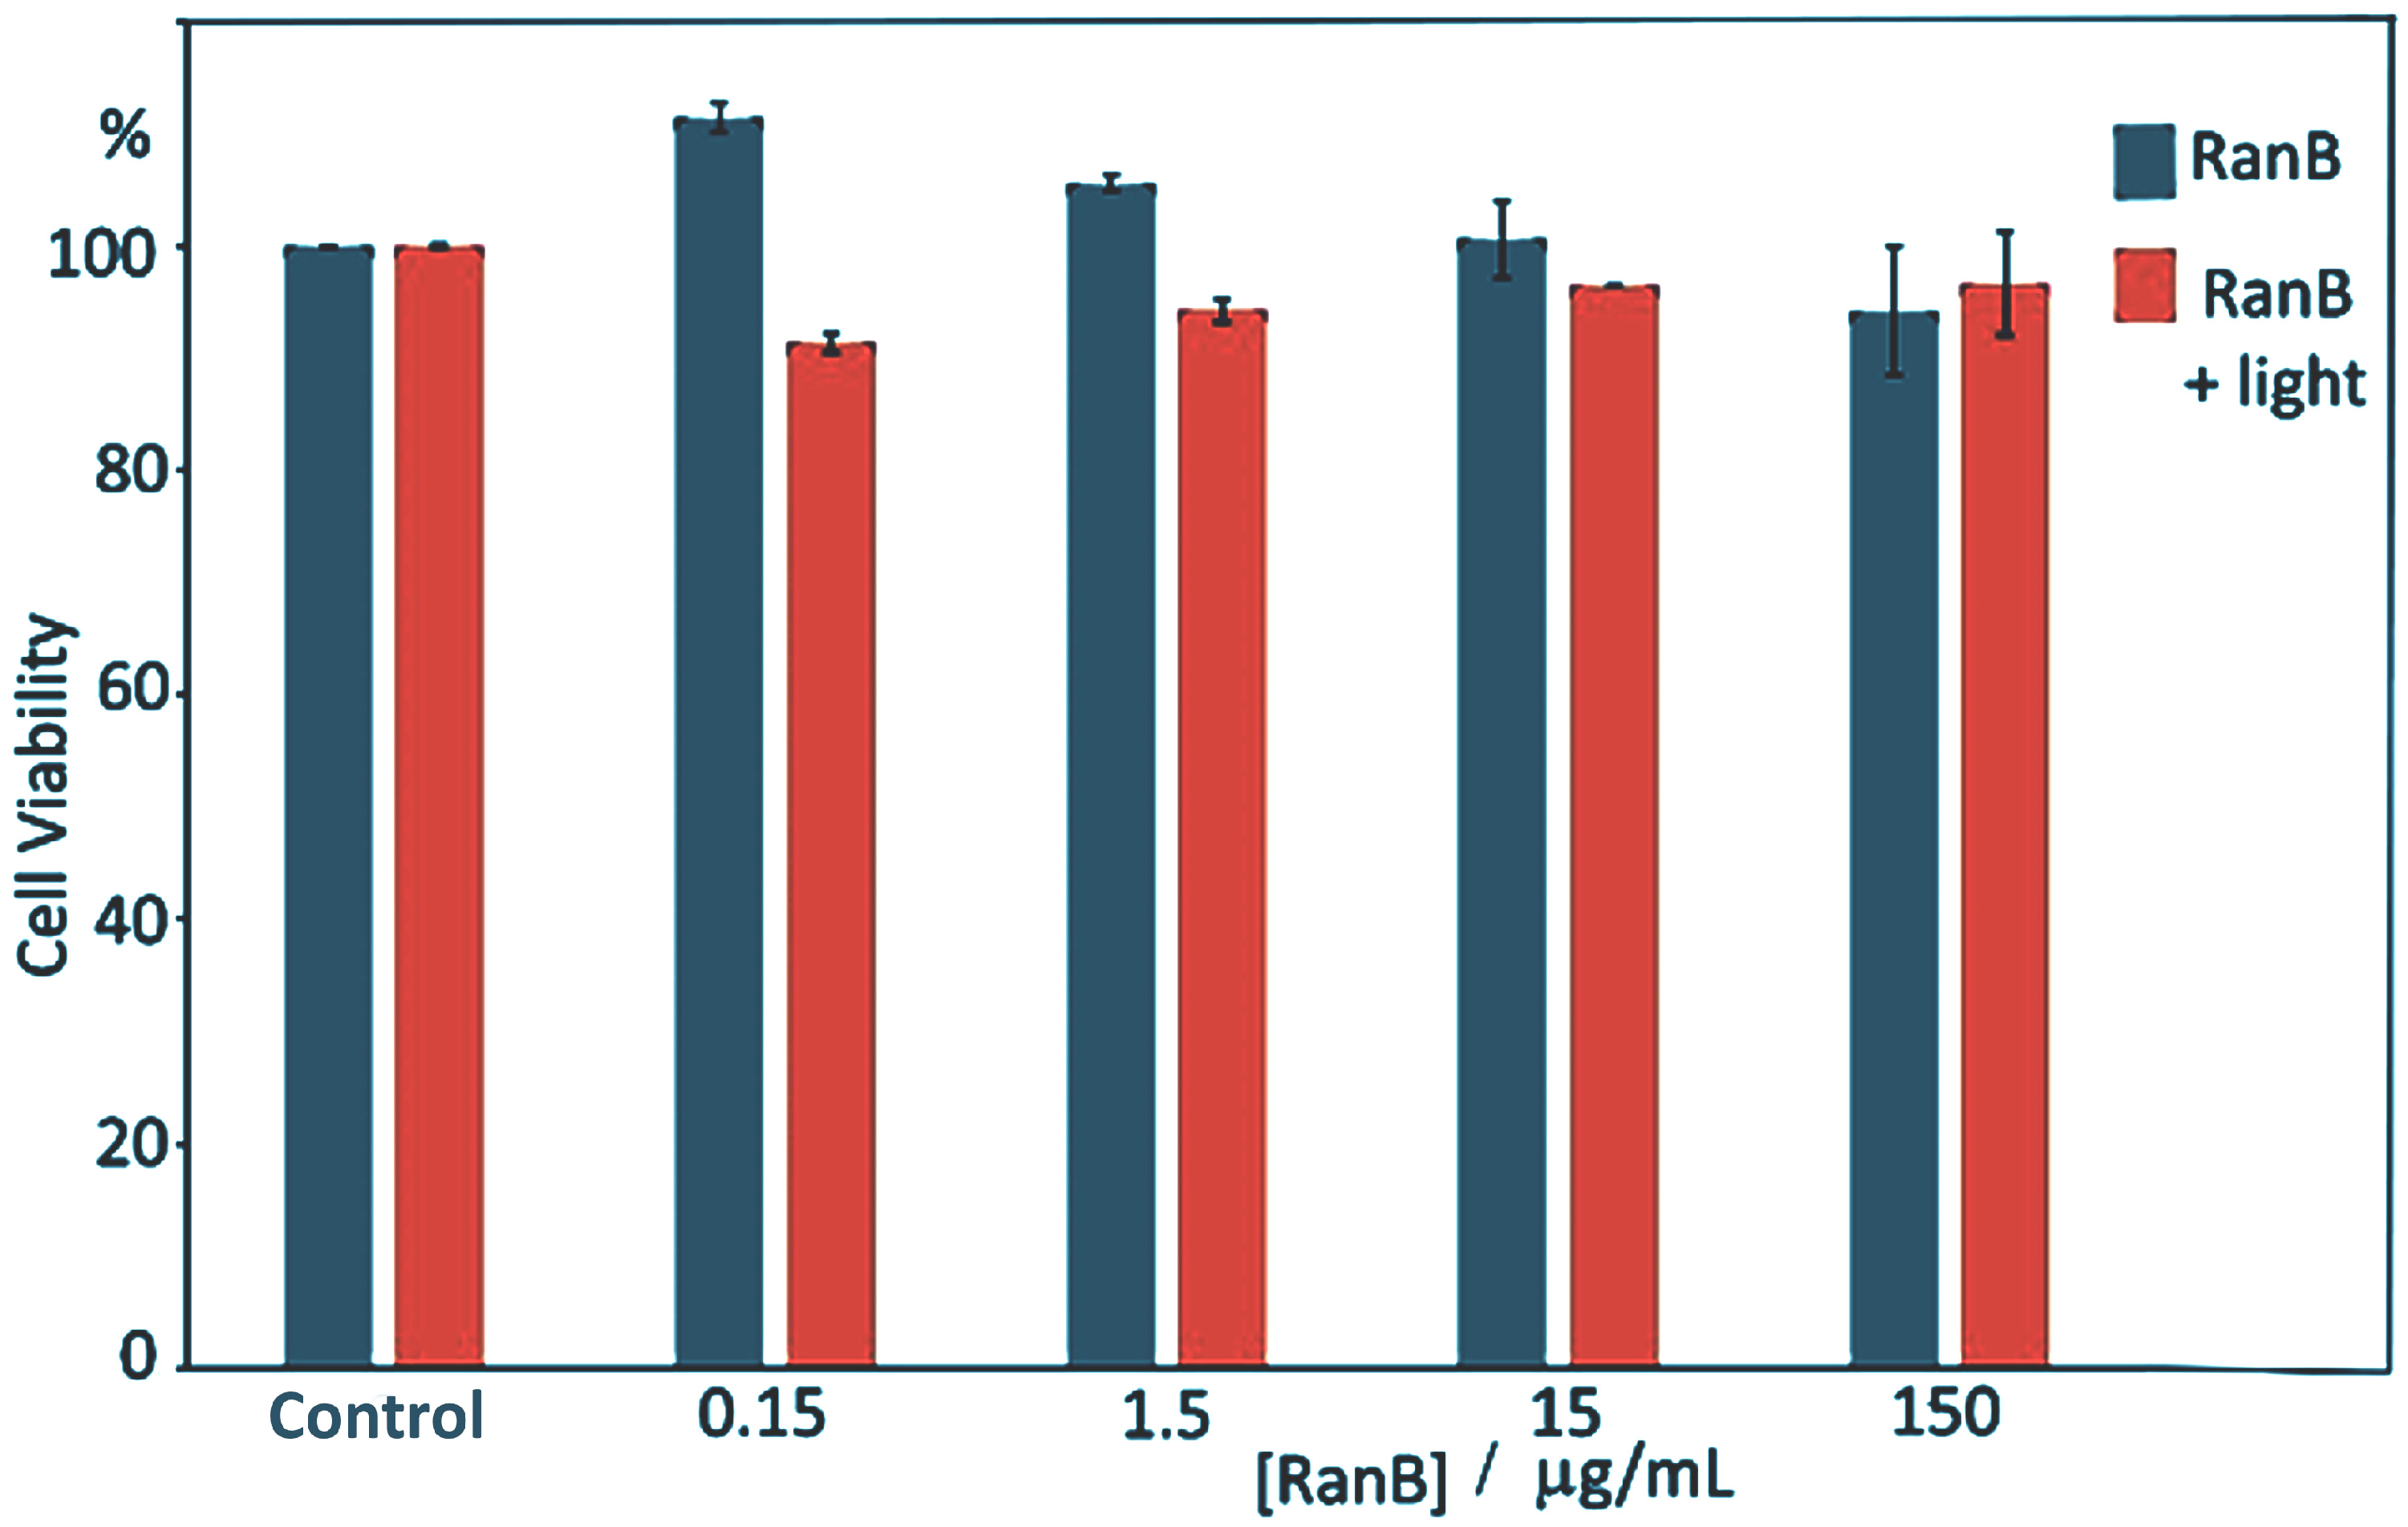
The cell viability of ranelate compounds has been extensively using human umbilical vein endothelial cells (HUVEC) and the toxicity was evaluated by the MTT method (
Figure 9). The HUVEC cells were cultured in the presence of 0.15, 1.5, 15, and 150 µg/mL of RanB for 72 h and compared with control cells. No significant difference has been observed for the cell viability (2% deviation) for the several concentrations, indicating negligible toxicity. Because of the photoactivity of RanB, the viability tests were also repeated in the presence of sunlight (using a solar simulator) for 40 min, exhibiting no detectable difference from the dark samples.
The lack of toxicity prompted us to investigate the use of RanB for staining living cells and for convenience we have employed the very accessible Kefir cultures. Kefir grains are safe and widely employed in fermentation processes, hosting various microorganisms of acid-lactic bacteria and yeasts, in a polysaccharide/protein matrix. Their fine structure has been elucidated by Lu et al. [
20] based on epifluorescence and scanning electron microscopies. The epifluorescence images revealed a polyhedron-like net structure, with numerous bacilliform signals of DAPI-stained bacteria, with the yeast cells appearing as bright spots.
When the Kefir grains were treated overnight with RanB, they developed a deep blue color, as shown in
Figure 10A,B. By monitoring a thin section of a blue grain in a dark field CytoViva hypermicroscope with a fluorescence detector, round-shaped yeast cells appeared very bright and well-defined (
Figure 10C) inside the polyhedron-like net structure. The fluorescence spectra (
Figure 10D) are consistent with the emission pattern of RanB, with maximum emission at 555 nm, confirming its performance as an effective dye for yeast cells. The bacilliform distribution of bacteria seems much less evident (
Figure 10E), suggesting that RanB is selectively interacting with the yeast cells. Another remarkable aspect is that the Kefir culture seems rather compatible with RanB, growing normally, with no evidence of inhibition after several days in the culture.
4. Conclusions
RanB deserves special consideration among the scarce number of existing blue dyes [
21,
22,
23,
24,
25,
26,
27] because of its easy preparation and non-toxic nature. It exhibits good stability in water, resisting sun and ambient light, as well as acidic and aerobic conditions. Its molecular structure is compatible with a planar geometry encompassing two sets of carboxylate, isonitrile, thiophene, and iminodiacetate groups, thus being able to coordinate metal ions. Its strong absorption band at 648 nm can be ascribed to the π→π*, HOMO105→LUMO106, transition. The fluorescence spectra depart from most trivial cases by emitting at higher energy (e.g., 555 nm) than the main absorption band. The fluorescence kinetics correspond to a single emission profile, with an observed lifetime of 4.3 ns (water). According to the theoretical calculations, the emission level was ascribed to LUMO(107), which is relatively isolated from the LUMO(106) level, e.g., by 0.45 eV, preventing the internal conversion cascade. The direct excitation involving the spin-forbidden HOMO105-HOMO107 transition coincides with the main band at 472 nm.
The interaction of RanB with lanthanoid ions involves the coordination of the iminocarboxylate groups, leading to symmetric bridged binuclear complexes. Except for Tb3+ ions, coordination promotes a decrease in the emission intensities of RanB, presumably by means of vibronic interactions with the ligand groups. In the case of Tb3+, the excitation at 368 nm promotes the transition from MO105 to MO115, which can transfer energy to the 5D4 level, giving rise to a cascade of emission to the 7FJ levels. Therefore, RanB is a good sensitizer agent to Tb3+ ions, enhancing emission, and improving its use as a luminescence agent.


