Article

Substituent Control of Near-Infrared Absorption of Triphenylamine Radical Cation

1
Faculty of Chemistry, Material and Bioengineering, Kansai University, 3-3-35 Yamate-cho, Suita 564-8680, Japan
2
Division of Applied Chemistry, Graduate School of Natural Science and Technology, Okayama University, 3-1-1 Tsushima-naka, Kita-ku, Okayama 700-8530, Japan
3
Osaka Research Institute of Industrial Science and Technology, 1-6-50 Morinomiya, Joto-ku, Osaka 536-8553, Japan
*
Author to whom correspondence should be addressed.
Colorants 2022, 1(3), 354-362; https://doi.org/10.3390/colorants1030021
Submission received: 27 June 2022 / Revised: 18 July 2022 / Accepted: 28 July 2022 / Published: 1 August 2022
(This article belongs to the Special Issue Colorants: Ancient and Modern)

Abstract

:
Five triphenyltriphenylamines with various substituents were investigated as precursors for near-infrared absorbing materials. Cyclic voltammetry (CV) studies showed that they all give stable radical cations in solution. The radical cations obtained by one-electron chemical oxidation of these compounds show strong absorption in the near-infrared region, and the position of the absorption is strongly influenced by the substituent. DFT (density functional theory) calculations suggest that the introduction of stronger electron-donating substituents would result in a smaller HOMO–SOMO energy gap and thus a larger long wavelength shift, which is consistent with the experimental results. On the other hand, strong electron-withdrawing substituents increase the HOMO–SOMO energy gap, resulting in a short wavelength shift. The position of the near-infrared absorption peak of the triphenylamine radical cation can be controlled to the longer or shorter wavelength direction depending on the substituent. A molecular design of near-infrared absorbing dyes utilizing the electronic effects of substituents is described.

1. Introduction

Recently, compounds that exhibit absorption in the near-infrared region (800–2500 nm) have been attracting much attention. WO3 and MoO3 are typical examples of inorganic compounds that show strong absorption in the near-infrared region [1,2]. On the other hand, as organic compounds, cyanine dyes with extended polymethine skeleton, squarylium dyes, quinone compounds, azo compounds, etc., are listed as near-infrared absorbing compounds [3,4,5,6,7,8]. In addition, phthalocyanine dyes with aluminum or zinc at the center, various naphthalocyanine compounds, and nickel dithiolene complexes with a planar tetracoordination structure are representative among metal complexes [3,4,5,6,7,8]. These are expected to be applied to various optical fields such as optical recording media, security marking, optical filters, and lithography [9]. In the field of plate-making materials using laser beams, high sensitivity to laser beams with wavelengths longer than 700 nm is required, and excellent solubility in common organic solvents and heat resistance are also required for near-infrared absorption compounds. Furthermore, in order to increase the efficiency of photovoltaic power generation, it is desirable to effectively utilize the near-infrared rays contained in sunlight, so it is essential to develop materials that efficiently absorb near-infrared rays. In response to these demands from industry, many research groups have been developing organic near-infrared absorbing materials with highly extended π-systems, but the difficulty of synthesis and low solubility remain challenges. Chemical or electrochemical one-electron oxidation of triphenylamine (TPA) with a substituent at the para-position gives a stable radical cation with strong absorption in the visible light region (around 650 nm) [10,11,12]. This absorption is due to the HOMO–SOMO transition of the radical cation, which is a property unique to open-shell species molecules [13]. We focused on this transition and launched the development of near-infrared absorbing dyes. We examined extended π-system of TPAs and showed that the corresponding radical cations have absorption in the near-infrared region. Recently, we showed that the radical cations of TPA with phenyl (1), biphenyl, and naphthyl groups have absorption in the near-infrared region, respectively [13]. In particular, the absorption peak of TPA radical cations with naphthyl groups exceeds 1000 nm and can be classified as an NIR-II dye. Furthermore, we designed and synthesized benzofuran- [14] and benzothiophene- [15] appended TPAs and reported that their radical cations exhibit absorption at 1245 and 1212 nm, respectively. As demonstrated with these molecules, extension of the π-system is an effective way to shift the absorption peak toward longer wavelengths, but synthesis of larger extended π-compounds is expected to be synthetically challenging, as well as to decrease solubility. To overcome these challenges, a new molecular design rule that controls the position of the absorption peak will be required. Nelson et al. studied triphenylamine radical cations with various substituents by the stopped-flow method and reported that the electronic effects of the substituents affect the absorption position of the TPA radical cation in the visible light region [12]. We hypothesized that this substituent effect might also be effective in controlling the peak position of the TPA radical cation in the near-infrared region. With this result, we decided to investigate a series of triphenyltriphenylamines with various electron-donating or electron-withdrawing groups. In this study, we considered triphenyltriphenylamine with methoxy (2) [16], methyl (3) [17], fluoro (4) [18], and cyano (5) [19] groups as appropriate model molecules (Figure 1). We also investigated compound 1 for comparison. We expected these radical cations to appear at different absorption peak positions in the near-infrared region, depending on the electronic effects of the substituents. Compounds 25 are employed in EL (electroluminescence) or hole-transport materials or reference compound for pH sensor molecule [16,17,18,19], but have not been investigated as near-infrared material precursors at all.

2. Results and Discussion

2.1. Theoretical Calculations
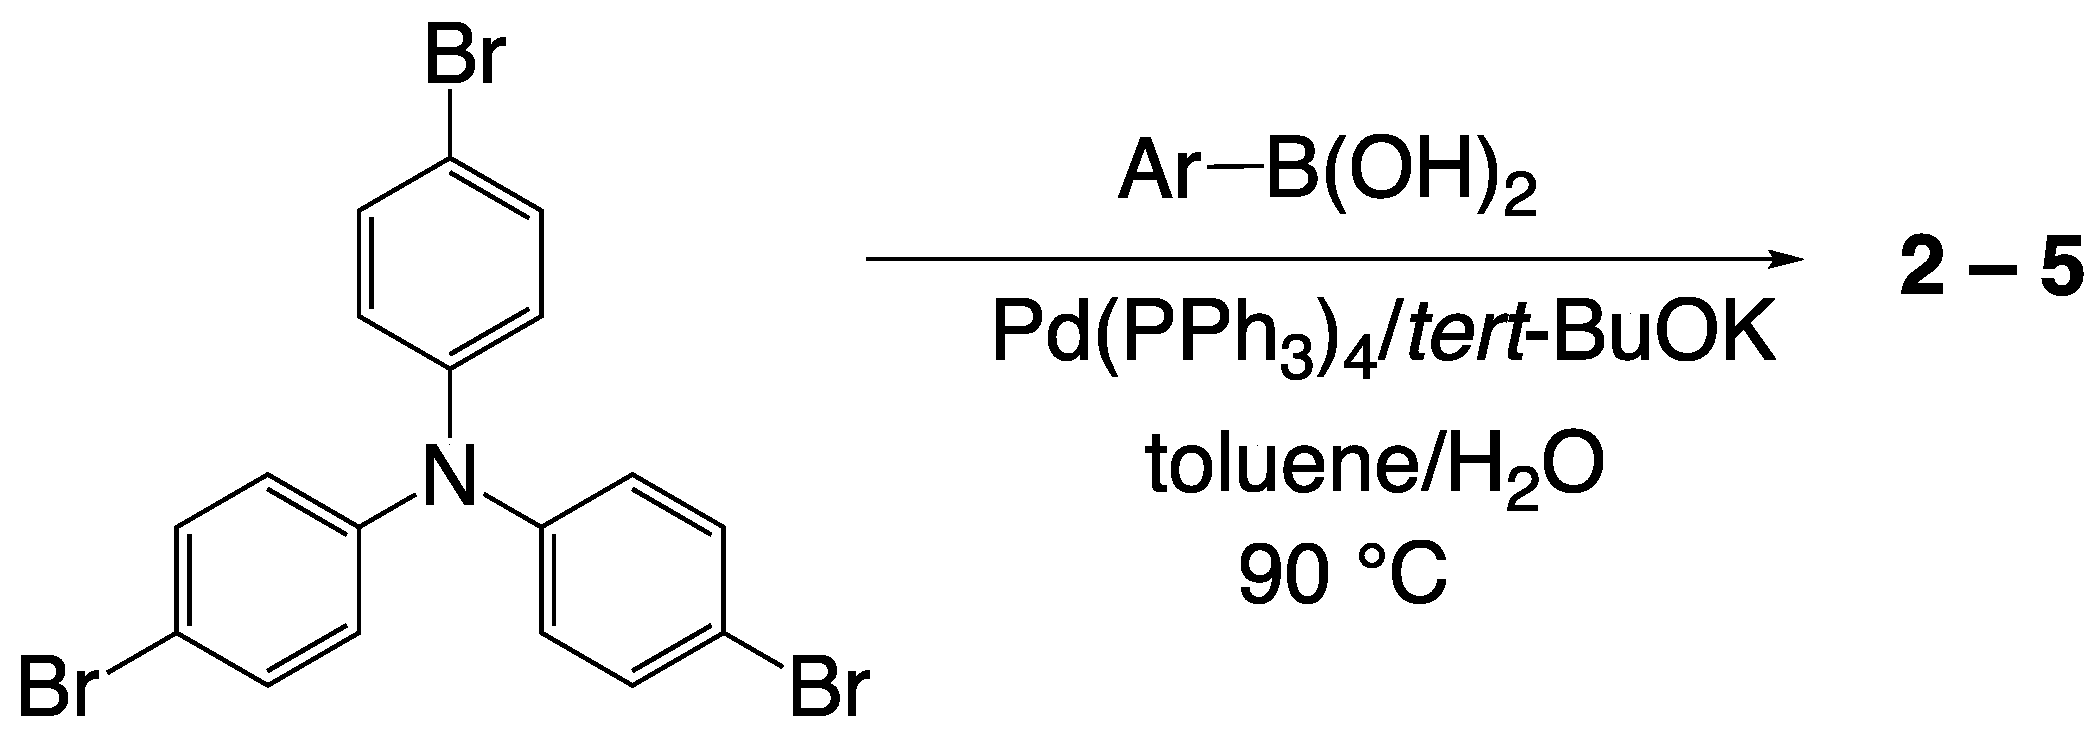
The absorption peaks in the near-infrared region of 1•+5•+ were estimated using DFT calculations at the UB3LYP/6-31G(d) level of theory with the polarizable continuum model using dichloromethane as a solvent (Figure 2). The calculated HOMO–SOMO energy gap of 1•+ is 1.91 eV, and 1•+ is expected to have a maximum absorption at 856 nm in dichloromethane. Indeed, 1•+ has a maximum absorption at 862 nm in dichloromethane [13], indicating the validity of this calculation method. The calculated HOMO–SOMO energy gap of 2•+ (1.46 eV) was much smaller than that of 1•+. The calculated maximum absorption wavelength of 2•+ is 1109 nm, which is classified as an NIR-II dye [5], indicating that the introduction of the methoxy group effectively reduces the HOMO–SOMO energy gap. The HOMO–SOMO energy gap of 3•+ (1.76 eV) with methyl groups was also smaller than that of 1•+. The calculated maximum absorption wavelength of 3•+ is 931 nm. It is suggested that 4•+ with fluorine atoms has a slightly smaller HOMO–SOMO energy gap than 1•+. The calculated maximum absorption wavelength of 4•+ is 891 nm. In contrast, 5•+ with cyano groups is found to have a wider HOMO–SOMO energy gap (2.00 eV) than 1•+, suggesting a short-wavelength shift. The calculated maximum absorption wavelength of 5•+ is 815 nm. These results (See Figures S1–S4 for more information on the results of DFT calculations) suggest that the absorption peak in the near-infrared region can be shifted to either the longer or shorter wavelength side, depending on the choice of substituent on the TPA radical cation. These results prompted us to prepare 25 and investigate the properties of the corresponding radical cations 2•+5•+.

2.2. Synthesis

The synthetic route for 25 is depicted in Scheme 1. These compounds were readily synthesized in one step from commercial available reagents by modifying the previously reported method [20,21]. The corresponding aryl boronic acid was reacted with 4,4′,4′′-tribromotriphenylamine under Pd-catalyzed Suzuki coupling reaction conditions to give the target compound in moderate yield (see Supplementary Materials for synthetic details).

2.3. Solubility

In recent years, device fabrication using printing processes has attracted attention in the field of organic electronics [22]. In general, organic materials to be applied to the printing process need to have a solubility of 0.1 wt% or better in common organic solvents [23]. We examined the solubility of compounds 25 in several organic solvents. As a general trend, the triphenyltriphenylamines 25 with substituents dissolved well in common organic solvents compared to compound 1 without substituents (see Table S1 for details for the solubilities of 15 in various organic solvents). Methyl-substituted 3 and fluoro-substituted 4 showed high solubility (>5 wt%), respectively. The solubility of 5 with cyano group varied greatly depending on the type of solvent employed. We previously reported several triarylamines with extended π-systems [13,14,15]. Among these derivatives, those that are expected to prefer planar structures exhibit low solubility for all organic solvents examined, and are not suitable for use in device fabrication by printing processes. On the other hand, molecular modification in this study is not expected to cause such a decrease in solubility.

2.4. Cyclic Voltammetry Measurements

In order to clarify the electrochemical properties of 25, cyclic voltammetry measurements were conducted at room temperature in dichloromethane, using 0.1 M tetra-n-butylammonium hexafluorophosphate (Bu4NPF6) as the supporting electrolyte. On an anodic sweep, 2 showed a reversible redox wave (E0 = 0.33 V vs. Fc/Fc+) (Figure S5). This reversible redox couple derives from the one-electron oxidation of the triarylamine moiety. Reflecting the strong electron-donating nature of the methoxy groups, E0 of 2 is shifted 0.09 V, cathodically, compared to that of 1. Compound 2, which is more readily oxidized than 1, is expected to give a more thermodynamically stable radical cation than 1•+. The voltammogram shape did not change at all after 10 cycles of the redox cycle, at a sweep rate of 25 mV/s, indicating stable radical cation 2•+ in solution (Figure S9). Similar studies were carried out for compounds 35, and the voltammograms of these compounds were also reversible, respectively (see Supplementary Materials for details). Compound 5 with strong electron-withdrawing groups also gave stable radical cations in solution. Reflecting the electronic effects of the substituents, the E0 values shifted towards the cathodic direction for compounds with more electron-donating substituents, and towards the anodic direction for compounds with more electron-withdrawing substituents. The redox potential of triphenyltriphenylamines can be shifted both cathodically and anodically by the electronic effects of the introduced substituents. The observed redox potentials E0 of compounds 15 and the HOMO energy levels determined by DFT calculations are shown in Table 1. The value of the redox potentials E0 showed good agreement with the values of the HOMO energy level obtained from the DFT calculations. With these results, we set out to study their absorption spectra.

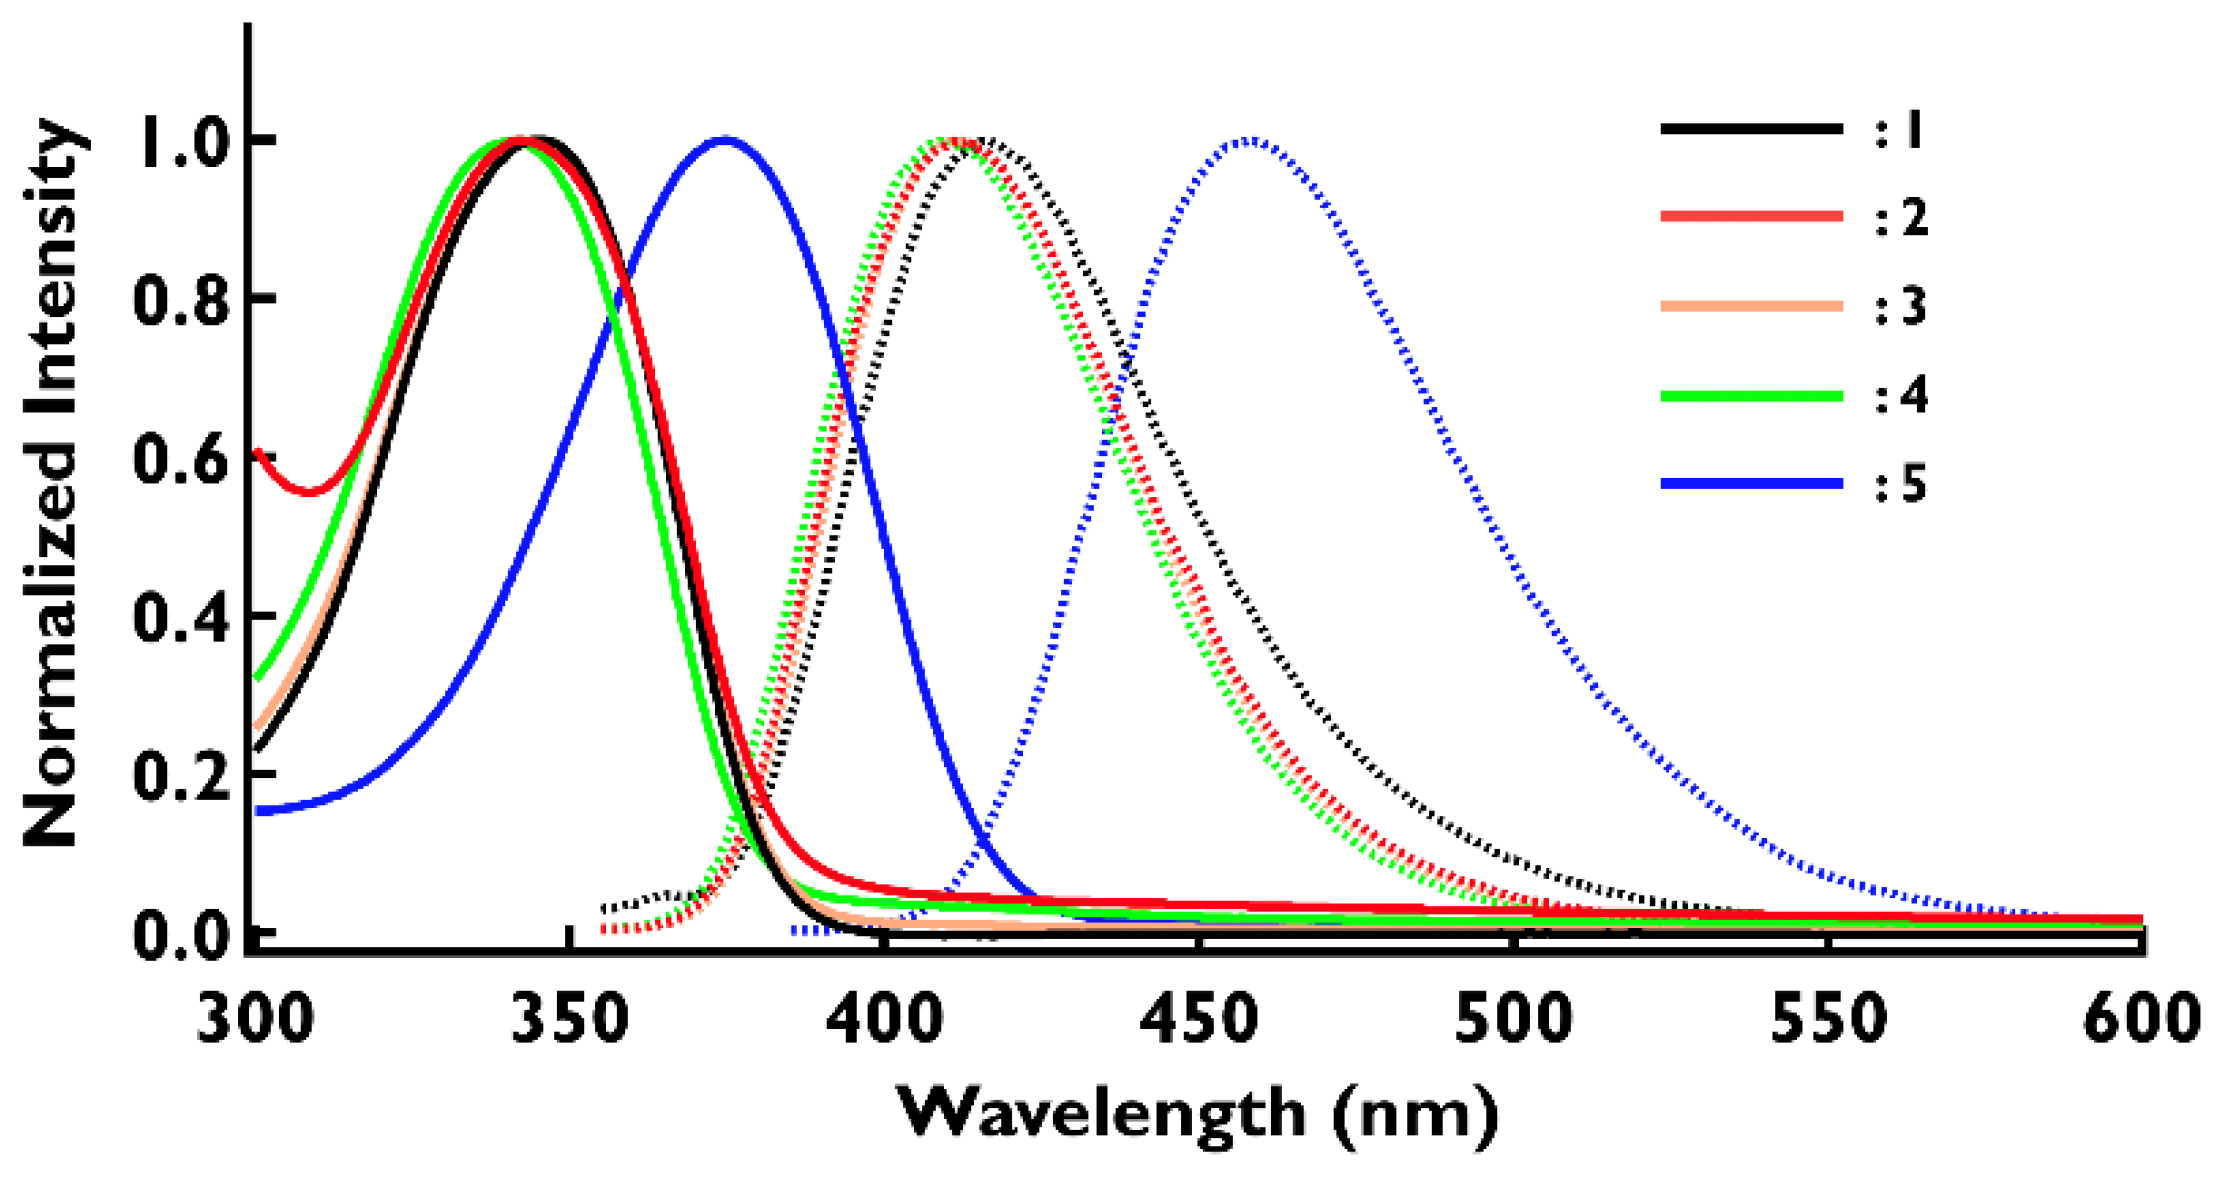
2.5. Absorption and Fluorescence Spectra of the Neutral Species, 15

The absorption and fluorescence spectra of compounds 15 in the neutral state were examined in dichloromethane. The absorption and fluorescence spectra of 2 are shown in Figure S13. Compound 2 showed a large absorption peak at 343 nm, corresponding to the absorption of the triarylamine chromophore. DFT calculations suggested that this absorption is due to the HOMO–LUMO and HOMO–LUMO+1 transitions. Upon excitation at 343 nm, 2 showed blue emission at 412 nm (Figure S13). Similar studies were conducted for compounds 35 (see Supplementary Materials for details). There is no significant difference in the absorption position of the neutral species of compounds 14, but only the absorption of 5 with cyano group is shifted toward the longer wavelength direction (Figure S16). Comparing the fluorescence spectra of compounds 15, compounds 14 showed emission peaks around 410 nm, but only 5 showed an emission peak at a position shifted to a longer wavelength. Overlays of the absorption and fluorescence spectra of compounds 15 are shown in Figure 3. The experimental and DFT calculated absorption spectra and experimental fluorescence spectra of compounds 15 are summarized in Table 2. The experimental and calculated values were in good agreement (see also Supplementary Materials).

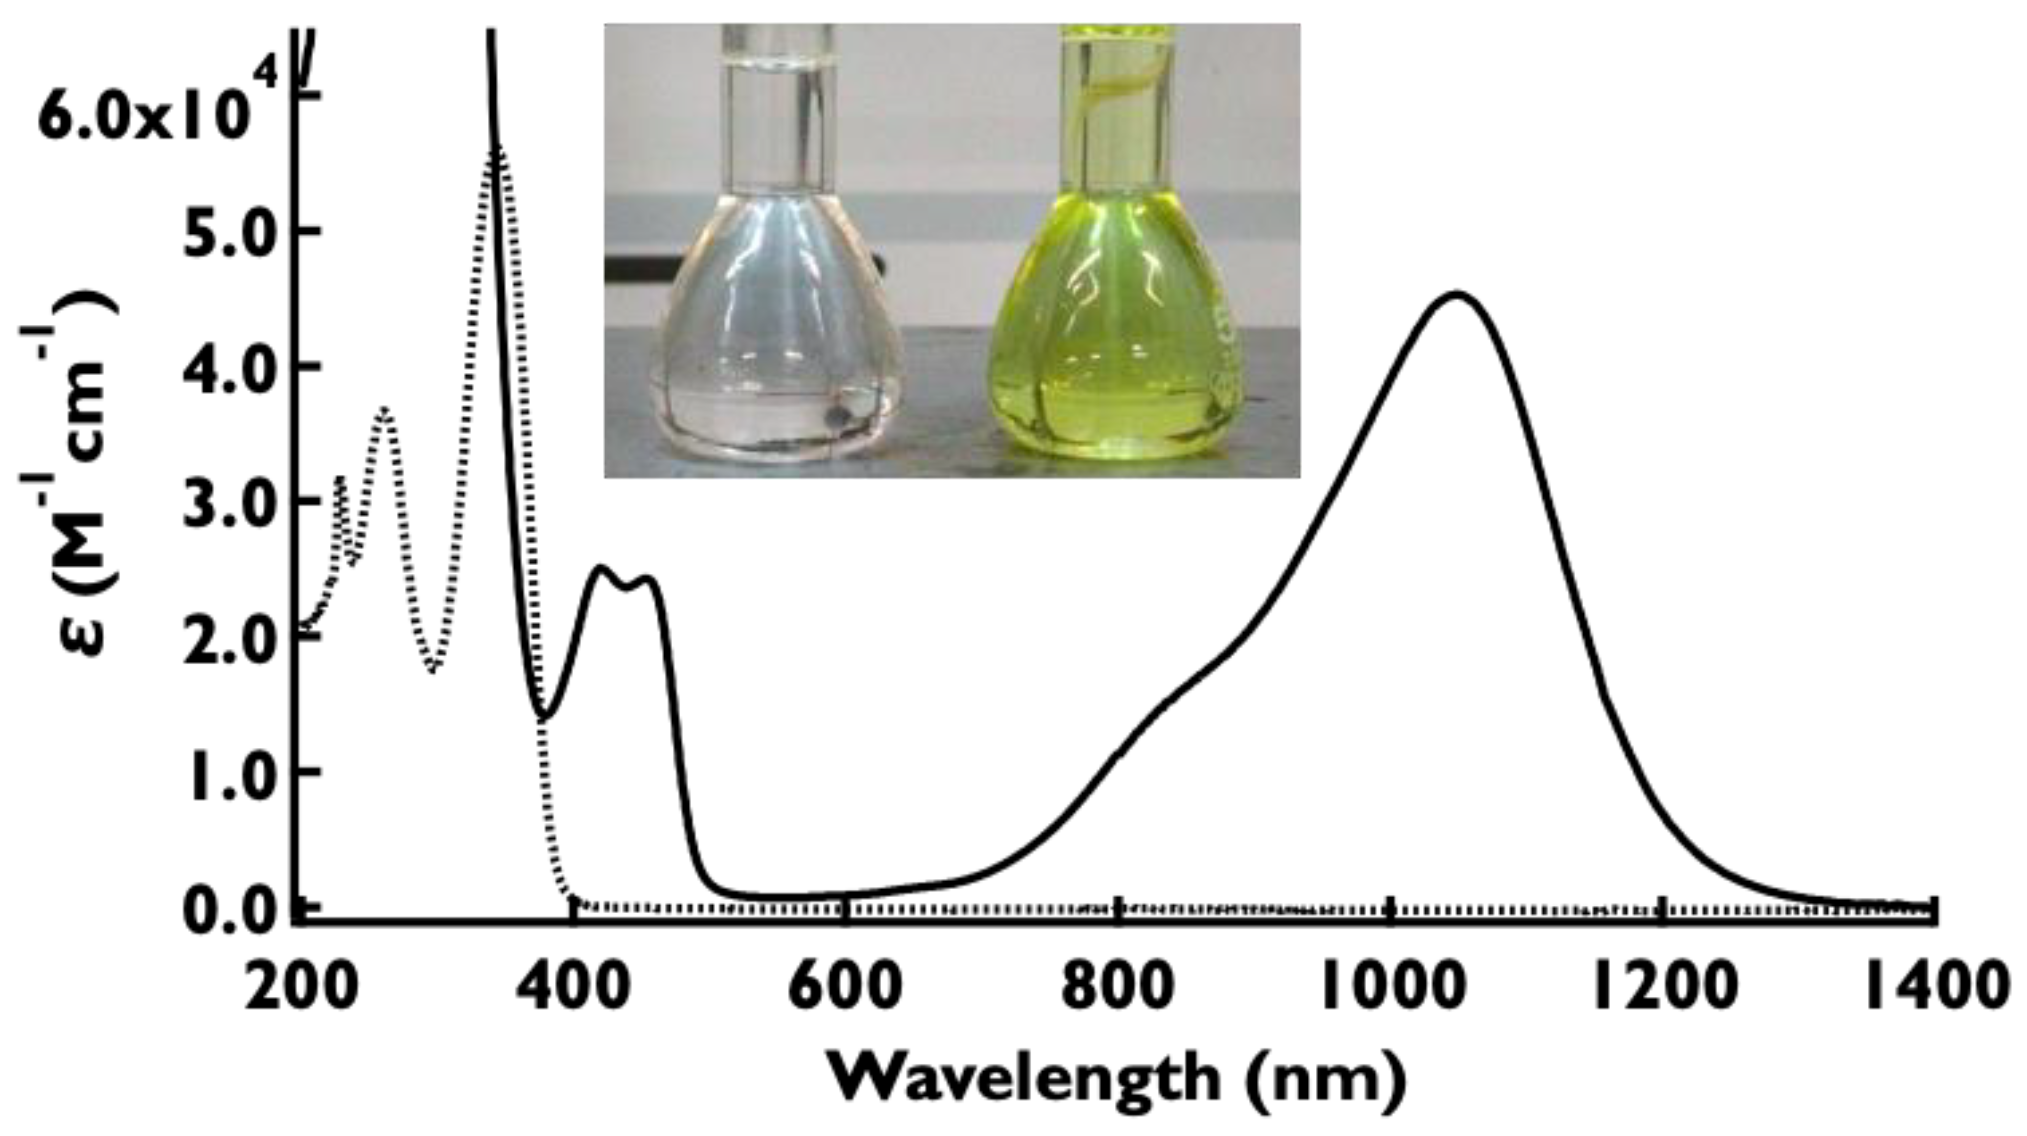
2.6. UV–Vis–NIR Absorption Spectra of the Oxidized Species, 1•+5•+

The UV–Vis–NIR spectrum of the oxidized species 2•+ was examined in dichloromethane (Figure 4). When 10 equivalents of SbCl5 were added to the solution of 2, the color of the solution changed to light yellowish green, indicating the formation of oxidized species 2•+. In agreement with the results of TD-DFT calculations, new absorptions appeared at 411 and 1053 nm (Figure S23). The maximum absorption peak in the near-infrared region of 2•+ was shifted to the longer wavelength side by 191 nm compared to that of 1•+. TD-DFT calculations suggest that this near-infrared absorption at 1053 nm is due to the HOMO to SOMO transition. The solution was left to stand for 15 min and the intensity of the peaks did not change at all (Figure S27).
Similar studies were conducted for compounds 35. When 10 equivalents of SbCl5 were added to the solution of 3, the color of the solution changed to yellow (Figure S17) and new absorptions appeared at 925 nm (Figure S20). Compound 4 with a fluoro group showed an absorption peak (λmax = 870 nm) at almost the same position as 1 (Figure S21). Radical cations 1•+ and 4•+ have almost no absorption in the visible light range. Therefore, they have potential applications as near-infrared-absorbing materials that are transparent to the naked eye. Compounds 5•+ with cyano groups showed maximum absorption at 820 nm (Figure S22). In contrast to the absorption spectra of neutral species 15, the peak positions in the near-infrared region in the absorption spectra of oxidized species 1•+5•+ differed significantly depending on the type of substituent (Figure 5). The results of the absorption spectra of 1•+5•+ are summarized in Table 3 (see also Supplementary Materials for details). The existence of radical cation species was also confirmed by ESR spectra (see Figures S35–S38). The ESR spectra of five compounds were detected at g = 2.003 for 1•+5•+, and indicate the localization of the unpaired electron at the nitrogen center.
According to general trends, the introduction of stronger electron-donating groups shifts the absorption peak in the near-infrared region towards longer wavelengths, while the introduction of stronger electron-withdrawing groups shifts the absorption peak toward shorter wavelengths. As described above, DFT calculations suggest that the electronic effects of substituents perturb the energy levels of both HOMO and SOMO of radical cations significantly. In particular, the HOMO energy level varies, greatly dependent on the type of substituent. As a result, the energy required for the HOMO–SOMO transition, which corresponds to absorption in the near-infrared region, is altered. To date, a number of near-infrared absorbing dyes have been reported by many research groups [3,4,5,6,7,8]. Most of these dyes were prepared based on molecular designs that attempt to provide greater absorption at longer wavelengths. However, in order to control the position of the absorption peak more precisely, it is also necessary to establish molecular design rules that shift the peak towards shorter wavelengths.

3. Conclusions

Five triphenyltriphenylamines with various substituents were investigated as precursors for near-infrared absorbing materials. CV measurements and chemical oxidation studies revealed that they gave stable radical cations in solution. These radical cations were found to have a large absorption in the near-infrared region between 820 and 1053 nm. The position of the absorption peak was greatly affected by the substituent, shifting to the longer wavelength side as stronger electron-donating groups were substituted. In particular, methoxy-substituted 2 has an absorption peak above 1000 nm and is classified as an NIR-II dye. The NIR-II dyes reported so far have complicated structures, and their synthesis has been complicated. These results show that by utilizing the electronic effects of substituents, NIR-II dyes, which have attracted attention from many fields, can be realized by a simple synthetic method. On the other hand, substitution of a stronger electron-withdrawing group, such as a cyano group, resulted in a shift to shorter wavelengths than the unsubstituted compound, and DFT calculations also supported this result, suggesting that the electronic effect of the substituent affects the extent of the HOMO–SOMO energy gap. Precise control of the absorption peak position is an important issue in the practical application of near-infrared absorbing dyes. The findings obtained in this study will provide an important molecular design rule for the development of near-infrared absorbing materials based on triarylamine radical cations.

Supplementary Materials

The following supporting information can be downloaded at https://www.mdpi.com/article/10.3390/colorants1030021/s1: Synthesis, DFT calculations, solubility test, cyclic voltammetry, absorption spectra of the neutral or oxidized species, fluorescence spectra of the neutral species, 1H and 13C spectra, and ESR spectra. Figure S1. HOMO, LUMO, and LUMO+1 orbitals of 13 with calculated energy levels; Figure S2. HOMO, LUMO, and LUMO+1 orbitals of 4 and 5 with calculated energy levels; Figure S3. Spin density plots of cation radical of 13 with their calculated energy levels; Figure S4. Spin density plots of cation radical of 4 and 5 with their calculated energy levels; Figure. S5. Cyclic voltammograms of 2 in dichloromethane (1 × 10⁻³ M) with Bu4NPF6 as a supporting electrolyte; Figure. S6. Cyclic voltammograms of 3 in dichloromethane (1 × 10⁻³ M) with Bu4NPF6 as a supporting electrolyte; Figure. S7. Cyclic voltammograms of 4 in dichloromethane (1 × 10⁻³ M) with Bu4NPF6 as a supporting electrolyte; Figure. S8. Cyclic voltammograms of 5 in dichloromethane (1 × 10⁻³ M) with Bu4NPF6 as a supporting electrolyte; Figure S9. Cyclic voltammogram of 2 in dichloromethane (1 × 10⁻³ M) after repeating sweep ten cycles in the range of 0.07 and 0.47 V (vs Fc/Fc+). The scan rate is 25 mV/s. Bu4NPF6 (1 × 10⁻¹ M) was employed as a supporting electrolyte; Figure S10. Cyclic voltammogram of 3 in dichloromethane (1 × 10⁻³ M) after repeating sweep ten cycles in the range of 0.07 and 0.57 V (vs Fc/Fc+). The scan rate is 25 mV/s. Bu4NPF6 (1 × 10⁻¹ M) was employed as a supporting electrolyte; Figure S11. Cyclic voltammogram of 4 in dichloromethane (1 × 10⁻³ M) after repeating sweep ten cycles in the range of 0.17 and 0.67 V (vs Fc/Fc+). The scan rate is 25 mV/s. Bu4NPF6 (1 × 10⁻¹ M) was employed as a supporting electrolyte; Figure S12. Cyclic voltammogram of 5 in dichloromethane (1 × 10⁻³ M) after repeating sweep ten cycles in the range of 0.37 and 0.82 V (vs Fc/Fc+). The scan rate is 25 mV/s. Bu4NPF6 (1 × 10⁻¹ M) was employed as a supporting electrolyte; Figure S13. UV-vis (solid line) and fluorescence emission (dotted line) spectra of 2 in dichloromethane. The concentration is 1 × 10⁻⁵ M for UV-vis and 1 × 10⁻⁶ M for fluorescence spectrum; Figure S14. UV-vis (solid line) and fluorescence emission (dotted line) spectra of 3 in dichloromethane. The concentration is 1 × 10⁻⁵ M for UV-vis and 1 × 10⁻⁶ M for fluorescence spectrum; Figure S14. UV-vis (solid line) and fluorescence emission (dotted line) spectra of 3 in dichloromethane. The concentration is 1 × 10⁻⁵ M for UV-vis and 1 × 10⁻⁶ M for fluorescence spectrum; Figure S15. UV-vis (solid line) and fluorescence emission (dotted line) spectra of 4 in dichloromethane. The concentration is 1 × 10⁻⁵ M for UV-vis and 1 × 10⁻⁶ M for fluorescence spectrum; Figure S16. UV-vis (solid line) and fluorescence emission (dotted line) spectra of 5 in dichloromethane. The concentration is 1 × 10⁻⁵ M for UV-vis and 1 × 10⁻⁶ M for fluorescence spectrum; Figure S17. Dichloromethane solution of 3 in the absence (left) and presence of ten equivalents of SbCl5 (right). [3] = 1 × 10⁻⁵ M; Figure S18. Dichloromethane solution of 4 in the absence (left) and presence of ten equivalents of SbCl5 (right). [4] = 1 × 10⁻⁵ M; Figure S19. Dichloromethane solution of 5 in the absence (left) and presence of ten equivalents of SbCl5 (right). [5] = 1 × 10⁻⁵ M; Figure S20. Absorption spectra of 3 before (dotted line) and after oxidation with 10 equivalents of SbCl5 (solid line) in dichloromethane at room temperature. [3] = 1 × 10⁻⁵ M; Figure S21. Absorption spectra of 4 before (dotted line) and after oxidation with 10 equivalents of SbCl5 (solid line) in dichloromethane at room temperature. [4] = 1 × 10⁻⁵ M; Figure S22. Absorption spectra of 5 before (dotted line) and after oxidation with 10 equivalents of SbCl5 (solid line) in dichloromethane at room temperature. [5] = 1 × 10⁻⁵ M; Figure S23. Experimental UV-vis absorption spectra of 2 after oxidation with ten equivalents of SbCl5 and TD-DFT calculated energy transition with oscillator strength shown as a vertical red line; Figure S24. Experimental UV-vis absorption spectra of 3 after oxidation with ten equivalents of SbCl5 and TD-DFT calculated energy transition with oscillator strength shown as a vertical red line; Figure S25. Experimental UV-vis absorption spectra of 4 after oxidation with ten equivalents of SbCl5 and TD-DFT calculated energy transition with oscillator strength shown as a vertical red line; Figure S26. Experimental UV-vis absorption spectra of 5 after oxidation with ten equivalents of SbCl5 and TD-DFT calculated energy transition with oscillator strength shown as a vertical red line; Figure S27. Time course of UV-vis absorption spectra of 2 with ten equivalents of SbCl5 in dichloromethane at room temperature recorded every 5 min. The initial concentration of 3 is 1 × 10⁻⁵ M. Inset: time-course of the peak intensity at 1053 nm; Figure S28. Time course of UV-vis absorption spectra of 3 with ten equivalents of SbCl5 in dichloromethane at room temperature recorded every 5 min. The initial concentration of 3 is 1 × 10⁻⁵ M. Inset: time-course of the peak intensity at 925 nm; Figure S29. Time course of UV-vis absorption spectra of 4 with ten equivalents of SbCl5 in dichloromethane at room temperature recorded every 5 min. The initial concentration of 4 is 1 × 10⁻⁵ M. Inset: time-course of the peak intensity at 870 nm; Figure S30. Time course of UV-vis absorption spectra of 5 with ten equivalents of SbCl5 in dichloromethane at room temperature recorded every 5 min. The initial concentration of 5 is 1 × 10⁻⁵ M. Inset: time-course of the peak intensity at 820 nm; Figure S31. 1H and 13C spectra of 2; Figure S32. 1H and 13C spectra of 3; Figure S33. 1H and 13C spectra of 4; Figure S34. 1H and 13C spectra of 5; Figure S35. ESR spectrum of 2+ in CH2Cl2; Figure S36. ESR spectrum of 3+ in CH2Cl2; Figure S37. ESR spectrum of 4•+ in CH2Cl2; Figure S38. ESR spectrum of 5•+ in CH2Cl2; Table S1. Solubility test of compounds 15 in dichloromethane, anisole and toluene at room temperature [24,25,26,27,28,29].

Author Contributions

Idea and writing: M.Y.; organic synthesis and physical properties measurement: M.S.; organic synthesis and physical properties measurement: K.T.; UV spectroscopy and fluorescence measurement: M.N.; idea and ESR measurement: T.Y.; idea and DFT calculation: K.M.; idea, writing, and IR measurement: Y.K. All authors have read and agreed to the published version of the manuscript.

Funding

This research received no external funding.

Acknowledgments

The authors would like to thank Hitoshi Ishida, Kansai University, for the measurements of UV–Vis–NIR and spectra and Toshiyuki Iwai, Osaka Research Institute of Industrial Science and Technology, for the measurements of HRMS.

Conflicts of Interest

The authors declare no conflict of interest.

References

  1. Lee, S.-H.; Cheong, H.M.; Zhang, J.-G.; Mascarenhas, A.; Benson, D.K.; Deb, S.K. Electrochromic mechanism in a-WO3−y thin films. Appl. Phys. Lett. 1999, 74, 242–244. [Google Scholar] [CrossRef]
  2. Deb, S.K. Optical and photoelectric properties and colour centres in thin films of tungsten oxide. Philos. Mag. 1973, 27, 801–822. [Google Scholar] [CrossRef]
  3. Fabian, J.; Nakazumi, H.; Matsuoka, M. Near-infrared absorbing dyes. Chem. Rev. 1992, 92, 1197–1226. [Google Scholar] [CrossRef]
  4. Rao, R.S.; Suman; Singh, S.P. Near-Infrared (>1000 nm) Light-Harvesters: Design, Synthesis and Applications. Chem.—Eur. J. 2020, 26, 16582–16593. [Google Scholar] [CrossRef]
  5. Li, L.; Dong, X.; Li, J.; Wei, J. A short review on NIR-II organic small molecule dyes. Dye. Pigment. 2020, 183, 108756. [Google Scholar] [CrossRef]
  6. Li, B.; Zhao, M.; Zhang, F. Rational Design of Near-Infrared-II Organic Molecular Dyes for Bioimaging and Biosensing. ACS Mater. Lett. 2020, 2, 905–917. [Google Scholar] [CrossRef]
  7. Qi, J.; Qiao, W.; Wang, Z.Y. Advances in Organic Near-Infrared Materials and Emerging Applications. Chem. Rec. 2016, 16, 1531–1548. [Google Scholar] [CrossRef]
  8. Sun, Z.; Wu, J. Higher order acenes and fused acenes with near-infrared absorption and emission. Aust. J. Chem. 2011, 64, 519–528. [Google Scholar] [CrossRef]
  9. Wang, Z. Near-Infrared Organic Materials and Emerging Applications, 1st ed.; CRC Press: Boca Raton, FL, USA, 2013. [Google Scholar]
  10. Seo, E.T.; Nelson, R.F.; Fritsch, J.M.; Marcoux, L.S.; Leedy, D.W.; Adams, R.N. Anodic Oxidation Pathways of Aromatic Amines. Electrochemical and Electron Paramagnetic Resonance Studies. J. Am. Chem. Soc. 1966, 88, 3498–3503. [Google Scholar] [CrossRef]
  11. Nelson, R.R.; Adams, R.N. Anodic oxidation pathways of substituted triphenylamines. II. Quantitative studies of benzidine formation. J. Am. Chem. Soc. 1968, 90, 3925–3930. [Google Scholar] [CrossRef]
  12. Nelson, R.F.; Philp, R.H. Electrochemical and spectroscopic studies of cation radicals. 4. Stopped-flow determination of triarylaminium radical coupling rate constants. J. Phys. Chem. 1979, 83, 713–716. [Google Scholar] [CrossRef]
  13. Yano, M.; Tamada, K.; Nakai, M.; Mitsudo, K.; Kashiwagi, Y. Near-Infrared Absorbing Molecule Based on Triphenylamine Radical Cation with Extended Homoaryl π-System. Colorants 2022, 1, 226–235. [Google Scholar] [CrossRef]
  14. Yano, M.; Inada, Y.; Hayashi, Y.; Yajima, T.; Mitsudo, K.; Kashiwagi, Y. Photo- and Redox-active Benzofuran-appended Triphenylamine and Near-infrared Absorption of Its Radical Cation. Chem. Lett. 2020, 49, 685–688. [Google Scholar] [CrossRef]
  15. Yano, M.; Inada, Y.; Hayashi, Y.; Nakai, M.; Mitsudo, K.; Kashiwagi, Y. Near-infrared absorption of a benzothiophene-appended triphenylamine radical cation: A novel molecular design of NIR-II dye. Dye. Pigment. 2022, 197, 109929. [Google Scholar] [CrossRef]
  16. Chen, C.; Zheng, Q.; Ni, S.; Wang, H. Facile one-pot nanocatalysts encapsulation of palladium-NHC complexes for aqueous Suzuki-Miyaura couplings. New J. Chem. 2018, 42, 4624–4630. [Google Scholar] [CrossRef]
  17. Rao, M.L.N.; Banerjee, D.; Dhanorkar, R.J. Pd-catalyzed coupling of aryl iodides with triarylbismuths as atom-economic multi-coupling organometallic nucleophiles under mild conditions. Tetrahedron Lett. 2010, 51, 6101–6104. [Google Scholar] [CrossRef]
  18. Hu, B.; Chen, X.; Wang, Y.; Lu, P.; Wang, Y. Structure-Property Investigations of Substituted Triarylamines and Their Applications as Fluorescent pH Sensors. Chem.—Asian J. 2013, 8, 1144–1151. [Google Scholar] [CrossRef]
  19. Han, Y.; Zhang, T.; Chen, X.; Chen, Q.; Xue, P. Spacer group-controlled luminescence and response of C 3-symmetric triphenylamine derivatives towards force stimuli. CrystEngComm 2021, 23, 202–209. [Google Scholar] [CrossRef]
  20. Kwon, J.; Kim, M.K.; Hong, J.-P.; Lee, W.; Noh, S.; Lee, C.; Lee, S.; Hong, J.-I. 4,4′,4″-Tris(4-naphthalen-1-yl-phenyl)amine as a multifunctional material for organic light-emitting diodes, organic solar cells, and organic thin-film transistors. Org. Electron. 2010, 11, 1288–1295. [Google Scholar] [CrossRef]
  21. Kwon, J.; Kim, M.K.; Hong, J.-P.; Lee, W.; Lee, S.; Hong, J.-I. A Multifunctional Material Based on Triphenylamine and a Naphthyl Unit for Organic Light-Emitting Diodes, Organic Solar Cells, and Organic Thin-Film Transistors. Bull. Korean Chem. Soc. 2013, 34, 1355–1360. [Google Scholar] [CrossRef] [Green Version]
  22. Rim, Y.S.; Bae, S.; Chen, H.; De Marco, N.; Yang, Y. Recent Progress in Materials and Devices toward Printable and Flexible Sensors. Adv. Mater. 2016, 28, 4415–4440. [Google Scholar] [CrossRef] [PubMed]
  23. Okamoto, T.; Mitsui, C.; Yamagishi, M.; Nakahara, K.; Soeda, J.; Hirose, Y.; Miwa, K.; Sato, H.; Yamano, A.; Matsushita, T.; et al. V-shaped organic semiconductors with solution processability, high mobility, and high thermal durability. Adv. Mater. 2013, 25, 6392–6397. [Google Scholar] [CrossRef] [PubMed]
  24. Frisch, M.J.; Trucks, G.W.; Schlegel, H.B.; Scuseria, G.E.; Robb, M.A.; Cheeseman, J.R.; Scalmani, G.; Barone, V.; Mennucci, B.; Petersson, G.A.; et al. Gaussian 09, Revision E.01; Gaussian, Inc.: Wallingford, CT, USA, 2009. [Google Scholar]
  25. Becke, A.D. Density-functional thermochemistry. III. The role of exact exchange. J. Chem. Phys. 1993, 98, 5648–5652. [Google Scholar] [CrossRef] [Green Version]
  26. Lee, C.; Yang, W.; Parr, R.G. Development of the Colle-Salvetti correlation-energy formula into a functional of the electron density. Phys. Rev. B 1988, 37, 785–789. [Google Scholar] [CrossRef] [Green Version]
  27. Becke, A.D. A new mixing of Hartree–Fock and local density-functional theories. J. Chem. Phys. 1993, 98, 1372–1380. [Google Scholar] [CrossRef]
  28. Stephens, P.J.; Devlin, F.J.; Chabalowski, C.F.; Frisch, M.J. Ab Initio Calculation of Vibrational Absorption and Circular Dichroism Spectra Using Density Functional Force Fields. J. Phys. Chem. 1994, 98, 11623–11627. [Google Scholar] [CrossRef]
  29. Tomasi, J.; Mennucci, B.; Cammi, R. Quantum Mechanical Continuum Solvation Models. Chem. Rev. 2005, 105, 2999–3093. [Google Scholar] [CrossRef]
Figure 1. Triphenylamines examined in previous work and in this study.
Colorants 01 00021 g001
Figure 2. Molecular orbital energy levels of 1•+5•+.
Colorants 01 00021 g002
Scheme 1. Synthesis of 25.
Colorants 01 00021 sch001
Figure 3. UV–Vis (solid line) and fluorescence emission (dotted line) of 15 in dichloromethane. The concentration is 1 × 10⁻⁵ M for UV–Vis and 1 × 10⁻⁶ M for fluorescence emission spectra. The vertical axis is normalized for clarity.
Colorants 01 00021 g003
Figure 4. Absorption spectra of 2 before (dotted line) and after oxidation with 10 equivalents of SbCl5 (solid line) in dichloromethane at room temperature. [2] = 1 × 10⁻⁵ M. Inset: Dichloromethane solution of 2 in the absence (left) and presence of ten equivalents of SbCl5 (right). [2] = 1 × 10⁻⁵ M.
Colorants 01 00021 g004
Figure 5. UV–Vis absorption spectra of 1•+5•+ in dichloromethane. The concentration of each sample is 1 × 10⁻⁵ M. The vertical axis is normalized for clarity.
Colorants 01 00021 g005
Table 1. Electrochemical data for 15 with calculated EHOMO.
CompoundE0 (V vs. Fc/Fc+)EHOMO (eV)
10.42−4.97
20.33−4.81
30.37−4.91
40.46−5.00
50.60−5.25
Table 2. The absorption and fluorescence spectra of 15.
CompoundAbsorption SpectraFluorescence Spectra
Obsd.Calcd.Obsd.
λmax (nm)log ελmax (nm)λmax (nm)
13444.78363416
23434.75362412
33454.83364411
43414.64361410
53754.86416459
Table 3. Spectroscopic properties and DFT calculation results for 1•+5•+.
Absorption SpectraEnergy Levels Calculated by DFT
Obsd.Calcd.HOMO (eV)SOMO (eV)ΔE (eV)
λmax (nm)log ελmax (nm)
1•+8624.34856−6.75−4.841.91
2•+10534.651109−6.10−4.641.46
3•+9254.78931−6.52−4.761.76
4•+8704.56891−6.68−4.861.82
5•+8204.49815−7.13−5.132.00
Publisher’s Note: MDPI stays neutral with regard to jurisdictional claims in published maps and institutional affiliations.

