
Effect of the Fibre Orientation Distribution on the Mechanical and Preforming Behaviour of Nonwoven Preform Made of Recycled Carbon Fibres


Abstract
:1. Introduction
2. Materials
3. Methods
3.1. Fibre Scale
3.2. Preform Scale
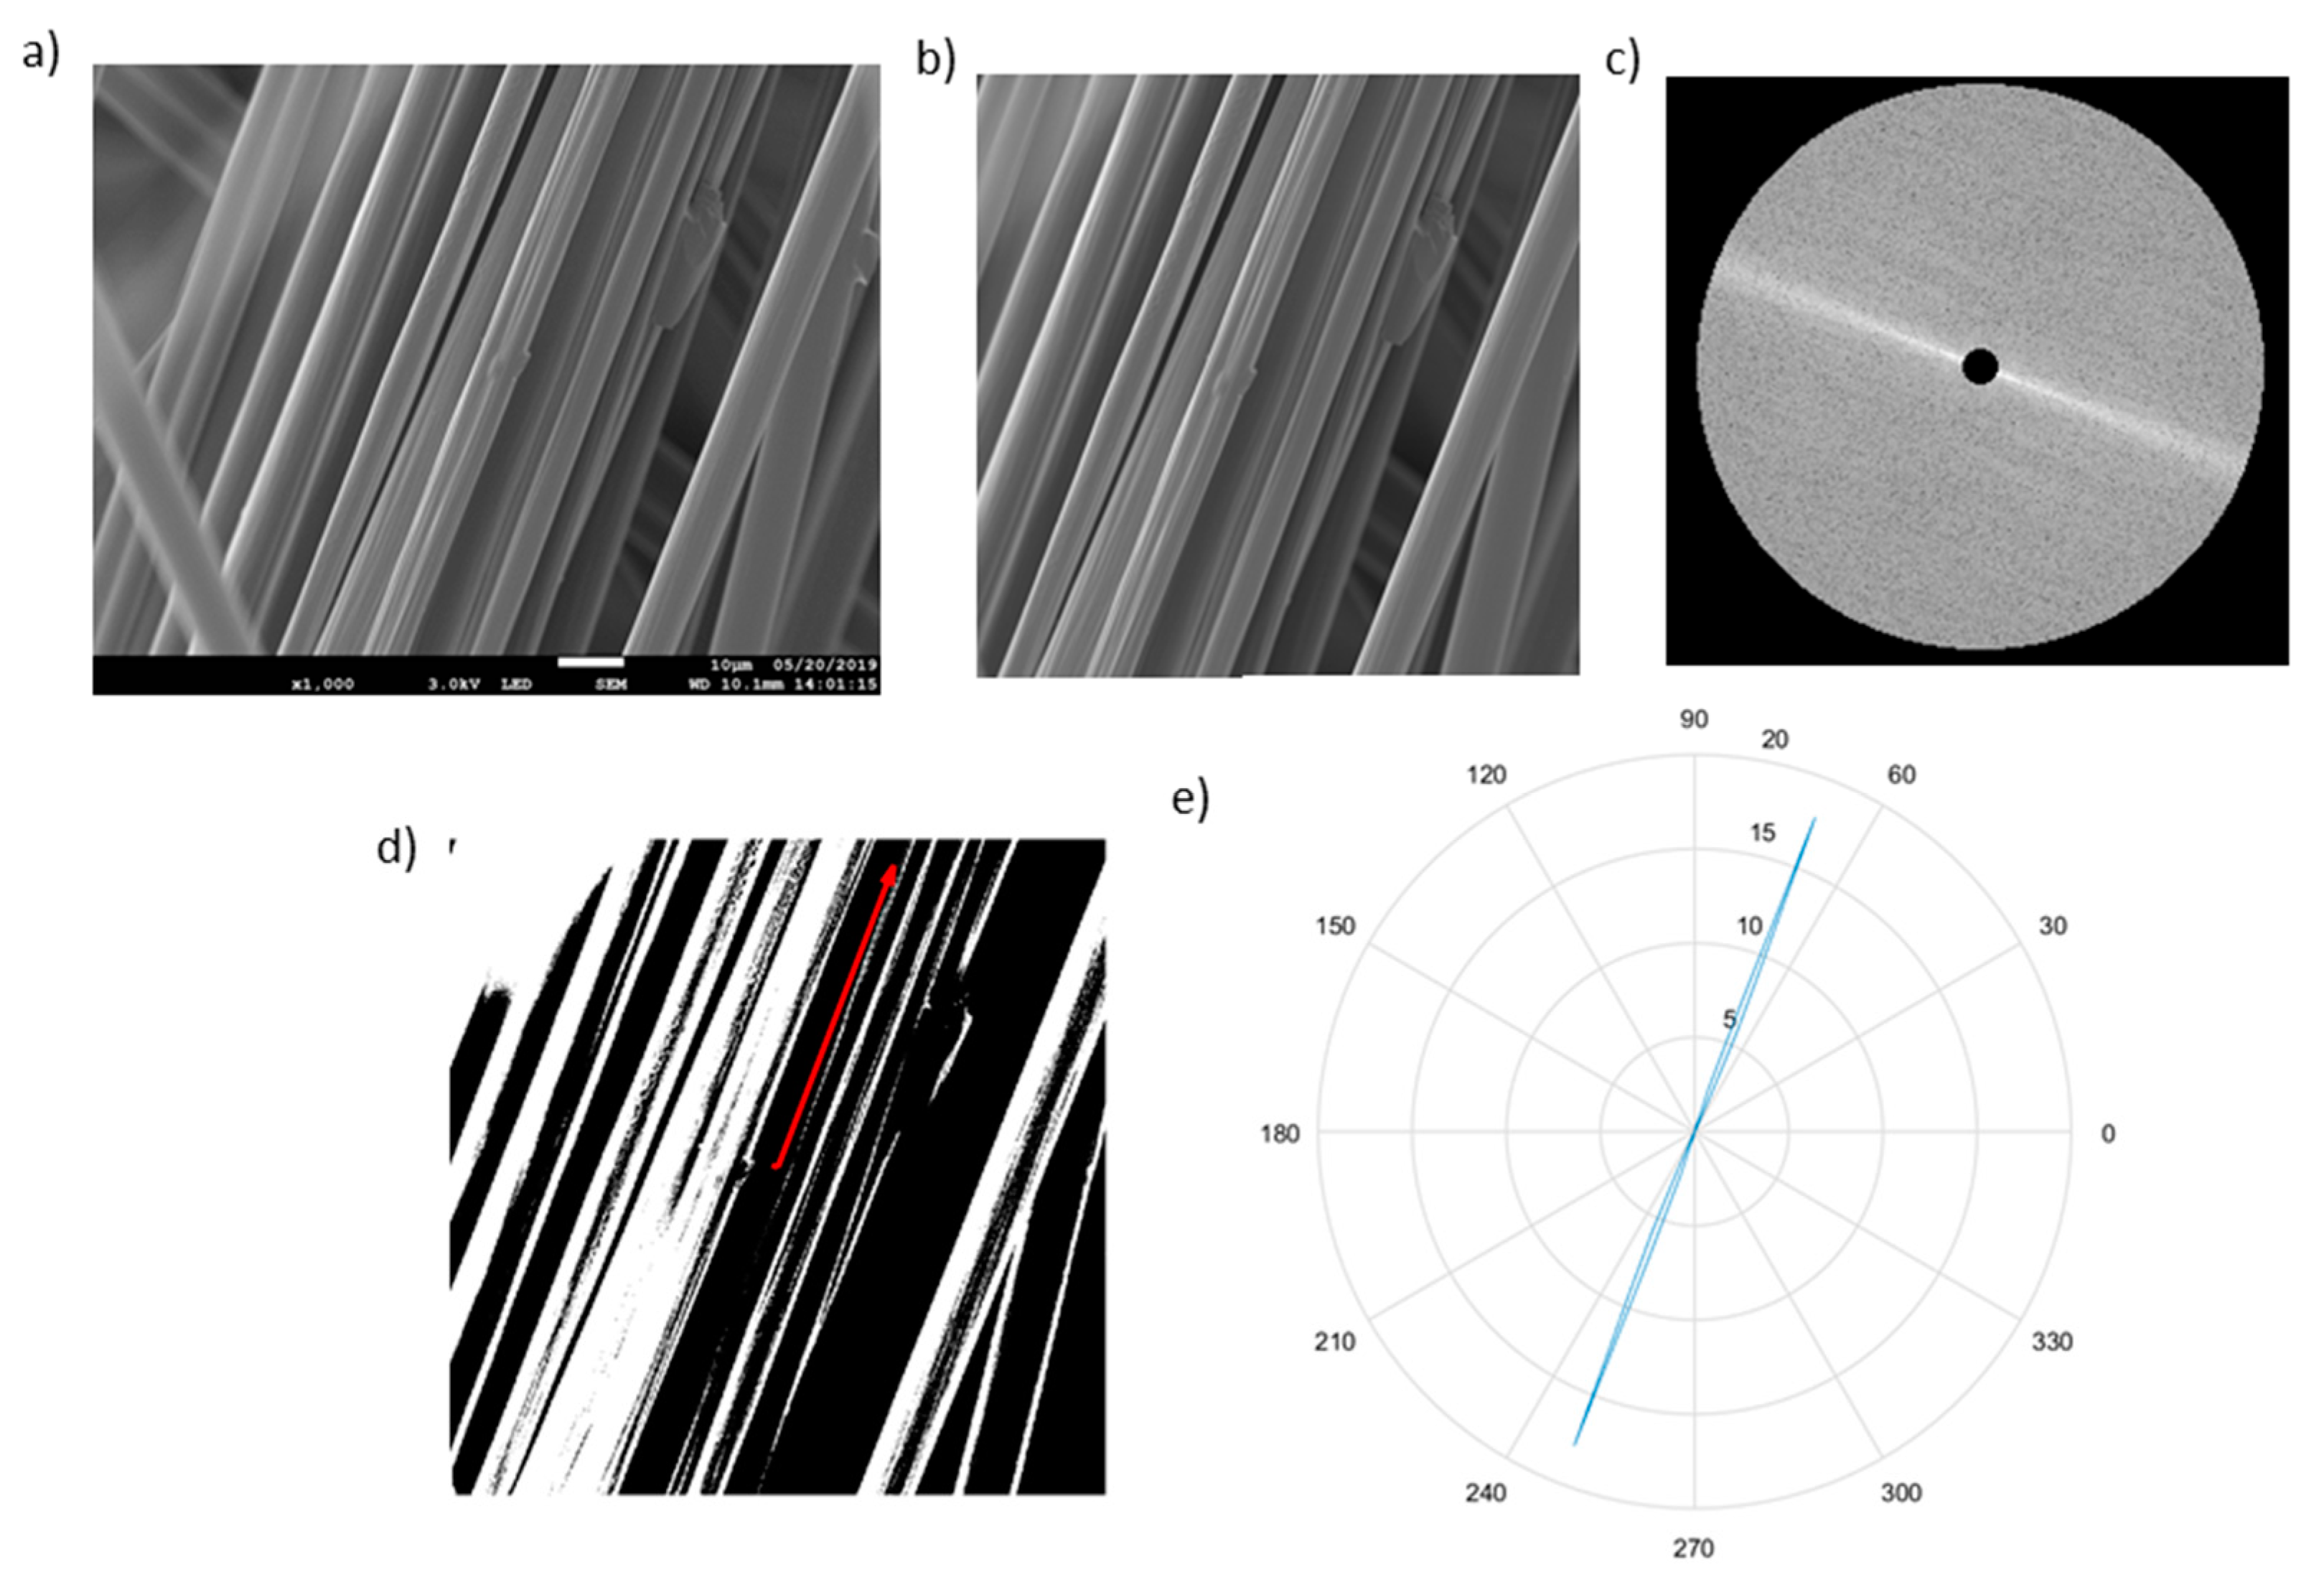
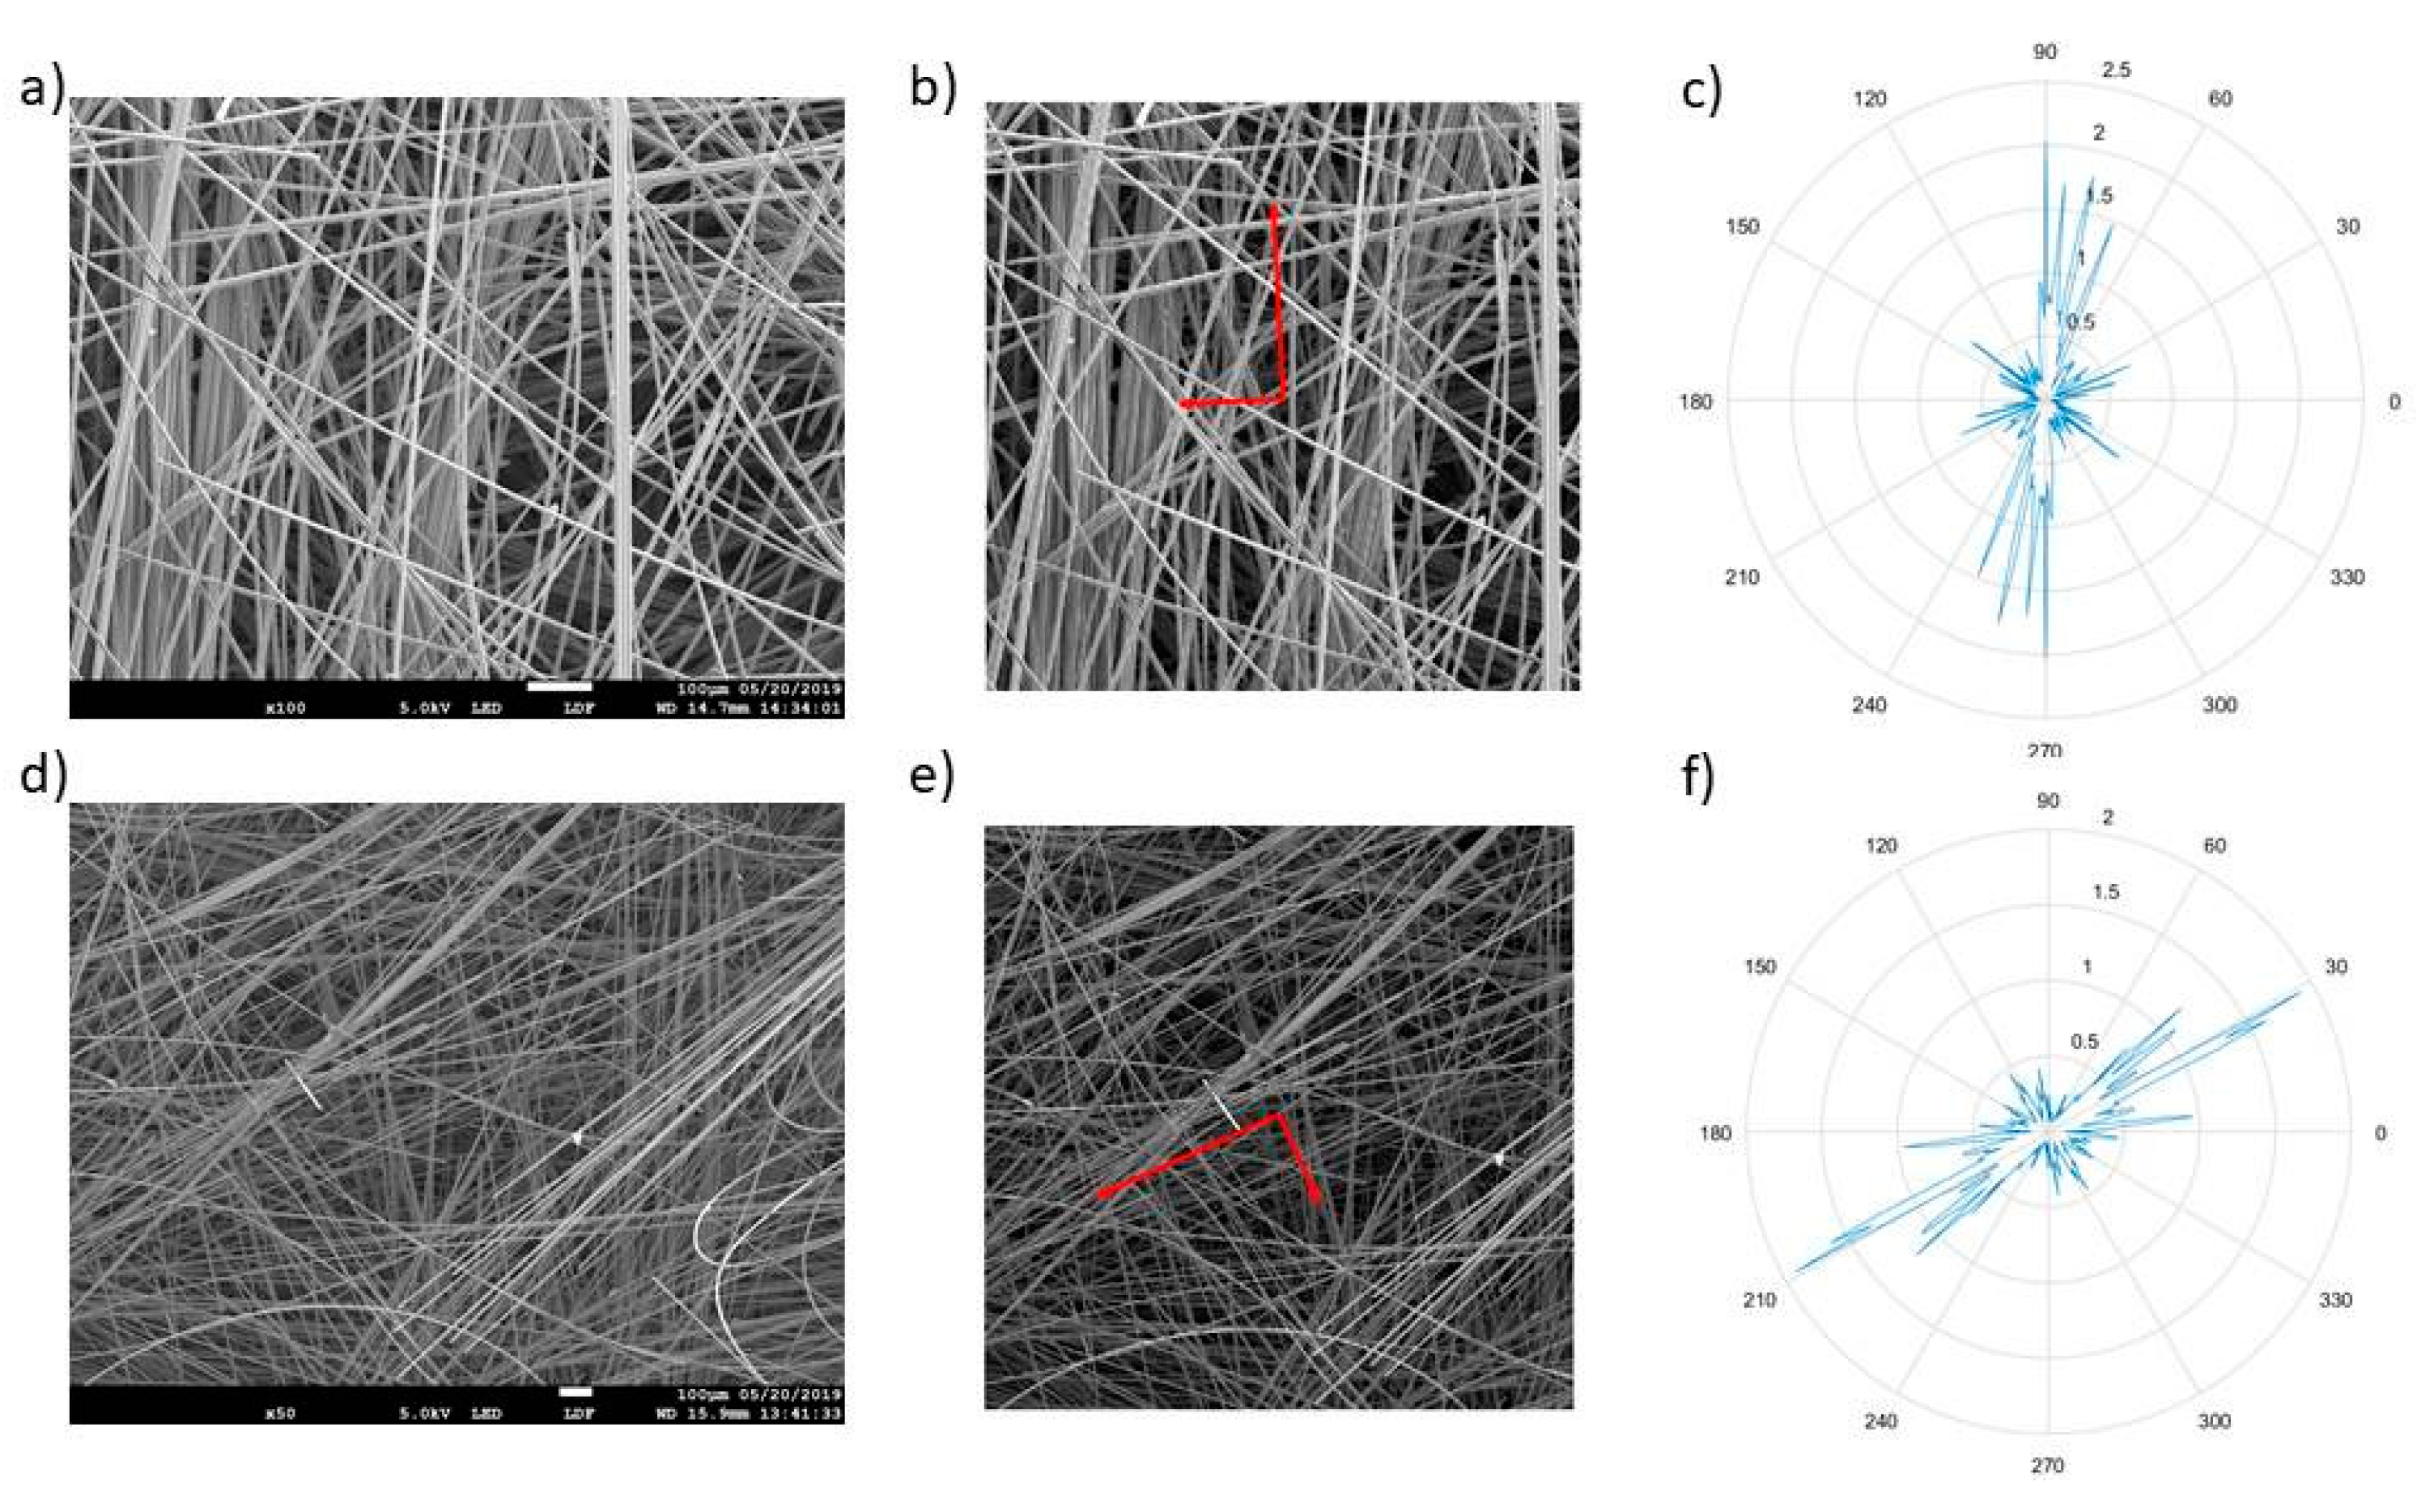
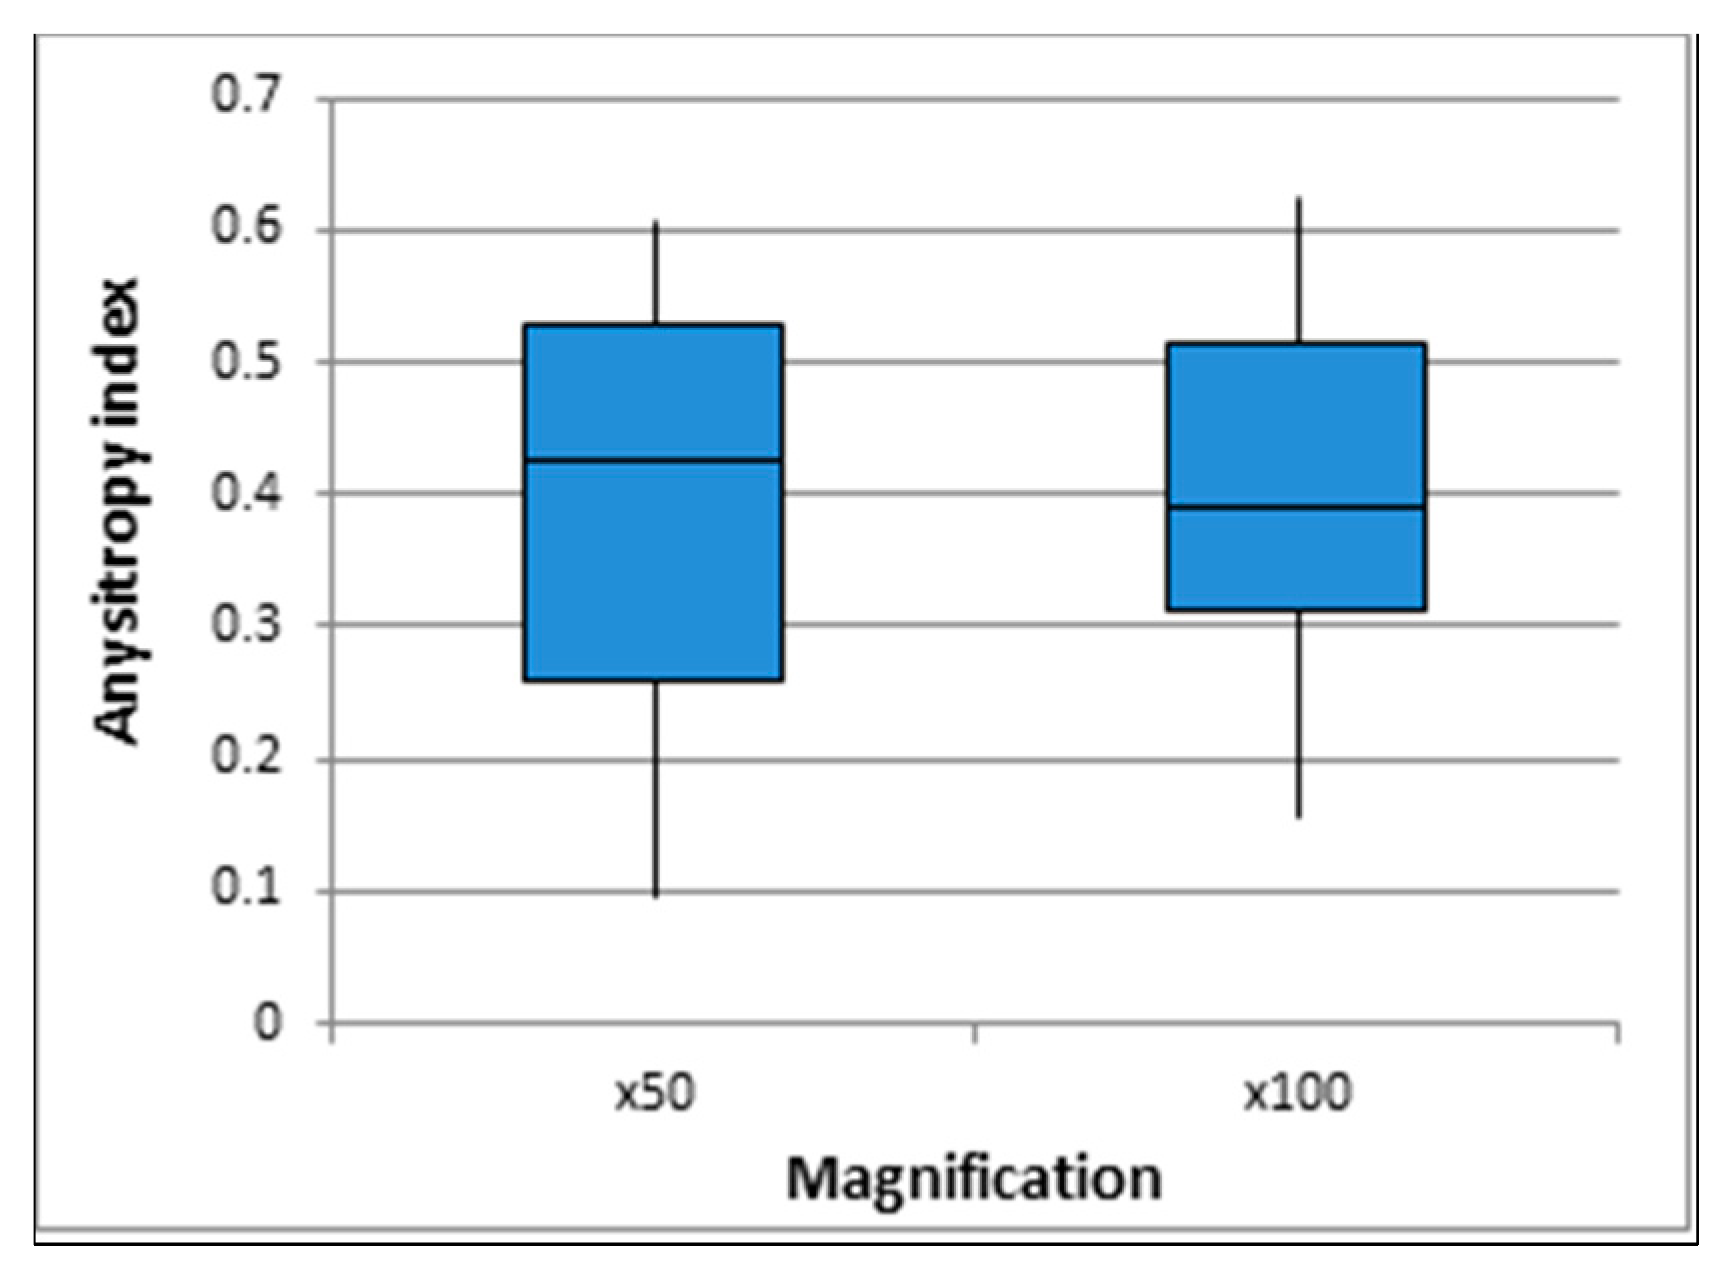
3.2.1. Fibre Orientation
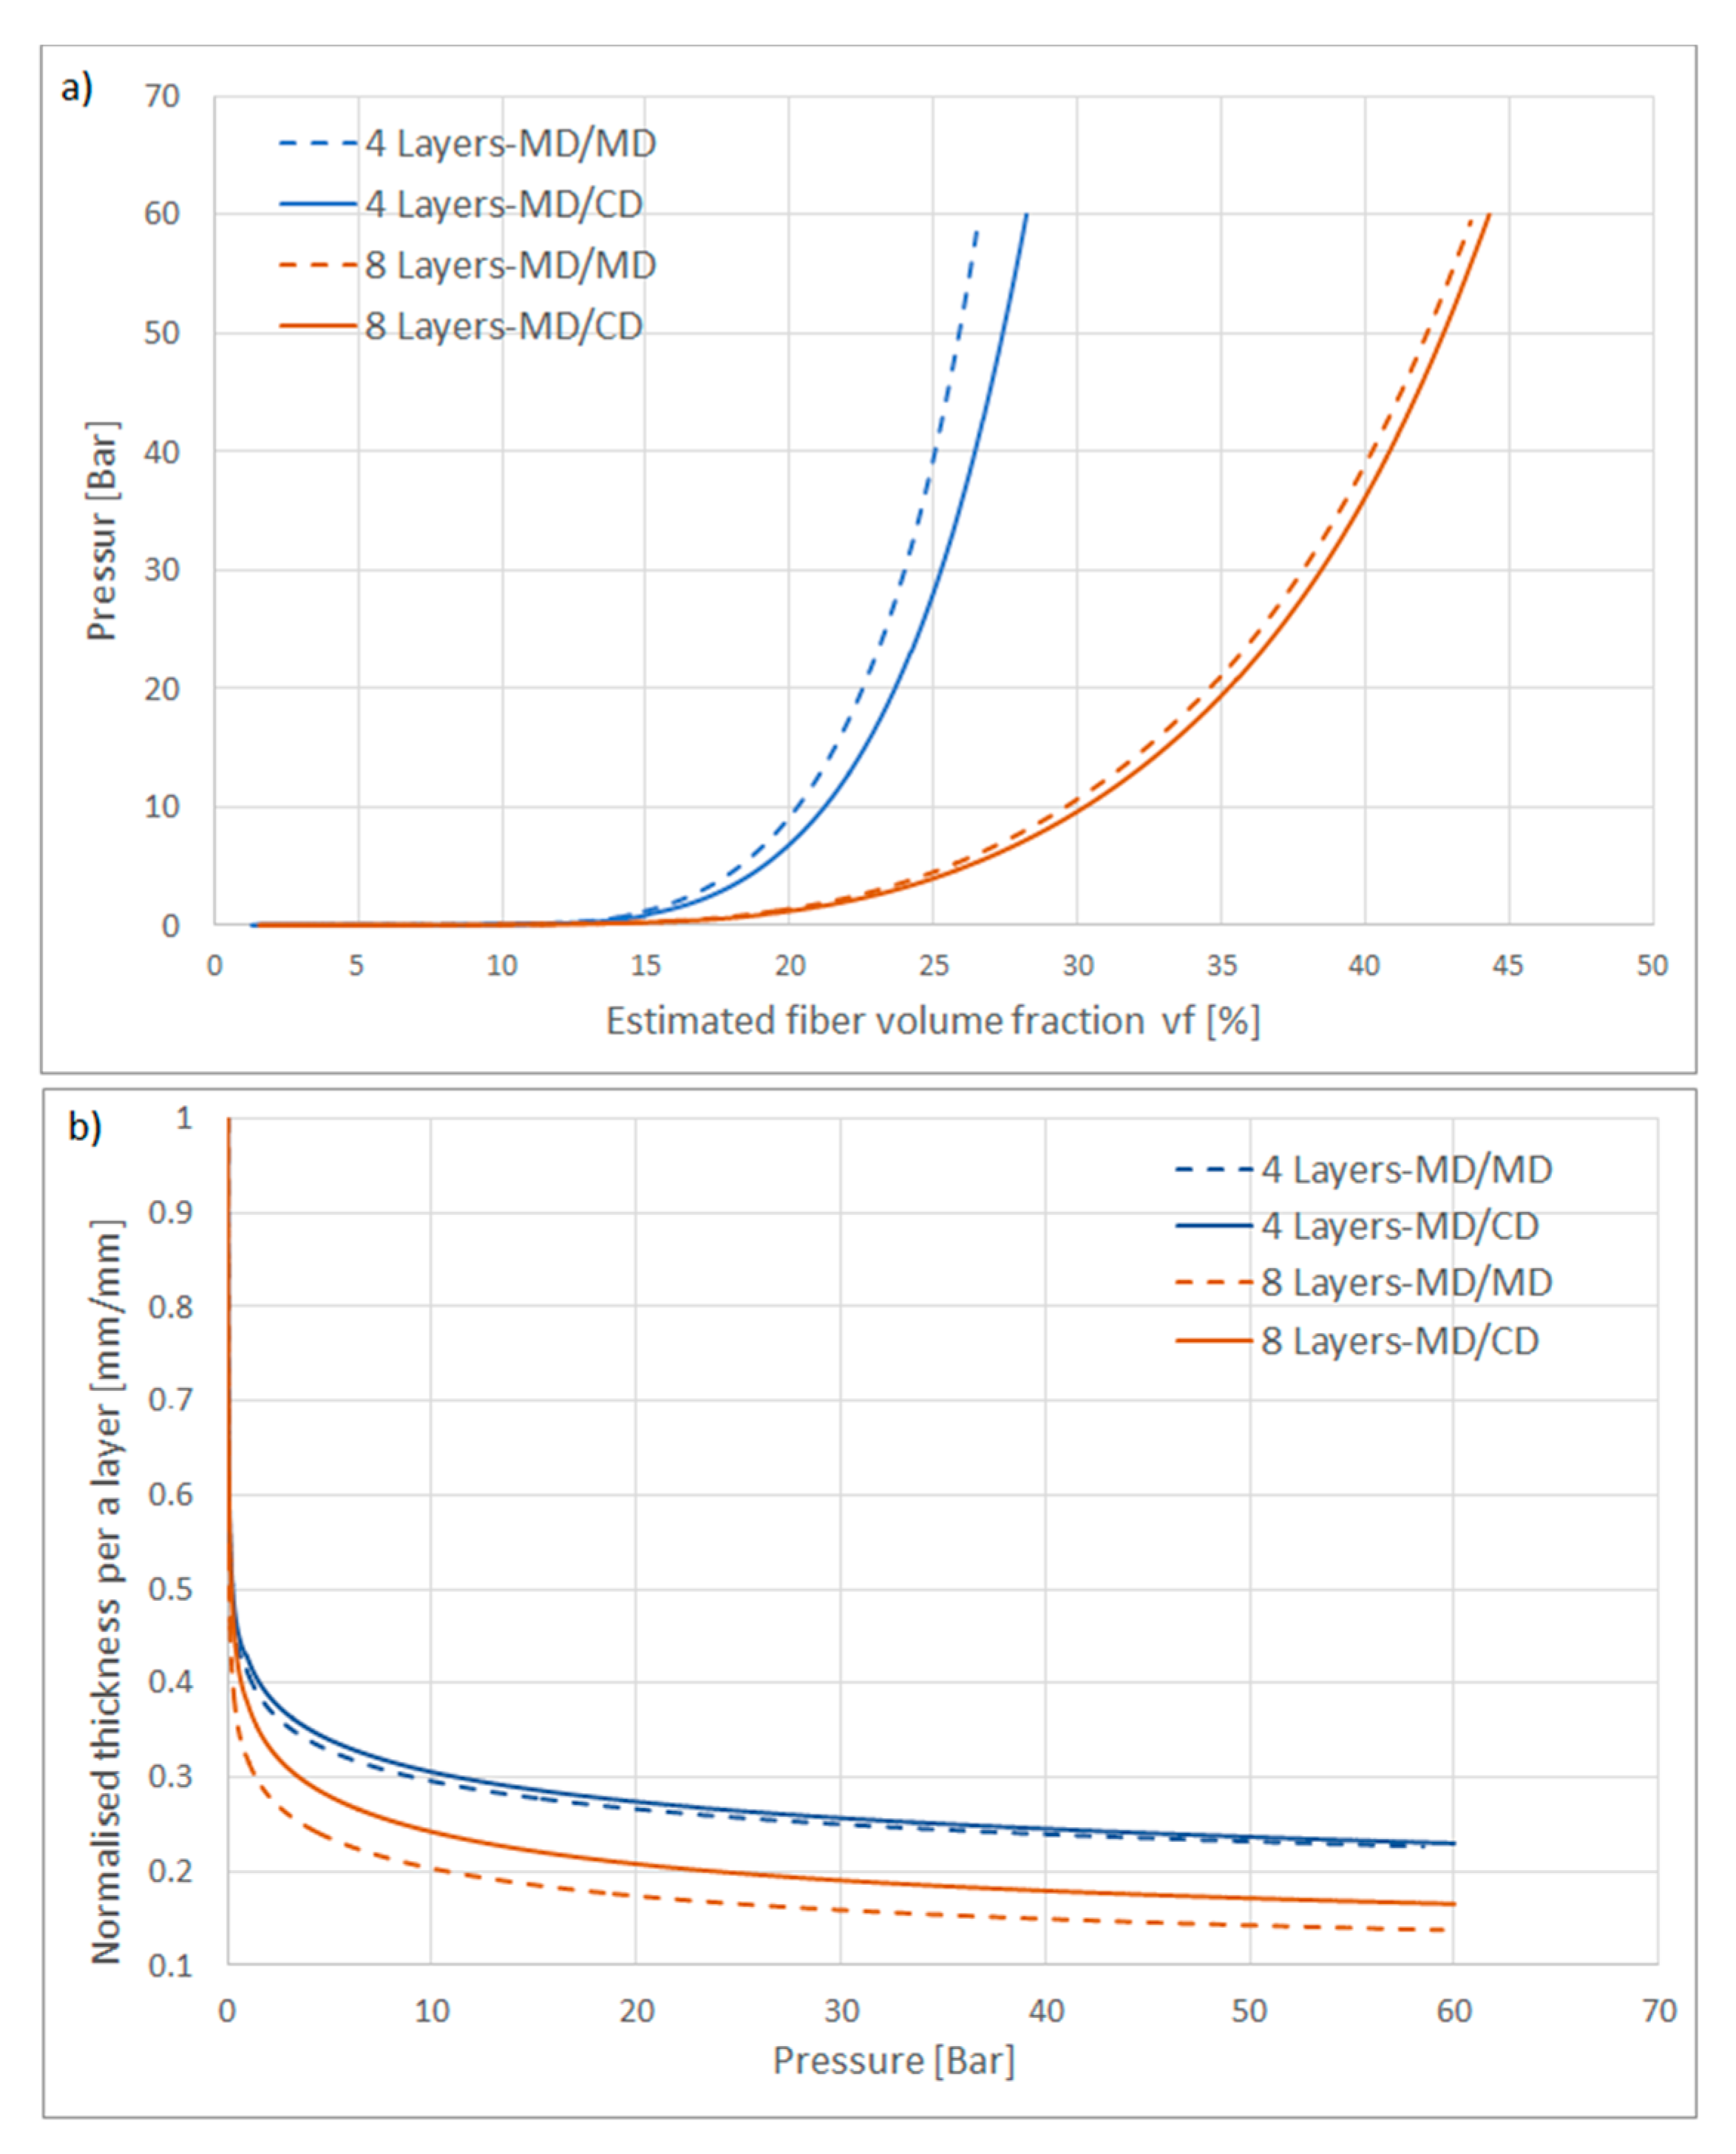
3.2.2. Compaction Test
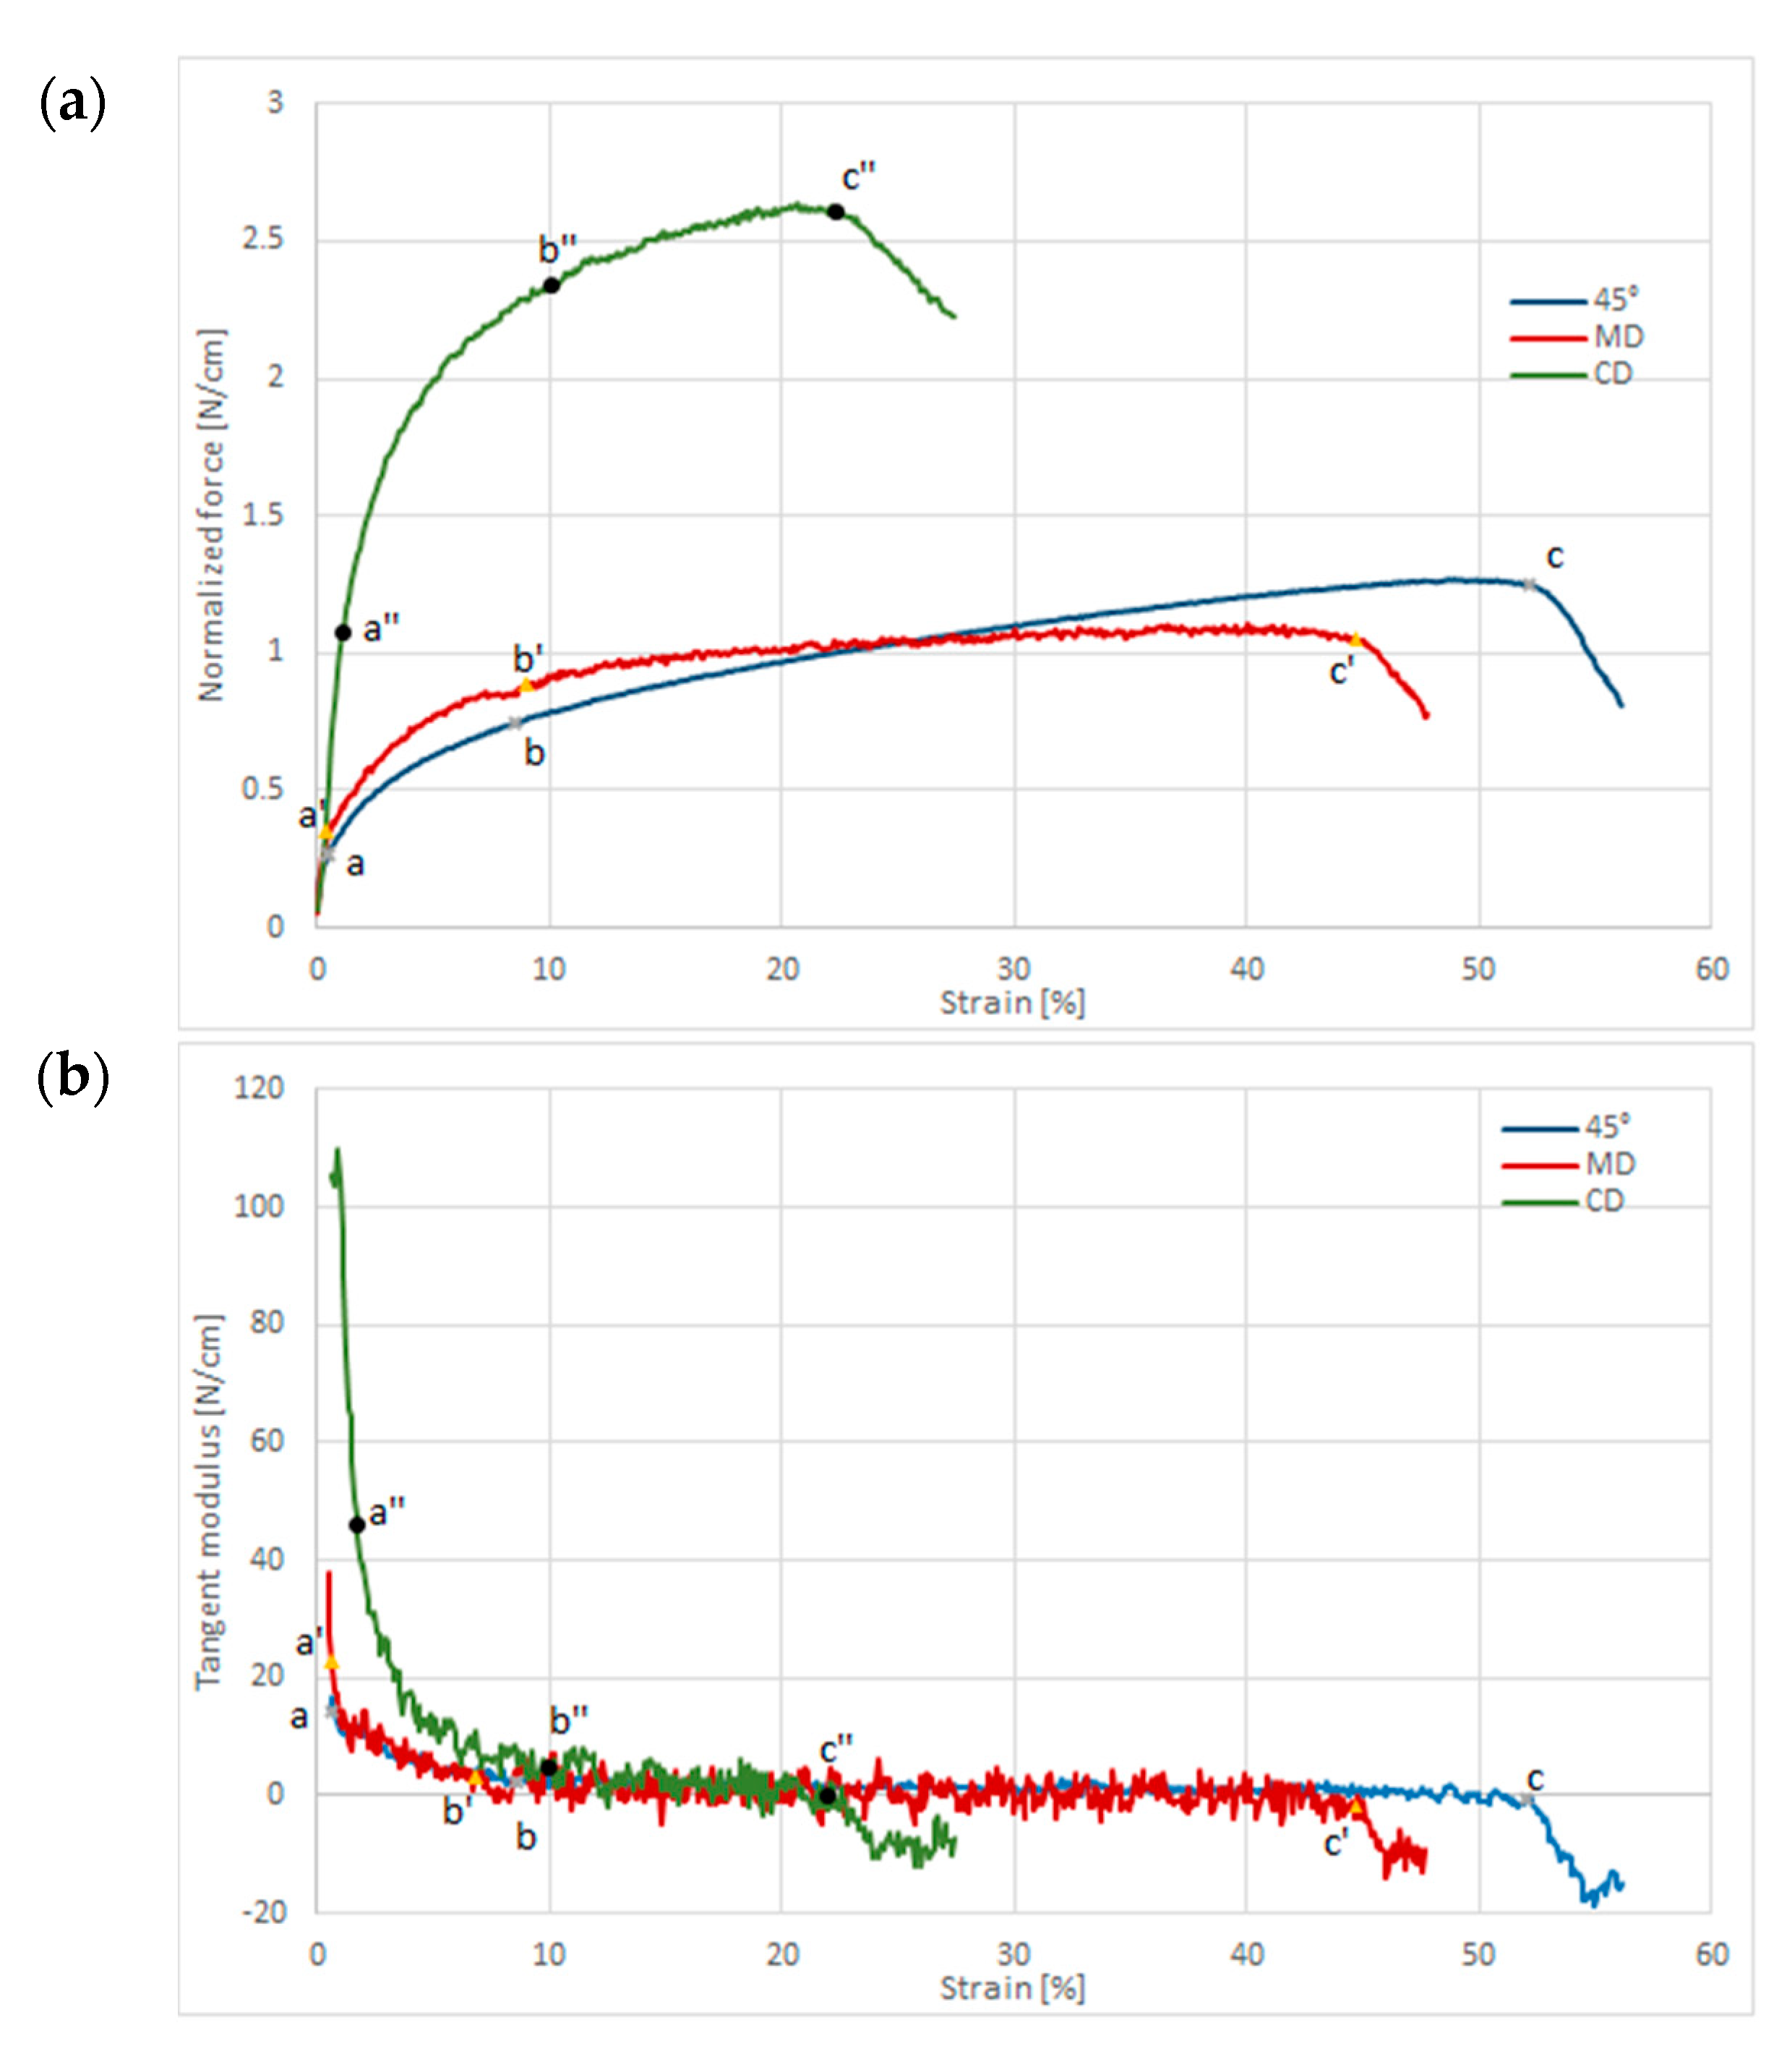
3.2.3. Tensile Test
3.2.4. Bending Test
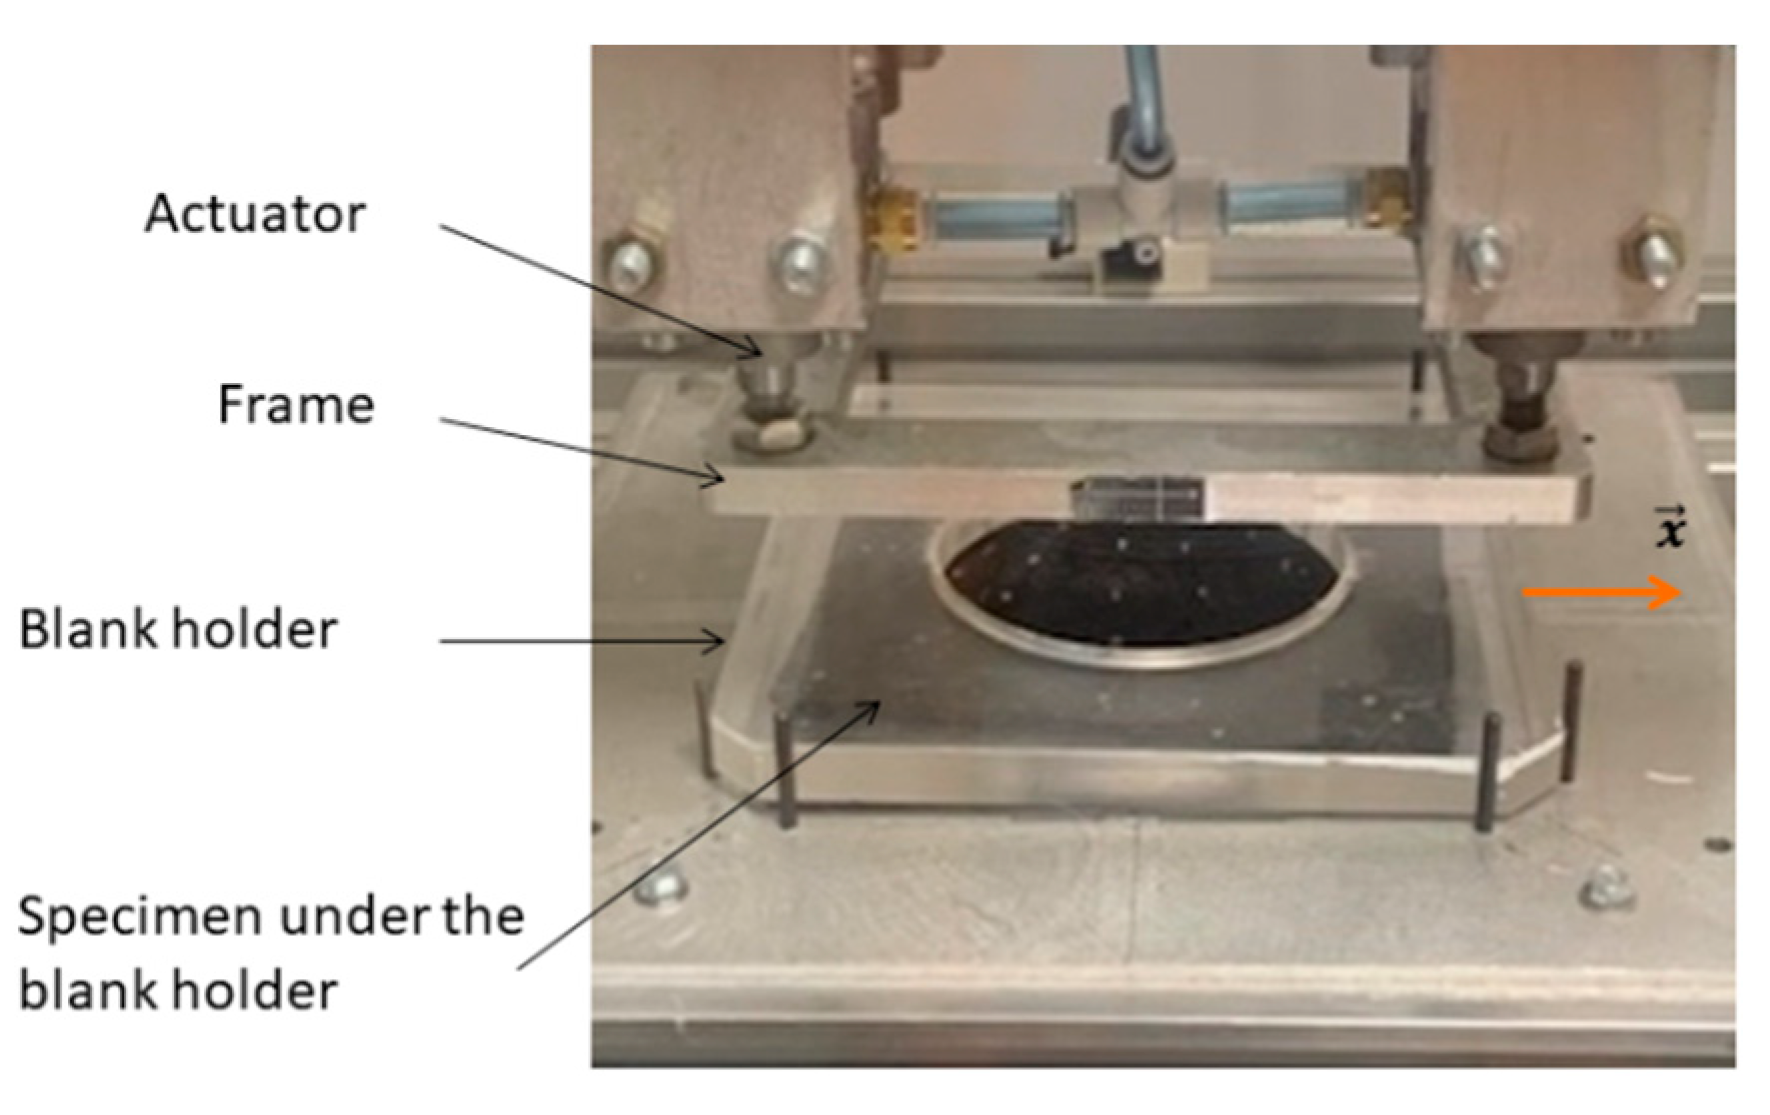
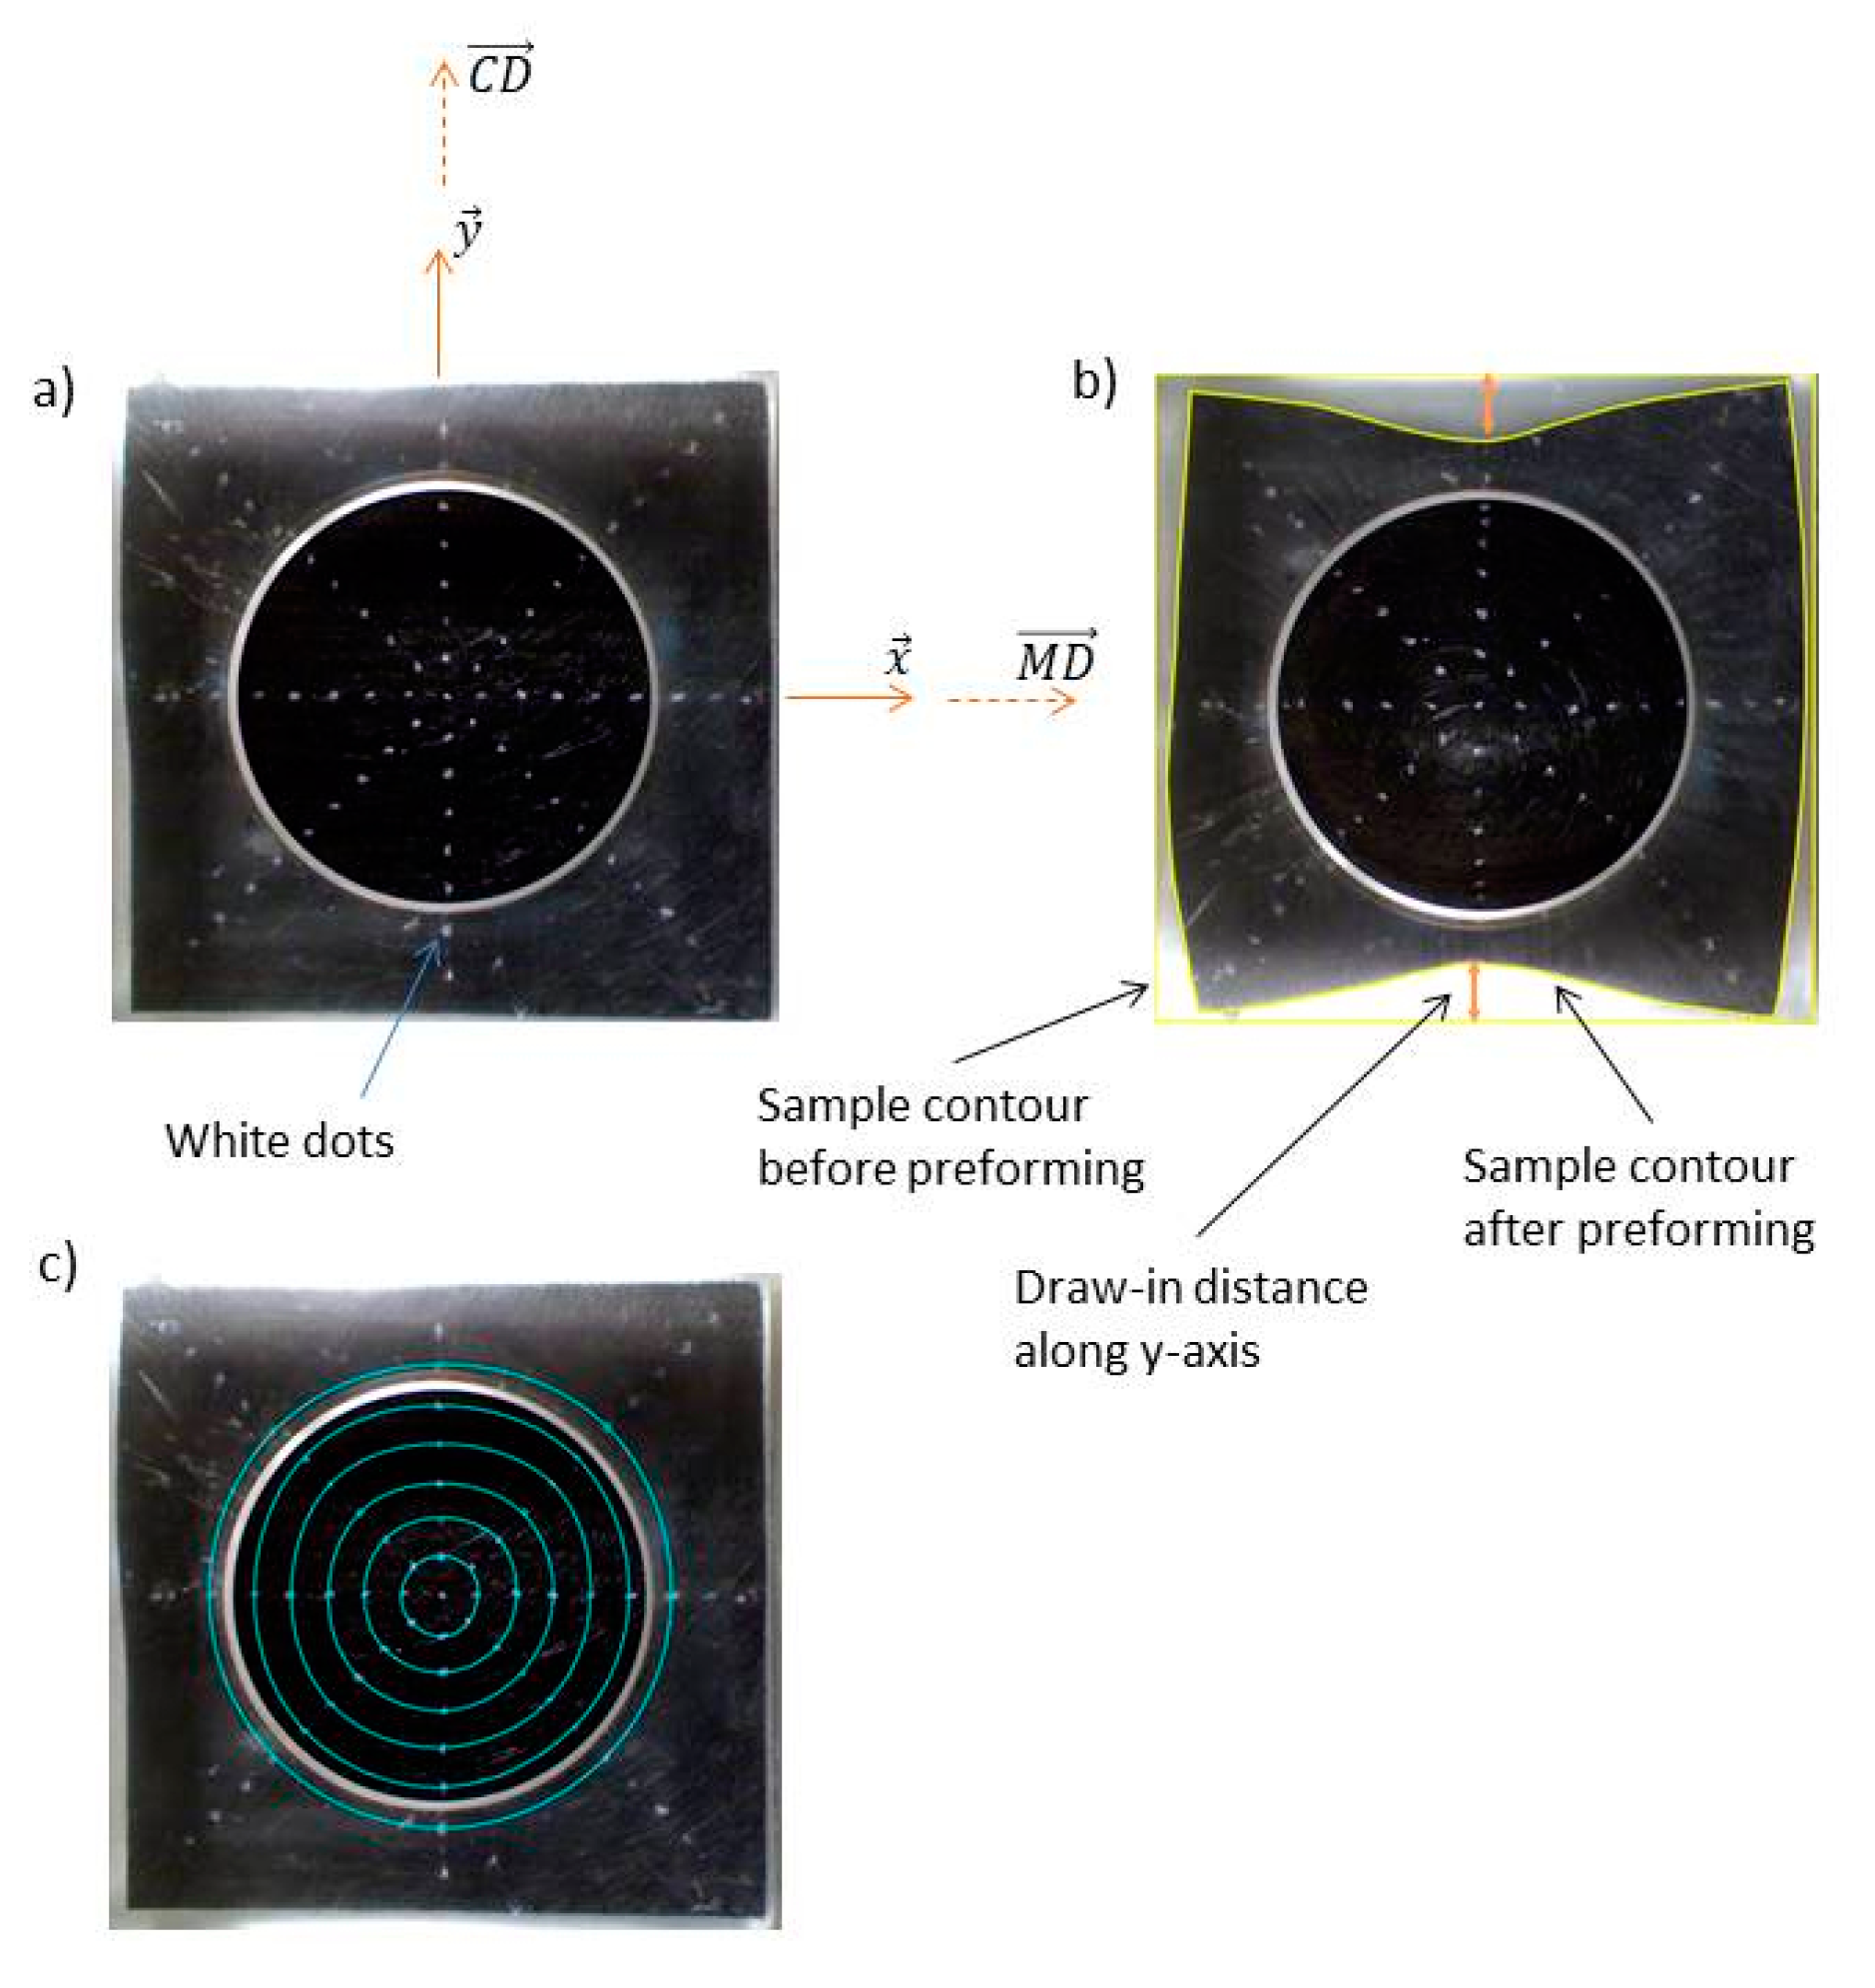
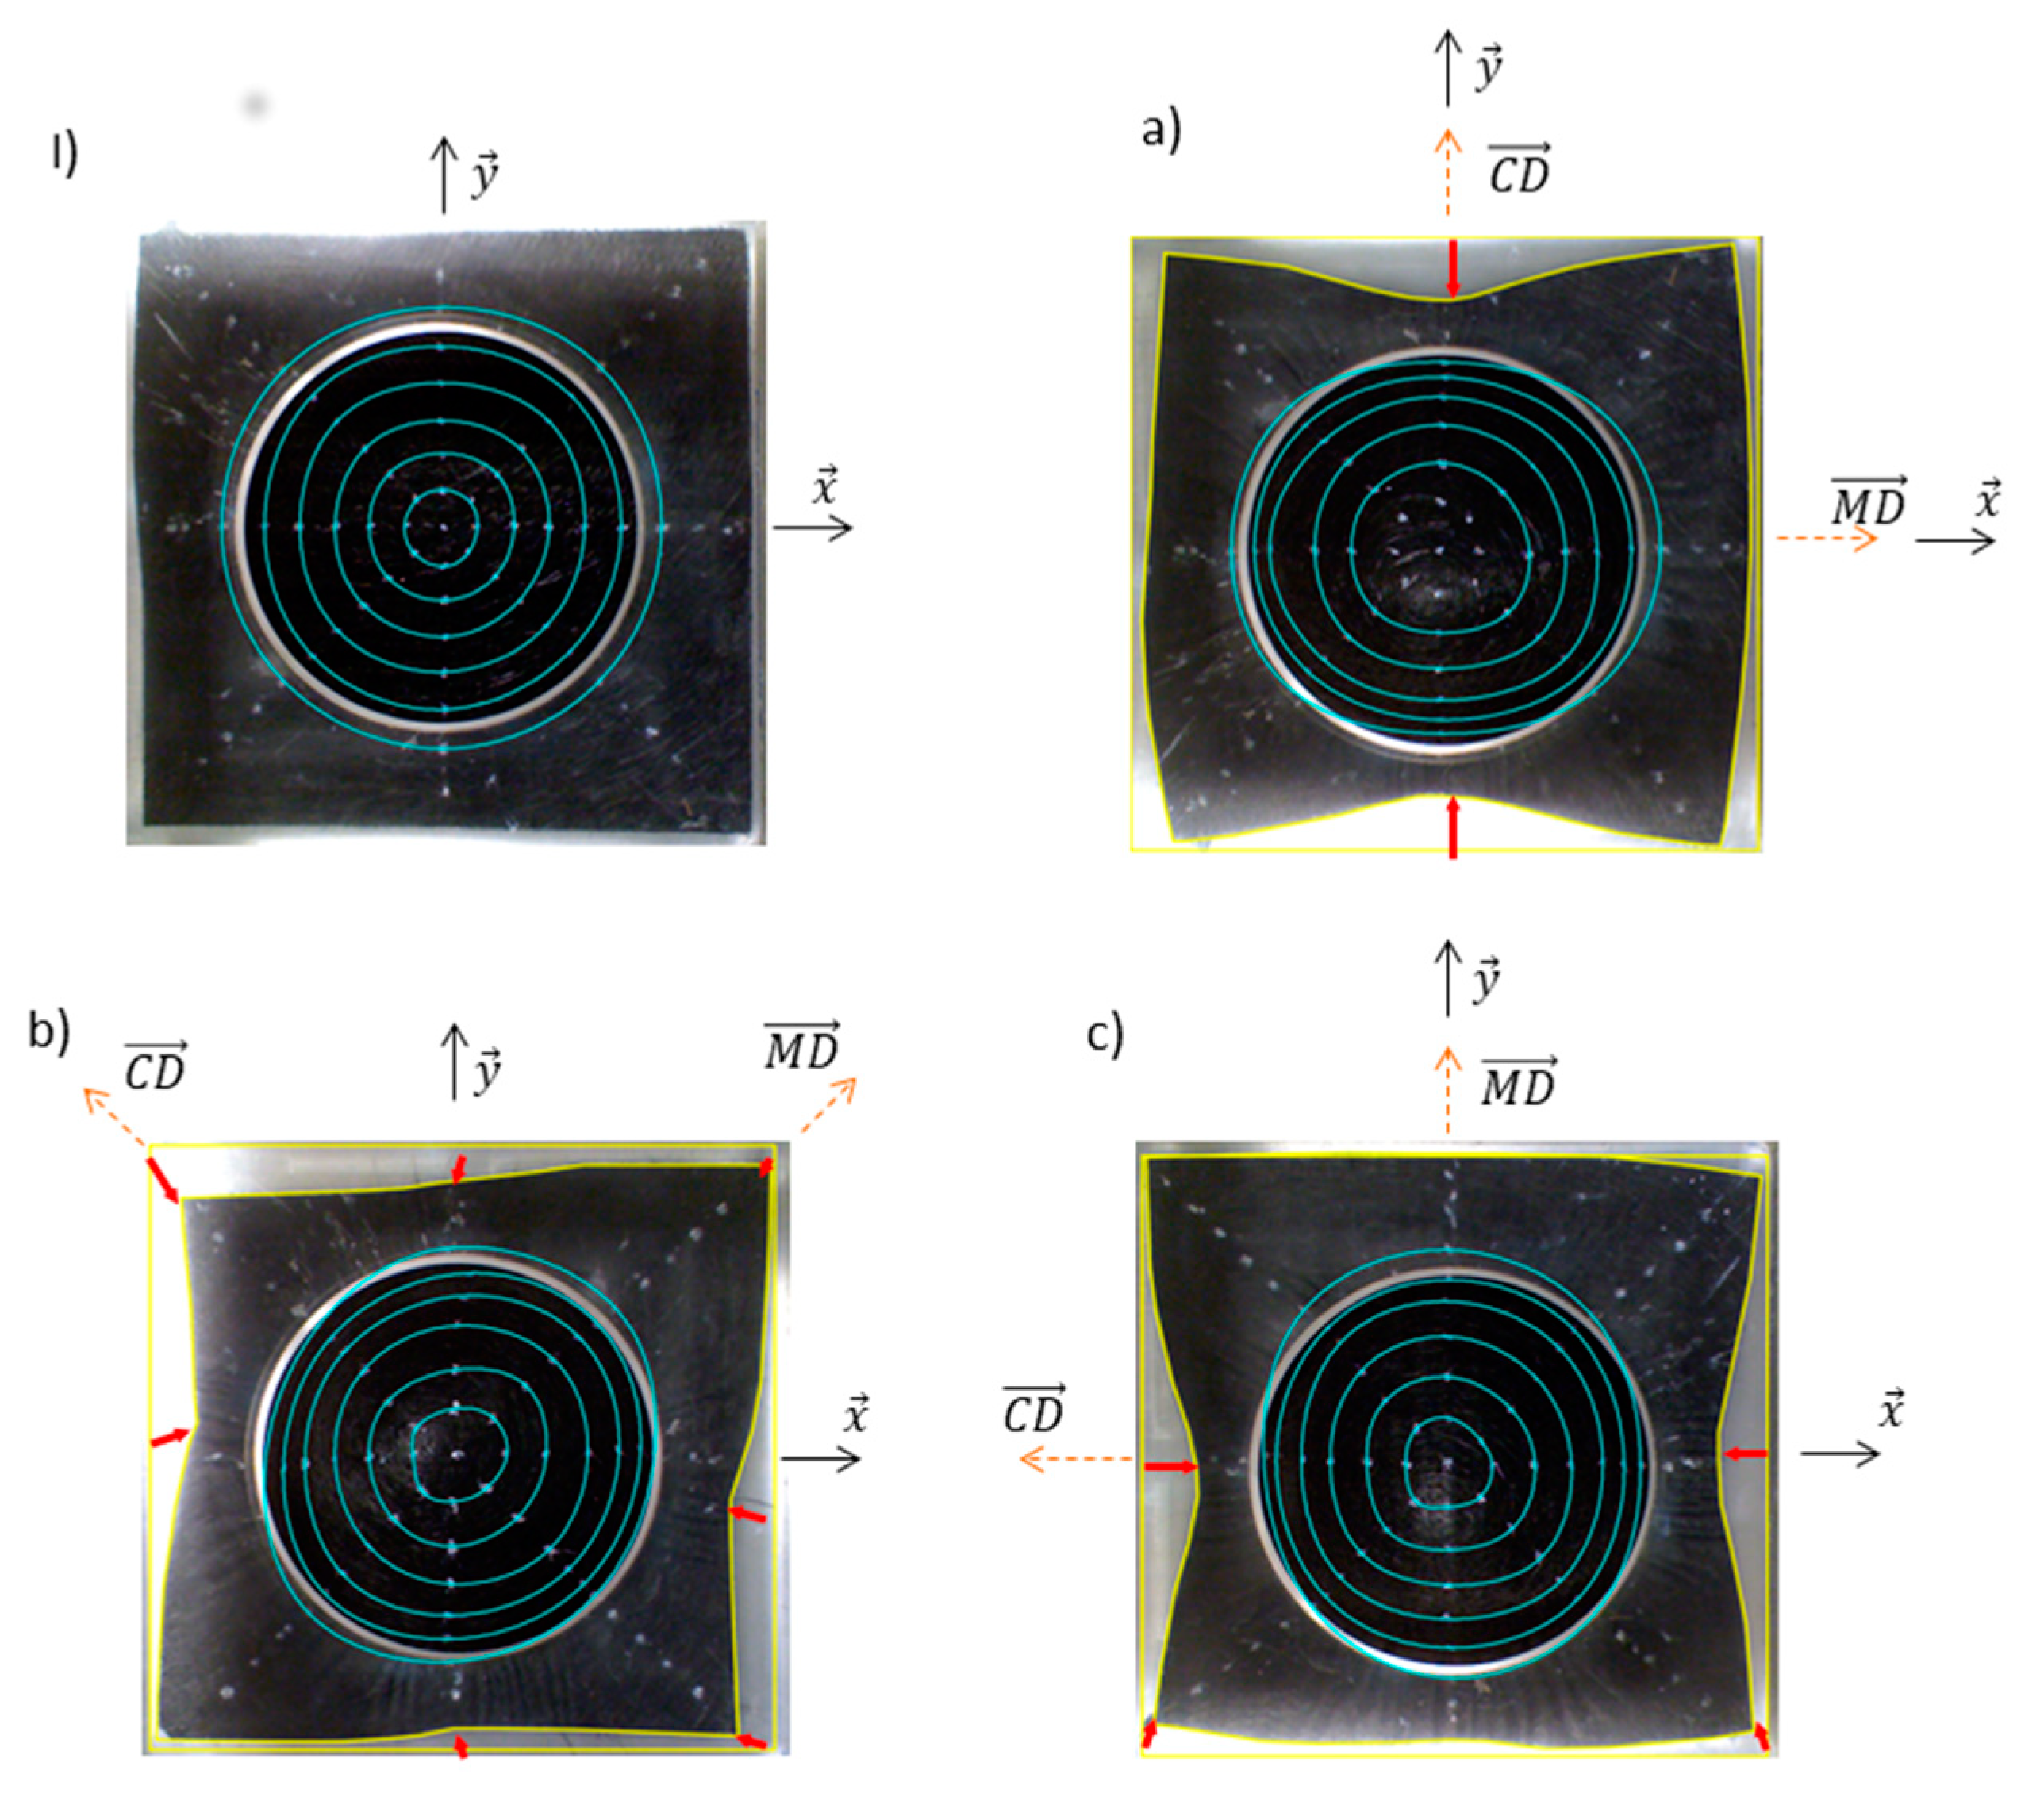
3.2.5. Preforming
3.3. Composite Scale
4. Results and Discussion
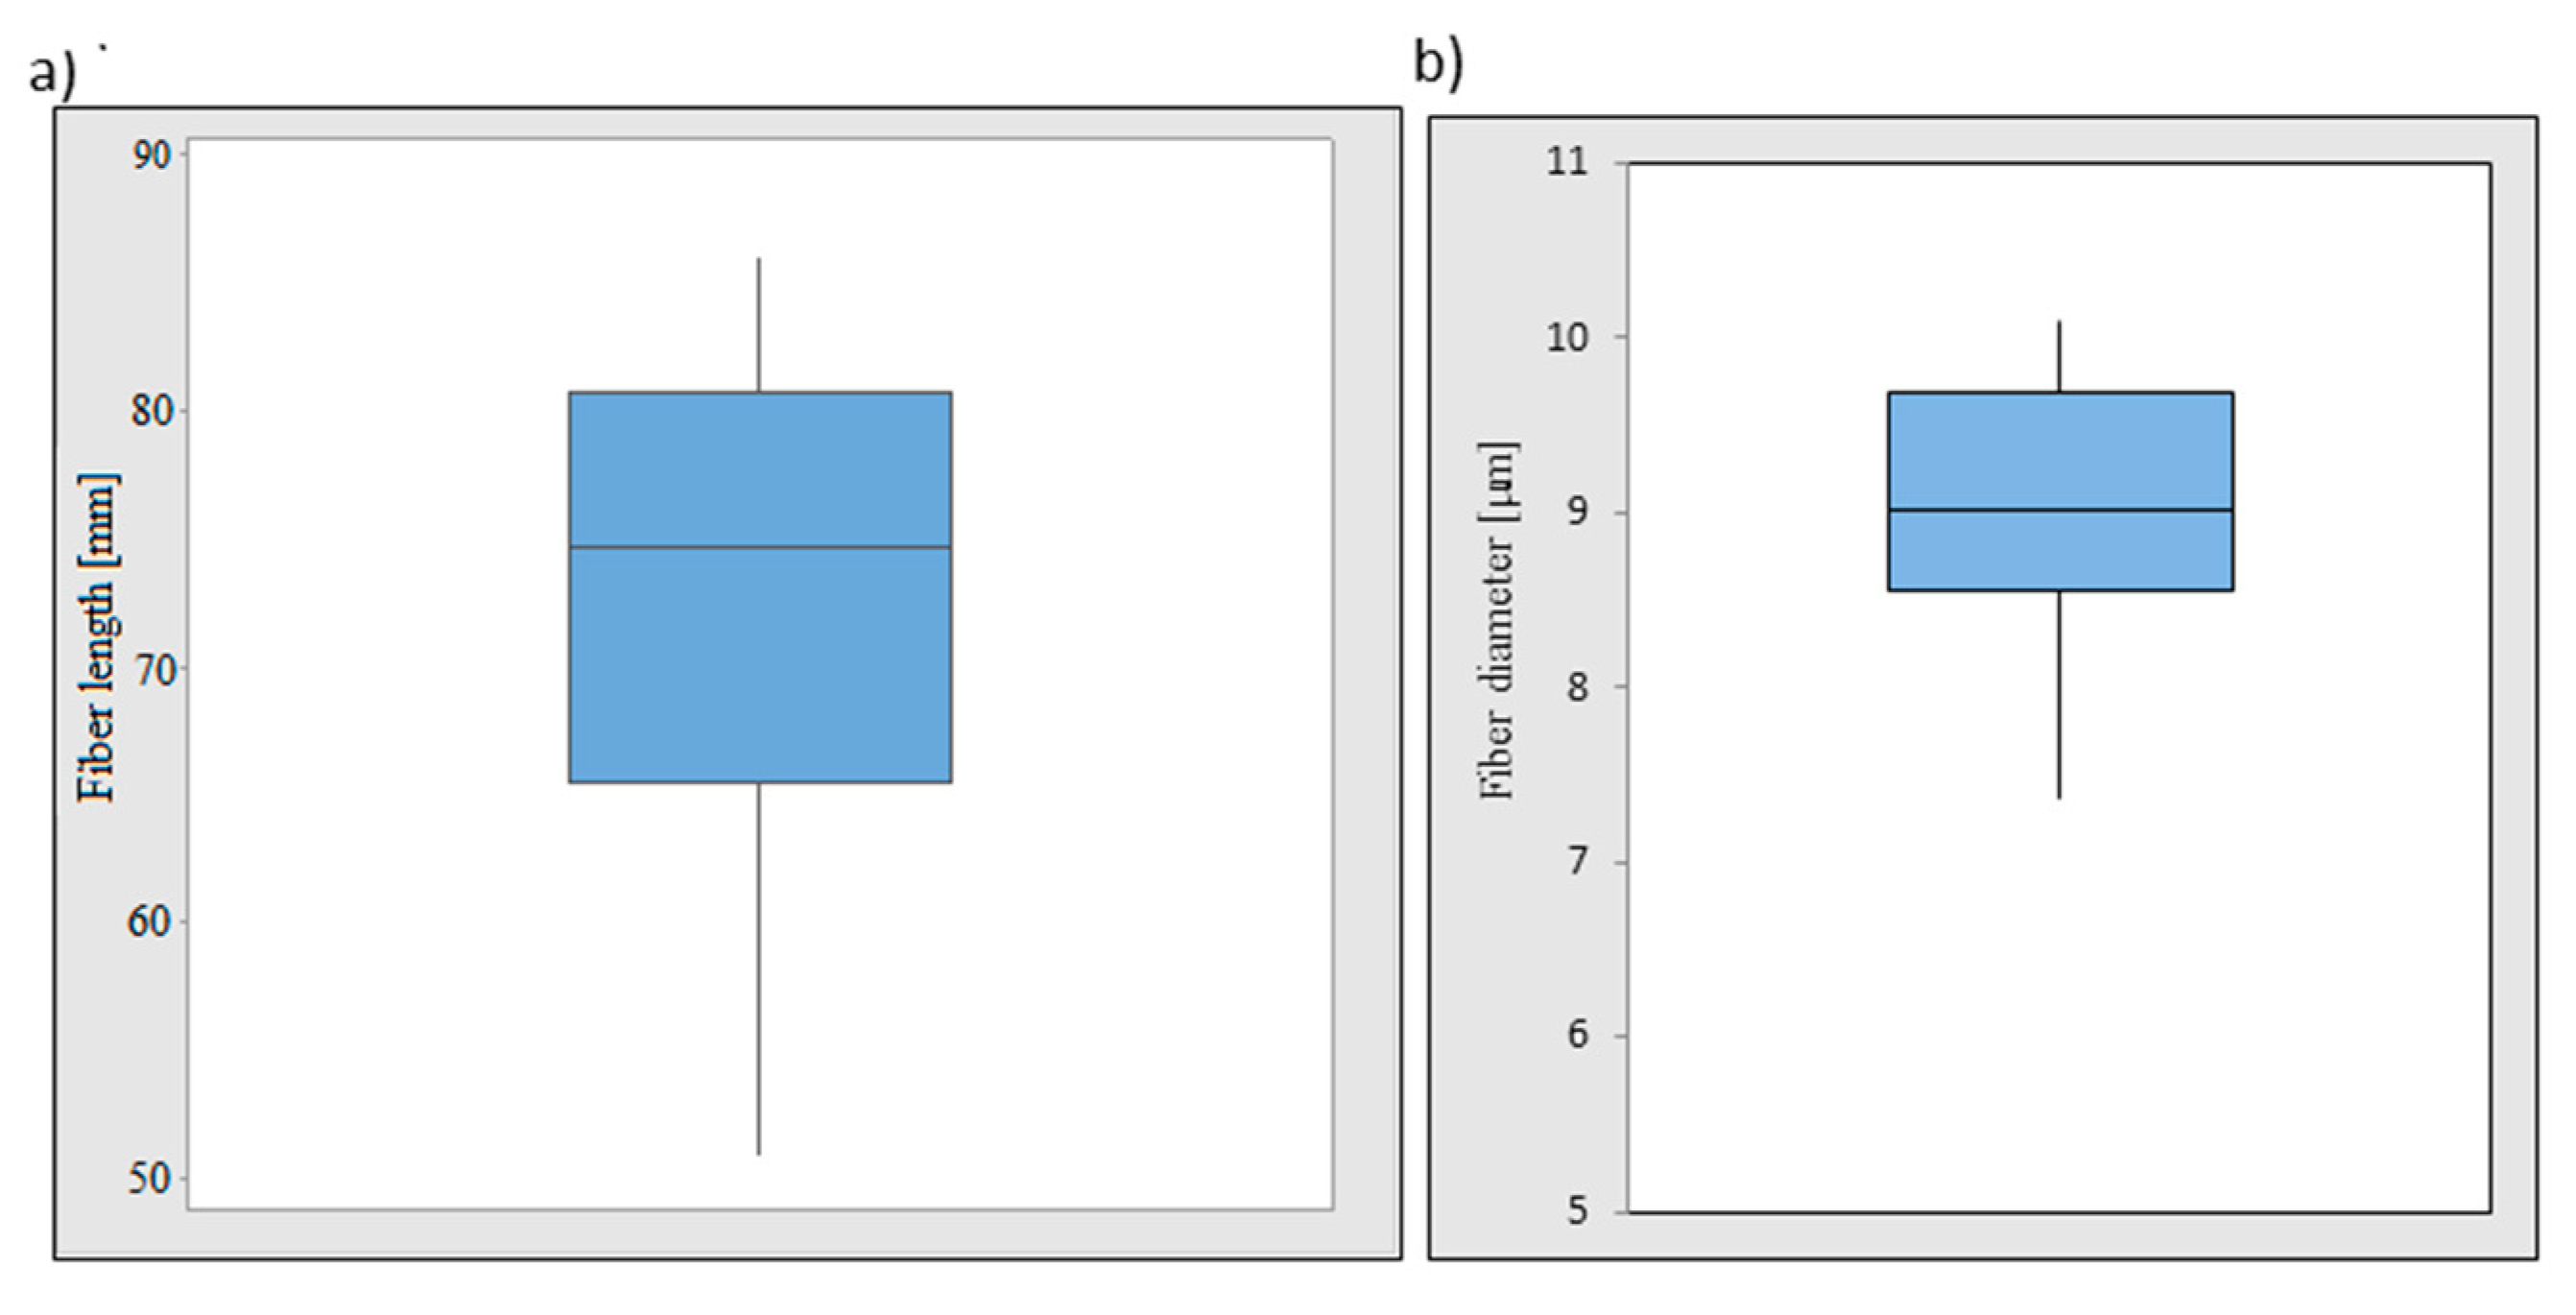
4.1. Recycled Carbon Fibres Properties
4.2. Nonwoven
4.2.1. Fibre Orientation
4.2.2. Compaction Behaviour of rCF Nonwoven Material
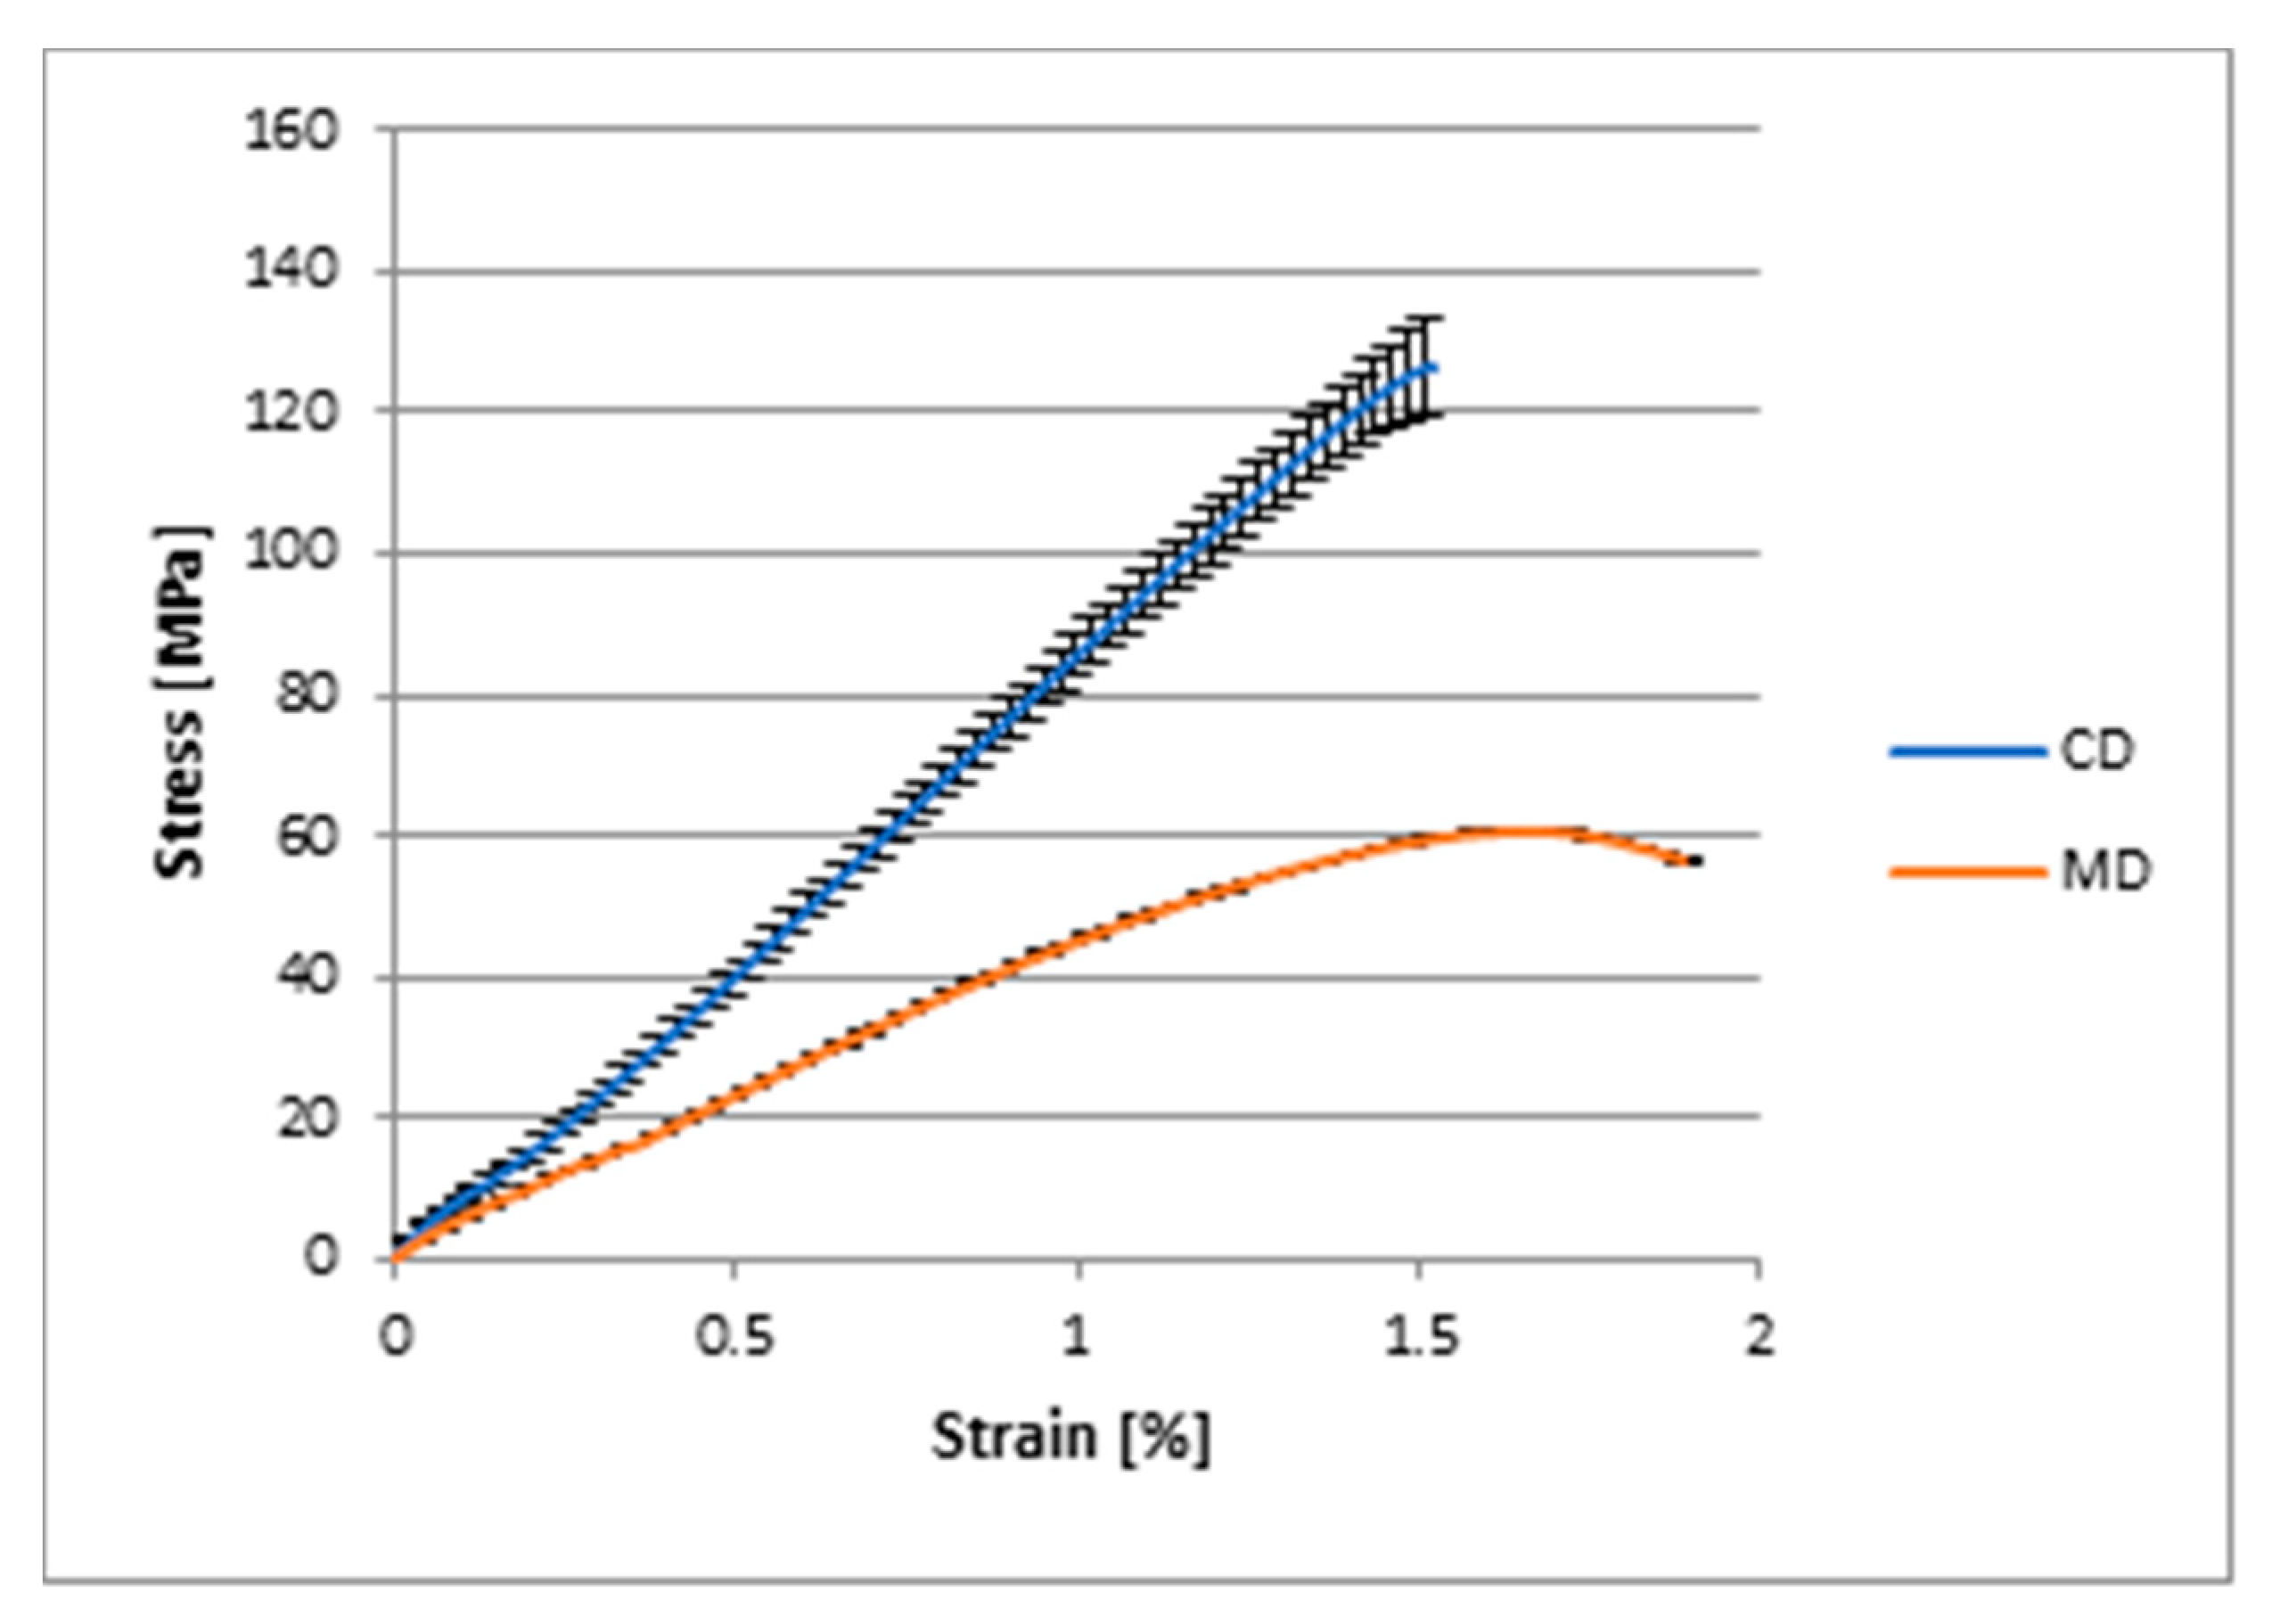
4.2.3. Tensile and Bending Behaviours of rCF Nonwoven Material
4.2.4. Preforming Behaviour of rCF Nonwoven Materials
4.3. Composite
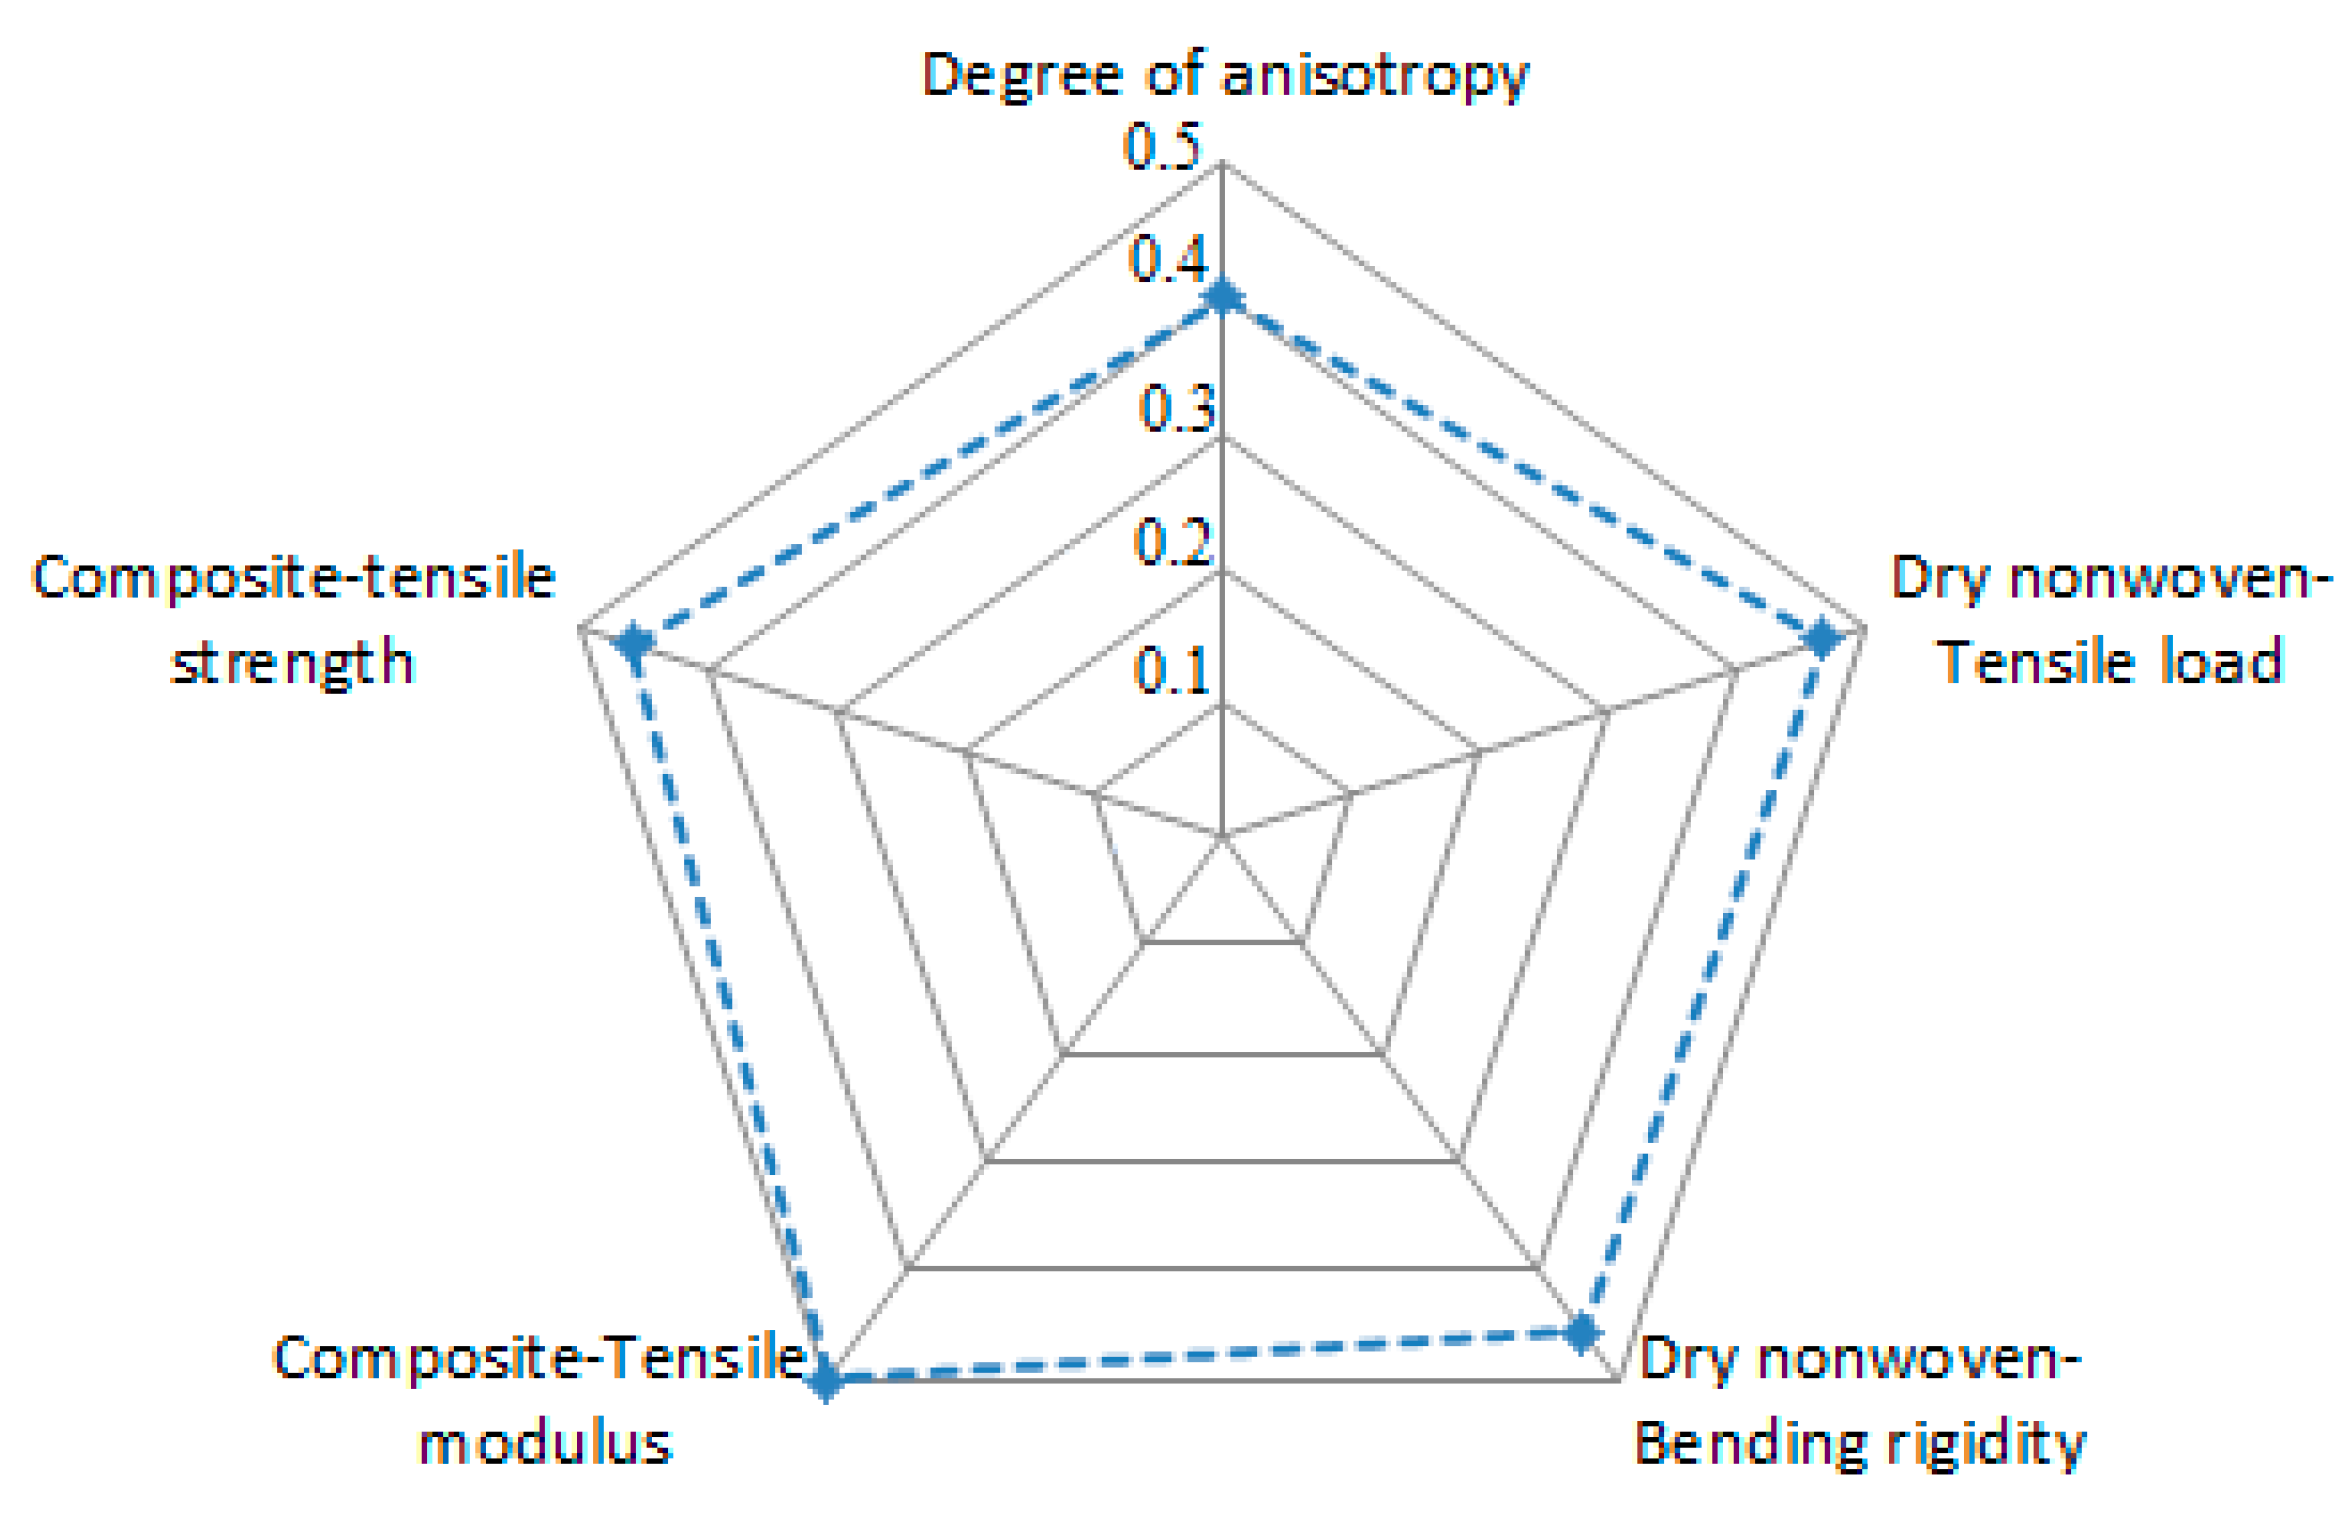
5. Conclusions
Author Contributions
Funding
Institutional Review Board Statement
Informed Consent Statement
Data Availability Statement
Conflicts of Interest
References
- Sauer, M.; Kuhnel, M. Composites Market Report 2019—Market Developments, Trends, Outlook and Challenges. Carbon Compos. 2019. Available online: https://composites-united.com/media/3988/eng_ccev_market-report_2019_short-version.pdf (accessed on 30 November 2021).
- Das, S.; Warren, J.; West, D.; Schexnayder, S.M. Global Carbon Fiber Composites Supply Chain Competitiveness Analysis; Technical Report of CEMACS; Oak Ridge National Laboratory; The University of Tennessee: Knoxville, TN, USA, 2016. [Google Scholar]
- Snudden, J.; Ward, C.; Potter, K. Reusing automotive composites production waste. Reinf. Plast. 2014, 58, 20–27. [Google Scholar] [CrossRef]
- Hagnell, M.; Åkermo, M. The economic and mechanical potential of closed loop material usage and recycling of fibre-reinforced composite materials. J. Clean. Prod. 2019, 223, 957–968. [Google Scholar] [CrossRef]
- Asmatulu, E.; Twomey, J.M.; Overcash, M. Recycling of fiber-reinforced composites and direct structural composite recycling concept. J. Compos. Mater. 2014, 48, 593–608. [Google Scholar] [CrossRef]
- Khurshid, M.F.; Hengstermann, M.; Hasan, M.M.B.; Abdkader, A.; Cherif, C. Recent developments in the processing of waste carbon fibre for thermoplastic composites—A review. J. Compos. Mater. 2020, 54, 1925–1944. [Google Scholar] [CrossRef]
- Barnett, P.R.; Gilbert, C.L.; Penumadu, D. Repurposed/recycled discontinuous carbon fiber organosheet development and composite properties. Compos. Part C Open Access 2021, 4, 100092. [Google Scholar] [CrossRef]
- Manis, F.; Stegschuster, G.; Wölling, J.; Schlichter, S. Influences on Textile and Mechanical Properties of Recycled Carbon Fiber Nonwovens Produced by Carding. J. Compos. Sci. 2021, 5, 209. [Google Scholar] [CrossRef]
- Barnett, P.R.; Ghossein, H.K. A Review of Recent Developments in Composites Made of Recycled Carbon Fiber Textiles. Textiles 2021, 1, 433–465. [Google Scholar] [CrossRef]
- Akonda, M.; Stefanova, M.; Potluri, P.; Shah, D. Mechanical properties of recycled carbon fibre/polyester thermoplastic tape composites. J. Compos. Mater. 2017, 51, 2655–2663. [Google Scholar] [CrossRef] [Green Version]
- Hengstermann, M.; Raithel, N.; Abdkader, A.; Hasan, M.; Cherif, C. Development of new hybrid yarn construction from recycled carbon fibers for high performance composites. Part-I: Basic processing of hybrid carbon fiber/polyamide 6 yarn spinning from virgin carbon fiber staple fibers. Text. Res. J. 2016, 86, 1307–1317. [Google Scholar] [CrossRef] [Green Version]
- Wei, H.; Nagatsuka, W.; Lee, H.; Ohsawa, I.; Sumimoto, K.; Wan, Y.; Takahashi, J. Mechanical properties of carbon fiber paper reinforced thermoplastics using mixed discontinuous recycled carbon fibers. Adv. Compos. Mater. 2017, 27, 19–34. [Google Scholar] [CrossRef]
- Lee, H.; Choi, C.-W.; Jin, J.-W.; Huh, M.; Lee, S.; Kang, K.-W. Homogenization-based multiscale analysis for equivalent mechanical properties of nonwoven carbon-fiber fabric composites. J. Mech. Sci. Technol. 2019, 33, 4761–4770. [Google Scholar] [CrossRef]
- Tunák, M.; Antoch, J. Monitoring homogeneity of textile fiber orientation. Text. Res. J. 2018, 88, 1226–1243. [Google Scholar] [CrossRef]
- Gager, V.; Legland, D.; Bourmaud, A.; Le Duigou, A.; Pierre, F.; Behlouli, K.; Baley, C. Oriented granulometry to quantify fibre orientation distributions in synthetic and plant fibre composite preforms. Ind. Crop. Prod. 2020, 152, 112548. [Google Scholar] [CrossRef]
- Yu, B.; Zhao, X.; Zeng, Y.; Qi, D. The influence of process parameters on needle punched nonwovens investigated using image analysis. RSC Adv. 2017, 7, 5183–5188. [Google Scholar] [CrossRef] [Green Version]
- Khurshid, M.F.; Abdkader, A.; Cherif, C. Processing of waste carbon and polyamide fibres for high-performance thermoplastic composites: Influence of carding parameters on fibre orientation, fibre length and sliver cohesion force. J. Text. Inst. 2020, 111, 1277–1287. [Google Scholar] [CrossRef]
- Jlassi, S.; Berthet, F.; Bernhart, G. Investigation of mechanical properties of nonwoven second generation composite material elaborated through a mixture of carbon fibers and filament lengths. In Proceedings of the ECCM18—18th European Conference on Composite Materials, Athens, Greece, 24–28 June 2018. [Google Scholar]
- AFNOR. NF EN 12127—Textiles–Fabrics—Determination of Mass Per Unit Area Using Small Samples; AFNOR: Dartford, UK, 1998. [Google Scholar]
- AFNOR. NF EN ISO 5084—Textiles—Determination of Thickness of Textiles and Textile Products; AFNOR: Dartford, UK, 1996. [Google Scholar]
- Schneider, C.A.; Rasband, W.S.; Eliceiri, K.W. NIH Image to ImageJ: 25 years of image analysis. Nat. Methods 2012, 9, 671–675. [Google Scholar] [CrossRef]
- Barocas, V. Image-Based Fiber Orientation and Alignment Calculator, University of Minnesota. Available online: https://license.umn.edu/product/image-based-fiber-orientation-and-alignment-calculator (accessed on 11 November 2021).
- Syerko, E.; Oter, L.; Pawar, A.; Binetruy, C.; Advani, S.G.; Eck, B. Comparative Study of Methods for the Quantification of Fiber Orientations of Composite Reinforcements. In Proceedings of the 21ème Journées Nationales des Composites, Bordeaux, France, 1–3 July 2019. [Google Scholar]
- Sander, E.A.; Barocas, V.H. Comparison of 2D fiber network orientation measurement methods. J. Biomed. Mater. Res. Part A 2009, 88A, 322–331. [Google Scholar] [CrossRef]
- Ivanov, D.S.; van Gestel, C.; Lomov, S.V.; Verpoest, I. Local compressibility of draped woven fabrics. In Proceedings of the ECCM15—15th European Conference on Composite Materials, Venice, Italy, 24–28 June 2012. [Google Scholar]
- Nguyen, Q.; Vidal-Sallé, E.; Boisse, P.; Park, C.H.; Saouab, A.; Bréard, J.; Hivet, G. Mesoscopic scale analyses of textile composite reinforcement compaction. Compos. Part B Eng. 2013, 44, 231–241. [Google Scholar] [CrossRef]
- Yousaf, Z.; Potluri, P.; Withers, P. Influence of Tow Architecture on Compaction and Nesting in Textile Preforms. Appl. Compos. Mater. 2017, 24, 337–350. [Google Scholar] [CrossRef]
- Yong, A.; Aktas, A.; May, D.; Endruweit, A.; Lomov, S.; Advani, S.; Hubert, P.; Abaimov, S.; Abliz, D.; Akhatov, I.; et al. Experimental characterisation of textile compaction response: A benchmark exercise. Compos. Part A Appl. Sci. Manuf. 2021, 142, 106243. [Google Scholar] [CrossRef]
- Danzi, M.; Schneeberger, C.; Ermanni, P. A model for the time-dependent compaction response of woven fiber textiles. Compos. Part A Appl. Sci. Manuf. 2018, 105, 180–188. [Google Scholar] [CrossRef]
- Corbin, A.-C.; Soulat, D.; Ferreira, M.; Labanieh, A.-R.; Gabrion, X.; Malécot, P.; Placet, V. Towards hemp fabrics for high-performance composites: Influence of weave pattern and features. Compos. Part B Eng. 2019, 181, 107582. [Google Scholar] [CrossRef]
- AFNOR. NF EN ISO 9073-3—Textiles-Test Method for Nonwoven—Part 3: Determination of Tensile Strength and Elongation; AFNOR: Dartford, UK, 1992. [Google Scholar]
- AFNOR. NF EN ISO 9073-7—Textiles-Test Method for Nonwoven—Part 7: Determination of Bending Length; AFNOR: Dartford, UK, 1998. [Google Scholar]
- Omrani, F.; Wang, P.; Soulat, D.; Ferreira, M.; Ouagne, P. Analysis of the deformability of flax-fibre nonwoven fabrics during manufacturing. Compos. Part B Eng. 2017, 116, 471–485. [Google Scholar] [CrossRef] [Green Version]
- Dufour, C.; Boussu, F.; Wang, P.; Soulat, D. Local strain measurements of yarns inside of 3D warp interlock fabric during forming process. Int. J. Mater. Form. 2018, 11, 775–788. [Google Scholar] [CrossRef]
- Corbin, A.-C.; Soulat, D.; Ferreira, M.; Labanieh, A.-R. Influence of Process Parameters on Properties of Hemp Woven Reinforcements for Composite Applications: Mechanical Properties, Bias-extension Tests and Fabric Forming. J. Nat. Fibers 2020, 17, 1–13. [Google Scholar] [CrossRef]
- Berges, M.; Léger, R.; Placet, V.; Person, V.; Corn, S.; Gabrion, X.; Rousseau, J.; Ramasso, E.; Ienny, P.; Fontaine, S. Influence of moisture uptake on the static, cyclic and dynamic behaviour of unidirectional flax fibre-reinforced epoxy laminates. Compos. Part A Appl. Sci. Manuf. 2016, 88, 165–177. [Google Scholar] [CrossRef] [Green Version]
- ASTM International. ASTM D3039/D3039M-17—Standard Test Method for Tensile Properties of Polymer Matrix Composite Materials; ASTM International: West Conshohocken, PA, USA, 2017. [Google Scholar]
- Gatouillat, S.; Bareggi, A.; Vidal-Sallé, E.; Boisse, P. Meso modelling for composite preform shaping simulation of the loss of cohesion of the woven fibre network. Compos. Part A 2013, 54, 135–144. [Google Scholar] [CrossRef]
- Boisse, P.; Hamila, N.; Madeo, A. Analysis of defect developments in composite forming. In The Structural Integrity of Carbon Fiber Composites; Beaumont, P.W.R., Soutis, C., Eds.; Springer International Publishing: New York, NY, USA, 2017. [Google Scholar]
- Labanieh, A.R.; Garnier, C.; Ouagne, P.; Dalverny, O.; Soulat, D. Intra-ply yarn sliding defect in hemisphere preforming of a woven preform. Compos. Part A 2018, 107, 432–446. [Google Scholar] [CrossRef] [Green Version]


| 45° | MD | CD | ||
|---|---|---|---|---|
| Uniaxial tensile | Maximum normalized force [N/cm] | 6.31 (0.53) | 5.36 (0.68) | 13.06 (0.26) |
| Strain at maximum force [%] | 52.72 (1.44) | 46.54 (1.75) | 22.71 (2.47) | |
| Flexural rigidity | Rigidity per unit width [N.m/cm] | 104 (3.7) | 101 (7.6) | 221 (11.8) |
| Specimen Orientation | 0° | 45° | 90° |
|---|---|---|---|
| Eccentricity index | 0.52 | 0.48 | 0.57 |
| 0° | 0° | 0° |
| Orientation | Thickness (mm) | Tensile Modulus (GPa) | Tensile Strength (MPa) | Failure Strain (%) | ||
|---|---|---|---|---|---|---|
| MD | 2.25 (0.03) | 18.9 (0.97) | 3.2 (2.2) | 4.42 (0.13) | 61.86 (1.74) | 1.78 (0.2) |
| CD | 2.29 (0.06) | 19.4 (0.54) | 4.6 (0.9) | 8.83 (0.71) | 132.2 (13.07) | 1.63 (0.37) |
Publisher’s Note: MDPI stays neutral with regard to jurisdictional claims in published maps and institutional affiliations. |
© 2021 by the authors. Licensee MDPI, Basel, Switzerland. This article is an open access article distributed under the terms and conditions of the Creative Commons Attribution (CC BY) license (https://creativecommons.org/licenses/by/4.0/).
Share and Cite
Ivars, J.; Labanieh, A.R.; Soulat, D. Effect of the Fibre Orientation Distribution on the Mechanical and Preforming Behaviour of Nonwoven Preform Made of Recycled Carbon Fibres. Fibers 2021, 9, 82. https://doi.org/10.3390/fib9120082
Ivars J, Labanieh AR, Soulat D. Effect of the Fibre Orientation Distribution on the Mechanical and Preforming Behaviour of Nonwoven Preform Made of Recycled Carbon Fibres. Fibers. 2021; 9(12):82. https://doi.org/10.3390/fib9120082
Chicago/Turabian StyleIvars, Jean, Ahmad Rashed Labanieh, and Damien Soulat. 2021. "Effect of the Fibre Orientation Distribution on the Mechanical and Preforming Behaviour of Nonwoven Preform Made of Recycled Carbon Fibres" Fibers 9, no. 12: 82. https://doi.org/10.3390/fib9120082