Article

Interface Characterization of Epoxy Resin Nanocomposites: A Molecular Dynamics Approach

Aragon Institute of Technology ITAINNOVA, María de Luna 7-8, 50018 Zaragoza, Spain
*
Author to whom correspondence should be addressed.
Fibers 2018, 6(3), 54; https://doi.org/10.3390/fib6030054
Submission received: 16 July 2018 / Revised: 3 August 2018 / Accepted: 6 August 2018 / Published: 7 August 2018

Abstract

:
In polymer nanocomposites, the interface region between the matrix and the fillers has been identified as a key interaction region that strongly determines the properties of the final material. Determining its structure is crucial from several points of view, from modeling (i.e., properties prediction) to materials science (i.e., understanding properties/structure relationships). In the presented paper, a method for characterizing the interface region of polymer nanocomposites is described using molecular dynamics (MD) simulations. In particular, the structure of the polymer within the interface region together with its dimension in terms of thickness were analyzed through density profiles. Epoxy resin nanocomposites based on diglycidyl ether of bisphenol A (DGEBA) were studied using this approach, and the interface region with triple walled carbon nanotubes (TWCNT) and carbon fibers (CF) was characterized. The effect of carbon nanotube diameter, type of hardener, and effect of epoxy resin cross-linking degree on interface thickness were analyzed using MD models. From this analysis no general rule on the effect of these parameters on the interface thickness could be established, since in some cases overlapping effects between the analyzed parameters were observed, and each specific case needs to be analyzed independently in detail. Results show that the diameter has an impact on interface thickness, but this effect is affected by the cross-linking degree of the epoxy resin. The type of hardener also has a certain influence on the interface thickness.

Graphical Abstract

1. Introduction

Nanoparticle reinforced polymeric composites have generated considerable attention among material scientists and engineers due to their potential of producing superior physical, chemical, and mechanical properties. The influence of nano-scale size fillers on the composite properties is somewhat surprising because this type of effect is not seen in conventional composite materials [1]. The presence of nanoparticles introduces an enormous amount of interfacial area in which polymer chains undergo conformational changes and deformations at the nanoscale [2,3]. The interfacial interaction between polymer and nanoparticle manifests itself as perturbation of the structure (e.g., density, chain orientation or arrangement) and the dynamics of the polymer [4,5,6]. This region of altered polymer properties is commonly referred to in the literature as the interface.
Carbon nanofillers, such as carbon nanotubes (CNT), graphene, and graphene nanoribbons (GNR), have attracted recent attention due to their extraordinary thermo-physical and electrical behavior [7]. The covalent bonds between the carbon atoms in this type of nanofiller are among the strongest of bonds, which provide them with high mechanical strength [8]. The large surface area, low density, outstanding electrical [9,10], thermal [11]. and mechanical properties [12] make them relevant for developing fiber-reinforced nanocomposites that have found applications in aerospace, medicine, electronics, automobile, packaging, adhesives, and many other industrial and household applications [13,14,15]. In a similar way, fibrous materials based on this type of structure have also attracted the attention of many researchers. Carbon fibers (CF) have been developed as one of the most important industrial materials of modern science and technology occurring since 1960 [16]. Due to the superior mechanical properties including high specific strength and modulus, low density and thermal expansion, heat resistance, and chemical stability, carbon fibers have provided as reinforcement materials the impetus for researchers in developing high-performance composite materials. Again, although in these cases the interaction areas are much lower, an important component which governs the properties of CF reinforced composites is the interface between fibers and polymeric matrix. In fact, this interface notably influences the off-axis strength properties, the impact toughness, the environmental stability, and the functional performance of CF composites [17].
In many cases the extraordinary properties of composites cannot be explained or predicted from standard continuum mechanics models [18,19,20,21]. The influence of interface properties on the mechanical properties of the composite is especially critical when the reinforcement is in the nanoscale dimension, and cannot be considered with standard two-phase micromechanics approximations. In the last decades, new formulations of these analytical models for nanoscale size inclusions have been developed in which surface/interface effects become important [22]. In these extended analytical models the interface is considered as a third phase, with behavior and mechanical properties different from that of the bulk polymer. Several studies have shown better performance of these three-phase models with respect to the related two-phase model in the determination of mechanical properties of nanoreinforced polymers [23,24,25,26].
The existence of a non-covalent interfacial region between carbonaceous fillers (nanotubes and/or fibers) and polymer matrix decrease the potential reinforcement expected to carbon nanotubes, due to the poor load transfer between each component in the nanocomposite [23]. Understanding the characteristics of this interface region between the carbonaceous filler (nanotube or fiber) and polymer matrix is a key factor in improving the design of polymer nanocomposites and takes advantage of all the capabilities that carbon nano-reinforcements bring. The experimental characterization of polymer surfaces and interfaces in many cases requires quite special/complex techniques, and often a combination of different techniques is needed [27]. To date, the accuracy and repeatability of basic force/displacement measurements taken using probe microscopy—a technique which made possible for the first time imaging and manipulation of materials at the level of individual atoms—has been a subject of debate. Because of this uncertainty, it appears that accurate, quantitative material testing is currently limited to devices that resolve only down to the microscale (10−6 m). Due to the difficulties in the experimental characterization of the interface regions, the most used strategy is to estimate the properties of the interface region by atomistic simulation techniques, such as molecular dynamics (MD) or related coarse-graining (CG) approaches [28]. The majority of these previous works have focused on the characterization of carbon nanotube-polymer reinforcements [23,29,30], although in recent years great effort has been made to model the interface region of nanoclay or other nanoparticle reinforced composites [4,6,24,31,32]. In this sense, Arash et al. [23], based on an energy approach, studied the influence of CNT aspect ratio (length over radius ratio) on the mechanical properties of the interface region. Tsafack et al. [33] analyzed the effect of different chemical modification of CNT (dopants, functional groups, and vacants) on the affinity index, which is the average distance between a given polymer molecule and the CNT.
In the presented study, a variety of molecular models of carbon nanotube/fiber and epoxy resin nanocomposites were developed in order to study and characterize the interface region in terms of its main structural features by means of molecular dynamics (MD) simulations. The method proposed for the study was based on the analysis of the accumulated standard deviation (ASD) profile generated from polymer density curves, which allowed for a more systematic characterization of the interfaces. The effects of the carbon nanotube diameter, type of hardener, and cross-linking degree of epoxy resin on interface thickness, van der Waals (vdW) gap, and peak density were analyzed from the average position of atoms obtained from the MD simulations. In this sense, the methodology was proven to constitute a useful and effective tool for nano-composites interface characterization which can complement other experimental approaches.

2. Materials and Methods

As previously introduced, the models developed are based on epoxy resin polymers. The epoxy component of the resin is the diglycidyl ether of bisphenol-A (DGEBA) while two types of hardeners were considered: the polyamine diethylene triamine (DETA); and the methyl tetrahydrophthalic anhydride (MeTHPA). The chemical structure of the epoxy and the hardener molecules is shown in Figure 1, in which partial charges are also pointed out. These partial charges were calculated according to bond increments as stated in the COMPASS force field [34], which was used to model the interactions between polymer atoms. The analytic forms of the energy expressions stated in this force field are given below:
E p o t = b [ K 2 ( r r 0 ) 2 + K 3 ( r r 0 ) 3 + K 4 ( r r 0 ) 4 ] + θ [ H 2 ( θ θ 0 ) 2 + H 3 ( θ θ 0 ) 3 + H 4 ( θ θ 0 ) 4 ] + ϕ [ V 1 [ 1 c o s ( ϕ ϕ 1 0 ) ] + V 2 [ 1 c o s ( 2 ϕ ϕ 2 0 ) ] + V 3 [ 1 c o s ( 3 ϕ ϕ 3 0 ) ] ] + χ K χ χ 2 + b b F b b ( b b 0 ) ( b b 0 ) + b θ F b θ ( b b 0 ) ( θ θ 0 ) + b ϕ ( b b 0 ) [ V 1 c o s ϕ + V 2 c o s 2 ϕ + V 3 c o s 3 ϕ ] + b ϕ ( b b 0 ) [ V 1 c o s ϕ + V 2 c o s 2 ϕ + V 3 c o s 3 ϕ ] + θ ϕ ( θ θ 0 ) [ V 1 c o s ϕ + V 2 c o s 2 ϕ + V 3 c o s 3 ϕ ] + ϕ θ θ K ϕ θ θ c o s ϕ ( θ θ 0 ) ( θ θ 0 ) + i > j q i q j ε r i j + i > j [ A i j r i j 9 B i j r i j 6 ]
where Ki, Hi, Vi, and Fi are constants, r is the distance between atoms, b is the bond length, θ and φ are the bond angles of bending and torsion, qi is the partial charge of a given atom, and Ai and Bi are the van de Waals parameters. The values of these parameters were defined based on the force field previously mentioned, specified in the work of H. Sun “COMPASS: An ab initio force-field optimized for condensed-phase applications—an overview” with details on alkane and benzene compounds [34].
Two types of carbon fillers were studied: triple-walled carbon nanotubes (TWCNT) and carbon fibers (CF). A summary of the modeled carbon structures is shown in Figure 2. The selection of the number of layers (three in both cases, Figure 2) was done taking into account that the structures of the interfaces are mainly determined by the interactions produced between the polymer and the graphene sheets that are close to the interface region. The graphene layers that are far from this region do not influence the interface structure. In this sense, it was verified considering the fact that a higher number of layers do not have a relevant effect on the interface characteristics obtained on comparing with the models with three layers. Then, the results obtained can be considered representative of MWCNTs/CFs in a more general way (i.e., systems constituted by several graphene sheets). Both types of structures were generated using the VMD software [35]. In order to investigate the possible impact of parameters such as length and diameter (chirality) on the interface characteristics, several types of TWCNT were modelled. The chirality of the TWCNT is indicated in terms of two numbers, n and m, and is usually given between parenthesis (n, m). In all the models n = m, which means that the carbon nanotube is armchair. The diameter of the nanotube is related to the values of n and m numbers as stated next:
d = 0.0783 ( n + m ) 2 n m   [ Å ]
The carbon fiber (CF) was modeled as a triple armchair graphene sheet as shown in Figure 2. The dimensions of the graphene sheets were 75 Å side and 6.8 Å thickness, and the equilibrium distance between graphene sheets was of 3.4 Å. For the CNT with diameter of 101.7 Å and for the CF, the reinforcements cover the full length of the simulation cell (in the first case in the CNT axis direction and in the second in the two main in-plane directions). Since periodic boundary conditions were employed in all the models, it should be noted that in these two cases these systems represent reinforcements of infinite lengths.
To model covalent bonds between carbon atoms in the same layer of TWCNT or CF, the Tersoff potential [36] was employed. As a bond order potential, the Tersoff potential allows for C–C bond formation or dissociation during the course of a simulation. In addition, the Lennard–Jones 9-6 potential was employed to model the interaction between carbon atoms in different layers, whose formula is shown next:
V ( r ) = ε [ ( σ r ) 9 ( σ r ) 6 ]
where r is the distance between pair of atoms, ε is the depth of the potential well, and σ is the distance at which the potential is zero.
The polymer nanocomposites were generated combining the TWCNT or CF structures with the epoxy resin polymer. All models employed amorphous polymers, that is, with no type of molecule orientation or crystallinity. These models were generated by adding certain number of the constitutive monomers of the epoxy resin, i.e., the epoxy (DGEBA) and hardener (DETA or MeTHPA) molecules, to the cell containing the carbon reinforcement (TWCNT or CF). The stoichiometric proportion of epoxy:hardener was employed according to the chemical cross-linking reactions (5:2 for DGEBA:DETA and 1:2 for DGEBA:MeTHPA). After blending the polymer monomers in the isobaric-isotherm ensemble (NPT) for 0.25 ns, the polymer was cross-linked directly in the presence of the carbon reinforcement. The cross-linking of the epoxy resin was performed using a procedure specifically defined for this study based on other procedures described in the literature [37], and combines several consecutive molecular dynamics simulation steps using LAMMPS [38] and mathematical post-process in between each step. This method is based on the chemical reactions that take place between the constitutive monomers of the epoxy resin. In a basic way, during the simulations with LAMMPS certain atoms (those involved in the chemical reactions of cross-linking) are forced to bond together by the bond/create command. The main parameter that affects this “bonding” is the cut-off distance (Rcut), which is the maximum distance over which atoms are not considered to bond, i.e., atoms below a distance of Rcut are bonded together. Rcut was set to 6.0 Å for intermolecular distances and to 3.5 Å for intramolecular distances. In other steps of the procedure, bonds or atoms are just deleted, using the bond/break or delete_atoms commands in LAMMPS, respectively. Between each of the steps the atoms data are treated to assure that LAMMPS bonds or deletes the correct atoms and/or bonds. At the end of each procedure the charge of atoms was also updated considering the new functional groups and bond structure generated after the cross-linking, and charge increments of atoms as shown in Figure 3 for both types of hardeners. Interface properties were studied in either non cross-linked or cross-linked resin, in which the cross-linking degree was set to 0.68 in all models. Prior to any characterization, all models were subjected to time integration in the NPT ensemble to reach a plateau to obtain a zero-stress structure (which typically needed 0.5 ns). Time steps were selected as 0.5 fs for all MD simulations. A list of the models studied is summarized in Table 1, with a summary of their main characteristics. “Type a” models are referred to as non-cross-linked systems whereas “Type b” to the cross-linked ones.
To study the structure of the interface region, the density of polymer across the filler/resin interaction zone was assessed from each model. Once the models were equilibrated, the position of epoxy atoms was monitored during 50 ps at intervals of 5 ps using the canonical ensemble (NVT) to update the position of atoms. The polymer density profile was obtained from the sampled position of atoms by a binning procedure. An atom was first classified into a bin according to its distance to the center of the carbon nanotube (central axis) or carbon fiber (middle layer). Then, the density of each bin was obtained by dividing the total mass of atoms by the volume of the bin. Finally, these densities were plotted against the distance of the bin to the center of the nanotube (CNT) or the carbon fiber (CF), obtaining the density profile. In the case of CNT composites cylindrical bins were defined around the central axis of the carbon nanotube, whereas in the case of CF composites rectangular cuboids bins were defined from the middle layer of the carbon fiber.

3. Results

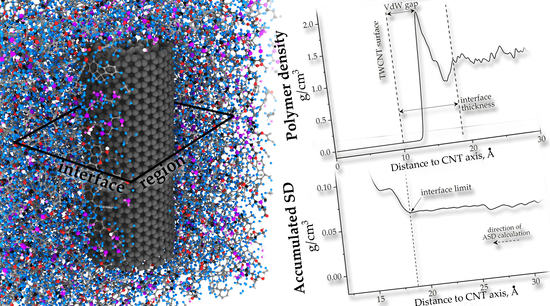
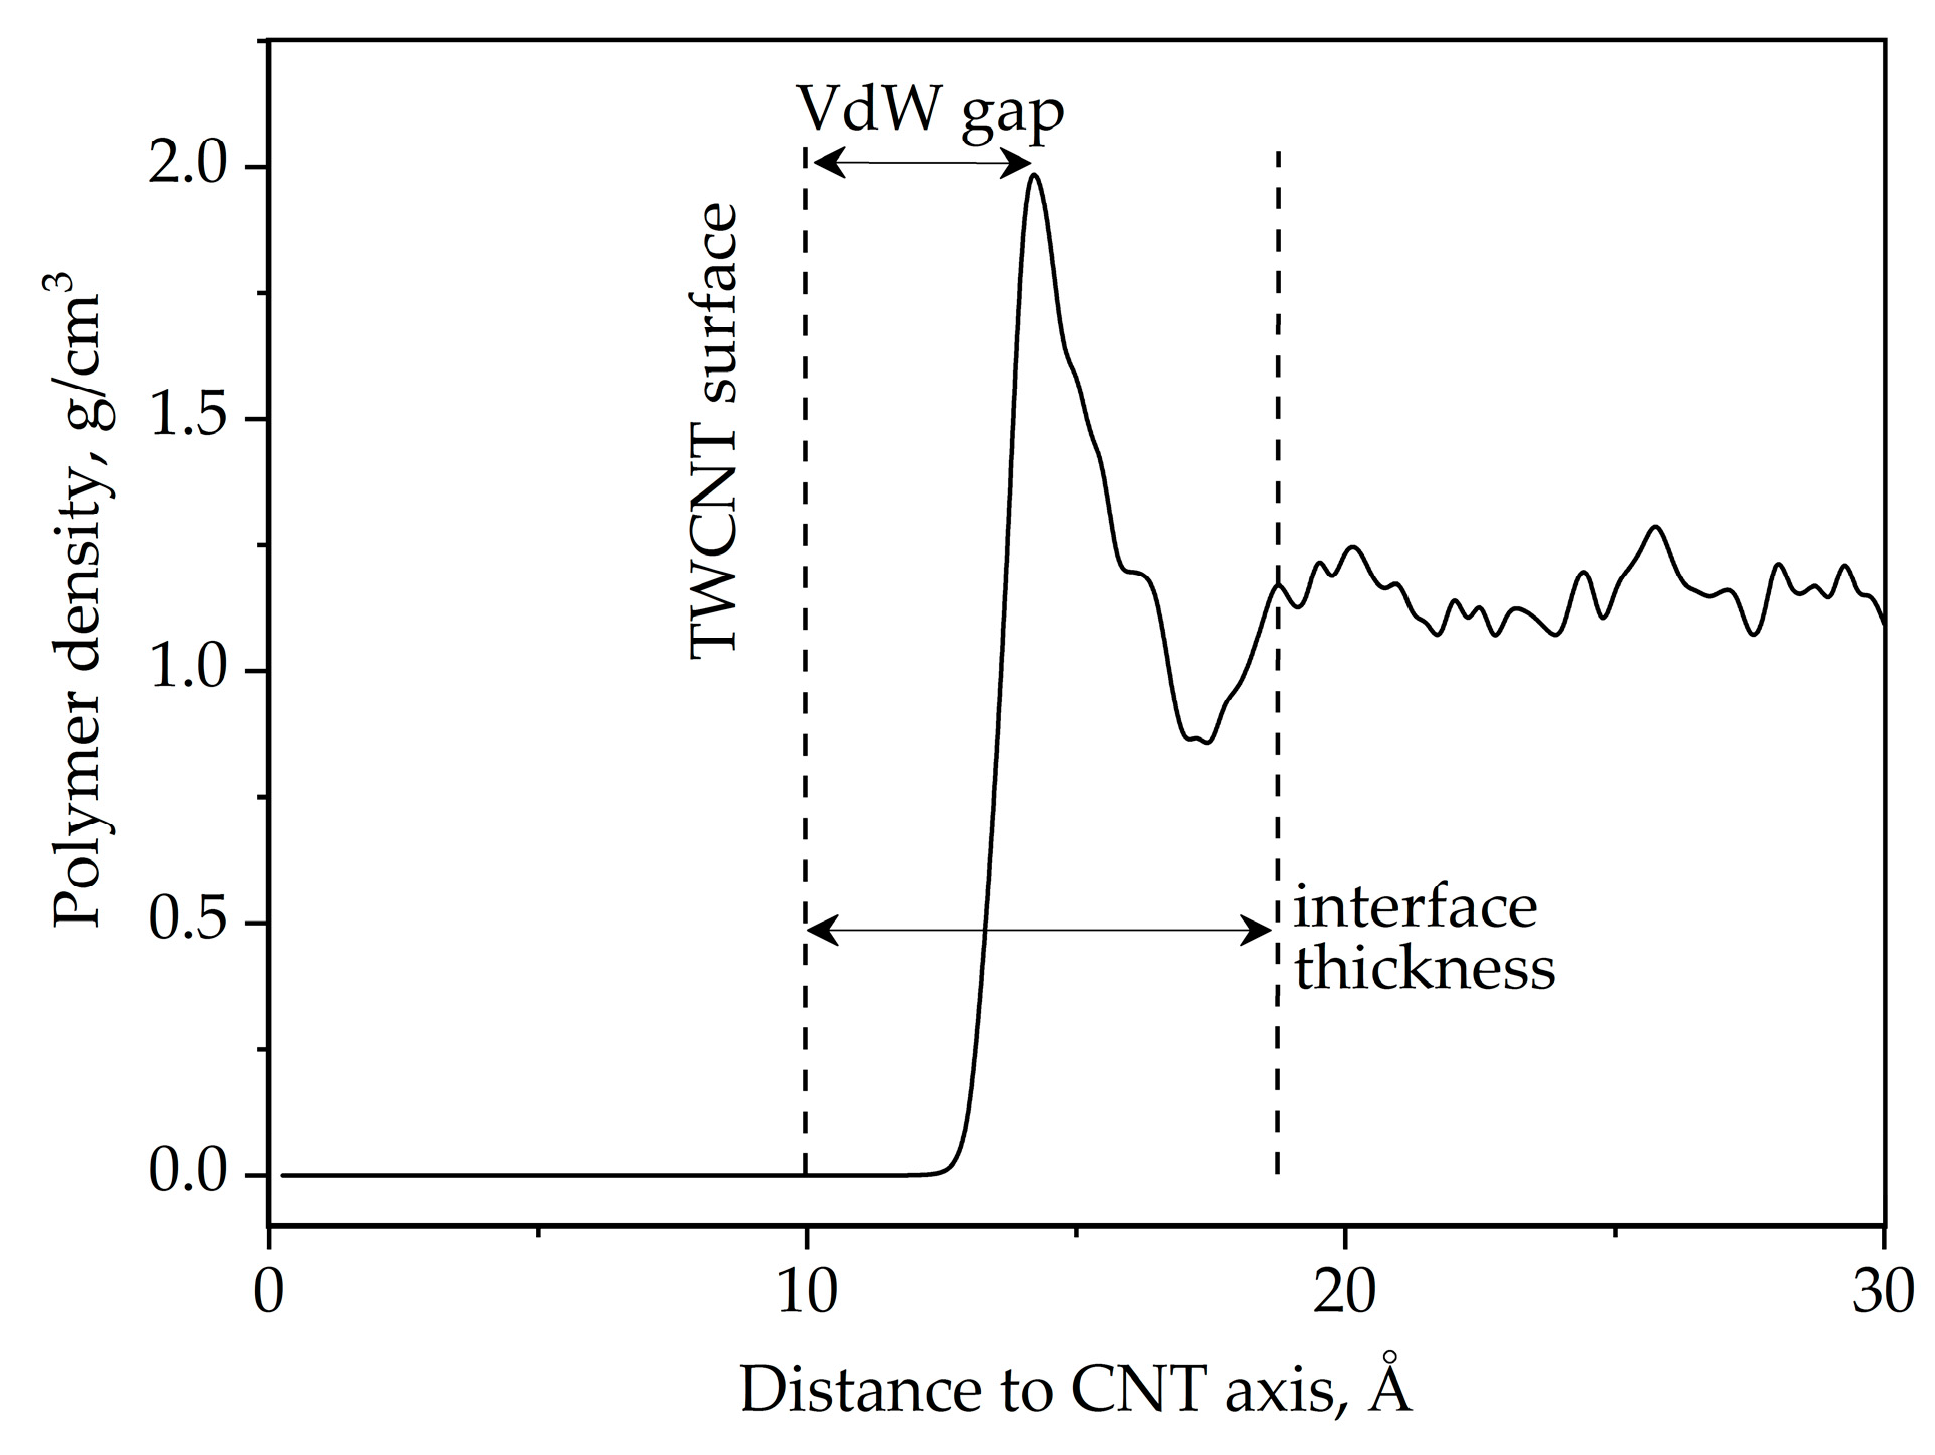
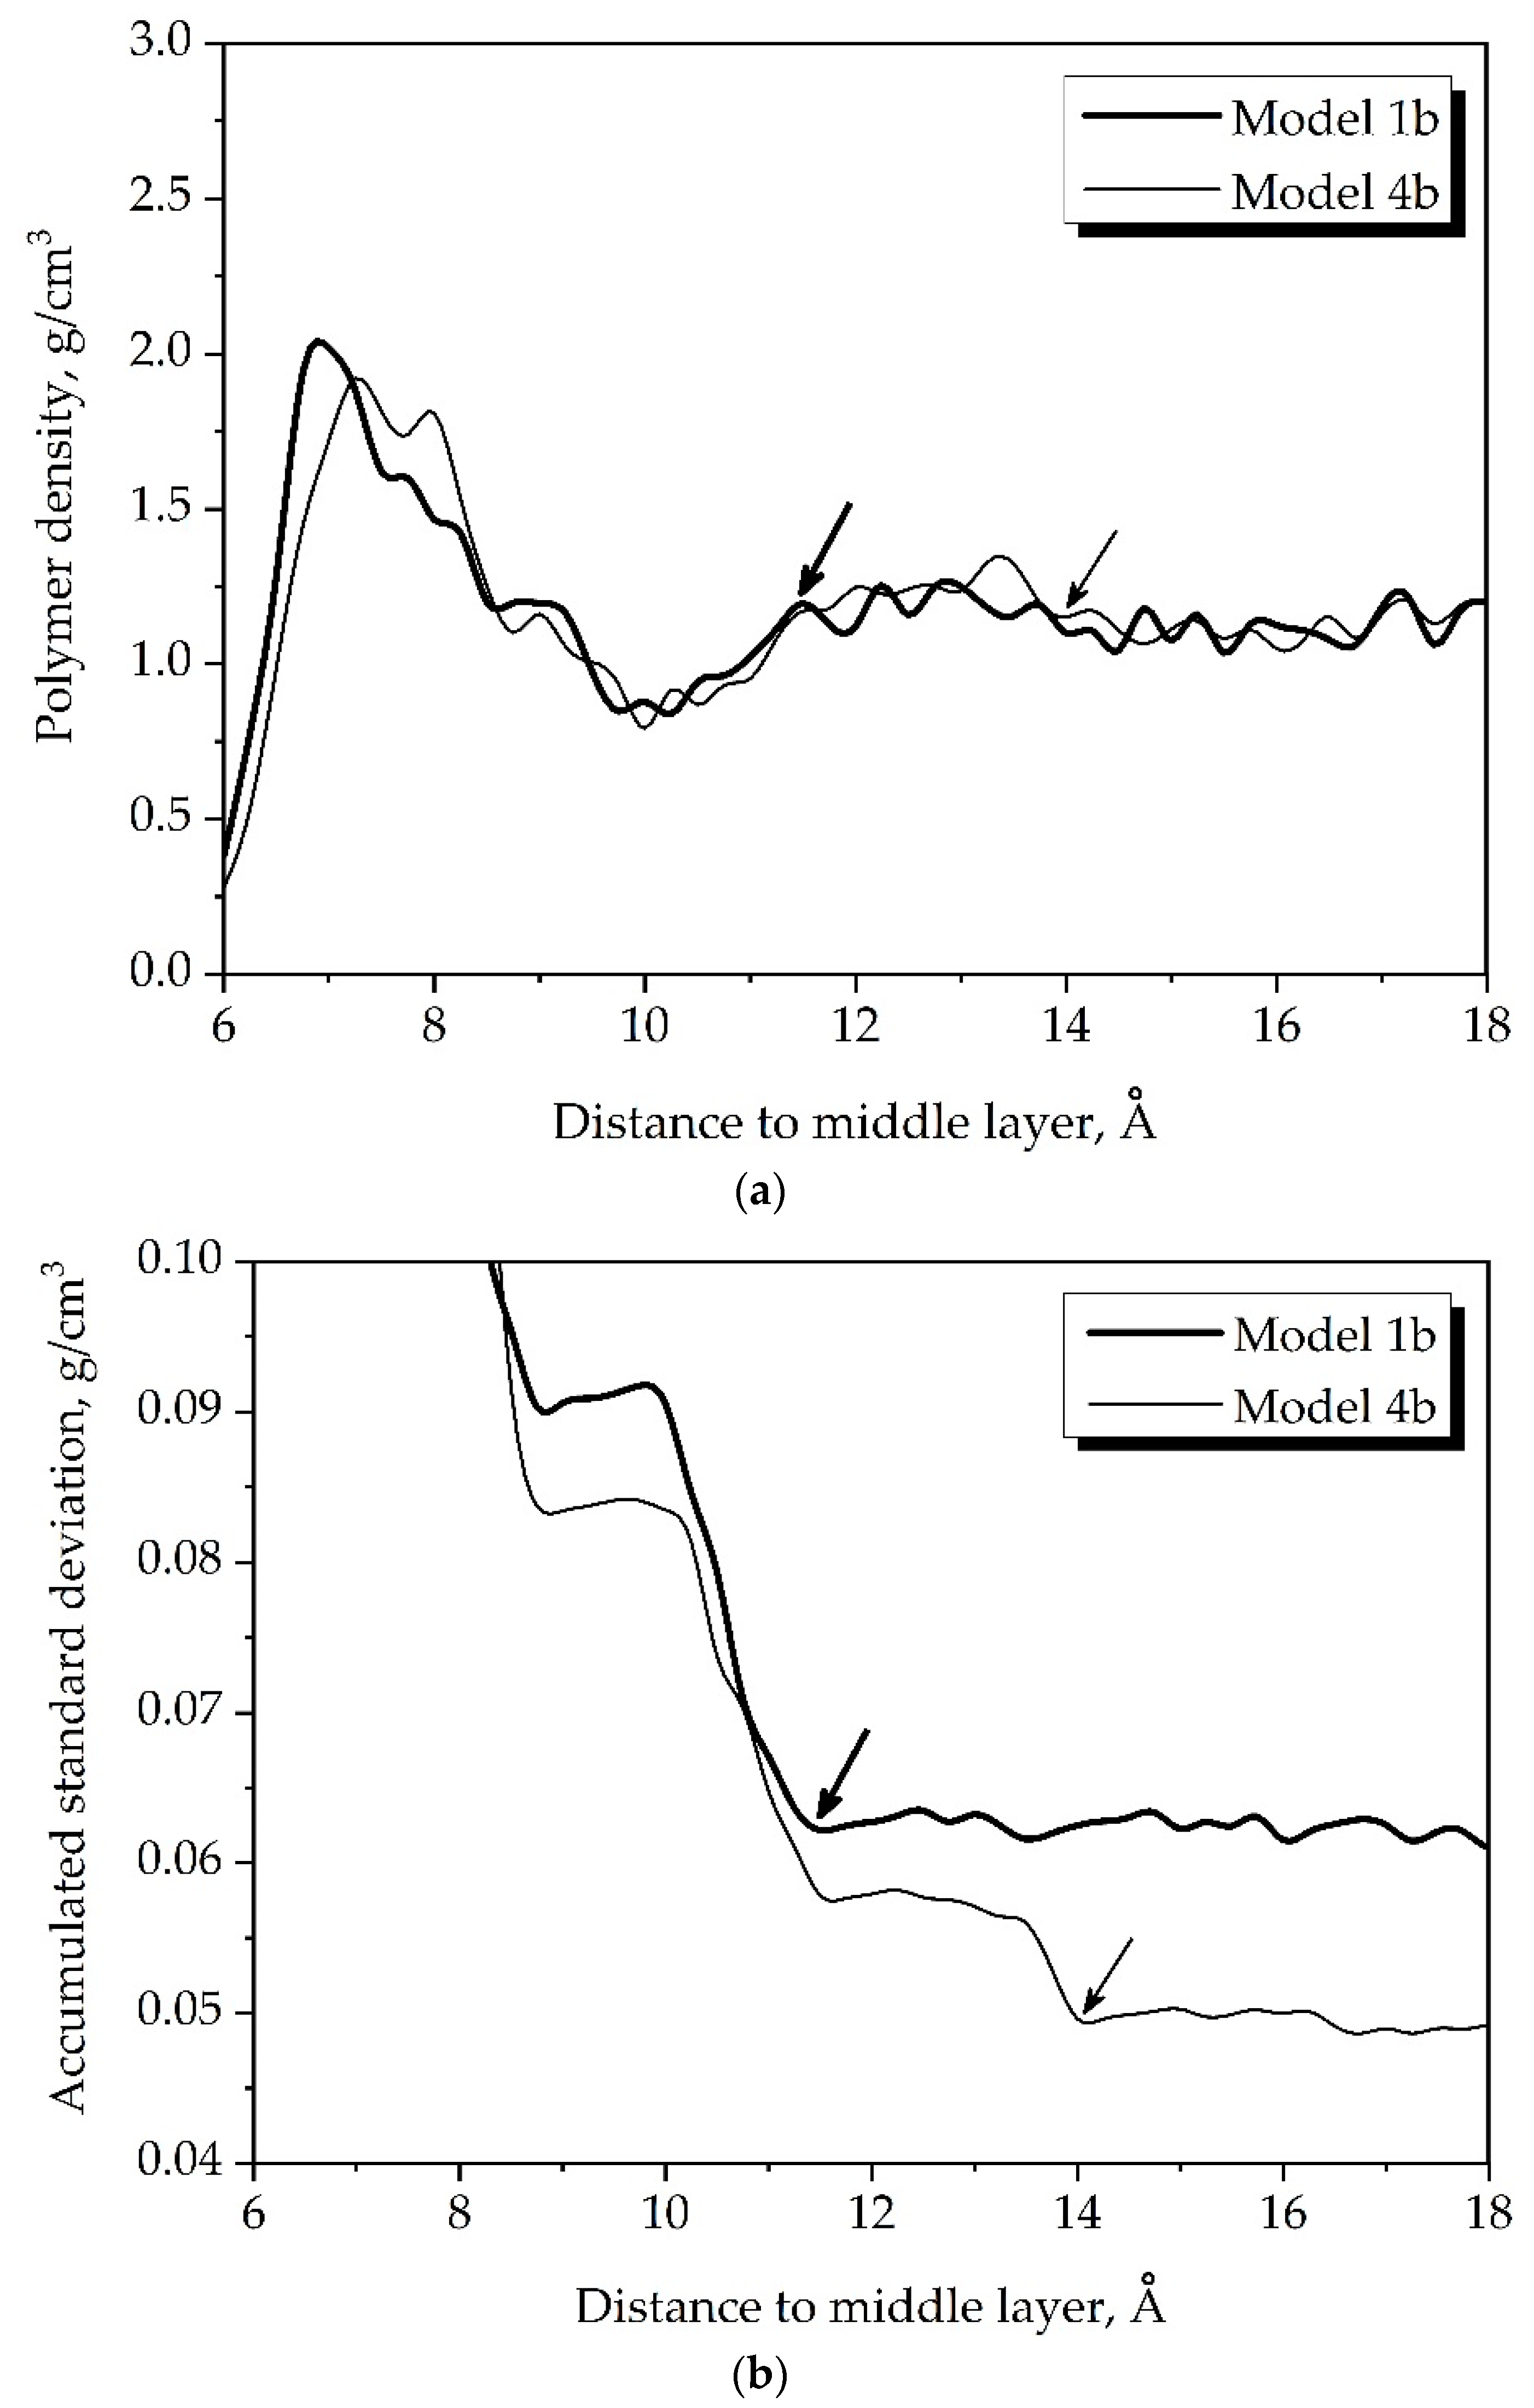
3.1. Interface Structure

In order to get deep insight into the structure of the interface region, the polymer density profiles were assessed from the molecular dynamics simulations. As an example, the polymer density profile for the Model 1b nanocomposite (which contains a (5, 5)(10, 10)(15, 15) TWCNT of 50 Å length) is shown in Figure 4. In this profile the density of polymer (DGEBA-DETA component) is plotted against the distance to the TWCNT axis. At distances below the TWCNT external radius (approximately 10.2 Å), the density is zero since there is no polymer in this region. Immediately over the CNT surface the density remains at zero and at a certain distance over the CNT surface, it increases rapidly and reaches a maximum. The region between the CNT surface and the density peak is usually identified in the literature as the “Van der Waals (VdW) gap” [25], since it is produced by the equilibration of the forces of this name. Beyond the density maximum the polymer density decreases rapidly, reaching then a minimum of density, and later increasing again at higher distances until it has the same density as in the bulk polymer region. In this sense, it should be noted that the bulk polymer densities predicted by the MD models are quite in line with the experimental values reported for this type of resin. A graphic representation of the interface region can be seen in Figure 5, where the so-called “VdW gap” is evident.
It can be considered then that the interface comprises the region from the CNT surface (or CF surface) to the distance where the polymer density vanishes to values of the bulk region. Nevertheless, this criterion is arbitrary and other authors consider alternative ways to define interfaces. For example, Arash et al. [23] considered the interface region only as the van der Waals gap, which in this study is indeed a portion of the interface defined. Taking this fact into account, different conclusions can arise amongst the different studies depending on what is considered as the interface region.
The delimitation of the interface in the polymer side is not clear due to the presence of fluctuations in the polymer density profile which come from the thermal noise in atoms. The best option to define the interface limit in the polymer region is then to consider a statistical approach. At the bulk polymer region, where there is no influence of the carbon nanotube (or fiber), the fluctuations in the polymer density remain stable and the associated standard deviation (SD) takes a certain specific value. Any perturbation on the polymer density, such as the one produced in the interface due to the presence of the CNT (or CF), will produce variations in the value of this deviation. Considering this effect, it is possible to define the limit of the interface region in the bulk polymer in a more mathematical way, calculating the accumulated standard deviation (ASD) profile. The next formula was used in order to calculate the ASD curve:
A S D ( d ) = d h ( ρ d ρ ¯ ) 2 n 1      ;      h > d
where d is a given distance to the CNT axis, h is the highest distance defined in the profile, ρd is the density at distance d, and ρ ¯ the average density in the interval of distances (d, h). In Figure 6 the ASD curve of the polymer density profile for the model 1b is plotted. As can be observed, at high distances the value of ASD remains at a value near 0.06 g/cm3, but at distances below 18.75 Å the ASD starts to increase rapidly due to the influence of the CNT. This distance can be considered as the limit of the interface region, and thus the interface thickness for this composite can be defined at a value of 7.87 Å.

3.2. Effect of Epoxy Resin and CNT Characteristics on Interface Structure

The interface structure for several polymer and CNT/CF composite combinations was studied applying the previous procedure and the interface thicknesses together with other parameters were obtained. A summary of the results is shown in Table 2 and Table 3 for the non-cross-linked and cross-linked systems, respectively. In addition, Figure 7 shows a graphical representation of the results in terms of interface thickness versus diameter for the DGEBA-DETA composites. It should be noted that the precision in the results is dependent on the bin size chosen during the generation of the density profiles. Given that in this study the bin size was fixed at 0.25 Å, the precision of the results could not be lower than this value. Two replicas of the Model 1b were studied and the interface thickness was measured. An average value of 7.87 Å was obtained with an uncertainty of 0.53 Å (approximately twice the bin size value). In other words, results should differ by at least 0.53 Å to be considered significantly different.

3.2.1. Effect of Cross-Linking Degree and Type of Epoxy Resin Hardener

Regarding the polymerization procedure, it was observed that in some of the models the cross-linking had an impact on the interface thickness, depending on the carbon nanotube diameter and even the type of hardener. Considering firstly the DGEBA-DETA models, it was observed that for the lower TWCNT diameter (Models 1 and 2) the cross-linking of the epoxy resin produces a decrease of the interface thickness of about roughly 2.5 Å in both models, whereas for the higher TWCNT diameter (Model 3) or CF composite (Model 4) there is no effect of the cross-linking degree of the resin on the interface thickness (see Figure 7). For the DGEBA-MeTHPA the effect is the opposite; after the cross-linking of the epoxy resin and the interface thickness decreases, although only by 0.75 Å. Ci et al. [39], who studied experimentally the reinforcement role of carbon nanotubes in epoxy composites with different matrix stiffness, observed that the interface interaction was poor due to complete cross-linking. From the results obtained in this study this stiffness matrix effect is observed only for the lower TWCNT diameter in the DGEBA-DETA composites, where a lower interface thickness would indicate in this way a lower influence of the carbon nanotube on the epoxy resin after cross-linking.
The effect of epoxy resin hardener was also analyzed in the CF composites of DGEBA-DETA (model 4) and DGEBA-MeTHPA (model 5). The interface thickness was 10.50 Å in the DGEBA-DETA composite and 9.75 Å in the DGEBA-MeTHPA composite. Although in this study only one replica was performed for the interface thickness calculation, in principle both results could be considered as different if the associated uncertainty is higher than 0.53 Å. However, a more systematic statistical analysis should be performed in order to verify this statement. At this point, it can be said that the type of hardener had an influence on the interface thickness, although it was not possible to establish a “rule of thumb” about the relationship with hardener structure since only two types of hardeners were analyzed.

3.2.2. Effect of CNT Diameter and Length

Finally, the effect of CNT length on interface thickness can be analyzed comparing the results of Model 1 and Model 2 composites, in which a TWCNT of 50 Å or 240 Å lengths were considered respectively. The interface thickness is statistically equivalent in both models, either in the cross-linked and non-cross-linked state (models of types a and b), indicating thus that the CNT length has no influence on the thickness of the interface. In contrast, the CNT diameter has a more significant effect on the interface thickness than the length, although as stated in the previous paragraph, this effect is mainly observed in the cross-linked models (Type b models). In this sense, the system with CF (Model 4b) could be considered as the limit where a CNT has an infinite diameter. Figure 8 shows a comparison of either polymer density profiles or generated accumulated standard profiles (ASD) between the Model 1b (20.3 Å diameter) and Model 4b (infinite diameter) composites. Both composites present similar polymer density profiles (Figure 8a) in the interfacial region and differences are not evident from the direct graphic comparison. The main difference is observed when calculating the interface thickness from the ASD profiles (Figure 8b), where it can be observed that the CF composite presents higher interface thickness than the TWCNT composite (10.50 Å versus 7.87 Å). Thereby, these results would indicate that the higher the diameter the higher the interface thickness. A possible explanation to this diameter effect is represented in Figure 9. In this figure the distances are represented with arrows between a hypothetical point over the CNT surface and the actual surface. As can be observed, these distances are higher in the case of low CNT diameters in comparison with high CNT diameters. This fact would indicate that the influence of the CNT surface would reach higher distances the higher the CNT diameter is, and this would produce consequently a higher interface thickness. In the literature, other authors have also found this effect of diameter on polymer-CNTs interactions. Goclon et al. [40] studied the effect of single walled CNT diameter on the binding of a thermoplastic polyurethane and found that increasing the SWCNT diameter resulted in stronger polymer binding. To verify this effect, this phenomenon could be quantified by studying in detail the Van der Waals interaction energy between the epoxy resin and the CNTs as a function of the curvature—analysis proposed as continuation of the present study.
Together with the interface thickness, other parameters were also measured from the density or ASD profiles. It was observed that the VdW gap thickness remains between 3.50–3.75 Å in all the studied systems and is practically independent of CNT diameter, length, or type of epoxy hardener employed in the composite. In addition, the polymer peak density was also registered from curves but its behavior was erratic and no clear tendency was detected from the presented results with respect to the studied parameters (TWCNT length, diameter, or cross-linking degree).

4. Discussion and Conclusions

In the presented study a method for the characterization of interfaces in polymer nanocomposites was proposed and implemented. The characterization was based on MD models and was demonstrated to be useful to evaluate interface parameters such as thickness, van der Waals gap, and peak density. The method relies on the analysis of the standard deviation associated with the fluctuations in polymer density by calculation of the accumulated standard deviation (ASD) profile, from which a systematic characterization of the interface can be done. The interfacial region was considered as the region comprised from the surface of the carbon nanotube to the distance where the polymer matrix density stabilized, according to the accumulated standard deviation (ASD) profiles. Although this definition of the interface is arbitrary and could be subject of discussion itself, the phenomena observed over this region are remarkable and lead to the following conclusions.
From the analysis of the ASD profiles it was observed that the interface thickness was influenced by parameters affecting the characteristics of either the epoxy resin or the CNT, but in different magnitude and in some cases with overlapping effects between the analyzed parameters. No general rule on the effect of epoxy resin cross-linking degree, type of hardener, CNT diameter, and length on the interface thickness could be established and each case must be analyzed specifically. As the most remarkable conclusion, it was observed that the diameter is the most influential parameter in the interface thickness of DGEBA-DETA cross-linked composites, in which the higher the diameter the higher the interface thickness. However, it has no effect on interface thickness in non-cross-linked composites.
In addition, the type of hardener also has a certain effect on the interface thickness. It should be noted that in the present study the interface region was only analyzed considering geometrical aspects, i.e., basically the interface thickness, and the effect of different parameters on those geometrical characteristics of the interface. An energy analysis of the interface, e.g., in terms of the binding energy between the CNT and the epoxy resin, could give rise to different effects of the considered parameters and then a different vision of the results, as was obtained in the study performed by Zaminpayma et al. [41]. These analyses are intended to be performed in further studies.
Finally, the method proposed was proven to constitute a useful and effective tool for nano-composites interface characterization that can complement other experimental approaches.

Author Contributions

The definition of the models developed and procedures used was carried out by C.S.E., M.L. and A.C.; C.S.E. performed the simulations; F.S. and C.V. collaborated in the post-processing of results. All authors collaborated in the results analysis and in the paper-writing.

Funding

This research was funded by European Union’s Horizon 2020 Research and Innovation Programme MODCOMP grant number 685844.

Acknowledgments

This work partially received funding from the European Union’s Horizon 2020 Research and Innovation Programme MODCOMP under grant agreement No. 685844.

Conflicts of Interest

The authors declare no conflict of interest.

References

  1. Adnan, A.; Sun, C.T.; Mahfuz, H. A molecular dynamics simulation study to investigate the effect of filler size on elastic properties of polymer nanocomposites. Compos. Sci. Technol. 2007, 67, 348–356. [Google Scholar] [CrossRef]
  2. Roy, M.; Nelson, J.K.; MacCrone, R.K.; Schadler, L.S.; Reed, C.W.; Keefe, R. Polymer nanocomposite dielectrics-the role of the interface. IEEE Trans. Dielectr. Electr. Insul. 2005, 12, 629–643. [Google Scholar] [CrossRef]
  3. Roy, M.; Reed, C.W.; MacCrone, R.K.; Schadler, L.S.; Nelson, J.K.; Keefe, R.; Zenger, W. Evidence for the role of the interface in polyolefin nanocomposites. In Proceedings of the 2005 International Symposium on Electrical Insulating Materials, 2005 (ISEIM 2005), Kitakyushu, Japan, 5–9 June 2005; Volume 1, pp. 223–226. [Google Scholar]
  4. Ndoro, T.V.M.; Voyiatzis, E.; Ghanbari, A.; Theodorou, D.N.; Böhm, M.C.; Müller-Plathe, F. Interface of Grafted and Ungrafted Silica Nanoparticles with a Polystyrene Matrix: Atomistic Molecular Dynamics Simulations. Macromolecules 2011, 44, 2316–2327. [Google Scholar] [CrossRef]
  5. Ghanbari, A.; Rahimi, M.; Dehghany, J. Influence of Surface Grafted Polymers on the Polymer Dynamics in a Silica–Polystyrene Nanocomposite: A Coarse-Grained Molecular Dynamics Investigation. J. Phys. Chem. C 2013, 117, 25069–25076. [Google Scholar] [CrossRef]
  6. Ghanbari, A.; Ndoro, T.V.M.; Leroy, F.; Rahimi, M.; Böhm, M.C.; Müller-Plathe, F. Interphase Structure in Silica–Polystyrene Nanocomposites: A Coarse-Grained Molecular Dynamics Study. Macromolecules 2012, 45, 572–584. [Google Scholar] [CrossRef]
  7. Mittal, G.; Dhand, V.; Rhee, K.Y.; Park, S.-J.; Lee, W.R. A review on carbon nanotubes and graphene as fillers in reinforced polymer nanocomposites. J. Ind. Eng. Chem. 2015, 21, 11–25. [Google Scholar] [CrossRef]
  8. Falvo, M.R.; Clary, G.J.; Ii, R.M.T.; Chi, V.; Brooks, F.P., Jr.; Washburn, S.; Superfine, R. Bending and buckling of carbon nanotubes under large strain. Nature 1997, 389, 582–584. [Google Scholar] [CrossRef] [PubMed]
  9. Stoller, M.D.; Park, S.; Zhu, Y.; An, J.; Ruoff, R.S. Graphene-Based Ultracapacitors. Nano Lett. 2008, 8, 3498–3502. [Google Scholar] [CrossRef] [PubMed]
  10. Ebbesen, T.W.; Lezec, H.J.; Hiura, H.; Bennett, J.W.; Ghaemi, H.F.; Thio, T. Electrical conductivity of individual carbon nanotubes. Nature 1996, 382, 54–56. [Google Scholar] [CrossRef]
  11. Balandin, A.A.; Ghosh, S.; Bao, W.; Calizo, I.; Teweldebrhan, D.; Miao, F.; Lau, C.N. Superior Thermal Conductivity of Single-Layer Graphene. Nano Lett. 2008, 8, 902–907. [Google Scholar] [CrossRef] [PubMed]
  12. Lee, C.; Wei, X.; Kysar, J.W.; Hone, J. Measurement of the Elastic Properties and Intrinsic Strength of Monolayer Graphene. Science 2008, 321, 385–388. [Google Scholar] [CrossRef] [PubMed]
  13. Siochi, E.J.; Harrison, J.S. Structural nanocomposites for aerospace applications. Mrs Bull. 2015, 40, 829–835. [Google Scholar] [CrossRef]
  14. AERO—Boeing 787 from the Ground up. Available online: http://www.boeing.com/commercial/aeromagazine/articles/qtr_4_06/article_04_2.html (accessed on 12 March 2018).
  15. Lee, J.H.; Marroquin, J.; Rhee, K.Y.; Park, S.J.; Hui, D. Cryomilling application of graphene to improve material properties of graphene/chitosan nanocomposites. Compos. Part B Eng. 2013, 45, 682–687. [Google Scholar] [CrossRef]
  16. Burger, C.; Hsiao, B.S.; Chu, B. Nanofibrous Materials and Their Applications. Annu. Rev. Mater. Res. 2006, 36, 333–368. [Google Scholar] [CrossRef]
  17. Liu, L.; Jia, C.; He, J.; Zhao, F.; Fan, D.; Xing, L.; Wang, M.; Wang, F.; Jiang, Z.; Huang, Y. Interfacial characterization, control and modification of carbon fiber reinforced polymer composites. Compos. Sci. Technol. 2015, 121, 56–72. [Google Scholar] [CrossRef]
  18. Eshelby, J. The Determination of the Elastic Field of an Ellipsoidal Inclusion, and Related Problems. Proc. R. Soc. Lond. Ser. A Math. Phys. Sci. 1957, 241, 376–396. [Google Scholar] [CrossRef]
  19. Mori, T.; Tanaka, K. Average stress in matrix and average elastic energy of materials with misfitting inclusions. Acta Metall. 1973, 21, 571–574. [Google Scholar] [CrossRef]
  20. Halpin, J.C.; Kardos, J.L. The Halpin-Tsai equations: a review. Polym. Eng. Sci. 1976, 16, 344–352. [Google Scholar]
  21. Benveniste, Y. A new approach to the application of Mori-Tanaka’s theory in composite materials. Mech. Mater. 1987, 6, 147–157. [Google Scholar] [CrossRef]
  22. Duan, H.L.; Wang, J.; Huang, Z.P.; Karihaloo, B.L. Eshelby formalism for nano-inhomogeneities. Proc. R. Soc. Math. Phys. Eng. Sci. 2005, 461, 3335–3353. [Google Scholar] [CrossRef]
  23. Arash, B.; Wang, Q.; Varadan, V.K. Mechanical properties of carbon nanotube/polymer composites. Sci. Rep. 2014, 4. [Google Scholar] [CrossRef] [PubMed]
  24. Odegard, G.M.; Clancy, T.C.; Gates, T.S. Modeling of the mechanical properties of nanoparticle/polymer composites. Polymer 2005, 46, 553–562. [Google Scholar] [CrossRef] [Green Version]
  25. Herasati, S.; Zhang, L.C.; Ruan, H.H. A new method for characterizing the interphase regions of carbon nanotube composites. Int. J. Solids Struct. 2014, 51, 1781–1791. [Google Scholar] [CrossRef]
  26. Ferdous, S.F.; Sarker, M.F.; Adnan, A. Role of nanoparticle dispersion and filler-matrix interface on the matrix dominated failure of rigid C60-PE nanocomposites: A molecular dynamics simulation study. Polymer 2013, 54, 2565–2576. [Google Scholar] [CrossRef]
  27. Stamm, M. Polymer surface and interface characterization techniques. In Polymer Surfaces and Interfaces; Springer: Bazel, Swuitzerland, 2008; pp. 1–16. [Google Scholar]
  28. Zeng, Q.H.; Yu, A.B.; Lu, G.Q. Multiscale modeling and simulation of polymer nanocomposites. Prog. Polym. Sci. 2008, 33, 191–269. [Google Scholar] [CrossRef]
  29. Gou, J.; Minaie, B.; Wang, B.; Liang, Z.; Zhang, C. Computational and experimental study of interfacial bonding of single-walled nanotube reinforced composites. Comput. Mater. Sci. 2004, 31, 225–236. [Google Scholar] [CrossRef]
  30. Liu, A.; Wang, K.W.; Bakis, C.E. Effect of functionalization of single-wall carbon nanotubes (SWNTs) on the damping characteristics of SWNT-based epoxy composites via multiscale analysis. Compos. Part Appl. Sci. Manuf. 2011, 42, 1748–1755. [Google Scholar] [CrossRef]
  31. Smith, J.S.; Borodin, O.; Smith, G.D.; Kober, E.M. A molecular dynamics simulation and quantum chemistry study of poly(dimethylsiloxane)–silica nanoparticle interactions. J. Polym. Sci. Part B Polym. Phys. 2007, 45, 1599–1615. [Google Scholar] [CrossRef]
  32. Eslami, H.; Rahimi, M.; Müller-Plathe, F. Molecular Dynamics Simulation of a Silica Nanoparticle in Oligomeric Poly(methyl methacrylate): A Model System for Studying the Interphase Thickness in a Polymer–Nanocomposite via Different Properties. Macromolecules 2013, 46, 8680–8692. [Google Scholar] [CrossRef]
  33. Tsafack, T.; Alred, J.M.; Wise, K.E.; Jensen, B.; Siochi, E.; Yakobson, B.I. Exploring the interface between single-walled carbon nanotubes and epoxy resin. Carbon 2016, 105, 600–606. [Google Scholar] [CrossRef]
  34. Sun, H. COMPASS: An ab initio force-field optimized for condensed-phase applications—Overview with details on alkane and benzene compounds. J. Phys. Chem. B 1998, 102, 7338–7364. [Google Scholar] [CrossRef]
  35. Humphrey, W.; Dalke, A.; Schulten, K. VMD: Visual molecular dynamics. J. Mol. Graph. 1996, 14, 33–38. [Google Scholar] [CrossRef]
  36. Tersoff, J. Modeling solid-state chemistry: Interatomic potentials for multicomponent systems. Phys. Rev. B Condens. Matter 1989, 39, 5566–5568. [Google Scholar] [CrossRef] [PubMed]
  37. Yarovsky, I.; Evans, E. Computer simulation of structure and properties of crosslinked polymers: application to epoxy resins. Polymer 2002, 43, 963–969. [Google Scholar] [CrossRef]
  38. Plimpton, S. Fast Parallel Algorithms for Short-Range Molecular Dynamics. J. Comput. Phys. 1995, 117, 1–19. [Google Scholar] [CrossRef] [Green Version]
  39. Ci, L.; Bai, J. The reinforcement role of carbon nanotubes in epoxy composites with different matrix stiffness. Compos. Sci. Technol. 2006, 66, 599–603. [Google Scholar] [CrossRef]
  40. Goclon, J.; Panczyk, T.; Winkler, K. Investigation of the interfacial properties of polyurethane/carbon nanotube hybrid composites: A molecular dynamics study. Appl. Surf. Sci. 2018, 433, 213–221. [Google Scholar] [CrossRef]
  41. Zaminpayma, E.; Mirabbaszadeh, K. Interaction between single-walled carbon nanotubes and polymers: A molecular dynamics simulation study with reactive force field. Comput. Mater. Sci. 2012, 58, 7–11. [Google Scholar] [CrossRef]
Figure 1. Structure and partial atomic charges of epoxy resin monomers: (a) epoxy molecule (DGEBA); (b) hardeners (DETA and MeTHPA).
Fibers 06 00054 g001
Figure 2. Structure and characteristics of modeled carbon reinforcements (triple walled carbon nanotubes (TWCNT) and carbon fibers (CF)).
Fibers 06 00054 g002
Figure 3. Charge update (increments) for atoms after the cross-linking process with: (a) polyamine hardeners (DETA); (b) anhydride hardeners (MeTHPA).
Fibers 06 00054 g003
Figure 4. Description of polymer density profile (obtained from Model 1b). VdW = Van der Waals gap.
Fibers 06 00054 g004
Figure 5. Detail of the interface region in TWCNT nanocomposite (obtained from Model 1b).
Fibers 06 00054 g005
Figure 6. Example of the accumulated standard deviation (ASD) curve calculated from the polymer density profile (obtained from model 1b).
Fibers 06 00054 g006
Figure 7. Representation of interface thickness versus TWCNT diameter for the DGEBA-DETA composites.
Fibers 06 00054 g007
Figure 8. Comparison of (a) polymer density profiles and (b) accumulated standard deviation (ASD) curves between Model 1b (20.3 Å diameter) and Model 4b (CF or “infinite diameter”). The interface limit is indicated by arrows.
Fibers 06 00054 g008
Figure 9. Possible effect of diameter on interface thickness: (a) Low CNT diameter; (b) high CNT diameter.
Fibers 06 00054 g009
Table 1. Summary and features of the molecular models studied.
ID of Model 1Resin 2FillerChirality of FillerFiller Diameter, ÅFiller Length, ÅWeight Fraction of Filler, %
1a/bDGEBA/DETATWCNT(5, 5) 320.3509.02
2a/bDGEBA/DETATWCNT(5, 5) 320.324020.57
3a/bDGEBA/DETATWCNT(65, 65) 3101.78044.85
4a/bDGEBA/DETACFArmchairn.a.78 × 7823.14
5a/bDGEBA/MeTHPACFArmchairn.a.78 × 7822.50
1 Type of models: a → non cross-linked; b → cross-linked; 2 Diglycidyl ether of bisphenol-A (DGEBA), diethylene triamine (DETA) and methyl tetrahydrophthalic acid (MeTHPA); 3 Refers only to the inner TWCNT layer: (5, 5) → (5, 5) (10, 10) (15, 15); (65, 65) → (65, 65) (70, 70) (75, 75).
Table 2. Structural characterization of interface region in non-cross-linked epoxy resin nanocomposites.
Non-Cross-Linked SystemsInterface Thickness, ÅVdW Gap Thickness, ÅPeak Density, g/cm3
ID of ModelEpoxy ResinReinforcement
TypeChiralityLength, ÅDiameter, Å
1aDGEBA-DETATWCNT(5, 5)5020.310.003.502.305
2aDGEBA-DETATWCNT(5, 5)24020.39.753.752.101
3aDGEBA-DETATWCNT(65, 65)80101.79.003.251.878
4aDGEBA-DETACFarmchair78 × 78n.a.10.003.752.127
5aDGEBA-MeTHPACFarmchair78 × 78n.a.10.504.001.881
Table 3. Structural characterization of interface region in cross-linked epoxy resin nanocomposites.
Cross-Linked SystemsInterface Thickness, ÅVdW Gap Thickness, ÅPeak Density, g/cm3
ID of ModelEpoxy ResinReinforcement
TypeChiralityLength, ÅDiameter, Å
1bDGEBA-DETATWCNT(5, 5)5020.37.87 13.752.008 2
2bDGEBA-DETATWCNT(5, 5)24020.37.503.502.248
3bDGEBA-DETATWCNT(65, 65)80101.710.003.502.172
4bDGEBA-DETACFarmchair78 × 78n.a.10.503.751.921
5bDGEBA-MeTHPACFarmchair78 × 78n.a.9.753.751.853
1 Average between two replicas (8.25 and 7.50 Å), indicating SD of ±0.53 Å; 2 Average between two replicas (2.018 and 1.999 g/cm3), indicating SD of ± 0.013 g/cm3.

