3.1. The Influence of Drawing on Mechanical Properties of PLLA Tapes
It is expected that mechanical properties will improve with increasing
DR because of increasing strain-induced crystallization and orientation.
Figure 2a shows typical stress-strain curves of the PLLA tape prepared at 90 °C upon different draw ratios. For drawn PLLA tapes, strain hardening is observed after yielding. This slope of the strain hardening is strongly related to the
DR. Upon drawing four times, the slope of the strain hardening modulus actually jumps. The higher the
DR, the greater the strain hardening of the tapes. This can be explained by the strain-induced crystallization and orientation. This strain-hardening behaviour is advantageous to industrial thermoforming processes because it assists in the production of higher quality films with uniform thickness [
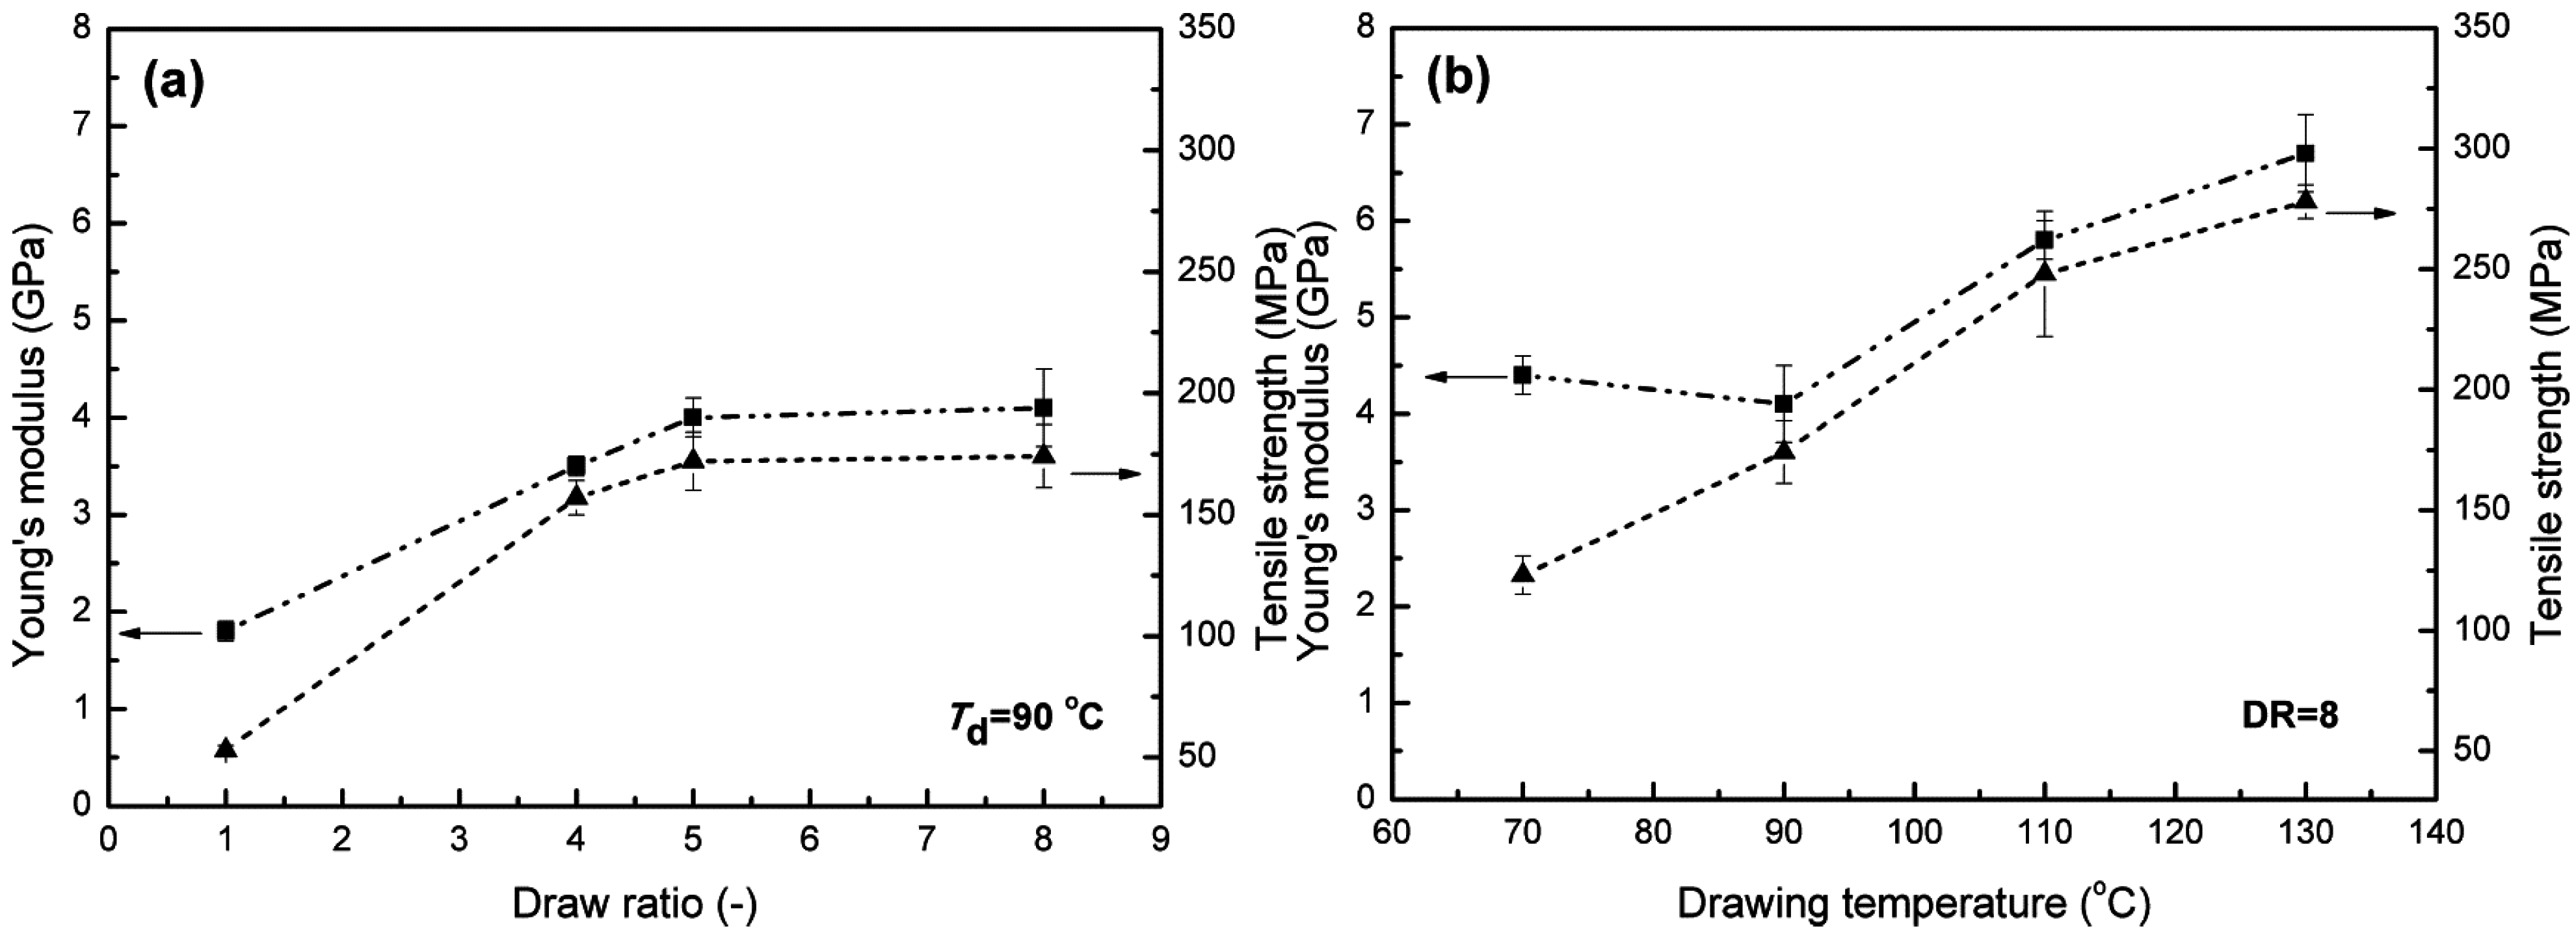
14]. As expected, drawing has a positive effect on the Young’s modulus and tensile strength of the tapes. As shown in
Figure 3a, compared to as-extruded PLLA tape (1.8 GPa in modulus and 53 MPa in tensile strength), a 128% and 227% increase in Young’s modulus and tensile strength were achieved for oriented tapes of
DR = 8 drawn at 90 °C (4.1 GPa in modulus and 174 MPa in tensile strength), respectively.
Figure 2.
Stress-strain curves of poly(l-lactic acid) (PLLA) tapes subjected to (a) various draw ratios (Td = 90 °C); and (b) different drawing temperatures (DR = 8).
Figure 2.
Stress-strain curves of poly(l-lactic acid) (PLLA) tapes subjected to (a) various draw ratios (Td = 90 °C); and (b) different drawing temperatures (DR = 8).
The experimental results displayed in
Figure 2b and
Figure 3b show a significant effect of drawing temperature (
Td) on the mechanical properties of PLLA tapes drawn in the range of 70–130 °C. This dramatic influence has also been reported for polypropylene (PP) tapes [
15]. The general tendency is that both Young’s modulus and tensile strength of the post drawn tapes increases with
Td. The highest values of Young’s modulus and tensile strength achieved are 6.7 GPa and 280 MPa, respectively, at a drawing temperature of 130 °C. Compared to as-extruded PLLA, a 3.7 and 5.2 times increase in Young’s modulus and tensile strength is achieved.
Figure 3.
Young’s modulus and tensile strength as a function of (a) draw ratio and (b) drawing temperature in the specimen.
Figure 3.
Young’s modulus and tensile strength as a function of (a) draw ratio and (b) drawing temperature in the specimen.
Interestingly, compared to the brittle behaviour of as-extruded PLLA films, a much more ductile behaviour is observed for the drawn tapes (see
Table 4). At
Td = 90 °C, the elongation to break and toughness first significantly increases at
DR = 4 then slightly decreases when
DR > 4. At a fixed
DR = 8, both elongation to break and toughness increase with
Td. Compared to as-extruded PLLA, the elongation to break and toughness is increased by 220% and almost 1200% for tapes drawn at 130 °C. A possible reason for this improvement is that in these oriented tapes, growing cracks are arrested by the anisotropic microstructure; therefore, catastrophic failure is postponed [
16]. However, another reason is probably related to the intrinsic deformation behaviour of PLA. Govaert and co-workers [
17] showed that PLA exhibits a very strong post-yield softening behaviour together with virtually no strain hardening, the combination of both leading to strong localization of deformation and brittle fracture [
18,
19]. Mechanical pre-deformation as a result of drawing will lead to an increase in strain hardening due to orientation of crystalline material, which will alter the subtle interplay between strain softening and strain hardening. This will affect localisation of deformation, with an increase in strain hardening leading to less localization, more stable neck formation, and an increase in strain at break.
Table 4.
Tensile properties of various PLLA tapes.
Table 4.
Tensile properties of various PLLA tapes.
| Td (°C) | DR | Young’s Modulus (GPa) | Tensile Strength (MPa) | Strain at Break (%) | Toughness * (J·m−3) |
|---|
| Extruded | 1 | 1.8 ± 0.1 | 53 ± 2 | 12 ± 2 | 5.9 × 10⁶ |
| 90 | 4 | 3.5 ± 0.1 | 157 ± 7 | 66 ± 9 | 8.3 × 10⁷ |
| 90 | 5 | 4.0 ± 0.2 | 172 ± 12 | 42 ± 6 | 5.9 × 10⁷ |
| 90 | 8 | 4.1 ± 0.4 | 174 ± 13 | 29 ± 3 | 3.8 × 10⁷ |
| 110 | 8 | 5.8 ± 0.2 | 248 ± 26 | 33 ± 3 | 6.3 × 10⁷ |
| 130 | 8 | 6.7 ± 0.4 | 278 ± 7 | 38 ± 3 | 7.5 × 10⁷ |
The maximum tensile modulus achieved in this work for tapes (6.7 GPa) compares well to the moduli previously reported for melt-spun drawn PLLA fibres, but are well below those of melt-spun polyethylene (PE), polypropylene (PP), and poly(ethylene terephthalate) (PET) with moduli ranging from 15 to 70 GPa [
20]. The reason for this is the low intrinsic modulus of a PLLA crystal. Nishino
et al. reported the theoretical crystal moduli for a range of polymers as derived from X-ray diffraction studies. The maximum achievable moduli of PE, PP and, PET along the chain axis are 235 GPa, 40 GPa and 108 GPa, respectively, while the maximum modulus for PLLA is only 12 GPa [
21,
22].
3.2. The Influence of Drawing on Thermal Properties of PLLA Tapes
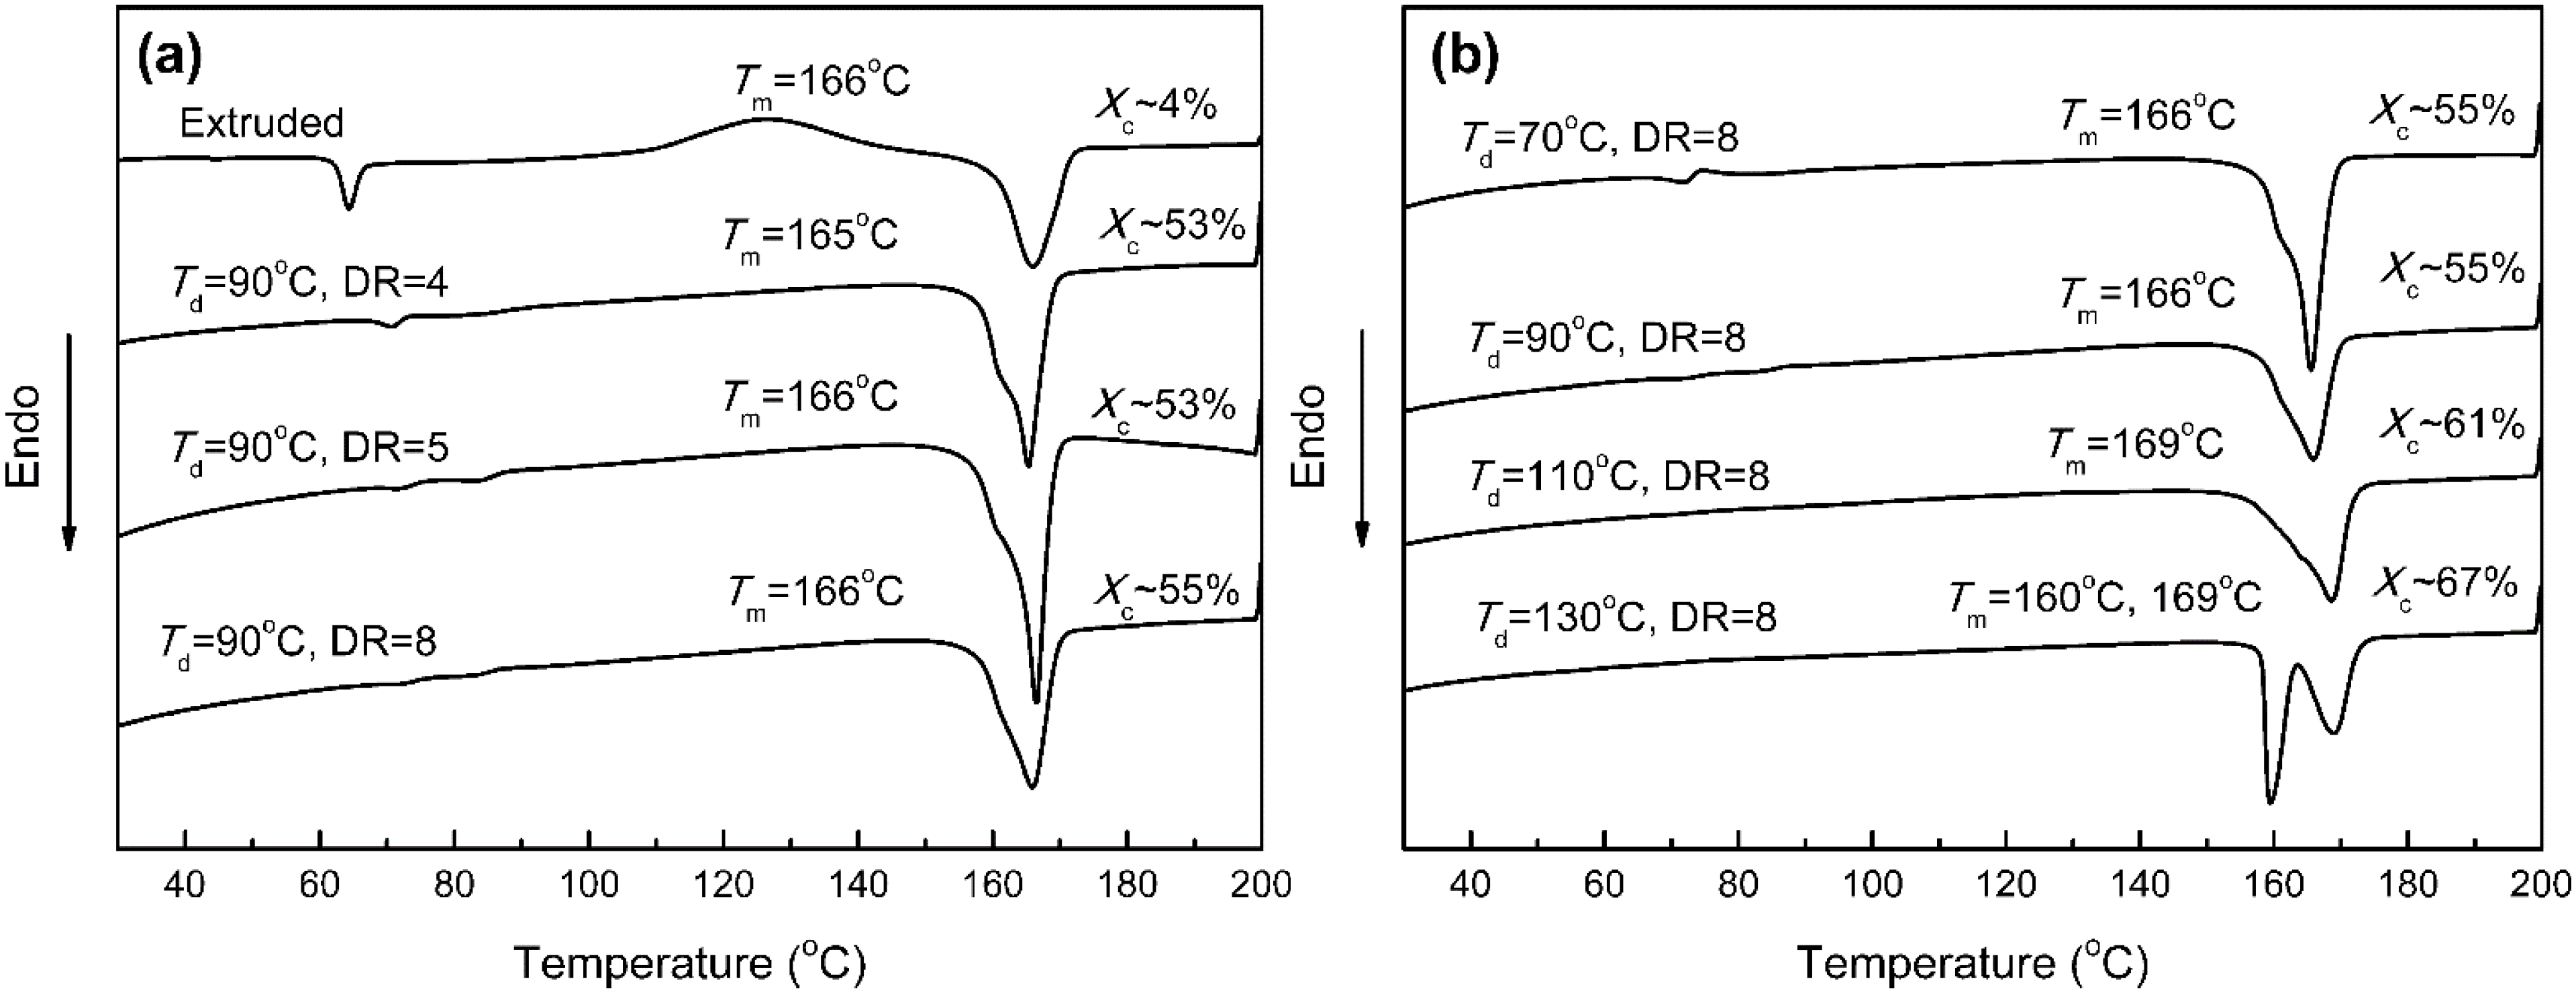
DSC was performed to find the development in crystallinity after drawing. As seen in
Figure 4a, the as-extruded tapes were almost amorphous (4% crystallinity). The melting peaks observed are related to the crystallization developed during the DSC scan. It should be noted that for as-extruded tapes, a glass transition with an enthalpy relaxation rather than a typical step change is observed. For samples that have been stored for a long time below the
Tg, the first heating curve often exhibits an endothermic relaxation peak rather than a step change. This peak can no longer be observed in the cooling curve. Preparing amorphous film is very important, because a too high initial crystallinity will reduce the maximum attainable draw ratio and consequently lower the final tape’s mechanical properties. In agreement, Hyon and co-workers [
23] started from as-spun fibres with crystallinity not greater than 5%, to draw them six times.
Figure 4.
Differential scanning calorimetry (DSC) thermograms of (a) samples drawn at 90 °C with various draw ratios; and (b) samples drawn at different temperatures with a draw ratio of 8.
Figure 4.
Differential scanning calorimetry (DSC) thermograms of (a) samples drawn at 90 °C with various draw ratios; and (b) samples drawn at different temperatures with a draw ratio of 8.
For tapes drawn at 90 °C, the crystallinity increased dramatically to 53% and then reached a plateau at DR = 4. The Tg and cold crystallization peaks were not detected in the DSC thermograms of drawn tapes. The melting peaks of all the samples appeared at 166 °C.
Furthermore, it is clear that increasing the drawing temperature results in a higher degree of crystallinity. The value for tapes drawn at 70 °C is 55% and rises to 67% for tapes drawn at 130 °C. Two different melting peaks can be distinguished for tapes drawn at 130 °C, at about 160 and 169 °C, respectively. The observed secondary peaks at lower temperatures are most likely due to varying lamellae thicknesses being present in the respective tapes.
Since the mechanical properties of polymers are dependent on intermolecular interactions, the performance of polymers depends on the applied strain rate and temperature of loading. The typical DMA plots, displaying the storage modulus (
E′) and tan δ (
E″/
E′) as a function of temperature, are shown in
Figure 5. The mechanical glass transition is taken as the temperature of the maximum in tan δ. As seen in
Figure 5a, all tapes show a similarly shaped curve. Below
Tg,
E′ does not change much with temperature because the amorphous molecules are still essentially glassy. As soon as
Tg is approached, however, the polymer chains in the amorphous phase become mobile, resulting in a reduced stiffness.
Figure 5.
(a) Storage modulus and (b) loss factor against temperature for a range of PLLA tapes with increasing draw ratio; (c) storage modulus vs. draw ratio for a range of PLLA tapes with increasing test temperature.
Figure 5.
(a) Storage modulus and (b) loss factor against temperature for a range of PLLA tapes with increasing draw ratio; (c) storage modulus vs. draw ratio for a range of PLLA tapes with increasing test temperature.
Figure 5b shows how solid-state drawing influenced the tan δ peak position of PLLA. As we can see, the tan δ peak is shifted to higher temperatures with increased draw ratio. The peak position for PLLA was at 70.0 °C and increased to 92.2 °C for drawn tapes with
DR = 8. It was reported earlier that
Tg is influenced by the degree of crystallinity in PLLA [
24]. Moreover, it was reported that orientation leads to a lower entropy in tapes, thus resulting in a higher
Tm [
25]. Similarly, upon heating, the highly ordered oriented PLLA chains in the amorphous phase will try to re-establish their preferential isotropic state. However, chains in constrained tapes have less mobility and as a result a higher
Tg. Therefore, this positive shift in tan δ peak position can be attributed to strain-induced crystallization and a constrained oriented amorphous phase. Additionally, the intensity of the tanδ peak decreased with draw ratio compared to as-extruded tapes. This indicates that fewer polymer chains are participating in this transition. It should be noted that the
Tg values obtained from DMA are typically higher than those from DSC. This is because the oriented tapes studied with DSC are unconstrained and can relax before reaching
Tg. Sub-
Tg relaxation is inhibited for the DMA experiment because the oriented tapes are always slightly stressed. The confinement of the pre-straining prevents, or at least slows down, relaxation [
25].
Moreover,
E′ increases with draw ratio within the temperature range studied. As seen in
Figure 5c, below
Tg (70–92 °C), there is no significant change in
E′ for all tapes when increasing the test temperature from −10 °C to 25 °C. At 80 °C, drawn tapes with
DR = 4 possess a low storage modulus of approximately 1.3 GPa, which indicates that the tapes have totally relaxed. The higher stretched tapes with
DR = 5 and 8, retain a higher modulus at elevated temperatures, possessing storage moduli of 2.8 GPa and 3.0 GPa respectively at 80 °C. These values shows that these tapes still possess a greater storage modulus at 80 °C than undrawn PLLA possesses at room temperature (2 GPa).
3.3. Structure Development in PLLA Tapes during Solid-State Drawing
It was shown that depending on the drawing conditions, PLLA is able to crystallize into different forms. When an amorphous film was drawn by a tensile force slightly above the
Tg (60 °C), an oriented film with α crystals was obtained. When a semi-crystalline sample with α crystals was drawn, part of the α crystals are transformed into oriented β crystals, depending on the drawing conditions [
26]. Eling
et al. [
9] reported that β crystals were generated upon tensile drawing at a high temperature to a higher draw ratio, whereas drawing at a low temperature and/or low draw ratio produced α crystals. Thus, the drawn products of PLLA commonly consist of β crystals or a mixture of β and α crystal. Leenslag
et al. [
8] and Hoogsteen
et al. [
27] prepared high-strength PLLA fibres that consisted of pure β-form crystals by hot drawing of solution-spun fibres at 200–204 °C,
viz. 20–25 °C above
Tm of an α crystal, to a draw ratios of 14–20. They found that the formation of β crystals depended on the sample molecular weight and molecular weight distribution in addition to the drawing temperature and draw ratio.
It is very difficult to distinguish β reflections in WAXD pattern due to the overlap with α reflections. Since only long sequences of the 3
1 helix contribute to the X-ray (003)
β reflection and shorter ones do not contribute to the intensity of this reflection, whereas the IR band of 912 cm
−1 is active to the 3
1 helix independent of the sequence lengths. Thus, IR spectroscopy is more sensitive to detect a small amount of β crystals within a sample [
28]. Therefore, the crystal transformation upon drawing was also characterized by IR spectroscopy. Cohn
et al. [
29] reported an absorption band at 921 cm
−1 characteristic of α crystal. On the other hand, β crystals exhibit an absorption band at 912 cm
−1, which is assigned to the CH
3 rocking mode of β crystals.
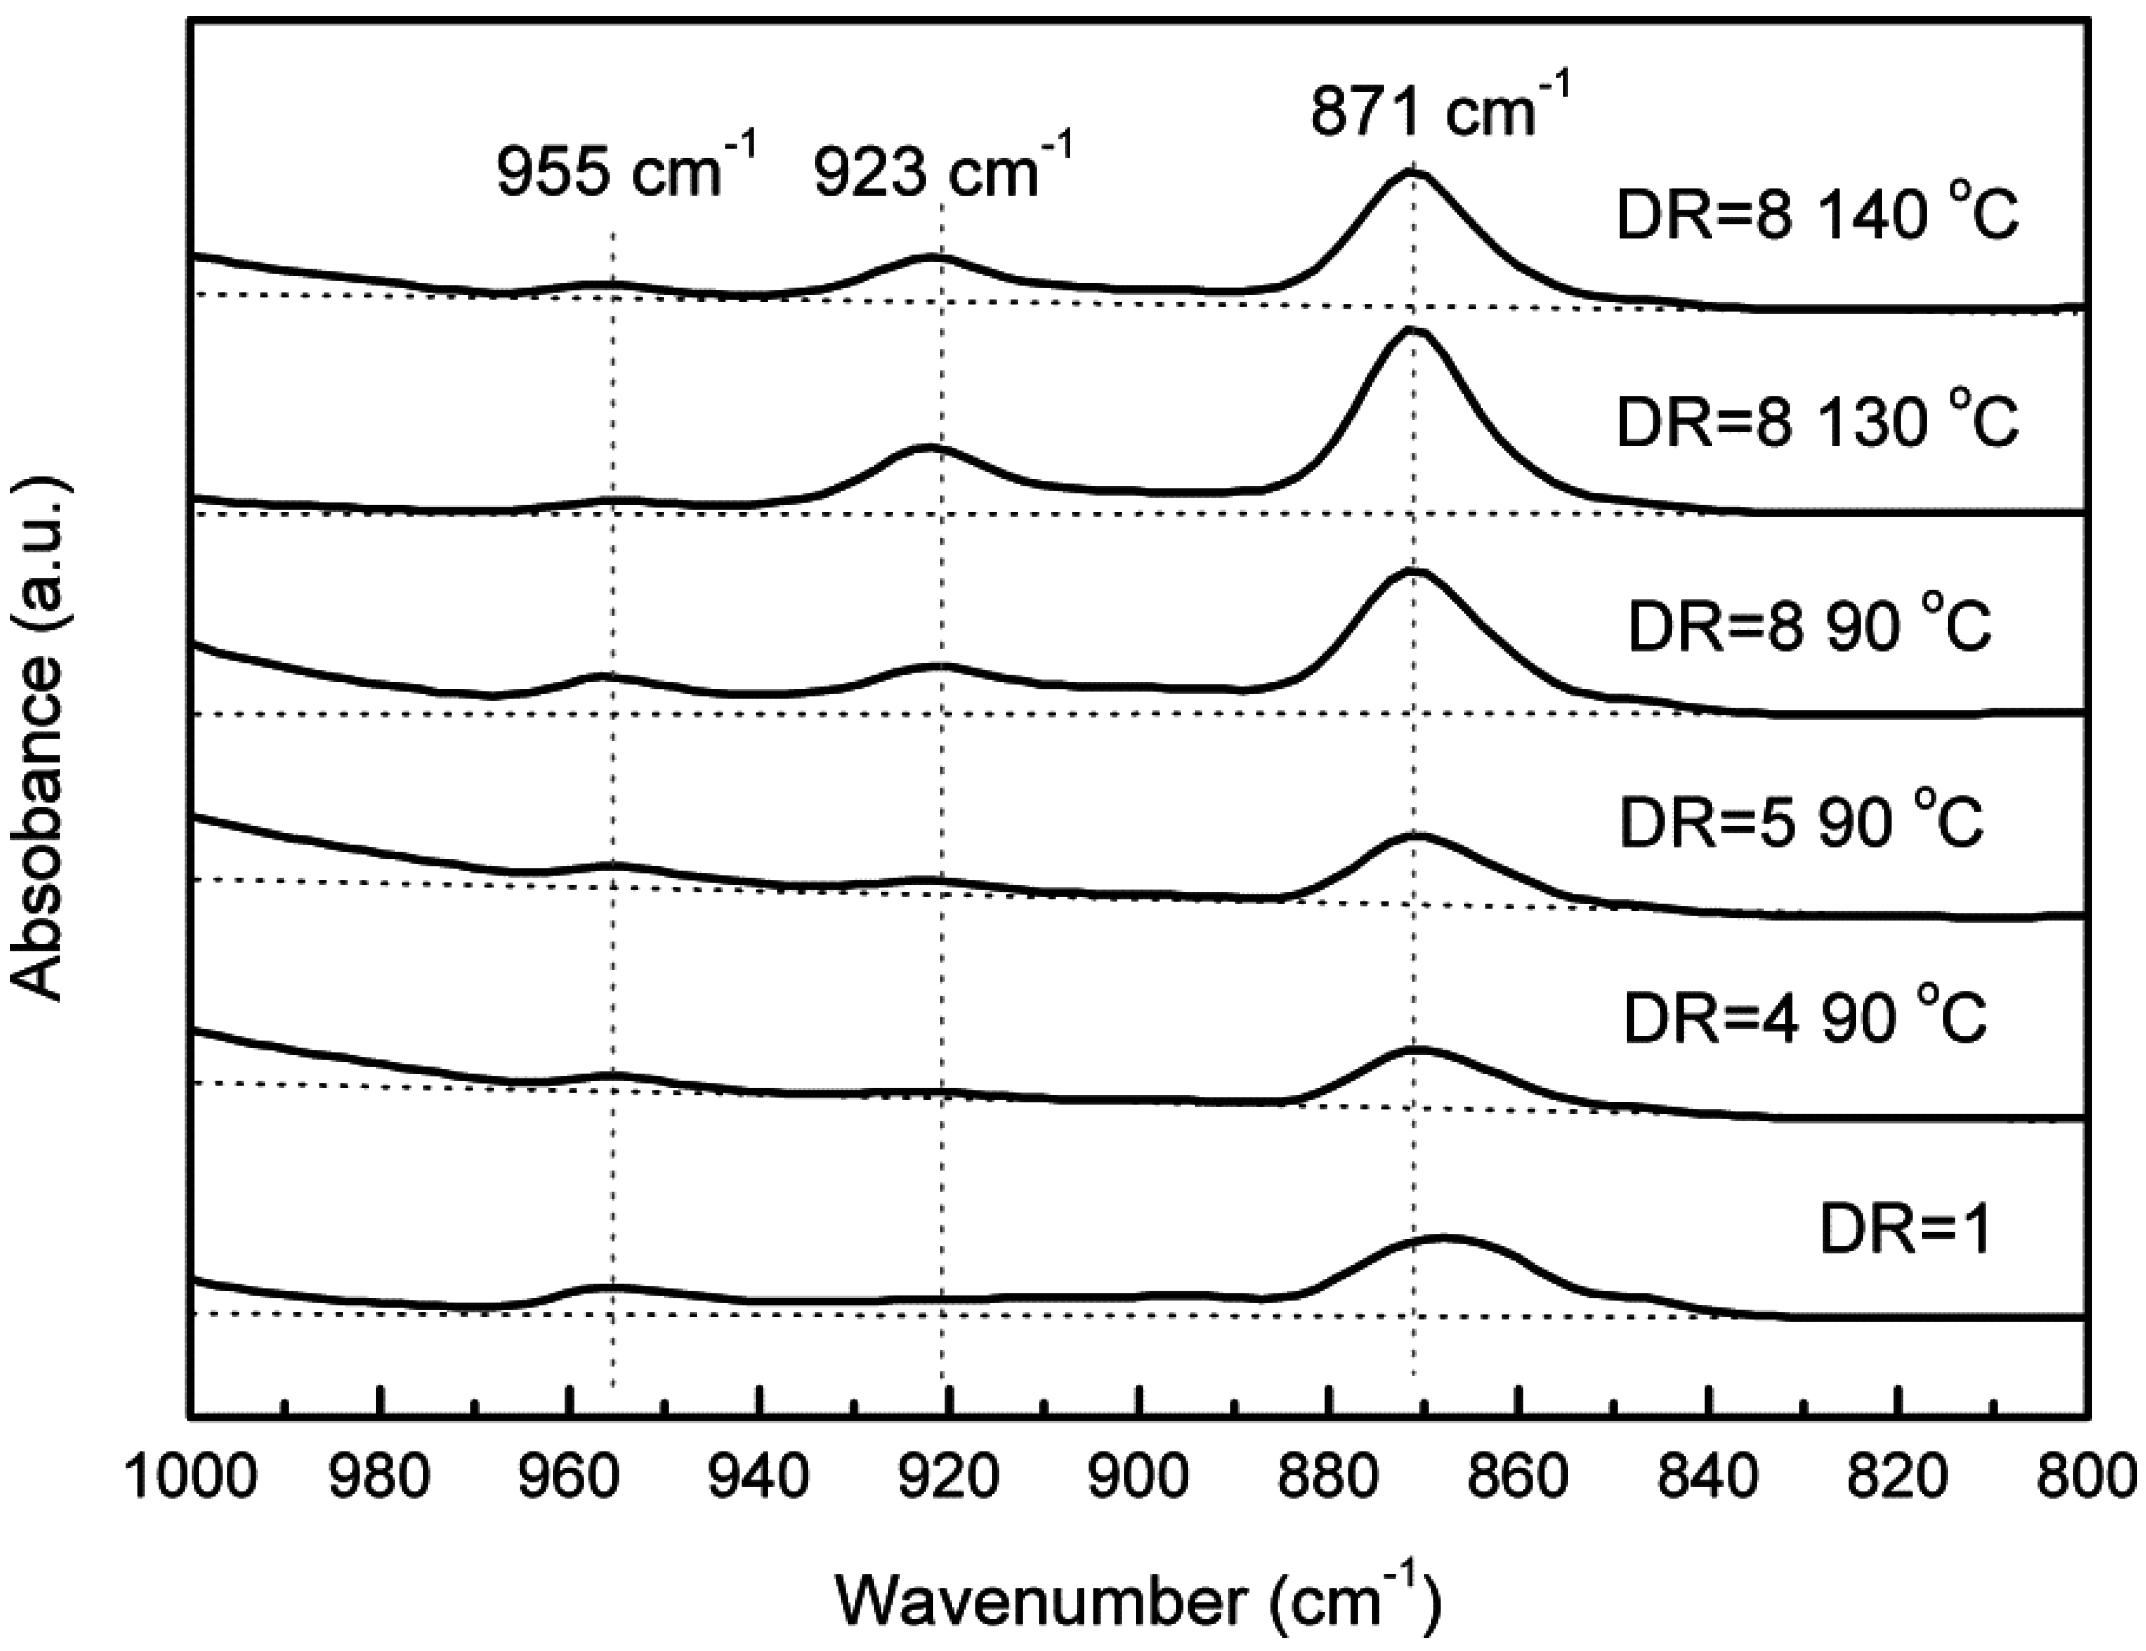
Figure 6 shows FT-IR spectra for a
DR series prepared by solid-state drawing of PLLA at different drawing temperatures. According to the many FT-IR studies of PLLA, the band at 955 cm
−1 is ascribed to the amorphous phase. The strong band at 871 cm
−1 is attributed to C–C backbone stretching. No absorption peak of either α or β crystal was observed for an original as-extruded film. An absorption band at 923 cm
−1 characteristic of α-form crystal appeared at a
DR of 4. The intensity of this band became gradually stronger with increasing
DR. All the samples do not show a new absorption band at 912 cm
−1 characteristic of β-form crystal, indicating no crystal transformation obtained in this study.
Figure 6.
Infrared spectra in the 800–1000 cm−1 region for a series of DR prepared at different drawing temperature. Note the appearance of the bands at 923 and 912 cm−1 characteristic of α and β crystals, respectively.
Figure 6.
Infrared spectra in the 800–1000 cm−1 region for a series of DR prepared at different drawing temperature. Note the appearance of the bands at 923 and 912 cm−1 characteristic of α and β crystals, respectively.
2D-WAXS was performed to determine the PLLA orientation after stretching.
Figure 7 displays the 2D-WAXS patterns of a
DR series of PLLA drawn at
Td = 90 °C and also a
Td series of PLLA with
DR = 8. Herman’s orientation factor (
f) calculated from Gaussian function, as well as the full width at half maximum (FWHM) of the (200/110) diffraction peaks are used to quantify the orientation of PLLA, and the corresponding values for various tapes are listed in
Table 5.
Table 5.
Crystalline orientation of various PLLA tapes obtained by Wide-angle X-ray scattering (WAXS).
Table 5.
Crystalline orientation of various PLLA tapes obtained by Wide-angle X-ray scattering (WAXS).
| Td (°C) | DR | Herman’s Orientation Factor* (200/110) | FWHM (200/110) (°) |
|---|
| 90 | 4 | 0.99 | 7.4 |
| 90 | 5 | 0.98 | 9.4 |
| 90 | 8 | 0.55 | 16.3 |
| 130 | 8 | 0.99 | 5.3 |
| 140 | 8 | 0.99 | 6.2 |
The PLLA as-extruded tape shows a diffuse isotropic scatter typical of an amorphous polymer. In the case of uniaxially drawn PLA tape with
DR = 4, there is a rapid growth of discrete equatorial reflections with low azimuthal spread typical of a well-oriented crystalline phase. The Herman’s orientation factors of PLLA tapes drawn at 90 °C are 0.99 and 0.98 for
DR = 4 and 5, respectively. However, upon further drawing to
DR = 8, Herman’s orientation factor decreases to 0.55. This tape displays a wider azimuthal spread suggesting crystals with poorer orientation, which is an unusual phenomenon. However, occasionally this occurs when the sample is “over-drawn” at a temperature that is too low [
30].
Figure 7.
2D WAXS patterns of (a,e) as-extruded tapes, tapes drawn at 90 °C to DR of (b) 4; (c) 5 and (d,f) 8; and PLLA tapes drawn at (g) 130 °C (DR = 8) and (h) 140 °C (DR = 8).The patterns were recorded with the incident beam perpendicular to the tapes.
Figure 7.
2D WAXS patterns of (a,e) as-extruded tapes, tapes drawn at 90 °C to DR of (b) 4; (c) 5 and (d,f) 8; and PLLA tapes drawn at (g) 130 °C (DR = 8) and (h) 140 °C (DR = 8).The patterns were recorded with the incident beam perpendicular to the tapes.
An “over-drawing” regime was observed for the tape with
DR = 8 drawn at 90 °C. It can be seen in
Figure 8 that tapes drawn at
DR = 4 and 5 are transparent while the tape drawn at
DR = 8 is completely opaque due to the development of micro-voids during “over-drawing”. SEM was also performed in order to explain this phenomenon. As seen in
Figure 9, the alignment of lamellae stacks can be viewed clearly for tapes drawn at
DR = 4. Denser packing of lamellae is found in tapes drawn at
DR = 5. At
DR = 8, a fibrillated structure is observed. Micro-voids align parallel to the drawing direction. Furthermore, wavy striations appear perpendicular to the tape axis. These striations are present not only at the surface of the tape but in the core as well, indicating the occurrence of crystal reassembling. Therefore, the decreased crystalline orientation observed in WAXS may be due to breakdown of the oriented structure in the “over-drawn” samples. Zhang
et al. [
31] reported that when the drawing temperature is just above
Tg (75 °C), during further stretching of PLA (strain > 100%), voids and cavities appear and develop, together with the breakdown of existing crystals.
These worm-like structures have also been observed before in oriented PP tapes. Schimanski
et al. [
30] found that for PP tapes with
DR > 10, an “over-drawing” regime existed where tapes changed from transparent to opaque. They also observed that the crystal orientation increased rapidly with increasing
DR at first, but started to decrease for
DR > 10.
This decrease in crystalline orientation can be avoided by increasing
Td. It can be seen in
Figure 7 that the arcs transform into spots with increasing
Td, demonstrating an increase in orientation of the crystalline phase. Therefore, the improved modulus and strength with
Td can be attributed to both an increase in crystallinity, as well as orientation of the crystalline phase.
Figure 8.
Optical appearance of PLLA tapes. From left to right; as-extruded tape, and tapes drawn at 90 °C to DR = 4, 5 and 8. There is a clear transition from fully transparent to an opaque tape structure at DR > 5.
Figure 8.
Optical appearance of PLLA tapes. From left to right; as-extruded tape, and tapes drawn at 90 °C to DR = 4, 5 and 8. There is a clear transition from fully transparent to an opaque tape structure at DR > 5.
Figure 9.
Scanning electron microscopy (SEM) cross-section images of (a) as-extruded tape and tapes drawn at 90 °C with (b) DR = 4; (c) DR = 5; and (d) DR = 8. Arrows indicate the stretching directions.
Figure 9.
Scanning electron microscopy (SEM) cross-section images of (a) as-extruded tape and tapes drawn at 90 °C with (b) DR = 4; (c) DR = 5; and (d) DR = 8. Arrows indicate the stretching directions.
In conclusion, when the as-extruded tapes are stretched at 90 °C, structural and morphological characterization indicates strain-induced crystallization (
Figure 4a) at low
DR = 4. The orientation of the crystalline phase increases at small strains, while upon further stretching, a decrease in crystalline orientation is observed due to breakdown of existing crystals in the “overdrawing” regime. The remaining mechanical properties in these tapes (
DR = 8) are mainly due to enhanced orientation of the amorphous phase (see
Tg shift in
Figure 5). For fixed draw ratios, a significant increase in Young’s modulus and tensile strength is observed with increasing drawing temperature, due to the increase in crystallinity (
Figure 4b) and orientation (
Figure 7) obtained for tapes drawn at higher temperatures.
3.4. Degradation Behaviour of Oriented PLLA Tapes
In previous works, numerous authors have reported extensively on the thermal degradation of PLA after melt processing. This degradation is attributed to ester group cleavage, as a consequence of the hydrolytic process at the high temperatures during melt processing in the presence of residual water [
23]. In the present work, PLLA extruded films produced by melt processing showed a reduction of
Mn by about 28%, from 133,500 g·mol
−1 of pellets to about 96,100 g·mol
−1 for as-extruded tapes. Eling
et al. [
9] produced fibres in which degradation was no higher than 40%. Fambri
et al. [
7] reported a molar mass degradation of more than 60% after melt spinning, but this result can be attributed more to shear stress effects due to long residence times.
It has been found that the degradability of PLA can be modified significantly by changing the microstructure of the polymer.
Figure 10 presents the GPC results of undrawn and drawn PLA tapes before and after degradation in two mediums at 50 °C. The results show that drawing has a significant effect on the hydrolytic degradation. In both mediums, the extent of degradation was lower for drawn tapes than for as-extruded tapes. For example, after degradation for four weeks in water, the molecular weight of the tape with
DR = 8 is about twice that of isotropic films.
Figure 10.
Residual molecular weights of PLLA as-extruded and drawn tapes before and after degradation in (a) water and (b) PBS.
Figure 10.
Residual molecular weights of PLLA as-extruded and drawn tapes before and after degradation in (a) water and (b) PBS.
It is well established that biodegradation of semi-crystalline polymers first occurs in the disordered amorphous phase. Rangari and Vasanthan [
32] reported that the highest percentage of weight loss was observed for films with the lowest initial crystallinity, indicating that the extent of degradation decreases with increasing crystallinity. Moreover, this amorphous component can include a restricted amorphous and free amorphous phase, where the degradation rate of the restricted amorphous component is usually much slower compared to the free amorphous component [
32].
It is not easy to fully analyse how the microstructure affects the hydrolytic degradation of PLLA because the crystallinity as well as molecular orientation in both amorphous and crystalline phase changes with drawing. For example, as shown in the DSC, DMA and WAXS data earlier, the as-extruded tape has a very low crystallinity of 4% and an isotropic structure. On the other hand, in tapes of DR = 8, the crystallinity increases to 55%, while at the same time the crystalline domains orient (f = 0.55). Besides, the increase in Tg (from 70 °C for the former to 92 °C for the latter) indicates a more constrained oriented amorphous phase after drawing. Therefore, it is hard to determine which factor plays the dominant role in lowering the degradation rate.
However, if we compare the tapes of DR = 4 with those of DR = 8, approximately 52% of molecular loss occurred for tapes with DR = 4 after four weeks of degradation in water and only 24% of molecular loss was observed for tapes with DR = 8 during the same time period. The crystallinity of the former (53%) is very close to that of the latter (55%), while the Herman’s orientation factor of the former (f = 0.99) is greater than that of the latter (f = 0.55). Higher Tg values (92 °C) were observed for DR = 8 than at DR = 4 (85 °C), suggesting higher orientation of the amorphous phase. Therefore, we may conclude that the restricted amorphous phase in this case plays a dominant role in slowing down the degradation.
In summary, solid-state drawing has a significant effect on the hydrolytic degradation behaviour of PLA due to the morphological changes. Therefore, it can be useful for tailoring the degradability of PLA products.


