Article

Optimization of Bacterial Cellulose Production by Komagataeibacter rhaeticus K23

by
Ceyda Uğurel
1,2 and
Hamdi Öğüt
1,*
1
Department of Bioengineering, Faculty of Engineering and Natural Sciences, Bursa Technical University, 16310 Bursa, Türkiye
2
Scientific Research Projects Coordination Unit, Bursa Uludağ University, 16059 Bursa, Türkiye
*
Author to whom correspondence should be addressed.
Fibers 2024, 12(3), 29; https://doi.org/10.3390/fib12030029
Submission received: 9 January 2024 / Revised: 28 February 2024 / Accepted: 12 March 2024 / Published: 21 March 2024

Abstract

:
The use of bacterial cellulose (BC), having high purity, a high degree of crystallinity, water-holding capacity, tensile strength and adaptability on a broad scale is limited because of the low yield. In this study, the optimal conditions for bio-cellulose production by Komagataeibacter rhaeticus K23 were investigated. Optimal values for temperature, pH, inoculum concentration and incubation time were determined via Taguchi design. The maximum BC production, 9.1 ± 0.66 g·L−1 (dry weight), was obtained from 32 °C, pH 5.5, 8 log CFU·mL−1 and 14 days of incubation. The inoculum concentration was the most significant factor affecting BC yield. A value of 8 log CFU·mL−1 and 14 days of incubation led to significantly higher levels of BC yield than other concentrations (8.5, 9, 9.5, 10 and 10.5 log CFU·mL−1) (p < 0.002) and days (15, 16, 17, 21 and 28) (p < 0.001). The studied features, namely absorption peaks (Fourier transform infrared spectroscopy), pattern and the crystallinity index (X-ray diffraction analysis) of the BC obtained in this study were all in parallel with the characteristics of cellulose I. The study demonstrates that optimized parameters were effective in producing BC with high water-holding capacity, tensile strength, elongation and Young’s modulus (mechanical tests) by K. rhaeticus K23.

1. Introduction

Cellulose, consisting of D-glucose units linked by β-1,4-glycosidic linkages, is the most abundant linear polymer in the world. Together with hemicellulose and lignin (40–60% cellulose, 20–40% hemicellulose and 10–25% lignin), it is the major component of plant cell walls [1,2]. The isolation of cellulose requires complex chemical processes that can cause irreversible changes in the structure of plants. Moreover, the process causes ecological pollution [3,4,5]. As the world’s population grows, the need for more cellulose is increasing every day, and to meet this growing demand, more wood and cotton are needed. Utilizing wood and cotton resources negatively affects the global carbon (C) cycle [6]. Therefore, alternative methods are being sought to limit or replace the use of plant-based cellulose. On the other hand, the high purity of bacterial cellulose is possible with fewer steps, lower costs and less waste at the end of the process. The main advantage is that bio-cellulose fibers can have a higher degree of polymerization due to the simple processing steps [7,8].
Bacterial cellulose is a microorganism-based homopolymer of β-(1,4)-glucose (C6H10O5)n [9]. Bacteria synthesize cellulose fibrils to form strands, and biofilm formation occurs during synthesis [10,11,12,13]. In some bacterial species, BC can be produced inversely by synthesizing cellulose and forming nanofibril bundles instead of forming nanocellulose via fibrillating fibers [14].
In order to achieve maximum yield and cost-effectiveness in BC production, it is crucial to optimize production parameters such as time, pH and temperature [15,16,17]. Some authors have described different methods to optimize the BC yield from different species. For example, Bagewadi et al. [18] used Plackett–Burmann’s design to optimize the culture medium for producing BC by Enterobacter hormaechei. In another study, Calderón-Toledo et al. [19] supplemented HS medium with mango extracts and optimized BC production by Komagataeibacter sp. SU12 using Plackett–Burmann’s design and compared the purified BCs produced by standard and mango-modified media. However, no report is available on the optimization of BC production by Komagataeibacter rhaeticus using the Taguchi methods and pH, temperature, incubation time and inoculum concentration parameters. Genichi Taguchi developed the Taguchi methods, which comprise statistical techniques for the improvement of the quality of manufactured products. More recently, these techniques have been applied to engineering [20], biotechnology [21] and marketing and advertising [22]. Professional statisticians have praised Taguchi’s methods for their advances and goals, particularly the designs that he used to analyze variation. The practice of modifying a process to maximize a given set of parameters within certain constraints is known as process optimization. Minimizing costs, maximizing benefits and/or maximizing efficiency are the most typical objectives. It is also one of the most important quantitative tools for business decision-making. When optimizing a process, one or more process specifications should be maximized while others are kept within their limits. The core principle of the Taguchi methods is the application of parameter design, an engineering method for product or process design that focuses on the identification of parameter (factor) settings that produce the best levels of a quality characteristic (performance measure) with the least amount of variation [23].
The aim of this study was to identify and evaluate the optimum parameters for BC production by K. rhaeticus isolated from Kombucha tea which is identified by 16S rRNA gene sequence analysis. In this study, the Taguchi methods were used for the first time to optimize the parameters for maximum BC production by Komagataeibacter rhaeticus, and the experiments were conducted with one-fourth of the normally required number of trials, achieving the targeted results with 16 experiments instead of the usual 64. The effects of experimental factors on BC production were studied using analysis of variance (ANOVA) for BC production at different temperatures, pH values, inoculum concentrations and incubation time. The morphology and structural properties of BC produced by K. rhaeticus in Hestrin‒Schramm medium with optimized parameters were characterized by FTIR, SEM, water-holding capacity and mechanical tests.

2. Materials and Methods

2.1. Materials

Kombucha tea was kindly provided by Dr Melih Guzel, Gumushane University. D-glucose (Applichem, Darmstadt, Germany), yeast extract (Merck, Darmstadt, Germany), peptone (Sigma, MO, USA), Na2HPO4 (Sigma, MO, USA) and citric acid (Sigma, MO, USA) were used for Hestrin‒Schramm medium preparation. Sodium hydroxide (ISOLAB, Wertheim, Germany) and acetic acid (ISOLAB, Wertheim, Germany) were used for purification and neutralization, respectively. All chemicals used were of analytical grade.

2.2. Isolation of BC Producer Bacteria

Kombucha tea was used as the starter culture. Inocula were cultured at 30 °C for 7 days in 250 mL Erlenmeyer flasks containing 50 mL of Hestrin‒Schramm (HS) medium (20 g·L−1 glucose, 5 g·L−1 yeast extract, 5 g·L−1 peptone, 2.7 g·L−1 Na2HPO4 and 1.15 g·L−1 citric acid) as previously reported by Hestrin and Schramm [24]. The inoculum was subcultured in fresh medium at a ratio of 1:10 and incubated for 72 h. A total of 1 mL of suspension was taken from the culture and serial dilutions were made with 0.9% (w/
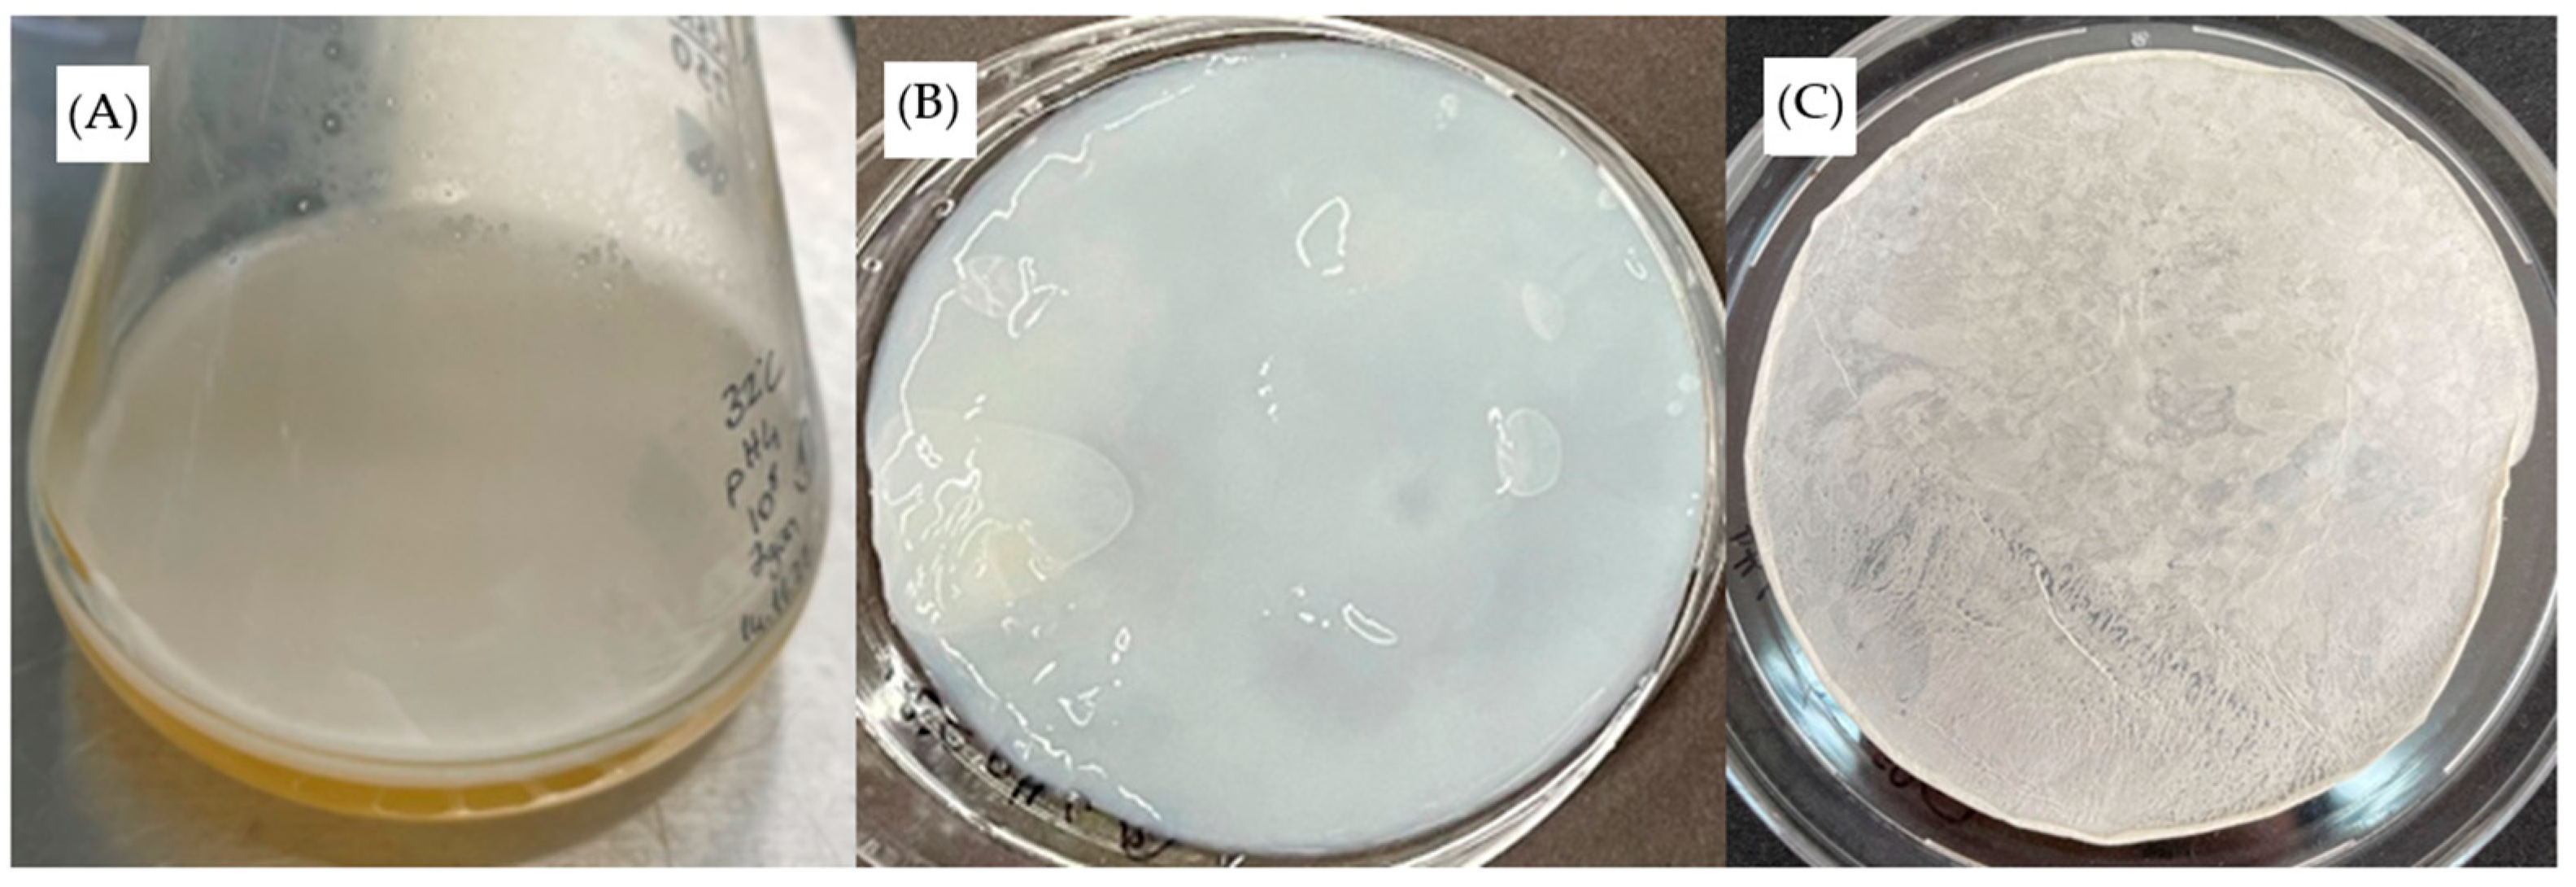
w) sterile NaCl solution. Aliquots of each dilution were plated on Petri dishes containing solid HS medium. The plates were then incubated at 30 °C for 72 h. The solid-medium-grown colonies were isolated according to their morphological characteristics. In order to assess cellulose formation at the top of the liquid, each colony isolated from the solid medium was inoculated into HS broth and incubated for 72 h. Then, BC-forming colonies were seeded on HS agar and incubated at 30 °C for 48 h. The bacterial cells presenting cellulose formation were Gram stained, and catalase tests were performed. Finally, the cellulose-producing pure isolate was cryopreserved in 1.5 mL of 20% glycerol solution and stored at −80 °C until use.

2.3. Identification of Bacterial Isolate via DNA Sequencing

The bacterial isolate shown to produce BC was identified by sequencing the 16S rRNA gene (BM Labosis, Ankara, Turkey). cDNA templates were prepared by employing the gene amplification technique using the PCR method. The 16S rRNA gene was amplified using universal primers (27F 5′-AGAGTTTGATCCTGGCTCAG-3′ and 1492R 5′-GGTTACCTTGTTACGACTT-3′) [25,26]. PCR reactions for 16S rRNA gene amplification were performed under the following conditions: 5 min initial denaturation at 95 °C followed by 30 cycles as recorded previously by Manjeet Sharan Pankaj Dhaka, [27]; denaturation at 95 °C for 45 s, annealing at 57 °C for 45 s, extension at 72 °C for 60 s and final extension at 72 °C for 5 min. The PCR product was analyzed by means of the sizes, quantity and purity via electrophoresis on a 1.5% (w/v) agarose gel in Tris-acetate-EDTA buffer. The agarose gel was then stained with ethidium bromide (EtBr) and visualized under UV light. Sequence similarity was then determined using the BLAST program in the GenBank database “https://www.ncbi.nlm.nih.gov/ (accessed on 13 April 2023)”.

2.4. Culture Conditions and Cellulose Formation

The inoculation medium and all the culture media were sterilized at 121 °C for 15 min, and the pH of the medium was adjusted with diluted HCl and NaOH (Table 1). Static conditions for the incubation time (7, 14, 15, 16, 17, 21 and 28 days) and temperatures (26 °C, 28 °C, 30 °C and 32 °C) were used for BC production in Erlenmeyer flasks (250 mL) containing 50 mL of HS medium. After incubation under defined conditions, BC membranes, formed at the air‒medium interface, were harvested and centrifuged at 4000 rpm for 10 min then purified in 4% (w/v) NaOH aqueous solution at boiling temperature to inactivate bacterial cells and other contaminants. The BC membrane was then placed in 2% acetic acid and washed with distilled water to neutral pH. At the final stage, the films were oven dried to constant weight at 37 °C for 24 h.

2.5. Optimization Methodology

The Taguchi design is a powerful and effective technique for the design of processes that will operate consistently and optimally under a wide variety of conditions. It requires the use of a carefully planned experiment that exposes the process to multiple levels of design parameters to determine the ideal design. The signal to noise ratio (S/N) was chosen by Taguchi as the preferred quality criterion. The standard deviation is not used as a quantitative value because as the mean decreases, so does the standard deviation, and vice versa. The use of the Taguchi methods in the study was justified by the fact that the methods offer advantages such as a wide range of applications, time savings by reducing the number of experiments and the ability to obtain results at a lower cost.
Experiments were conducted using an orthogonal design (SPSS, software version: 28.0) to evaluate four factors affecting BC production, namely inoculum concentration (colony-forming units (CFU) per milliliter), incubation time, incubation temperature and pH (Table 1). By studying the primary effects of each of these factors, it is possible to identify the general tendencies of the selected factors that influence the cellulose production process. The characteristics can be set to produce the desired effect with smaller or larger values, depending on the particular influence. As a result, it is possible to predict the values of the factors that might give the desired results.
An appropriately singled-out S/N ratio was used to assess response variance using the Taguchi methods. The phrase “S/N” is typically used to denote the proportion between the average value (signal) and the standard deviation (noise). The experiments indicated in Table 2 were carried out in at least three replicates.
Since the aim of the study was to maximize the amount of bacterial cellulose, the production “larger is better” type of quality characteristic was used. The typical formula for calculating the S/N ratio for this kind of response is:
(S/N)i = −10log [1/n ∑n(j=1)1/(Y2ij)],
where i is the number of the first trial, Yij is the measured value of the quality characteristic for the i process and j experiment, and n is the number of times that the experimental combination was repeated. Equation (1) was used to calculate the S/N ratios for each of the sixteen experiments listed in Table 2. The S/N average value was computed for each of the factors, and levels after the S/N ratios for each experiment were determined.
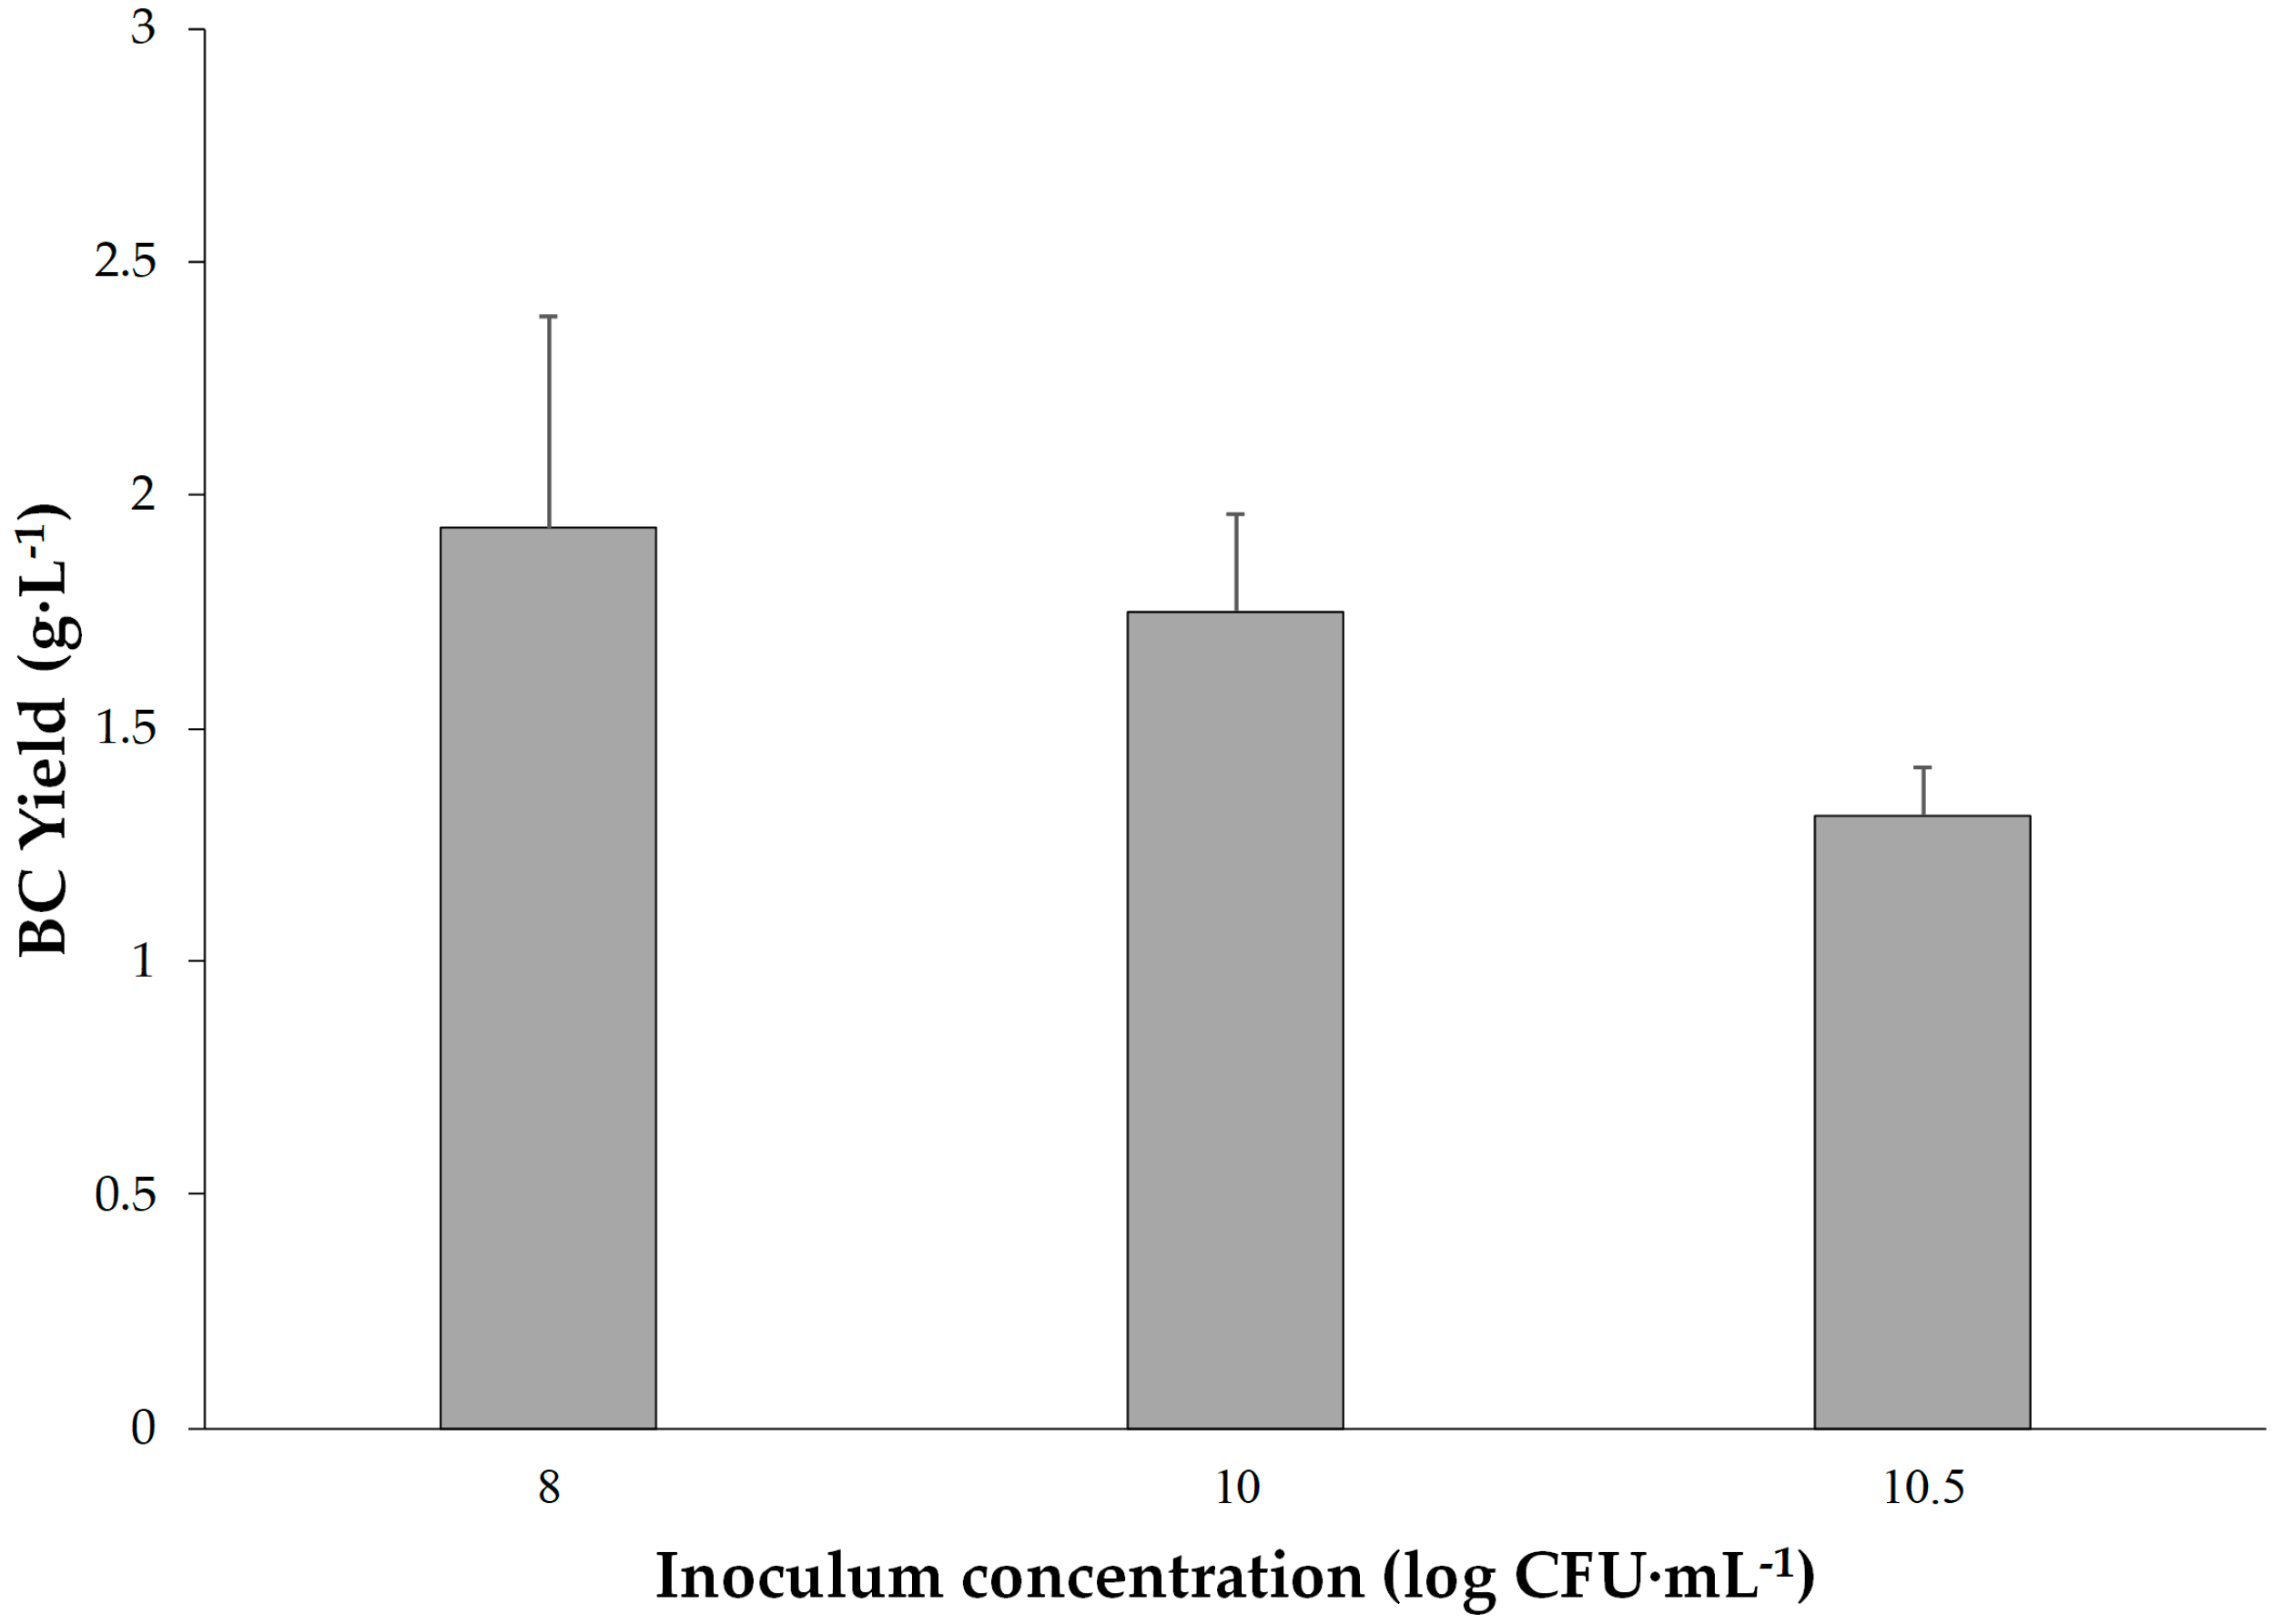
Following the Taguchi experiments, to further investigate the incubation time and inoculum concentrations, more experiments for the inoculum concentrations of 8.5, 9, 9.5, 10 and 10.5 log CFU·mL−1 and the incubation times of 15, 16, 17, 18, 19, 20, 21 and 28 days were evaluated in addition.

2.6. Characterization of Bacterial Cellulose

2.6.1. Scanning Electron Microscopy (SEM)

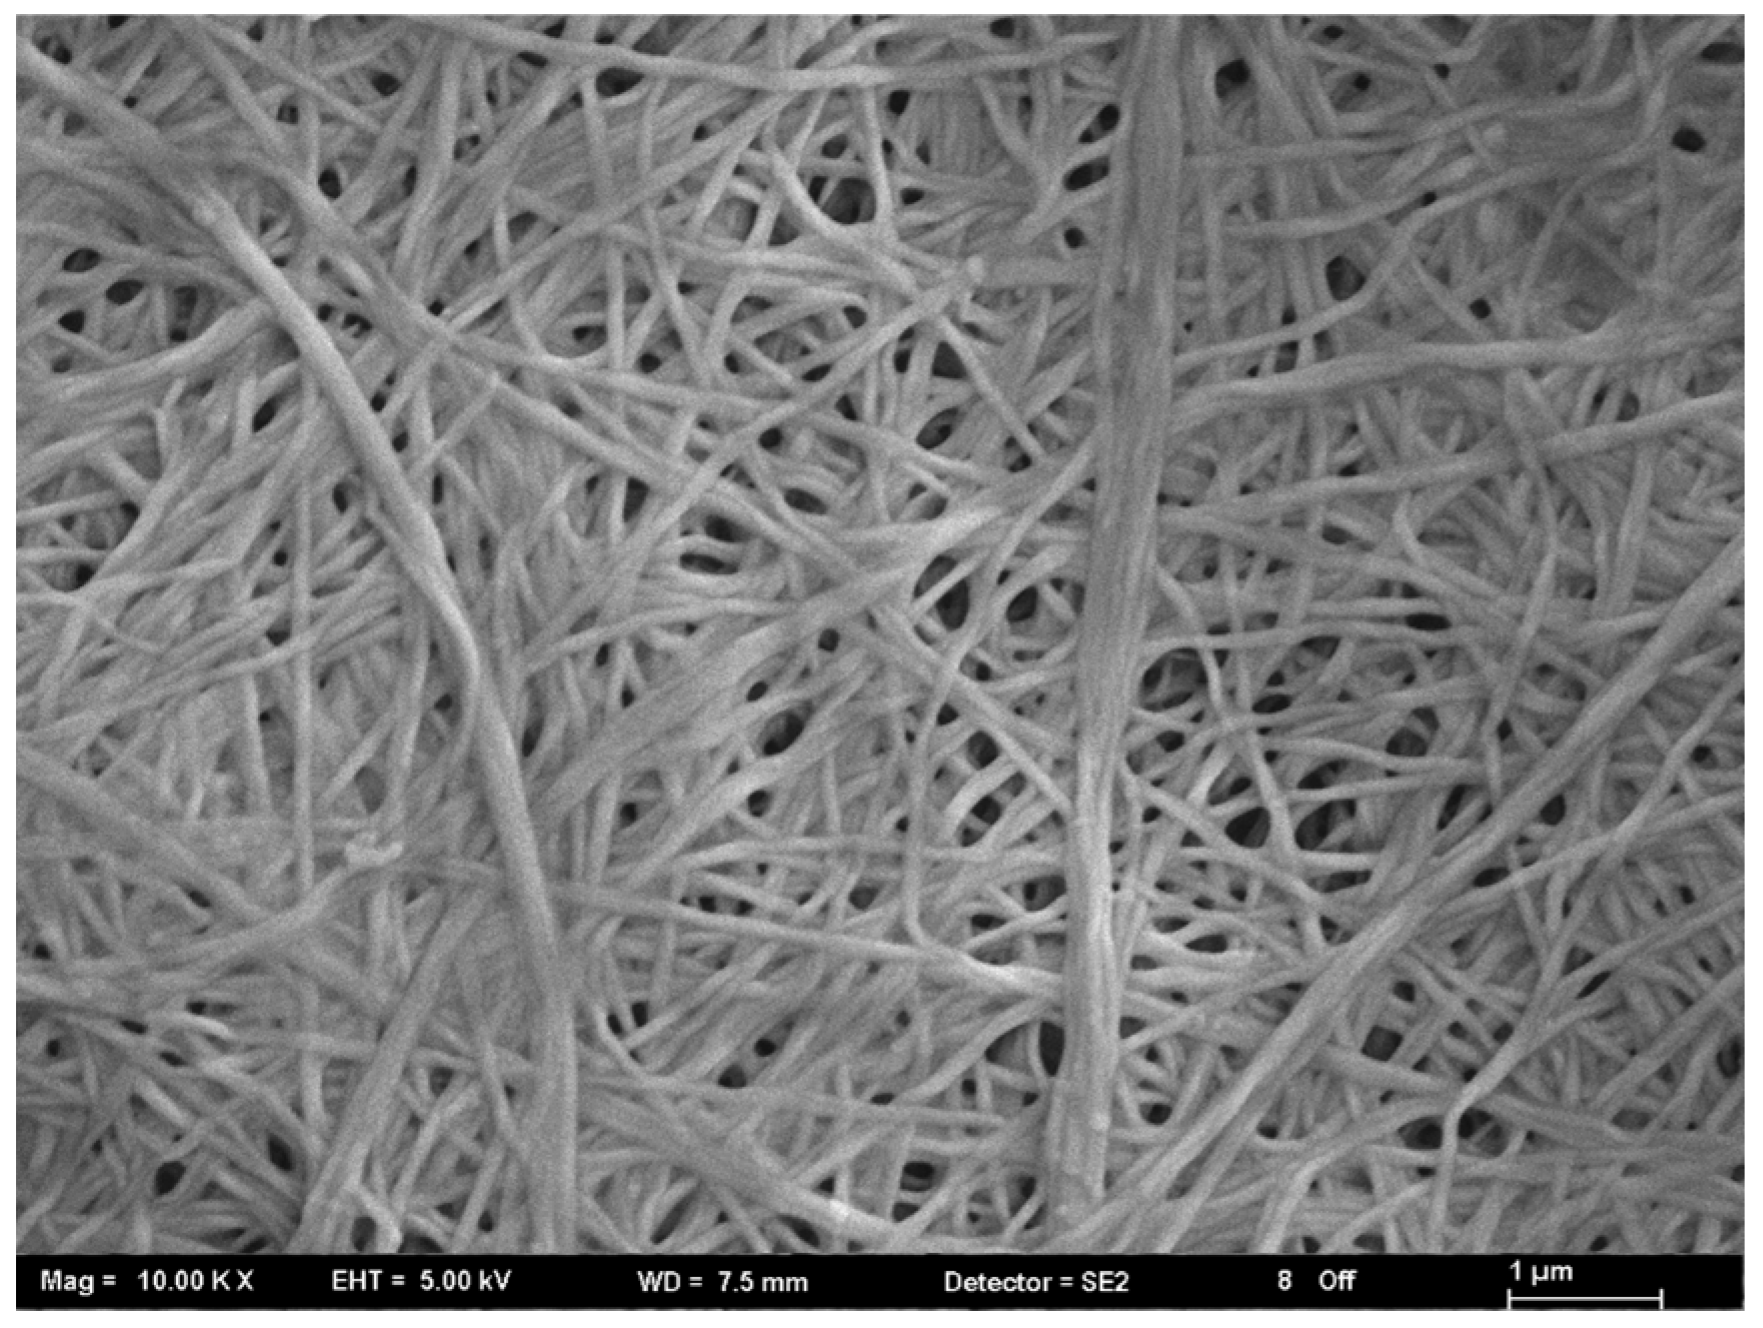
The BC membranes were coated with a 15 nm layer of gold/palladium. The interior morphology of BC membranes was observed using a SEM (ZEISS, Oberkochen, Germany) at an accelerating voltage of 5 kV.

2.6.2. Attenuated Total Reflectance-Fourier Transform Infrared (ATR-FTIR) Spectroscopy Analysis

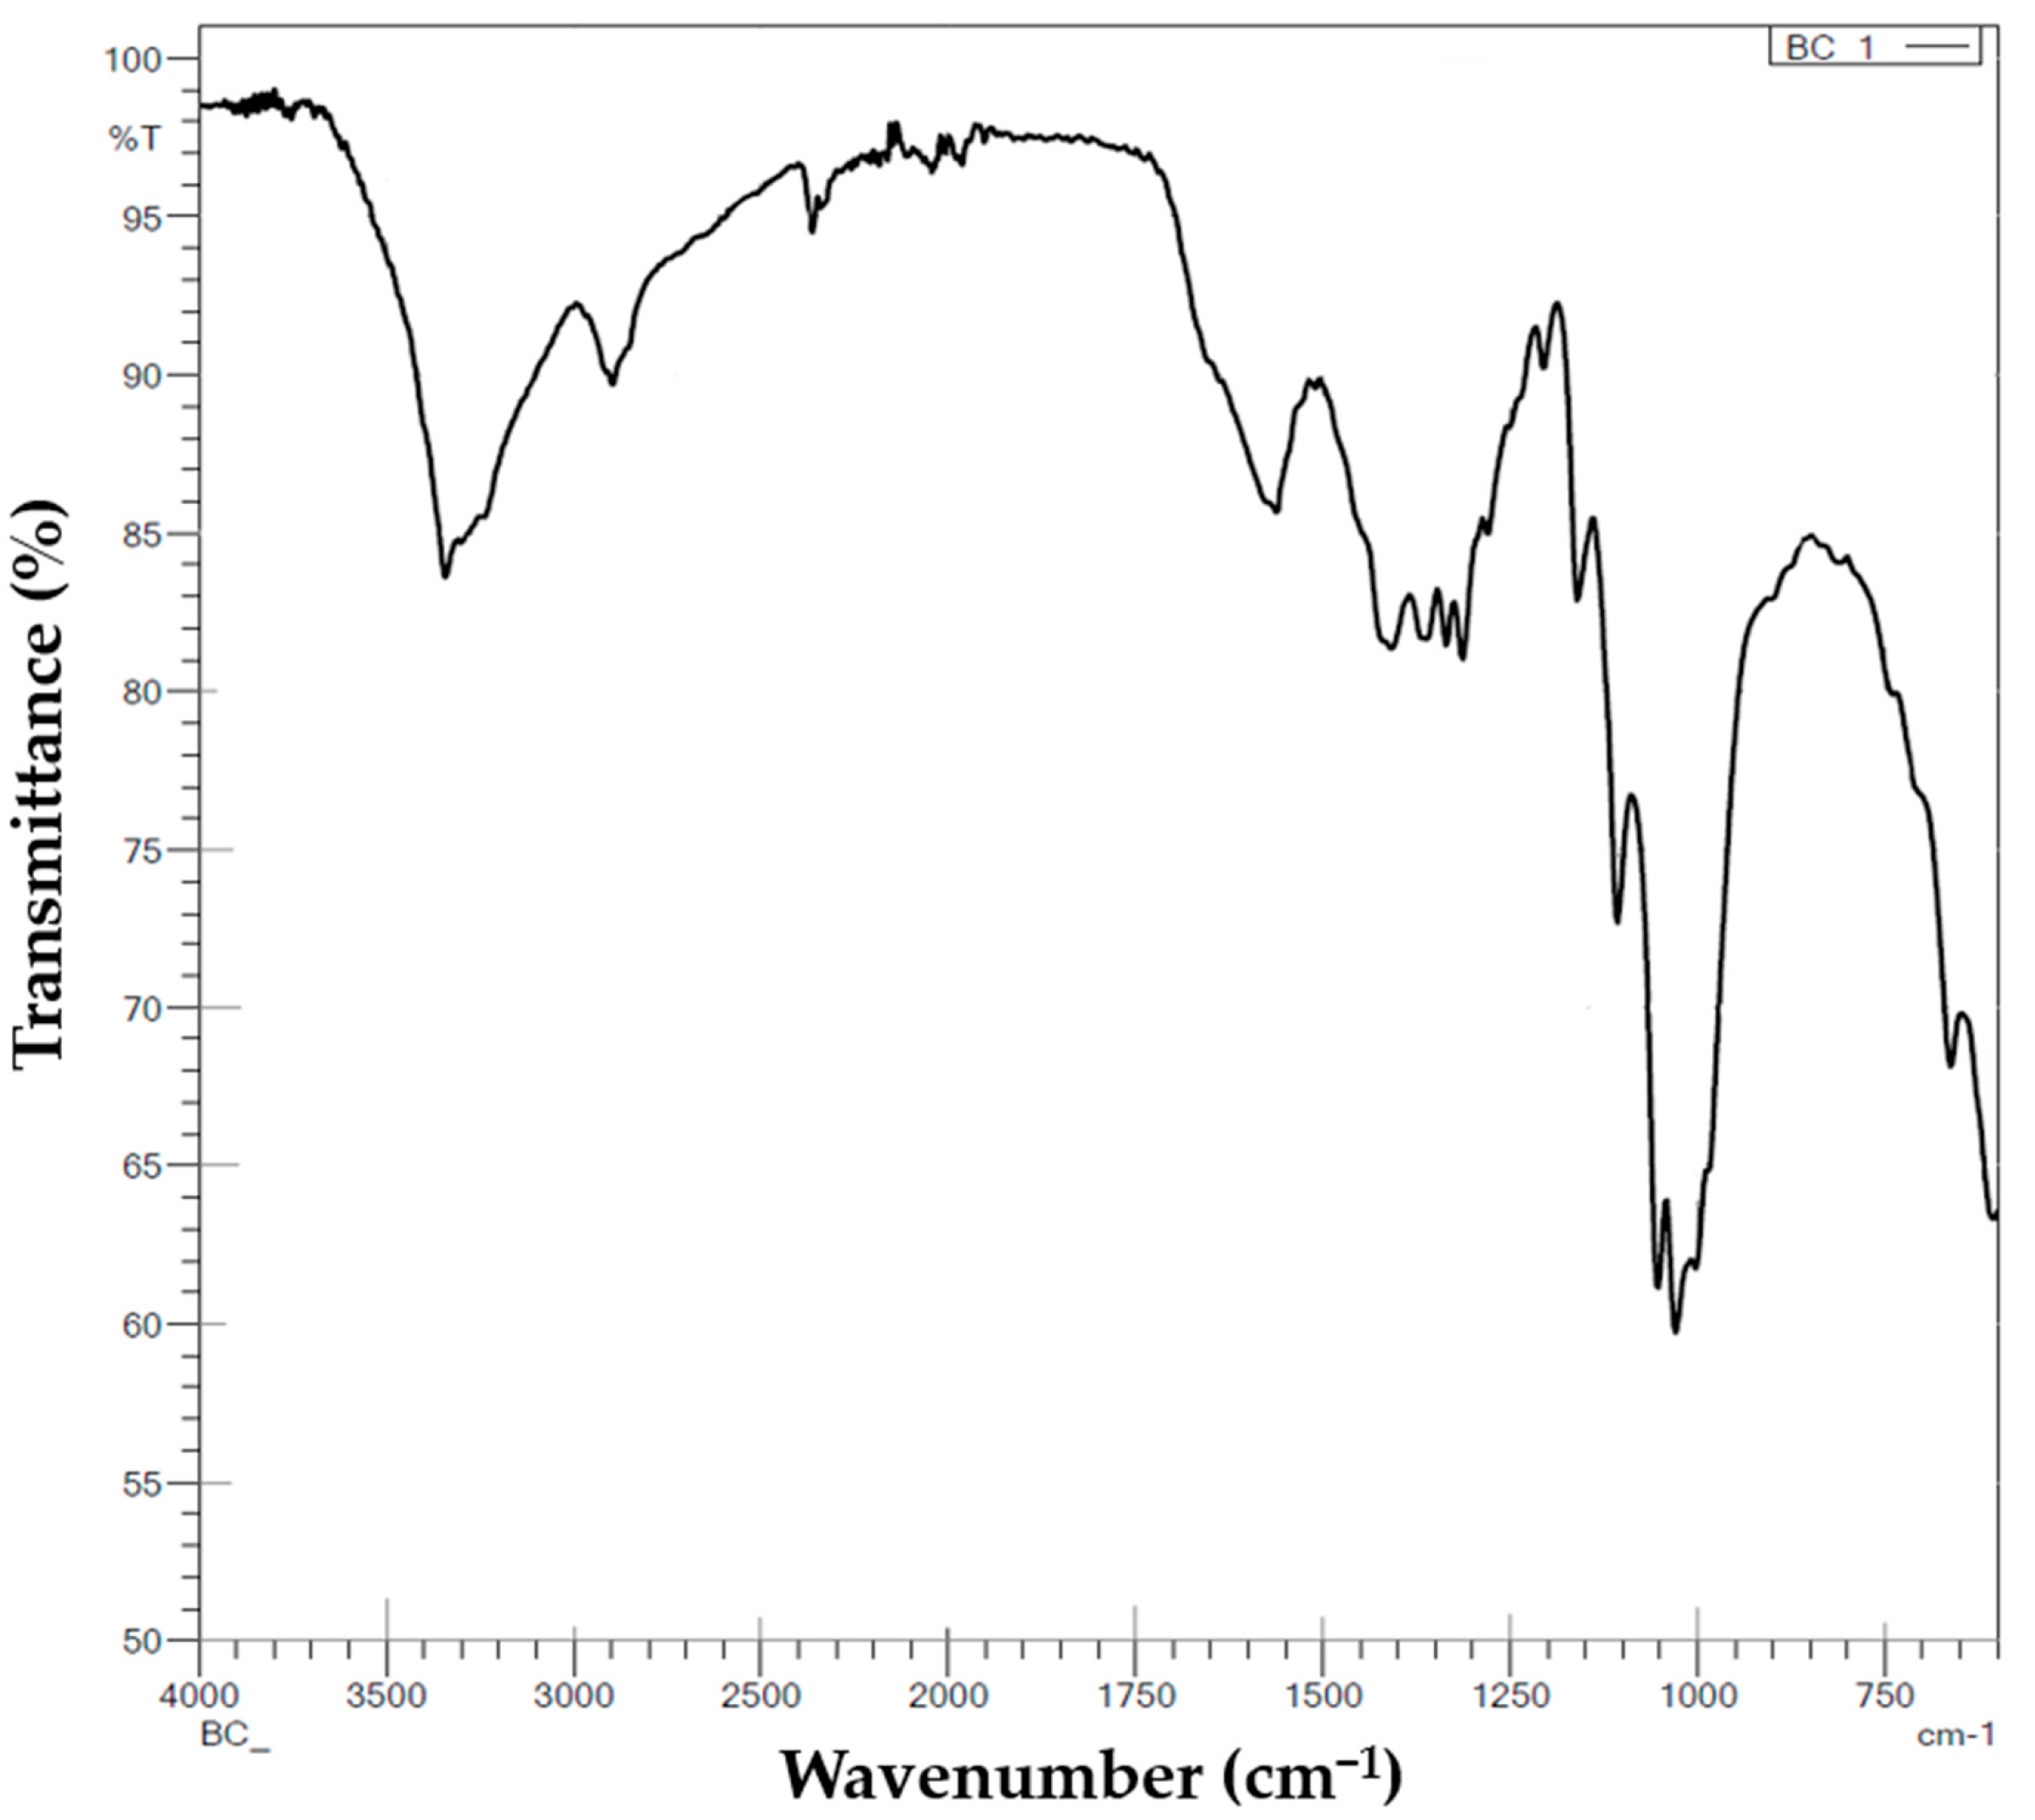
The FT-IR spectra of the dried BC membrane were acquired using a IRTracer-100 Fourier Infrared Spectrometer (Shimadzu, Kyoto, Japan) in ATR mode. The scanning range was from 500 to 4000 cm−1 with a resolution of 4 cm−1.

2.6.3. Water-Holding Capacity (WHC) of BC

The wet BC membranes produced by K. rhaeticus under optimum conditions were weighed and wet BC membranes were dried until constant weight at 37 °C for 24 h in an oven. Six replicates were analyzed by calculating the following formula [28,29]:
WHC (%) = (Wwet − Wdry)/Wwet × 100
where Wwet and Wdry were the wet and dry weight of BC cultivated at the 14th day. The data were presented as the means of six replicates and ±95% confidence interval.

2.6.4. Mechanical Properties

The tensile strength of the BC membrane was measured using a AGS-X Tensile-Compression Tester (Shimadzu, Japan) at room temperature and a crosshead speed of 5 mm/min. Samples were cut into strip-shaped specimens which were 30 mm in length, 5 mm in width and 0.02 mm in thickness. The experiments were repeated at least three times, and average values were taken.

2.6.5. X-ray Diffractometry (XRD)

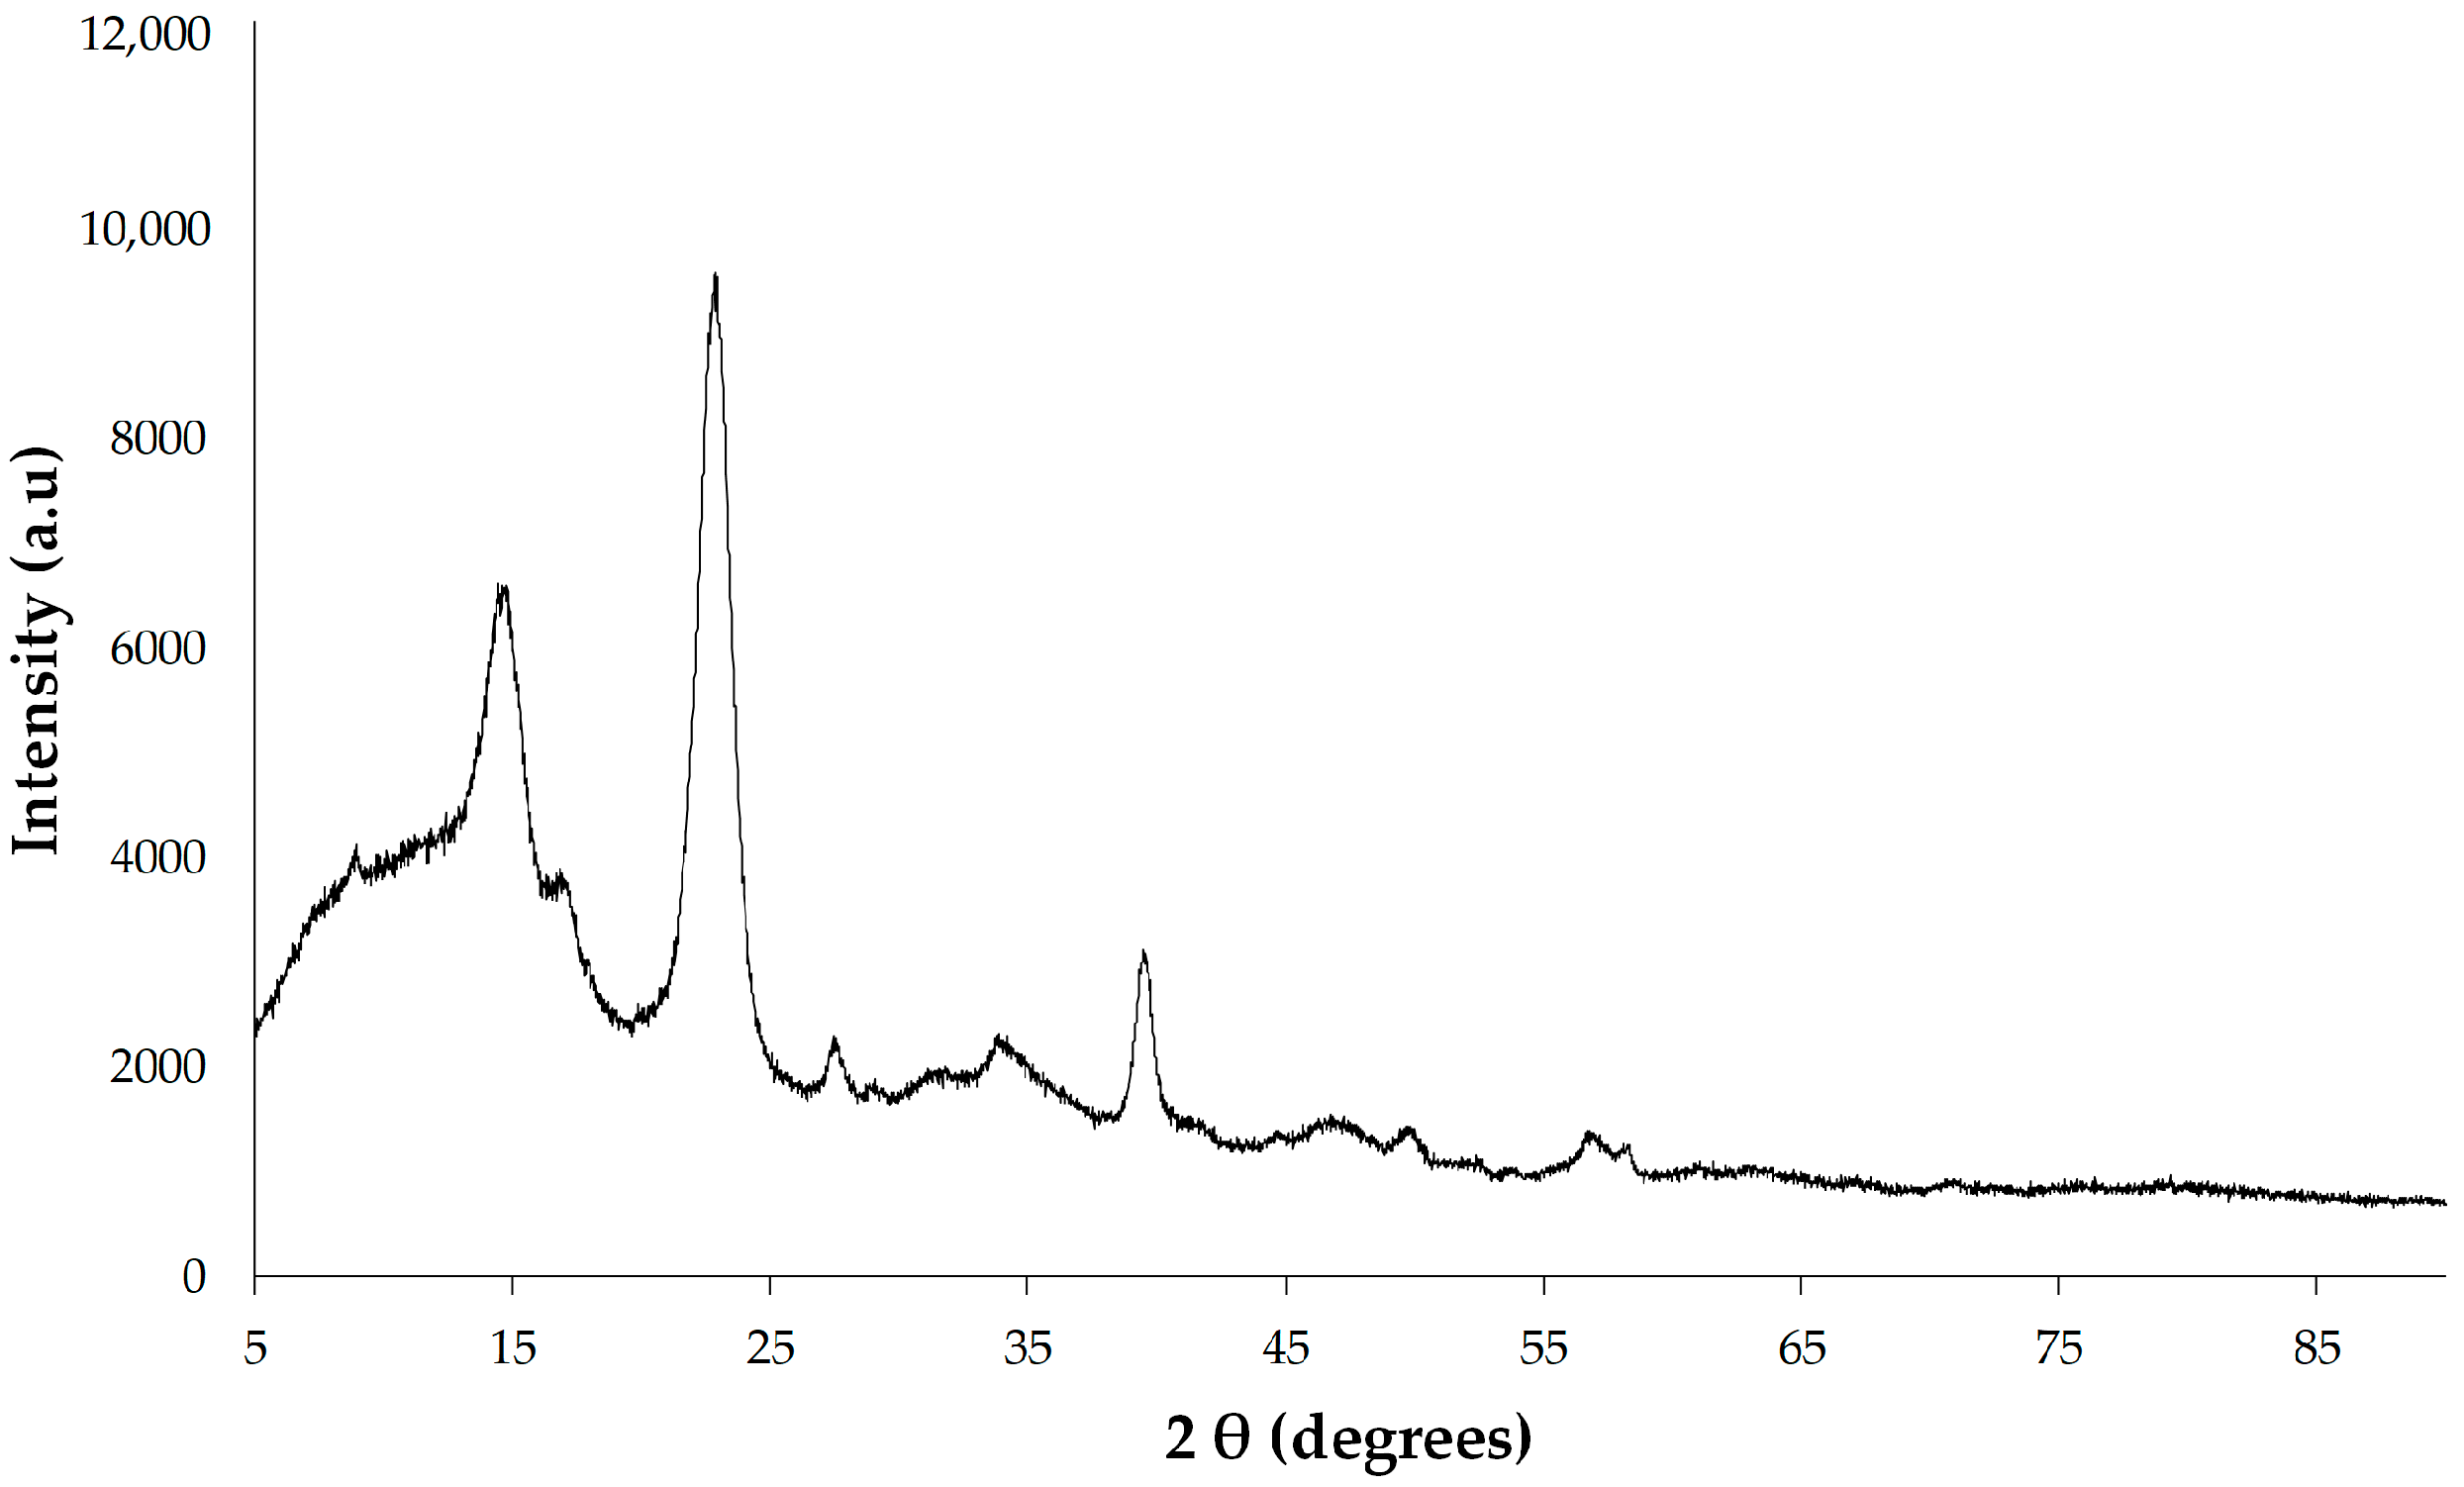
The X-ray diffractometry of BC membrane was conducted by using an XRD instrument (Bruker, Karlsruhe, Germany) with a 1.8 kW copper-anode-powered X-ray tube. Samples were scanned from 5° to 90° (2θ range) at a scanning rate of 4° min−1. The degree of crystallinity of BC samples was calculated based on peak intensity using the Segal method [30].

2.7. Statistical Analysis

Data obtained from the Taguchi experiments were determined by ANOVA analysis using Minitab Statistical Software Version 21.1.0 and SPSS Version 28.0. p values less than 0.05 were considered significant.

3. Results

3.1. Isolation and Identification of Cellulose-Producing Bacteria

BC-producing bacteria used in this study were isolated from Kombucha tea. The morphology of the isolated bacteria was examined using a light microscope after Gram staining and it was found that the isolated strain was Gram-negative and catalase-positive. Sequence analysis using the BLAST program showed the highest similarity (99%) between sequences obtained from the current isolated bacteria in this study (K23) and Komagataeibacter rhaeticus.

3.2. BC Yield in HS Medium by K. rhaeticus K23

To evaluate the BC production capacity of K. rhaeticus K23, the dry weight of the BC production under static culture conditions was investigated using traditional HS medium. The forms of BC during different processes are shown in Figure 1, which include production in culture media, harvesting, purification and drying.
SEM micrographs of BC dried membranes revealed a three-dimensional ribbon-like network of nanofibril structures (Figure 2). The micrographs present a dense structure of cellulose membrane produced by K. rhaeticus, and the fibers are homogeneously distributed and connected.
Cellulose was removed from the fermentation broth and purified to remove cell mass and other artifacts. The harvested and purified BC membranes were analyzed as dry weight (g·L−1) (Table 3). The Taguchi methods were used to study the variation in response with an appropriate signal-to-noise ratio (SNRA) to determine the optimal growth conditions.
For each parameter, the levels with the highest S/N ratio values were selected as the optimum value for the parameter, since the increase in cellulose production is the ideal situation for our experiments. The optimal values were A4 (temperature: 32 °C), B4 (pH: 5.5), C2 (inoculum: 8 log CFU·mL−1) and D2 (incubation time: 14 days) (Figure 3).
The most important factor in regard to increasing the bacterial cellulose production was found to be the inoculum concentration (Factor C) followed by temperature (Factor A), pH (Factor B) and incubation time (Factor D) (Table 4). Therefore, from the ANOVA results, inoculum concentration (Factor C) had the greatest effect and was the most important factor for maximizing BC production using K. rhaeticus K23 (F = 49.63).
Higher R2 values indicate a better relation between the predicted and experimental data. It was suggested that the R2 value should be at least 0.80 for a good model fitness [31]. The obtained R2 was 90.64%, which indicates that only 9.46% of the total variation could not be explained by the empirical model (Table 5). Thus, the response surface model developed in this study for predicting the BC yield may be considered satisfactory.
According to the experimental results, which were carried out with the optimal combination of tested parameters (A4B4C2D2), the dry weight of the produced BC in standard HS medium was recorded as 9.1 ± 0.66 g·L−1. Therefore, a greater amount of BC was obtained than obtained in other studies with K. rhaeticus. Moreover, chi-squared results indicate that this yield of BC is significantly higher than other strains of the same genus [26,28,32,33,34,35]. He et al. [32] showed that K. rhaeticus strain TPJU03 produced 8.28 g·L−1 (dry weight) in standard HS medium which was the closest to our results (Table 6). It is followed by 7.91 g·L−1 [26] and 6.7 g·L−1 [28]. The lowest BC production by a K. rhaeticus strain incubated in standard HS medium was obtained by Roushdy et al. [33] and Thorat and Dastager [30] who found the BC yield to be 4 g·L−1. Our research findings indicate a daily production rate of 0.65 g·L−1·day−1. While productivity measurement is an important parameter, it remains a distant estimate without a standardized metric. Although implying production at this rate daily, the actual output does not remain consistent each day. Instead, determining the day with the highest cumulative product quantity is more meaningful. According to our study results, following the identification of the day with the highest cumulative production, the product quantity began to decrease and did not continue at 0.65 g·L−1·day−1.

3.3. Effects of Inoculum Concentration and Incubation Time on the Production of BC

After optimization by using the Taguchi design, the optimal values of the parameters tested were found to be 32 °C, pH 5.5, 14 days and 8 log CFU·mL−1, which gave the highest production (9.1 ± 0.66 g·L−1 dry weight of BC). The ANOVA results revealed that (Table 4) out of the four tested parameters, inoculum concentration was the most significant factor affecting BC production. Therefore, additionally higher inoculum concentrations were tested against incubation time to further investigate the effect of inoculum on the BC yield (Table 7). The BC yield increased by 814% after 2 days’ incubation by increasing the inoculum from 8 log CFU·mL−1 to 10.5 log CFU·mL−1. Similarly, when the experiments were carried out with 4 days of incubation, the BC yield increased by 275% when the inoculum was increased from 8 log CFU·mL−1 to 10.5 log CFU·mL−1.
BC production was also examined at inoculum concentrations of 8 log CFU·mL−1 and 10 log CFU·mL−1 for 7 and 14 days to test whether or not there was an association between inoculum dose and incubation time (Figure 4 and Figure 5). Incubation for 7 days at an inoculum concentration of 10.5 log CFU·mL−1 resulted in a decrease (minus 32%) in BC dry weight (Figure 4) when compared to 8 log CFU·mL−1. Therefore, 14 days of incubation with 8 log CFU·mL−1 and 10 log CFU·mL−1 inoculum concentrations were tested, and BC yields were 9.1 g and 2.1 g, respectively (Figure 5), indicating that BC production decreased significantly at higher inoculum concentrations (p = 0.026). This may be due to the fact that introducing excess inoculum into the fermentation medium drives bacteria into a competition for nutrients, disrupting bacterial growth and the production of BC. Similar findings were reported by Yanti et al. [35]. Therefore, an 8 log CFU·mL−1 inoculum concentration and 14-day incubation time were determined to be optimal for the highest BC production.
In order to further investigate the observed data with incubation time, increased days of incubation for 8 log CFU·mL−1 inoculum concentration were tested. The BC yield increased by 370% from 7 to 14 days of incubation, and then decreased by 40, 65, 76, 80 and 83% at 15, 16, 17, 21 and 28 days of incubation, respectively, when compared to 14 days of incubation (Figure 6). This may be due to the increased production of gluconic acid, known to decrease the pH of the medium and thus inhibit BC production [36]. In our study, we showed that 14 days of incubation resulted in significantly higher amounts of BC than incubating for 7, 15, 16, 17, 21 and 28 days (p = 0.00004).

3.4. ATR-FTIR Analysis

The structural analysis of BC membrane was carried out via ATR-FTIR analysis (Figure 7). The spectra showed essential absorption peaks characteristic of cellulose I [30], indicating that the fermentation product of K. rhaeticus K23 is cellulose. Specifically, the characteristic peaks at 3350 cm−1, 1425 cm−1 and 1160 cm−1 were assigned to O–H stretching, CH2 symmetric bending and the C–O–C asymmetric stretching vibration peak of cellulose type I, respectively. The peak at 2900 cm−1 was from the C–H stretching of CH2 groups [32]. The peaks at 1108 cm−1 and 1055 cm−1 correspond to C–O bond stretching and C–O–C ring skeletal vibration, respectively.

3.5. Water-Holding Capacity of BC

High water-holding capacity is a symbolic characteristic of BC [32]. The porous, fibrillary and homogenous structure of BC creates capillary force to trap water molecules into its network. The BC possesses water-holding capacity of 98.8 ± 0.3% (Table 8). This revealed that the three-dimensional nanofibril structure of BC exposes hydrogen bonds to interact with water due to the fact that the formation of extensive hydrogen bonds between cellulose fibrils and water molecules increases the water-holding capacity [32,37].

3.6. Mechanical Properties

The mechanical properties of BC membranes were measured using tensile tests. The tensile strength, elongation and Young’s modulus results are listed in Table 8. The BC membrane, produced by K. rhaeticus K23, exhibited a tensile strength of 44.1 ± 4.9 (MPa), elongation of 1.5 ± 0.5% and Young’s modulus of 5.05 ± 0.6 GPa.

3.7. XRD Analysis of BC

X-ray diffractograms (XRD) were acquired for bacterial cellulose derived from BC-producing isolate K. rhaeticus K23 (Figure 8). The XRD patterns obtained closely resemble the cellulose I pattern, exhibiting characteristic peaks at 2θ angles of 14, 16, and 22, while lacking peaks at 2θ angles of 12 and 20, which are typical of cellulose II. The crystallinity index of the BC membrane was found to be 64.35.

4. Discussion

In this study, it was aimed to determine the optimal conditions for the production of bacterial cellulose (BC) by the Komagataeibacter rhaeticus K23 strain isolated from Kombucha tea. The Taguchi methods have been used effectively in the determination of these optimal conditions. The results revealed that K. rhaeticus K23 strain has a high potential for BC production. The Taguchi experiment design has been useful for quickly determining the interactions of these factors and the optimal conditions. On the other hand, the Taguchi methods have the advantage of quickly determining optimal conditions by reducing the number of experiments. This provides an optimization strategy that is effective in terms of cost and time.
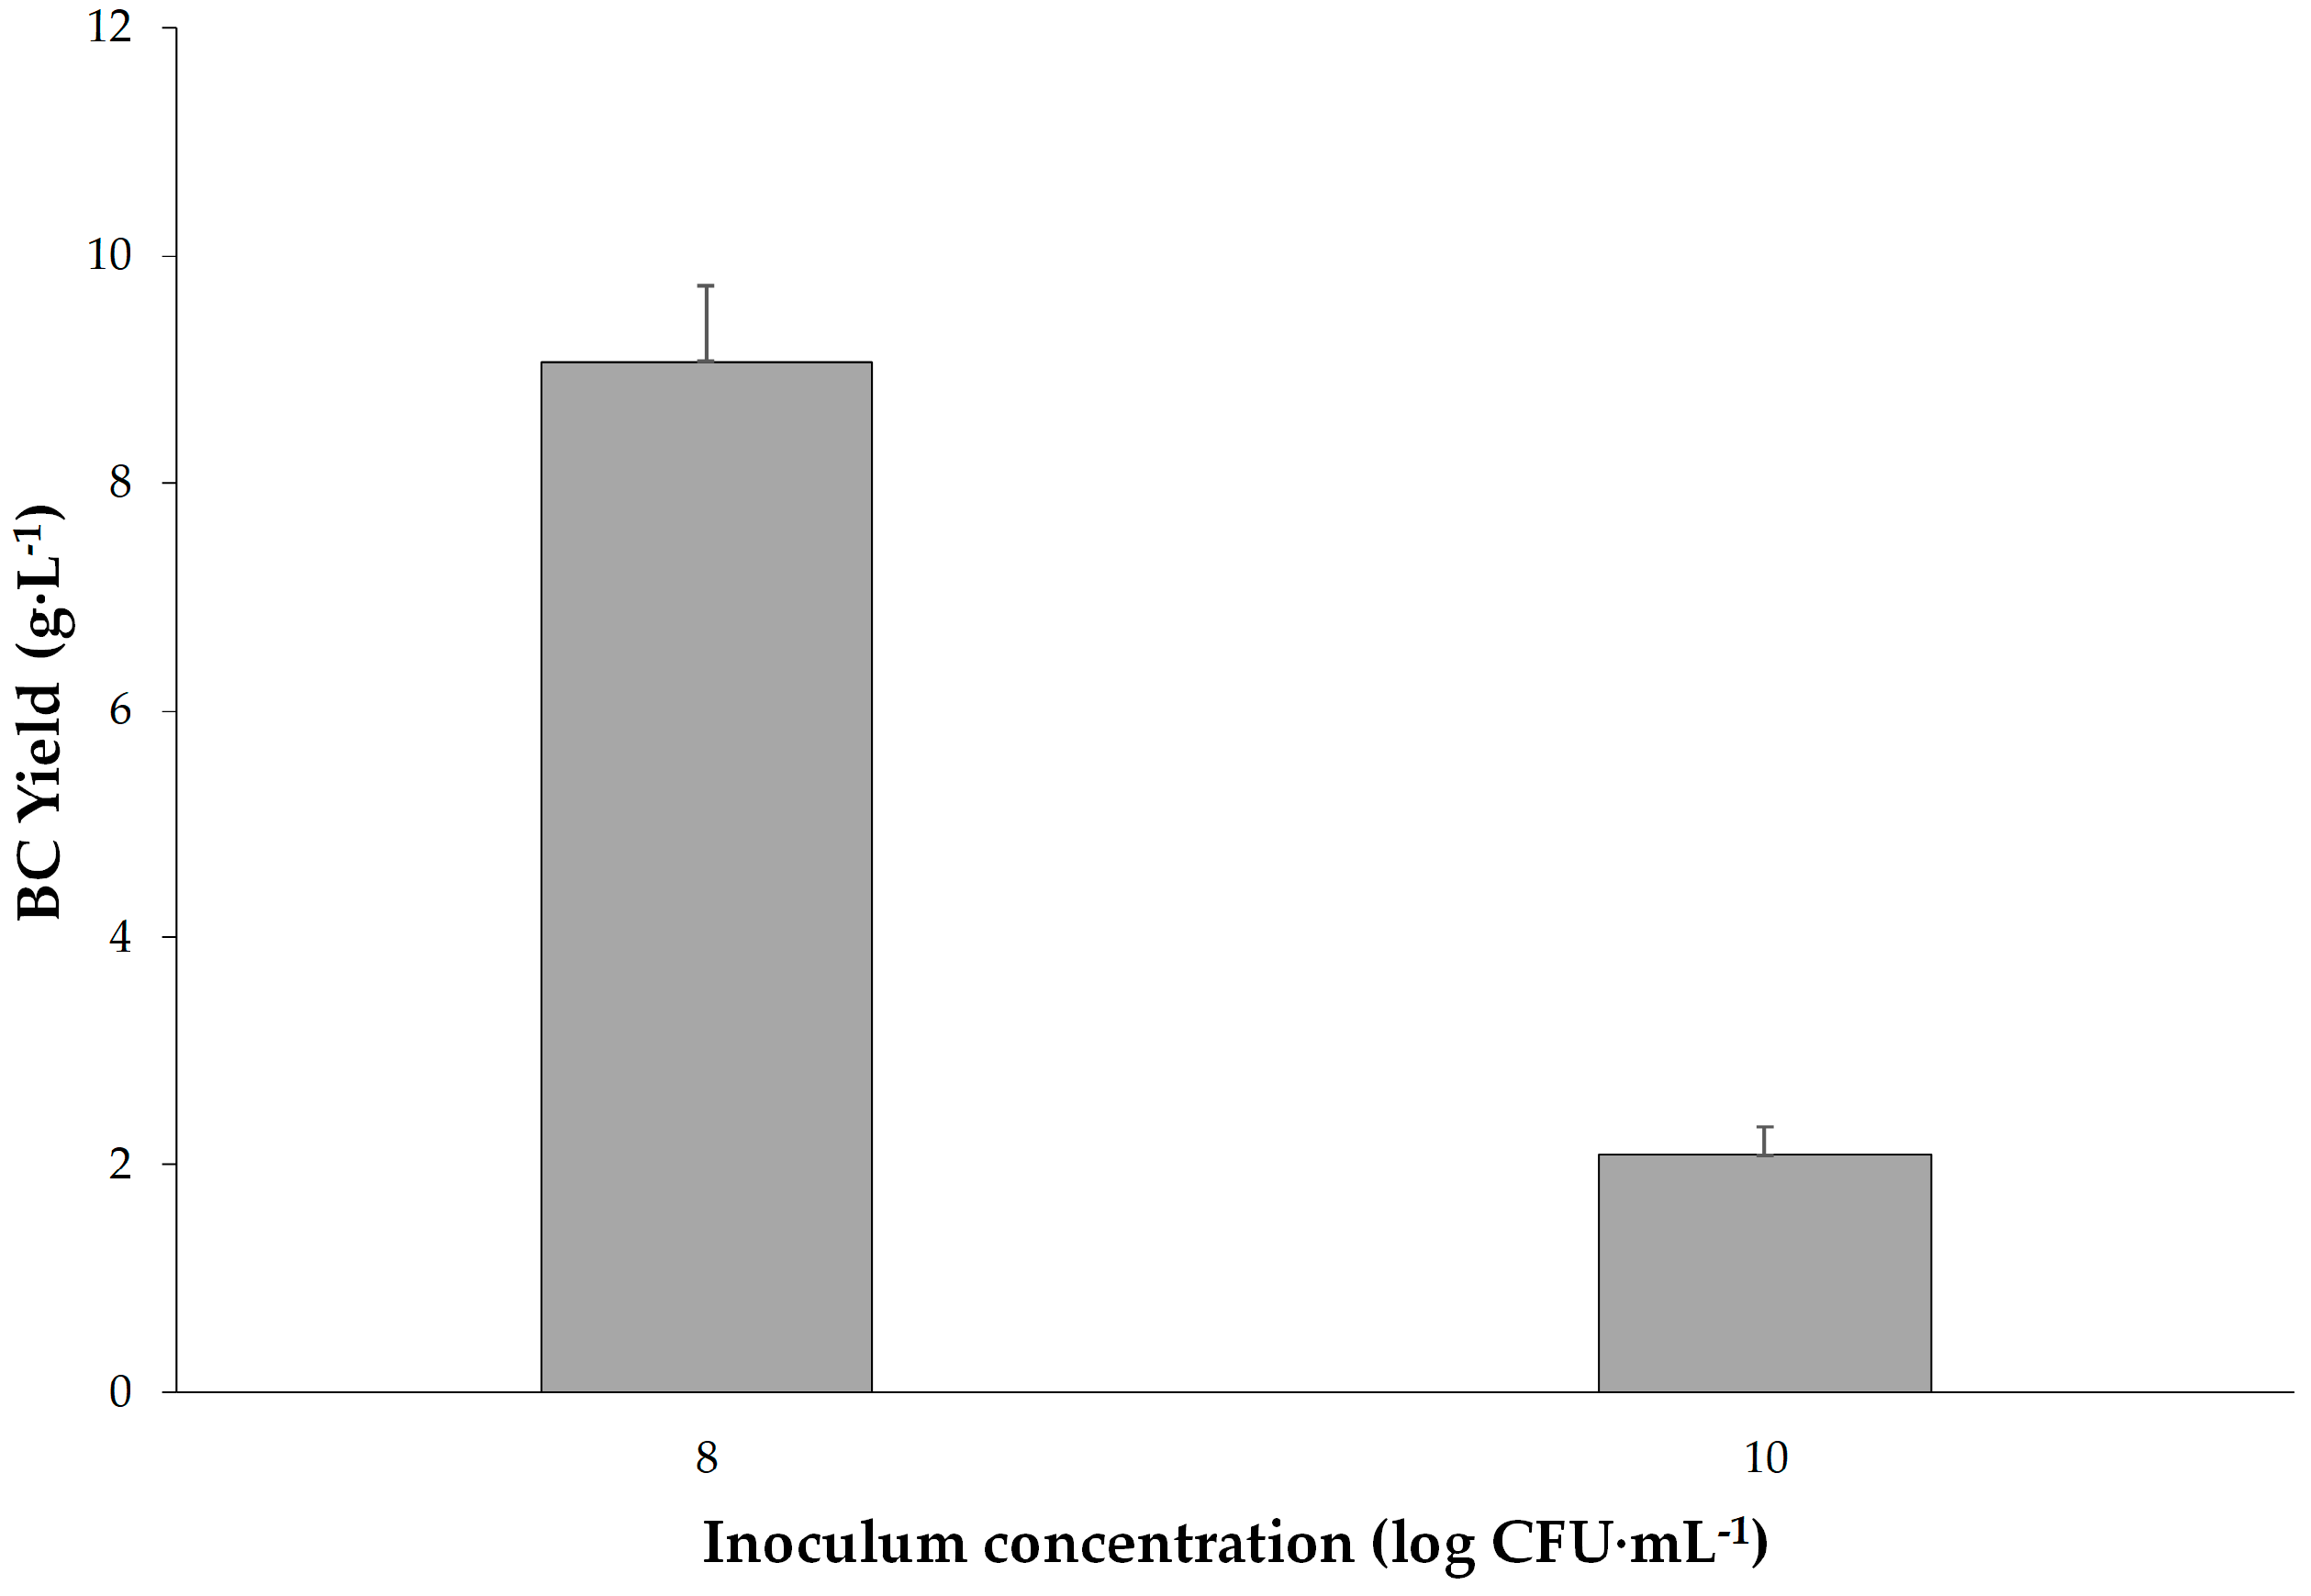
The optimal conditions for maximum BC production were found to be 32 °C, pH 5.5, 8 log CFU·mL−1 inoculum concentration and 14 days of incubation. Under these conditions, a remarkable BC production of 9.1 ± 0.66 g·L−1 (dry weight) was achieved. This BC yield obtained in this study significantly surpasses yields reported for other strains of K. rhaeticus and even outperforms various BC producer strains. This suggests the high potential of K. rhaeticus K23 for large-scale BC production, presenting economic and environmental advantages over traditional methods of cellulose extraction [3,4,5,6,7,8].
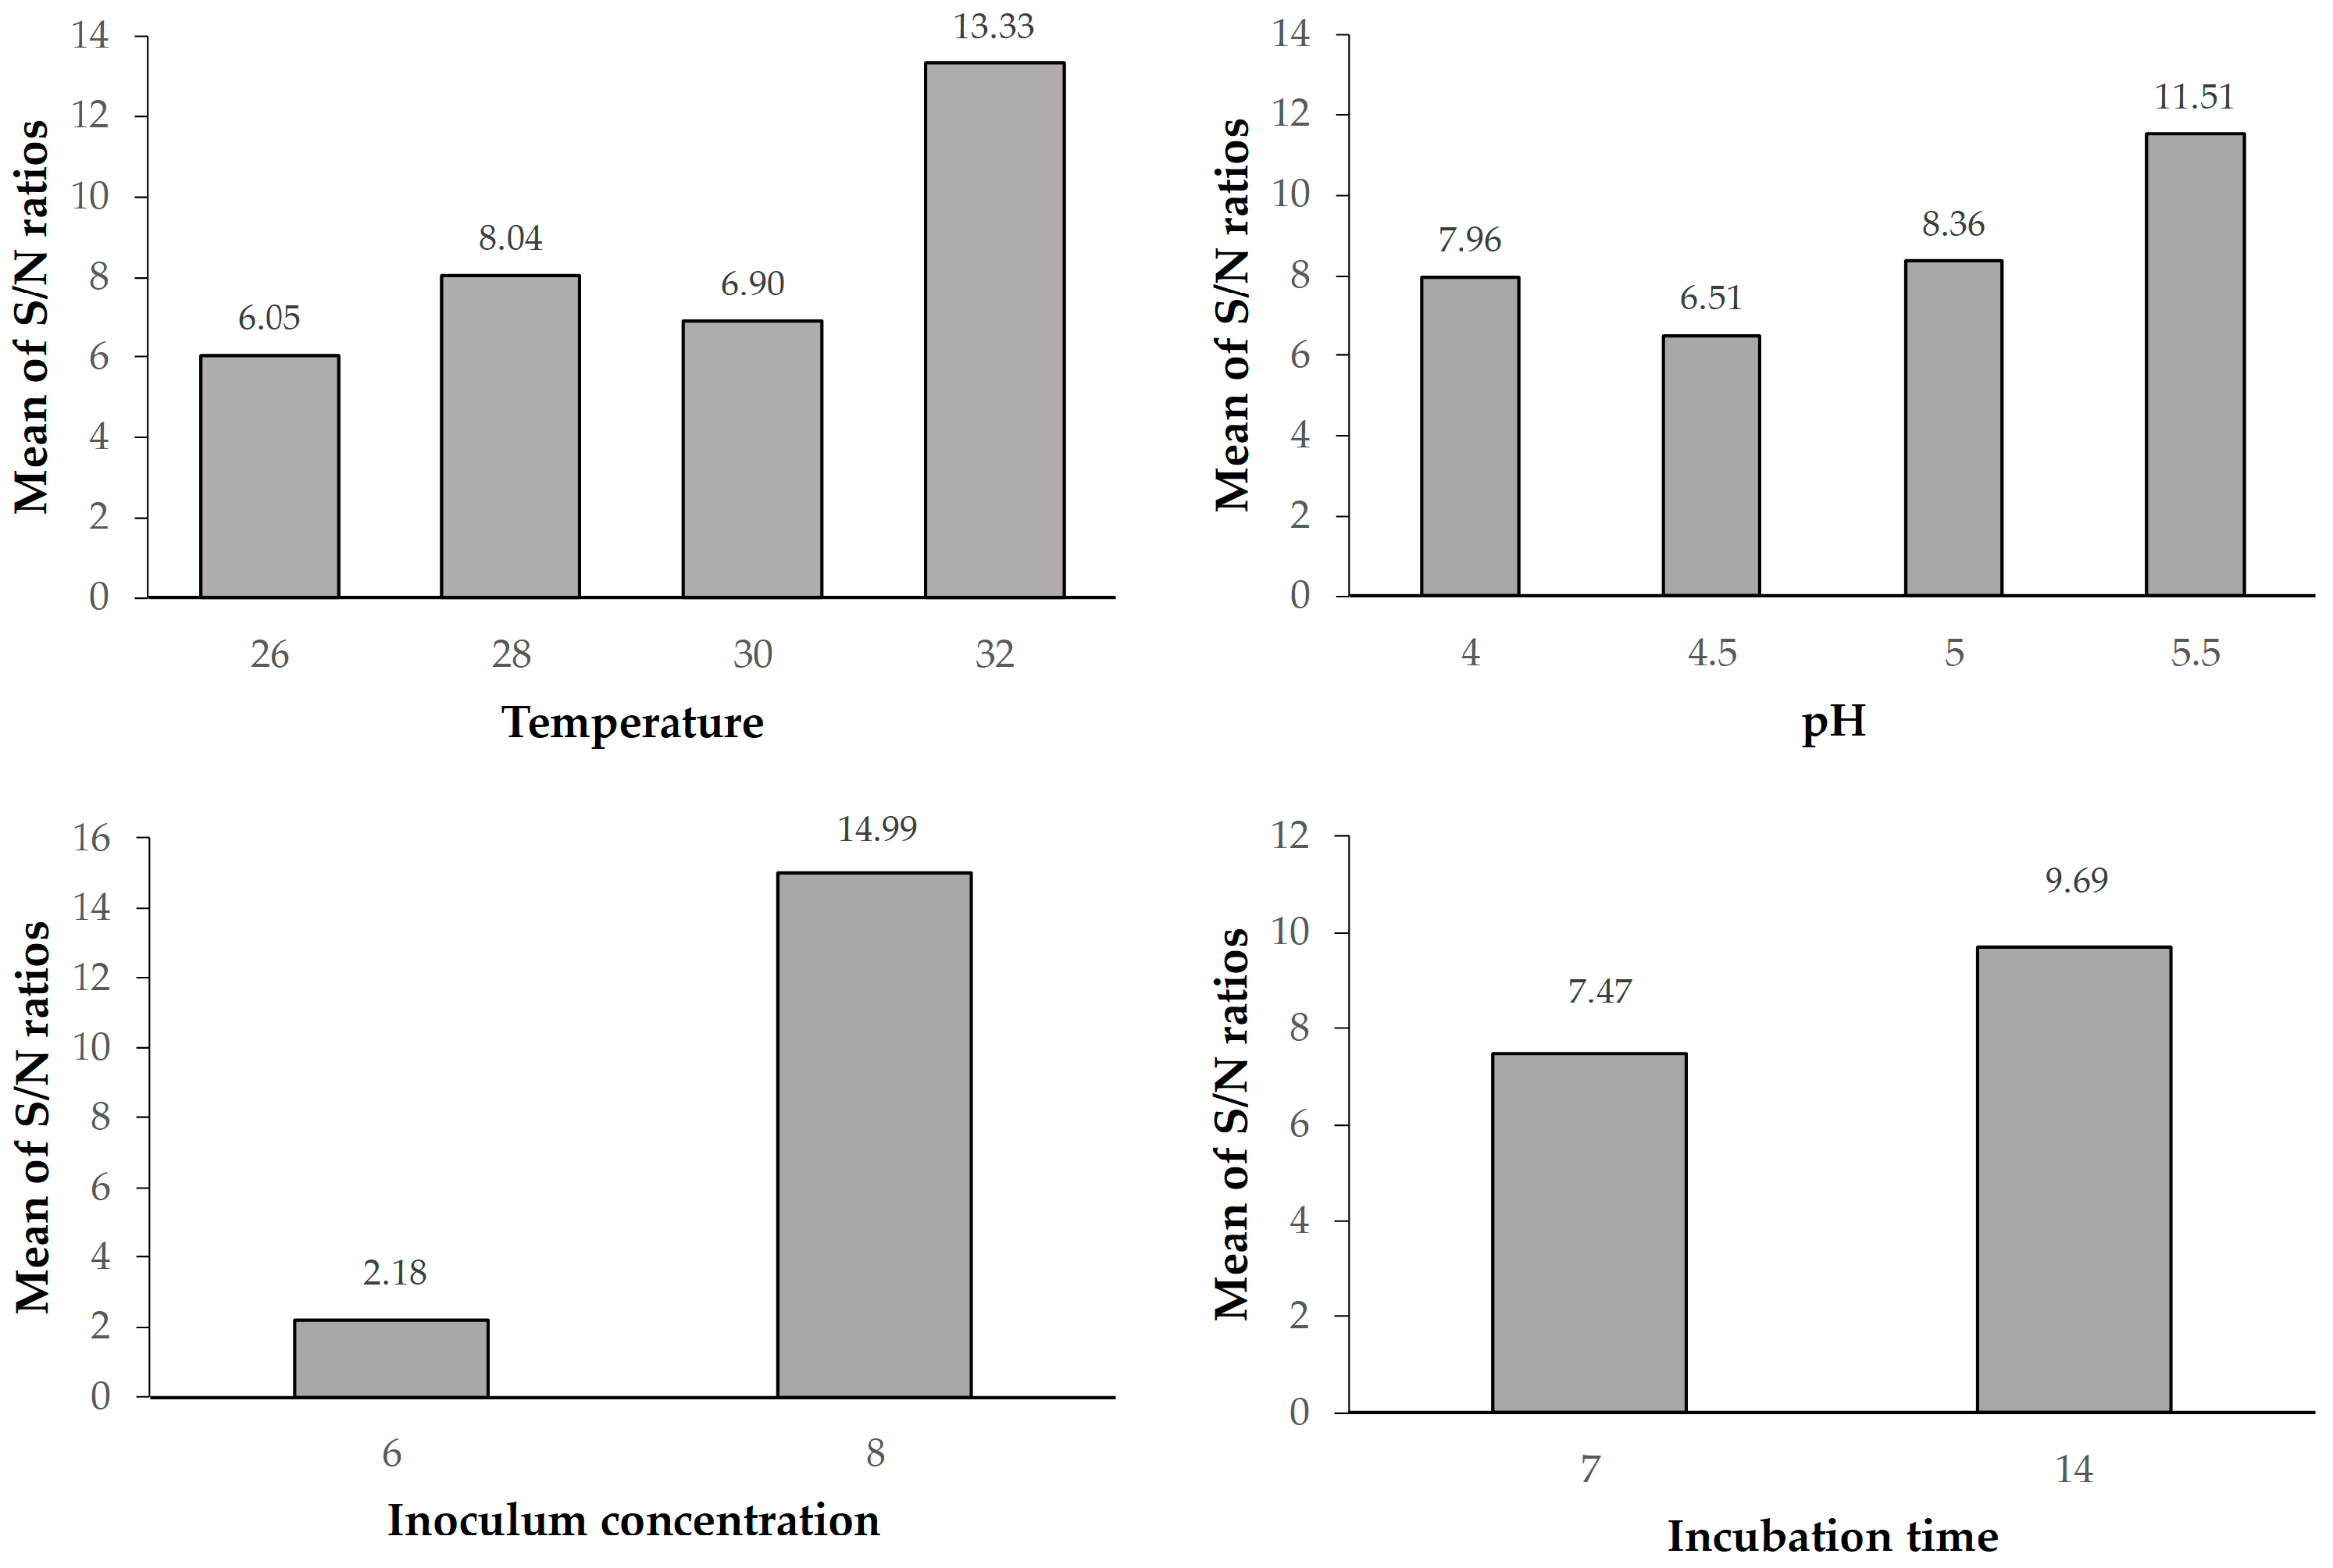
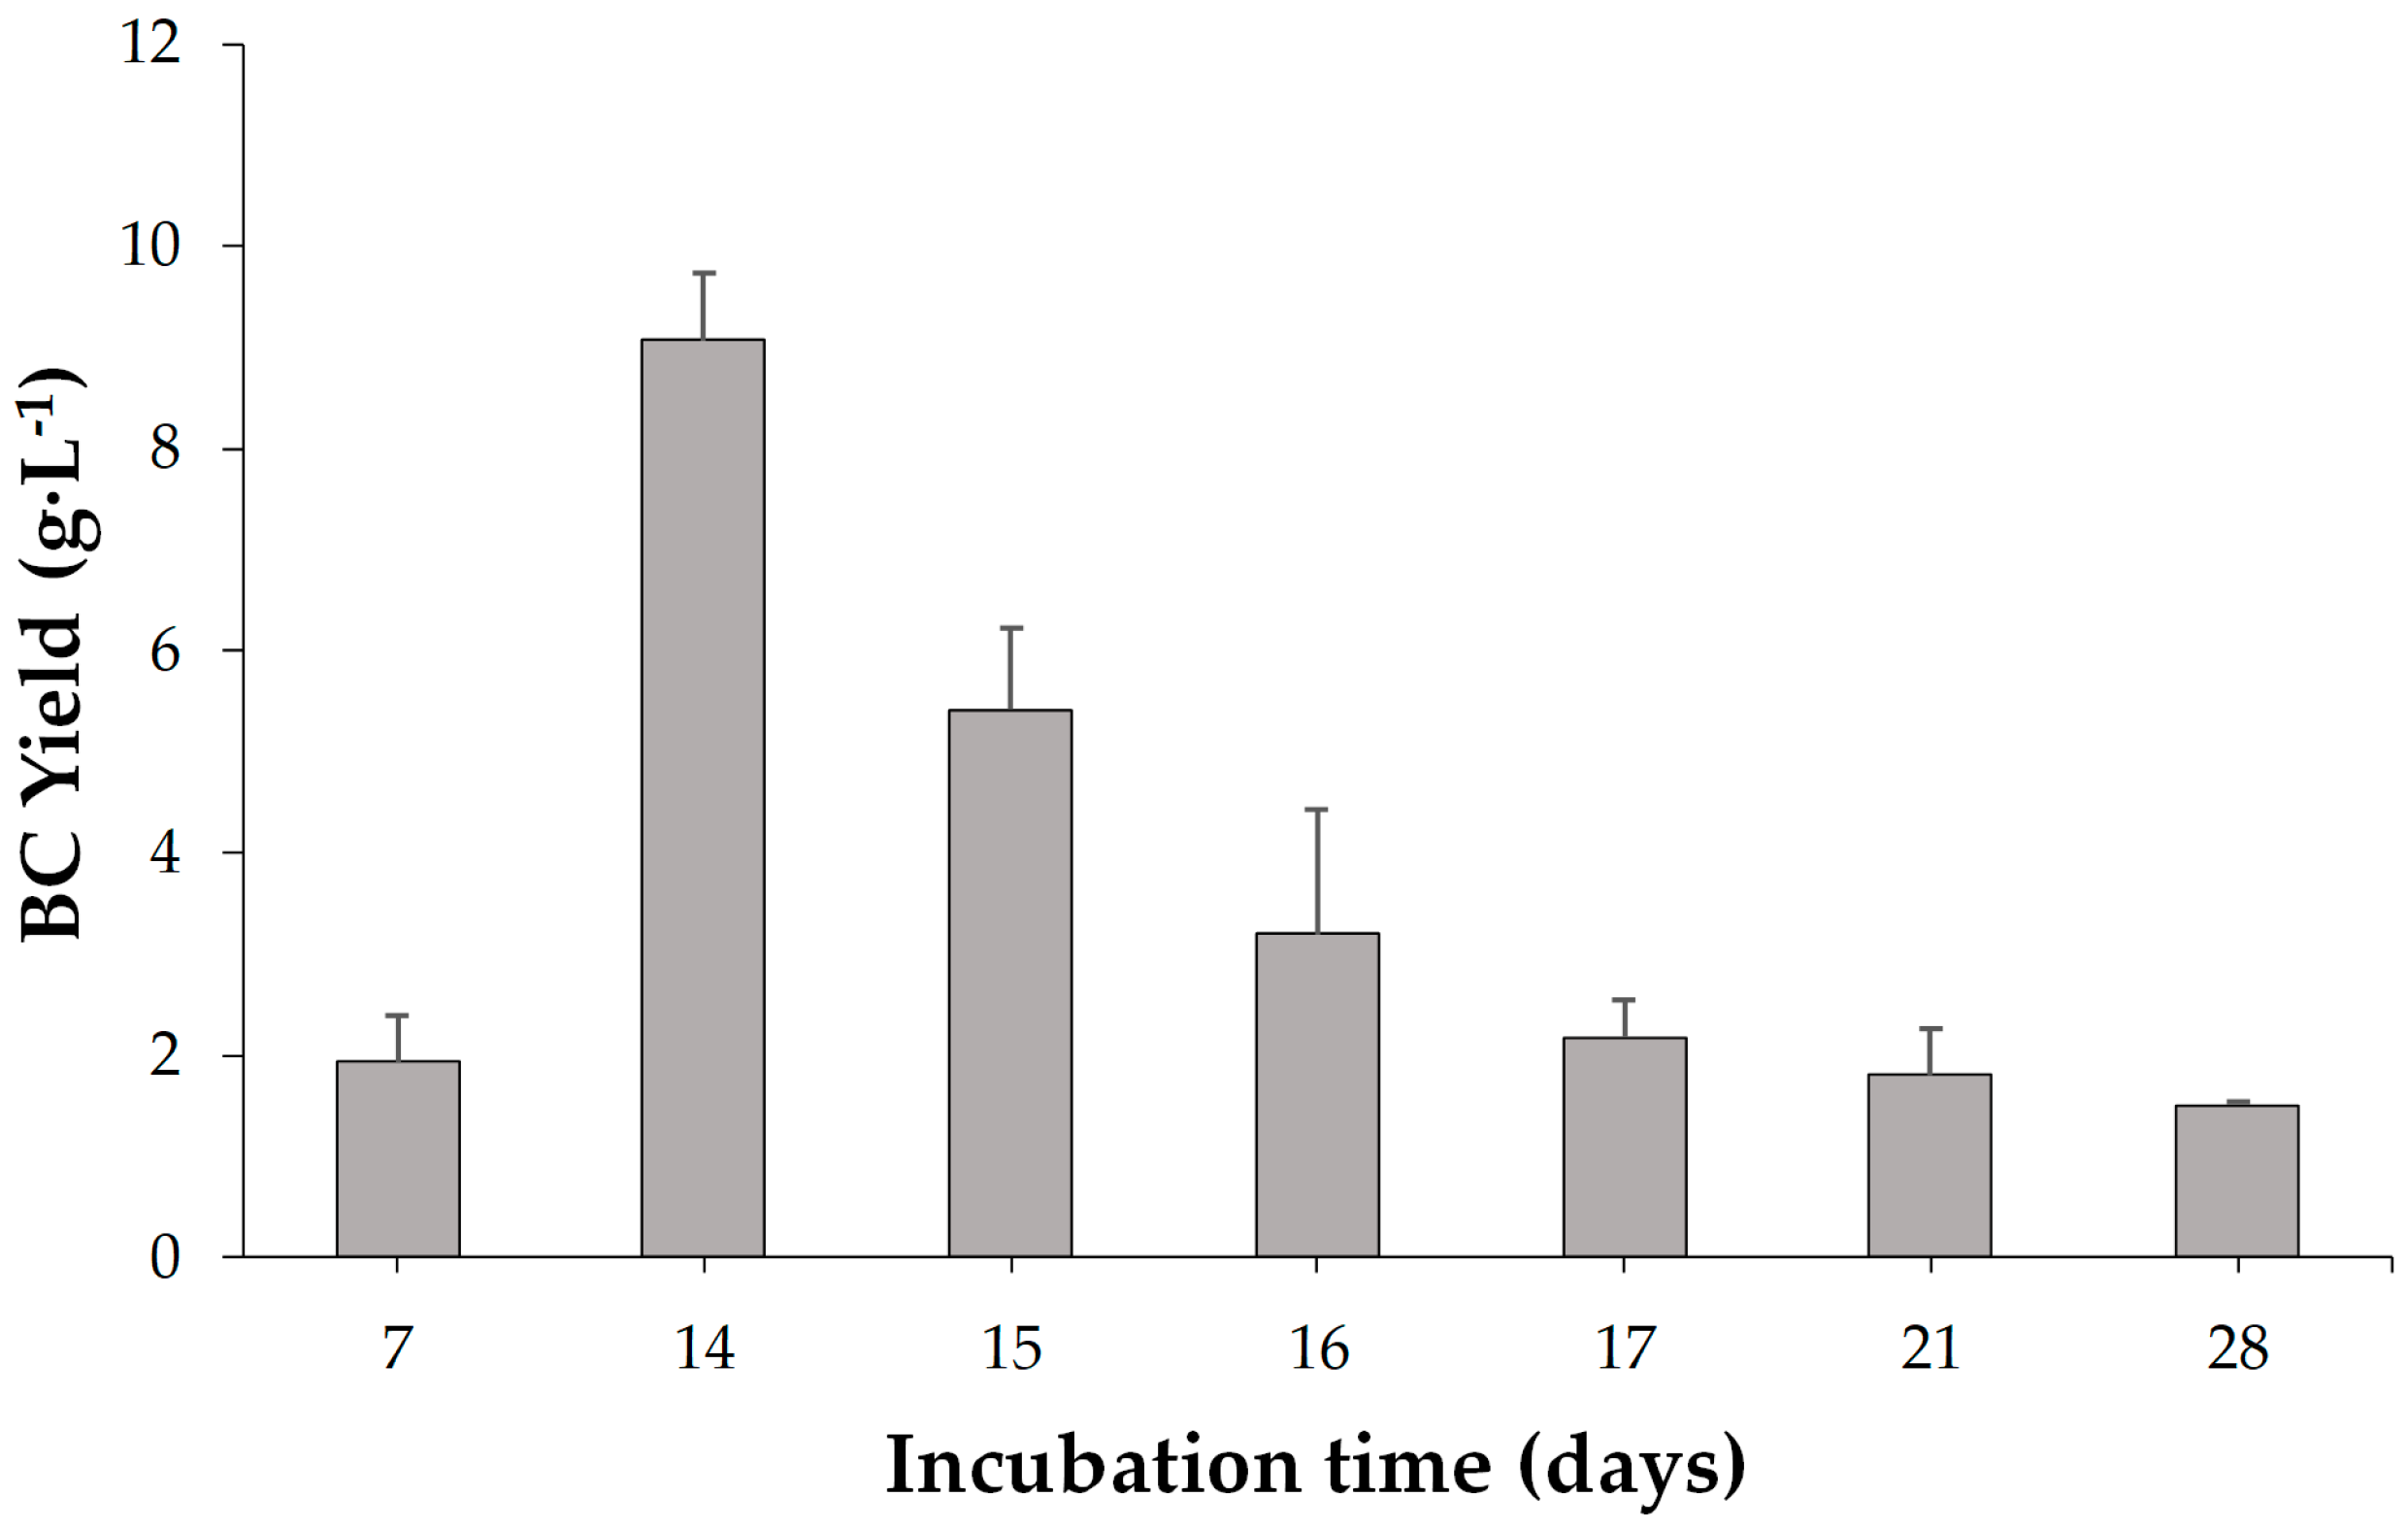
Temperature and pH are critical factors affecting bacterial growth and cellulose synthesis. The highest BC production occurred at 32 °C, aligning with previous studies suggesting the optimal temperature range for K. rhaeticus. Similarly, pH 5.5 was identified as the most favorable condition. The incubation time significantly impacted BC production, with the highest yield observed at 14 days. Extended incubation periods beyond this optimal point led to a decline in BC production, possibly due to the accumulation of metabolic byproducts inhibiting cellulose synthesis. This finding aligns with literature reports suggesting that BC production reaches a plateau after a certain period, emphasizing the importance of efficient harvesting.
Inoculum concentration (Factor C) was determined as the most significant factor affecting BC production (F = 49.63). Higher inoculum concentrations were associated with increased BC yield up to a certain point, after which diminishing returns were observed. This highlights the importance of balancing microbial population density for optimal cellulose synthesis in order to improve the efficiency of biological production. These results could be a fundamental step for the industrial-scale production of bacterial cellulose. Further research could explore downstream processing methods to enhance and add various properties to BC such as antibacterial and explore its diverse applications in pharmaceuticals, membranes, drug carriers, and nanotechnology.
Temperature was an important parameter in BC production by K. rhaeticus. The lowest BC production by K. rhaeticus K23 was recorded at 26 °C and the maximum production was obtained at 32 °C (Figure 3). Many researchers have found that the optimum growth temperature for biocellulose production is 30 °C [38,39,40,41]. However, this may be due to the strains which they used in their studies (Acetobacter sp. and K. saccharivorans) and the tested ranges of temperature. Ye et al. [26] reported an optimal range of BC production by K. rhaeticus to be 28 to 32 °C, in parallel with our findings. As a result, the impact of temperature on K. rhaeticus K23’s ability to manufacture BC is consistent with previous findings that suggested that the BC producers have a comparable degree of environmental flexibility.
The pH value of growth medium also plays an important role in the production of BC, since it effects enzyme activity, influencing the bacterial growth [42]. The lowest production by K. rhaeticus K23 was recorded at pH 4.5 and the largest amount of BC yield was obtained at pH 5.5. These results are similar to the findings of Ye et al. [26] who reported the optimum pH for BC production by K. rhaeticus K23 to be pH 5.5.
The yield of BC by K. rhaeticus K23 in this study, which was 9.1 g·L−1, is not only higher than by other strains of K. rhaeticus, but also much higher than by other BC producer strains. For example, another variant of the BC producer strains belonging to the same genus, namely K. saccharivorans BC-1, has been reported to give the concentration of cellulose as 5.1 g·L−1 [41]. After seven days of incubation, the amounts of BC produced by five strains of K. xylinus from different kinds of carbon sources were measured [43]. According to Singhsa et al. [43], the bacterial strains K. xylinus KX (1.14–1.84 g·L−1) and K. xylinus K975 (1.11–1.55 g·L−1) were similarly able to produce the greatest amount of BC membranes in all carbon sources, followed by K. xylinus K1011 (0.57–1.46 g·L−1). Similarly, Volova et al. [44] found the highest BC yield to be 2.2 g·L−1 which was obtained with K. xylinus B-12068 cells cultivated for 7 days in HS medium containing glucose. In another study, K. hansenii was used as a BC producer strain and the maximum obtained BC production was 4.46 g·L−1 [45]. Although it is difficult to precisely compare the yield between a variety of experimental designs, considering different strains and incubation conditions including pH, temperature and incubation time, comparison of BC production (g·L−1) using HS medium revealed that our strain provides the highest yield among these closely related published data.
Frequently, reports indicate that the greatest increase in the weight of BC takes place after 7–8 days [46,47,48]. According to Raghunathan [49], BC production begins after 24 h of incubation and reaches its highest level after 10 days. Similar results were also obtained by Ye et al. [26] who have tested BC production over different time periods by K. rhaeticus K23 and showed that the BC production reached a plateau between 10 and 12 days. However, the results of most researchers’ efforts to determine the maximum production time are not very reliable because incubation periods longer than 10 days have generally not been studied. The properties of BC produced by K. rhaeticus K23 were evaluated by means of morphology, chemical structure, water-holding capacity and mechanical properties. The fibers in the BC network are homogenous with fibrils oriented in the three-dimensional network. The fibers are intertwined with each other, leading to the formation of interconnected porous networks. The chemical structure of the BC was revealed by ATR-FTIR spectra which showed very similar absorption peaks to those in previous reports [30,32]. Tests on water-holding capacity revealed similar results with He et al. [32] (100 ± 4%). The water-holding capacity was slightly higher than found in Rouhi et al. [50] (96.6 g/g) and Machado et al. [28] (70 g/g). The high water-holding capacity of BC is valuable since it is necessary for several application fields, especially in biomedical applications including wound dressing and tissue engineering [51,52]. The results of tensile strength of BC were slightly higher than generated by He et al. [32] (tensile strength 70.4 ± 6.9). On the other hand, Young’s modulus of BC produced in HS medium by K. rhaeticus K23 was almost 25 times and tensile strength was 2.5 times higher than BC produced in studies of [53] (tensile strength 17.09 MPa and Young’s modulus 217.77 MPa). The results showed lower tensile strength (62 MPa) and higher Young’s modulus (1.06 GPa) compared to studies by Rouhi et al. [50]. Multiple research studies have documented the variability in bacterial cellulose (BC) crystallinity, ranging from 46.7 to 91.62%, with its degree often influenced by the culture medium, particularly the carbon and nitrogen sources employed [44]. The results suggest that BC produced by K. rhaeticus K23 exhibits a typical crystalline form of cellulose I in agreement with the previously reported other Komagataeibacter strains [26,30].
In conclusion, this study demonstrates the successful optimization of BC production by K. rhaeticus K23, shedding light on the importance of cultivation parameters. The findings contribute to the ongoing efforts to harness the potential of BC as a sustainable and versatile biomaterial.

5. Conclusions

In this study, a Gram-negative bacterial strain “Komagataeibacter rhaeticus strain K23”, isolated from Kombucha tea, was investigated for its bio-cellulose polymer production ability. Moreover, the culture conditions of the bacterium for maximum BC production were also optimized. For the first time, the Taguchi methods were used for investigating the optimum parameters for a potential BC-producing strain, K. rhaeticus K23. The hypothesis of the study was, “pH, temperature, inoculum concentration and incubation period have equal levels of effect on BC production”. It has been observed that among the tested parameters, the most significant parameter is the inoculum concentration, followed by temperature and pH. The dry weight of BC obtained with parameters optimized by the Taguchi design in HS medium was 9.1 ± 0.66 g·L−1, significantly higher than that reported previously. On the other hand, the chemical structure, water-holding capacity and mechanical properties of the biosynthesized BC were similar to previously reported data. The physicochemical properties of the BC membrane produced by K. rhaeticus with HS medium were analyzed via FTIR, XRD, SEM, water-holding capacity and mechanical analysis techniques. The results for morphology, chemical structure, water-holding capacity and mechanical properties displayed similar features to those obtained from using conventional Hestrin‒Schramm medium. Morphological analysis showed a three-dimensional network of BC nanofibers. Our results strongly indicate that this strain could give rise to valuable biomedical products of commercial importance. Further studies could be carried out using supplementary additives, and new properties can be imparted by combining them with various materials tailored to the intended application.

Author Contributions

Conceptualization, H.Ö.; Data curation, H.Ö.; Formal analysis, C.U.; Funding acquisition, H.Ö.; Investigation, C.U.; Methodology, C.U. and H.Ö.; Project administration, C.U.; Resources, C.U.; Software, H.Ö.; Supervision, H.Ö.; Visualization, H.Ö.; Writing—original draft, C.U.; Writing—review & editing, H.Ö. All authors have read and agreed to the published version of the manuscript.

Funding

C. Uğurel was supported by TUBITAK-BIDEB 2211-C National PhD Scholarship Program for Priority Areas.

Institutional Review Board Statement

Not applicable.

Data Availability Statement

Data are contained within the article.

Conflicts of Interest

The authors declare no conflicts of interest.

References

  1. Lynd, L.R.; Weimer, P.J.; Van Zyl, W.H.; Pretorius, I.S. Microbial cellulose utilization: Fundamentals and biotechnology. Microbiol. Mol. Biol. Rev. 2002, 66, 506–577. [Google Scholar] [CrossRef]
  2. Klemm, D.; Heublein, B.; Fink, H.P.; Bohn, A. Cellulose: Fascinating biopolymer and sustainable raw material. Angew. Chem. Int. Ed. 2005, 44, 3358–3393. [Google Scholar] [CrossRef]
  3. Dos Santos, S.; Cardoso, R.; Borges, Í.M.P.; Almeida, A.C.; Andrade, E.S.; Ferreira, I.O.; do Carmo Ramos, L. Post-harvest losses of fruits and vegetables in supply centers in Salvador, Brazil: Analysis of determinants, volumes and reduction strategies. Waste Manag. 2020, 101, 161–170. [Google Scholar] [CrossRef]
  4. Dai, H.; Ou, S.; Huang, Y.; Huang, H. Utilization of pineapple peel for production of nanocellulose and film application. Cellulose 2018, 25, 1743–1756. [Google Scholar] [CrossRef]
  5. Salari, M.; Khiabani, M.S.; Mokarram, R.R.; Ghanbarzadeh, B.; Kafil, H.S. Preparation and characterization of cellulose nanocrystals from bacterial cellulose produced in sugar beet molasses and cheese whey media. Int. J. Biol. Macromol. 2019, 122, 280–288. [Google Scholar] [CrossRef]
  6. Gross, R.A.; Scholz, C. Biopolymers from Polysaccharides and Agroproteins; ACS Publications: Washington, DC, USA, 2001. [Google Scholar]
  7. Nishi, Y.; Uryu, M.; Yamanaka, S.; Watanabe, K.; Kitamura, N.; Iguchi, M.; Mitsuhashi, S. The structure and mechanical properties of sheets prepared from bacterial cellulose: Part 2 Improvement of the mechanical properties of sheets and their applicability to diaphragms of electroacoustic transducers. J. Mater. Sci. 1990, 25, 2997–3001. [Google Scholar] [CrossRef]
  8. Dahman, Y. Nanostructured biomaterials and biocomposites from bacterial cellulose nanofibers. J. Nanosci. Nanotechnol. 2009, 9, 5105–5122. [Google Scholar] [CrossRef]
  9. Ma, T.; Ji, K.; Wang, W.; Wang, J.; Li, Z.; Ran, H.; Liu, B.; Li, G. Cellulose synthesized by Enterobacter sp. FY-07 under aerobic and anaerobic conditions. Bioresour. Technol. 2012, 126, 18–23. [Google Scholar] [CrossRef]
  10. Klemm, D.; Kramer, F.; Moritz, S.; Lindström, T.; Ankerfors, M.; Gray, D.; Dorris, A. Nanocelluloses: A new family of naturemily of Natureaturangewandte. Chem. Int. Ed. 2011, 50, 5438–5466. [Google Scholar] [CrossRef]
  11. Huang, Y.; Zhu, C.; Yang, J.; Nie, Y.; Chen, C.; Sun, D. Recent advances in bacterial cellulose. Cellulose 2014, 21, 1–30. [Google Scholar] [CrossRef]
  12. Morgan, J.L.; Strumillo, J.; Zimmer, J. Crystallographic snapshot of cellulose synthesis and membrane translocation. Nature 2013, 493, 181–186. [Google Scholar] [CrossRef]
  13. Shah, N.; Ul-Islam, M.; Khattak, W.A.; Park, J.K. Overview of bacterial cellulose composites: A multipurpose advanced material. Carbohydr. Polym. 2013, 98, 1585–1598. [Google Scholar] [CrossRef]
  14. Yousefi, H.; Faezipour, M.; Hedjazi, S.; Mousavi, M.M.; Azusa, Y.; Heidari, A.H. Comparative study of paper and nanopaper properties prepared from bacterial cellulose nanofibers and fibers/ground cellulose nanofibers of canola straw. Ind. Crops Prod. 2013, 43, 732–737. [Google Scholar] [CrossRef]
  15. Lee, K.-Y.; Buldum, G.; Mantalaris, A.; Bismarck, A. More Than Meets the Eye in Bacterial Cellulose: Biosynthesis, Bioprocessing, and Applications in Advanced Fiber Composites. Macromol. Biosci. 2014, 14, 10–32. [Google Scholar] [CrossRef]
  16. Noro, N.; Sugano, Y.; Shoda, M. Utilization of the buffering capacity of corn steep liquor in bacterial cellulose production by Acetobacter xylinum. Appl. Microbiol. Biotechnol. 2004, 64, 199–205. [Google Scholar] [CrossRef]
  17. Hutchens, S.A.; Leon, R.V.; O’Neill, H.M.; Evans, B.R. Statistical analysis of optimal culture conditions for Gluconacetobacter hansenii cellulose production. Lett. Appl. Microbiol. 2006, 44, 175–180. [Google Scholar] [CrossRef]
  18. Bagewadi, Z.K.; Dsouza, V.; Yaraguppi, D.A.; Mulla, S.I.; Deshpande, S.H.; Shettar, S.S. Low cost production of bacterial cellulose through statistical optimization and developing its composites for multipurpose applications. Process. Biochem. 2023, 125, 47–60. [Google Scholar] [CrossRef]
  19. Calderón-Toledo, S.; Horue, M.; Alvarez, V.A.; Castro, G.R.; Zavaleta, A.I. Isolation and partial characterization of Komagataeibacter sp. SU12 and optimization of bacterial cellulose production using Mangifera indica extracts. J. Chem. Technol. Biotechnol. 2022, 97, 1482–1493. [Google Scholar] [CrossRef]
  20. Uray, E.; Carbas, S.; Geem, Z.W.; Kim, S. Parameters Optimization of Taguchi Method Integrated Hybrid Harmony Search Algorithm for Engineering Design Problems. Mathematics 2022, 10, 327. [Google Scholar] [CrossRef]
  21. Alavi-Borazjani, S.A.; da Cruz Tarelho, L.A.; Capela, M.I. Parametric optimization of the dark fermentation process for enhanced biohydrogen production from the organic fraction of municipal solid waste using Taguchi method. Int. J. Hydrogen Energy 2021, 46, 21372–21382. [Google Scholar] [CrossRef]
  22. Bastani, M.; Jahan, A. Integration of Taguchi-simulation method for improving banking services. Sustain. Oper. Comput. 2021, 2, 107–114. [Google Scholar] [CrossRef]
  23. Taiwo, A.E.; Madzimbamuto, T.N.; Ojumu, T.V. Optimization of process variables for acetoin production in a bioreactor using Taguchi orthogonal array design. Heliyon 2020, 6, e05103. [Google Scholar] [CrossRef]
  24. Hestrin, S.; Schramm, M. Synthesis of cellulose by Acetobacter xylinum. 2. Preparation of freeze-dried cells capable of polymerizing glucose to cellulose. Biochem. J. 1954, 58, 345. [Google Scholar] [CrossRef]
  25. Abellan-Schneyder, I.; Matchado, M.S.; Reitmeier, S.; Sommer, A.; Sewald, Z.; Baumbach, J.; List, M.; Neuhaus, K. Primer, Pipelines, Parameters: Issues in 16S rRNA Gene Sequencing. MSphere 2021, 6, e01202-20. [Google Scholar] [CrossRef]
  26. Ye, J.; Li, J.; Wang, Q.; Wang, X.; Wang, S.; Wang, H.; Xu, J. Bacterial cellulose production by a strain of Komagataeibacter rhaeticus isolated from residual loquat. Appl. Microbiol. Biotechnol. 2023, 107, 1551–1562. [Google Scholar] [CrossRef]
  27. Sharan, M.; Dhaka, P.; Bedi, J.S.; Singh, R.; Mehta, N. Characterization of chicken eggs associated Escherichia coli and Staphylococcus aureus for biofilm production and antimicrobial resistance traits. Anim. Biotechnol. 2023, 34, 3533–3544. [Google Scholar] [CrossRef]
  28. Machado, R.T.; Gutierrez, J.; Tercjak, A.; Trovatti, E.; Uahib, F.G.; de Padua Moreno, G.; Nascimento, A.P.; Berreta, A.A.; Ribeiro, S.J.; Barud, H.S. Komagataeibacter rhaeticus as an alternative bacteria for cellulose production. Carbohydr. Polym. 2016, 152, 841–849. [Google Scholar] [CrossRef]
  29. Shezad, O.; Khan, S.; Khan, T.; Park, J.K. Physicochemical and mechanical characterization of bacterial cellulose produced with an excellent productivity in static conditions using a simple fed-batch cultivation strategy. Carbohydr. Polym. 2010, 82, 173–180. [Google Scholar] [CrossRef]
  30. Thorat, M.N.; Dastager, S.G. High yield production of cellulose by a Komagataeibacter rhaeticus PG2 strain isolated from pomegranate as a new host. RSC Adv. 2018, 8, 29797–29805. [Google Scholar] [CrossRef]
  31. Lovrić, M.; Pavlović, K.; Žuvela, P.; Spataru, A.; Lučić, B.; Kern, R.; Wong, M.W. Machine learning in prediction of intrinsic aqueous solubility of drug-like compounds: Generalization, complexity, or predictive ability? J. Chemom. 2021, 35, e3349. [Google Scholar] [CrossRef]
  32. He, X.; Meng, H.; Song, H.; Deng, S.; He, T.; Wang, S.; Wei, D.; Zhang, Z. Novel bacterial cellulose membrane biosynthesized by a new and highly efficient producer Komagataeibacter rhaeticus TJPU03. Carbohydr. Res. 2020, 493, 108030. [Google Scholar] [CrossRef] [PubMed]
  33. Roushdy, M.M.; El-Ghamery, A.A.; Hammad, A.A. Enhancement of Biocellulose Productivity through Optimization of Cultural Conditions and Gamma Radiation. Egypt. J. Biotechnol. 2016, 52. Available online: https://www.researchgate.net/profile/Dr-Mohamed-Roushdy/publication/324174535_ENHANCEMENT_OF_BIOCELLULOSE_PRODUCTIVITY_THROUGH_OPTIMIZATION_OF_CULTURAL_CONDITIONS_AND_GAMMA_RADIATION_BY/links/5ac3f8540f7e9becc9d495b5/ENHANCEMENT-OF-BIOCELLULOSE-PRODUCTIVITY-THROUGH-OPTIMIZATION-OF-CULTURAL-CONDITIONS-AND-GAMMA-RADIATION-BY.pdf (accessed on 11 March 2024).
  34. Semjonovs, P.; Ruklisha, M.; Paegle, L.; Saka, M.; Treimane, R.; Skute, M.; Rozenberga, L.; Vikele, L.; Sabovics, M.; Cleenwerck, I. Cellulose synthesis by Komagataeibacter rhaeticus strain P 1463 isolated from Kombucha. Appl. Microbiol. Biotechnol. 2017, 101, 1003–1012. [Google Scholar] [CrossRef] [PubMed]
  35. Yanti, N.A.; Ahmad, S.W.; Muhiddin, N.H. Evaluation of inoculum size and fermentation period for bacterial cellulose production from sago liquid waste. J. Phys. Conf. Ser. 2018, 1116, 052076. [Google Scholar] [CrossRef]
  36. Tsouko, E.; Kourmentza, C.; Ladakis, D.; Kopsahelis, N.; Mandala, I.; Papanikolaou, S.; Paloukis, F.; Alves, V.; Koutinas, A. Bacterial cellulose production from industrial waste and by-product streams. Int. J. Mol. Sci. 2015, 16, 14832–14849. [Google Scholar] [CrossRef]
  37. Mohite, B.V.; Patil, S.V. Physical, structural, mechanical and thermal characterization of bacterial cellulose by G. hansenii NCIM 2529. Carbohydr. Polym. 2014, 106, 132–141. [Google Scholar] [CrossRef]
  38. Son, H.J.; Heo, M.S.; Kim, Y.G.; Lee, S.J. Optimization of fermentation conditions for the production of bacterial cellulose by a newly isolated Acetobacter. Biotechnol. Appl. Biochem. 2001, 33, 1–5. [Google Scholar] [CrossRef]
  39. Pourramezan, G.; Roayaei, A.; Qezelbash, Q. Optimization of culture conditions for bacterial cellulose production by Acetobacter sp. 4B-2. Biotechnology 2009, 8, 150–154. [Google Scholar] [CrossRef]
  40. Zakaria, J.; Nazeri, M. Optimization of bacterial cellulose production from pineapple waste: Effect of temperature, pH and concentration. In Proceedings of the 5th Engineering Conference, “Engineering towards Change-Empowering Green Solutions”, Kuching, Sarawak, 10–12 July 2012. [Google Scholar]
  41. Gopu, G.; Govindan, S. Production of bacterial cellulose from Komagataeibacter saccharivorans strain BC1 isolated from rotten green grapes. Prep. Biochem. Biotechnol. 2018, 48, 842–852. [Google Scholar] [CrossRef]
  42. Kuo, S.-H.; Shen, C.-J.; Shen, C.-F.; Cheng, C.-M. Role of pH Value in Clinically Relevant Diagnosis. Diagnostics 2020, 10, 107. [Google Scholar] [CrossRef]
  43. Singhsa, P.; Narain, R.; Manuspiya, H. Physical structure variations of bacterial cellulose produced by different Komagataeibacter xylinus strains and carbon sources in static and agitated conditions. Cellulose 2018, 25, 1571–1581. [Google Scholar] [CrossRef]
  44. Volova, T.G.; Prudnikova, S.V.; Sukovatyi, A.G.; Shishatskaya, E.I. Production and properties of bacterial cellulose by the strain Komagataeibacter xylinus B-12068. Appl. Microbiol. Biotechnol. 2018, 102, 7417–7428. [Google Scholar] [CrossRef]
  45. Cielecka, I.; Ryngajłło, M.; Maniukiewicz, W.; Bielecki, S. Highly Stretchable Bacterial Cellulose Produced by Komagataeibacter hansenii SI1. Polymers 2021, 13, 4455. [Google Scholar] [CrossRef]
  46. Surma-Ślusarska, B.; Presler, S.; Danielewicz, D. Characteristics of bacterial cellulose obtained from Acetobacter xylinum culture for application in papermaking. Fibres Text. East. Eur. 2008, 16, 108–111. [Google Scholar]
  47. Castro, C.; Zuluaga, R.; Álvarez, C.; Putaux, J.-L.; Caro, G.; Rojas, O.J.; Mondragon, I.; Gañán, P. Bacterial cellulose produced by a new acid-resistant strain of Gluconacetobacter genus. Carbohydr. Polym. 2012, 89, 1033–1037. [Google Scholar] [CrossRef]
  48. Panesar, P.; Chavan, Y.; Bera, M.; Chand, O.; Kumar, H. Evaluation of Acetobacter strain for the production of microbial cellulose. Asian J. Chem 2009, 21, 99–102. [Google Scholar]
  49. Raghunathan, D. Production of microbial cellulose from the new bacterial strain isolated from temple wash waters. Int. J. Curr. Microbiol. Appl. Sci. 2013, 2, 275–290. [Google Scholar]
  50. Rouhi, M.; Khanchezar, S.; Babaeipour, V. Economical Optimization of Industrial Medium Culture for Bacterial Cellulose Production. Appl. Biochem. Biotechnol. 2023, 195, 2863–2881. [Google Scholar] [CrossRef] [PubMed]
  51. Portela, R.; Leal, C.R.; Almeida, P.L.; Sobral, R.G. Bacterial cellulose: A versatile biopolymer for wound dressing applications. Microb. Biotechnol. 2019, 12, 586–610. [Google Scholar] [CrossRef] [PubMed]
  52. Pang, M.; Huang, Y.; Meng, F.; Zhuang, Y.; Liu, H.; Du, M.; Ma, Q.; Wang, Q.; Chen, Z.; Chen, L.; et al. Application of bacterial cellulose in skin and bone tissue engineering. Eur. Polym. J. 2020, 122, 109365. [Google Scholar] [CrossRef]
  53. Amorim, L.F.A.; Li, L.; Gomes, A.P.; Fangueiro, R.; Gouveia, I.C. Sustainable bacterial cellulose production by low cost feedstock: Evaluation of apple and tea by-products as alternative sources of nutrients. Cellulose 2023, 30, 5589–5606. [Google Scholar] [CrossRef]
Figure 1. Image of (A) the BC membrane in culture media; (B) purified wet BC membrane; (C) dry BC membrane.
Fibers 12 00029 g001
Figure 2. SEM image of the BC membrane produced by K. rhaeticus K23 on the Hestrin‒Schramm media.
Fibers 12 00029 g002
Figure 3. Signal-to-noise (S/N) response graph for temperature, pH, inoculum concentration and incubation time.
Fibers 12 00029 g003
Figure 4. BC yield (g·L−1) in association with increasing initial inoculum doses of K. rhaeticus K23 when incubated for 7 days. Error bars represent 95% confidence intervals.
Fibers 12 00029 g004
Figure 5. BC yield (g·L−1) in association with increasing initial inoculum doses of K. rhaeticus K23 when incubated for 14 days. Error bars represent 95% confidence intervals.
Fibers 12 00029 g005
Figure 6. Effects of incubation time on BC production (g·L−1 dry weight) by K. rhaeticus K23 at solid culture state. Error bars represent 95% confidence intervals.
Fibers 12 00029 g006
Figure 7. ATR−FTIR spectra of BC produced by K. rhaeticus K23.
Fibers 12 00029 g007
Figure 8. XRD spectra of BC produced by K. rhaeticus K23.
Fibers 12 00029 g008
Table 1. Control factors and levels used in the Taguchi methods for optimal bacterial cellulose production.
FactorsLevels
1234
A: Temperature (°C)26283032
B: pH44.555.5
C: Inoculum conc. (log CFU·mL−1)68
D: Incubation time (days)714
Table 2. L16 Orthogonal array.
Experiment NoFactor AFactor BFactor CFactor D
11111
21222
31311
41422
52122
62211
72322
82411
93112
103221
113312
123421
134121
144212
154321
164412
Table 3. Results for dry weight BC production and S/N ratios for the bacterial cellulose concentration, g·L−1. Each parameter value was tested in triplicate.
Experiment NoSeriesAverageSNRA
123
17.218.756.127.3617.34
21.221.731.891.614.15
39.6810.706.929.1019.18
42.305.674.894.2912.64
50.580.991.541.040.32
62.275.176.084.5113.08
72.120.611.111.282.16
84.374.143.504.0012.05
93.213.785.454.1512.36
100.480.490.590.52−5.67
117.947.647.687.7517.79
123.511.931.832.427.69
132.260.690.741.231.81
146.294.105.485.2914.47
150.940.280.340.52−5.70
162.876.674.884.8113.64
SNRA: signal-to-noise ratio.
Table 4. Analysis of variance for BC production of tested parameters.
SourceDFAdj SSAdj MSF-Valuep-Value
Temperature320.3906.79674.650.0431
pH36.1332.04441.400.3205
Inoculum172.49472.493949.630.0002
Time10.0190.01900.010.9123
Error710.2251.4608
Total15109.262
Table 5. Model Summary.
SR-sqR-sq (adj)R-sq (pred)
1.2086390.64%79.95%51.11%
Table 6. Comparison of BC yields of different K. rhaeticus strains with K. rhaeticus K23.
Bacterial StrainBC Yield (g·L−1)Duration of Incubation (Days)Productivity (g·L−1·d−1)Reference
Komagataeibacter rhaeticus K239.10 a140.65Current study
Komagataeibacter rhaeticus TJPU038.28 b100.83[32]
Komagataeibacter rhaeticus AF-16.70 c41.68[28]
Komagataeibacter rhaeticus K4.00 d70.57[33]
Komagataeibacter rhaeticus PG24.00 d150.27[30]
Komagataeibacter rhaeticus LQ0017.91 b100.79[26]
Komagataeibacter rhaeticus P 14634.40 d50.88[34]
A chi-squared test was employed to compare yields from different reports. Values with different superscript letters in the same column indicate that they are statistically different (p < 0.05).
Table 7. Summary of extended experiments for increased inoculum concentration.
Inoculum Concentration (log CFU·mL−1)Incubation Time (Days)Dry Weight of BC (g·L−1)
820.116
8.520.156
920.456
9.520.314
1020.82
10.521.06
830.21
8.530.284
930.276
9.531.184
1031.992
10.531.665
840.656
8.540.502
941.024
9.541.1
1043.094
10.540.4
Table 8. Properties of BC produced by K. rhaeticus K23.
PropertiesBC
Water-holding capacity (%)98.8 ± 0.3
Tensile strength (MPa)44.1 ± 4.9
Elongation (%)1.5 ± 0.5
Young’s modulus (GPa)5.05 ± 0.6
Disclaimer/Publisher’s Note: The statements, opinions and data contained in all publications are solely those of the individual author(s) and contributor(s) and not of MDPI and/or the editor(s). MDPI and/or the editor(s) disclaim responsibility for any injury to people or property resulting from any ideas, methods, instructions or products referred to in the content.

