
Highly Efficient CeO2–CuCrO2 Composite Nanofibers Used for Electrochemical Detection of Dopamine in Biomedical Applications

 , and
, and
Abstract
:1. Introduction
2. Experimental
2.1. Materials
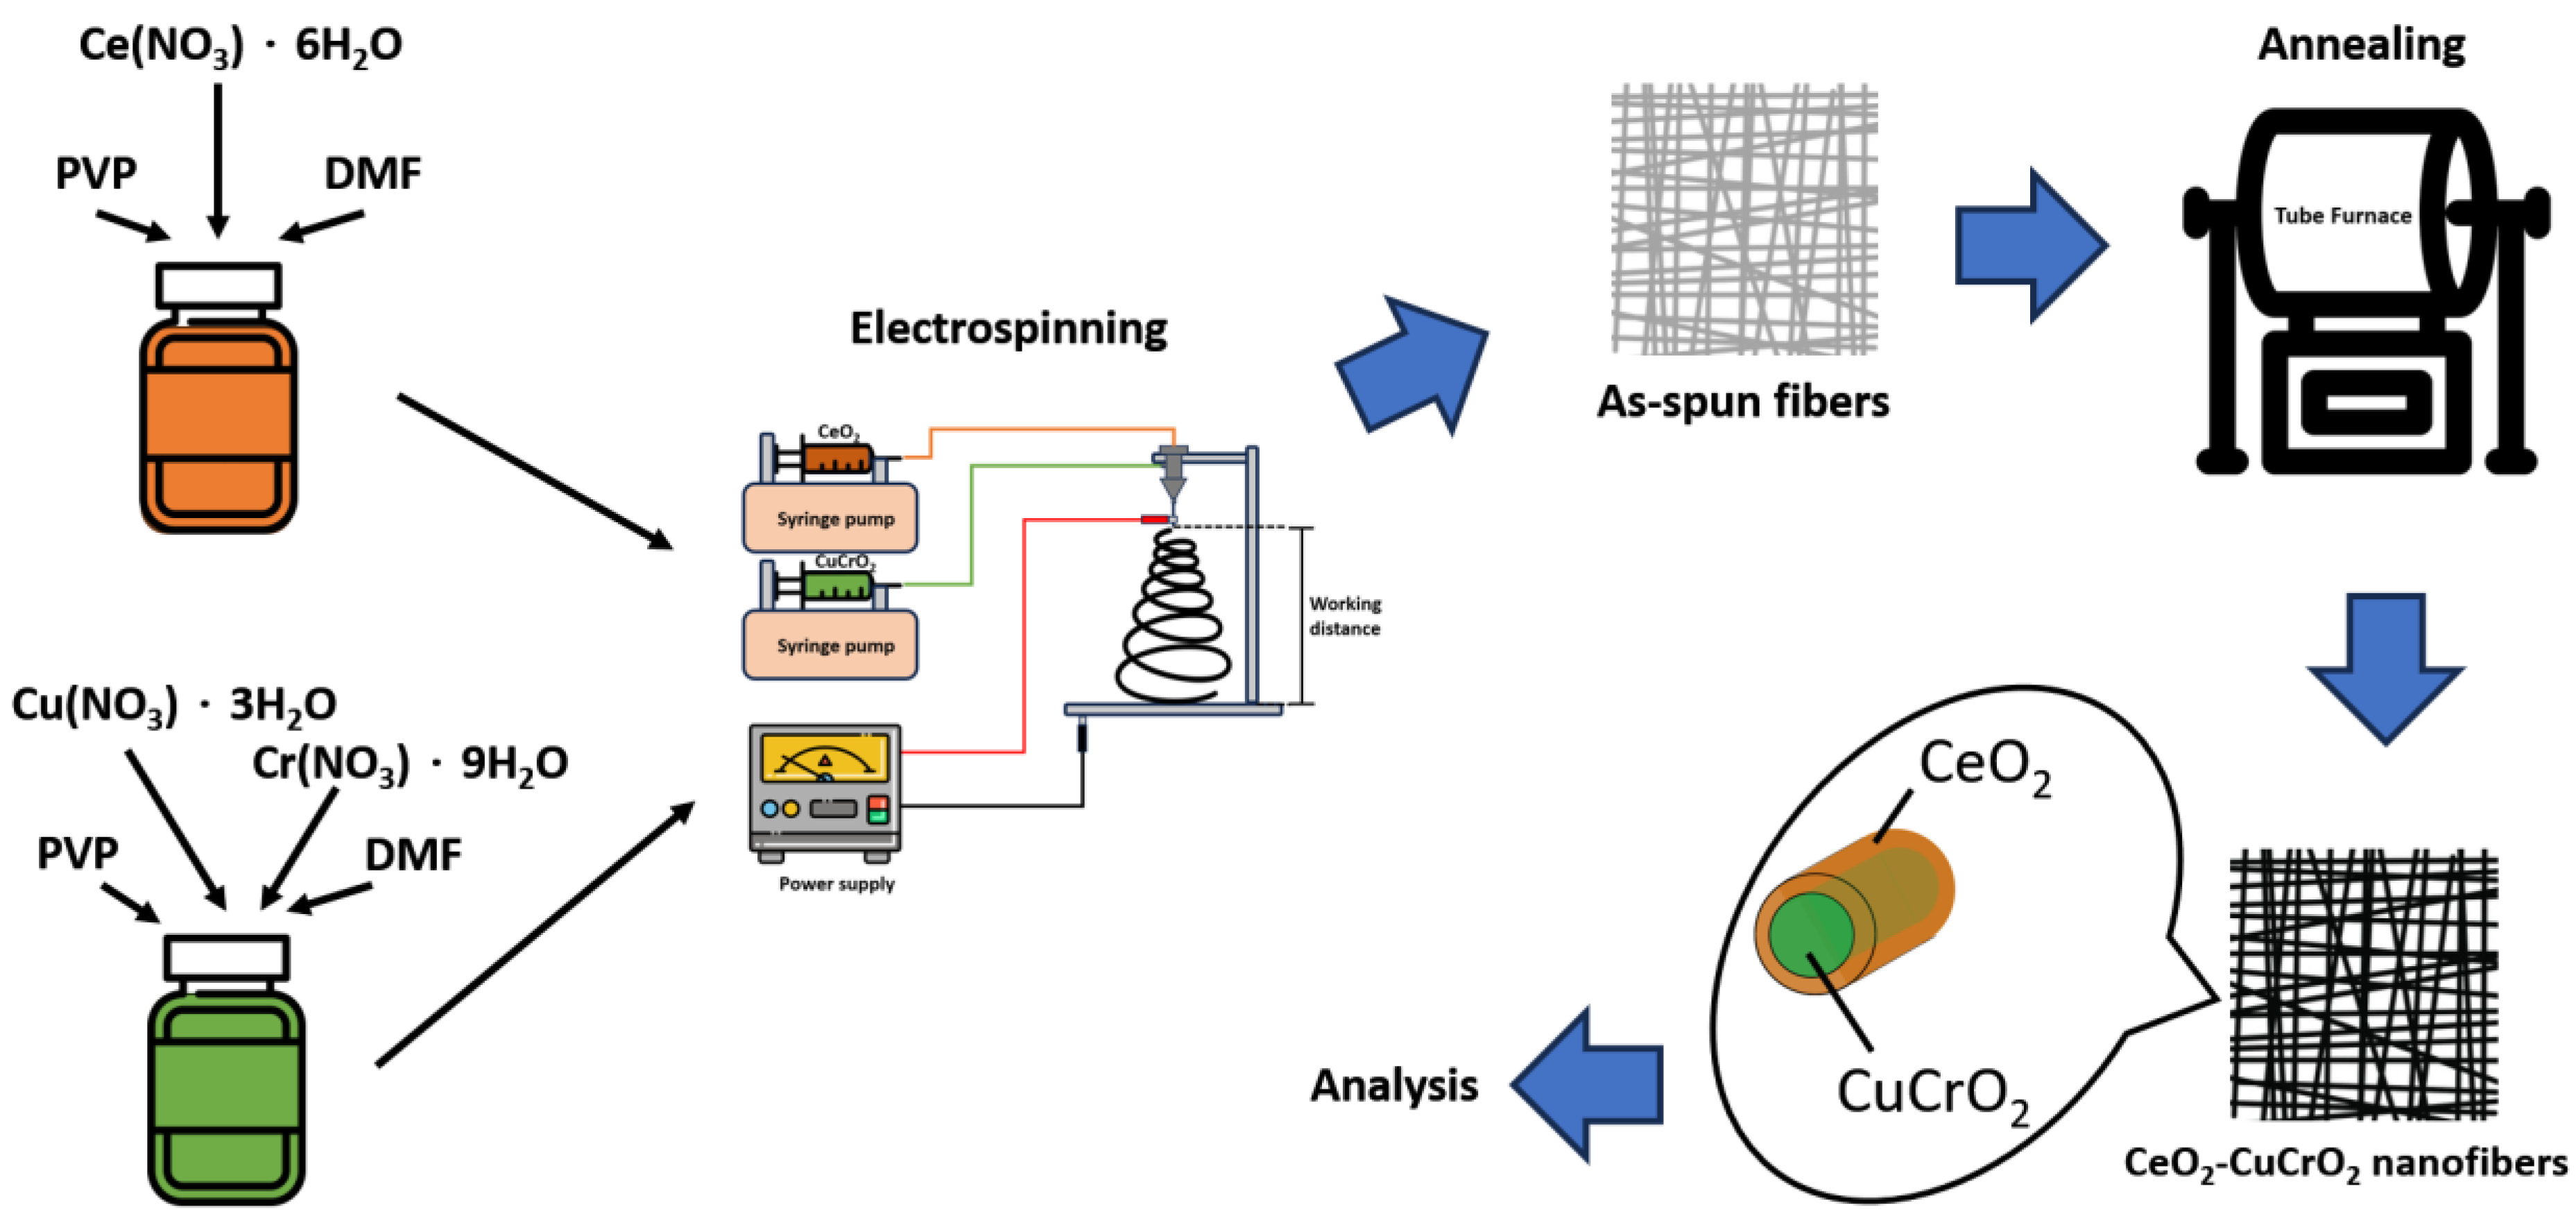
2.2. Preparation of CeO2–CuCrO2 Composite Nanofibers
3. Results and Analysis
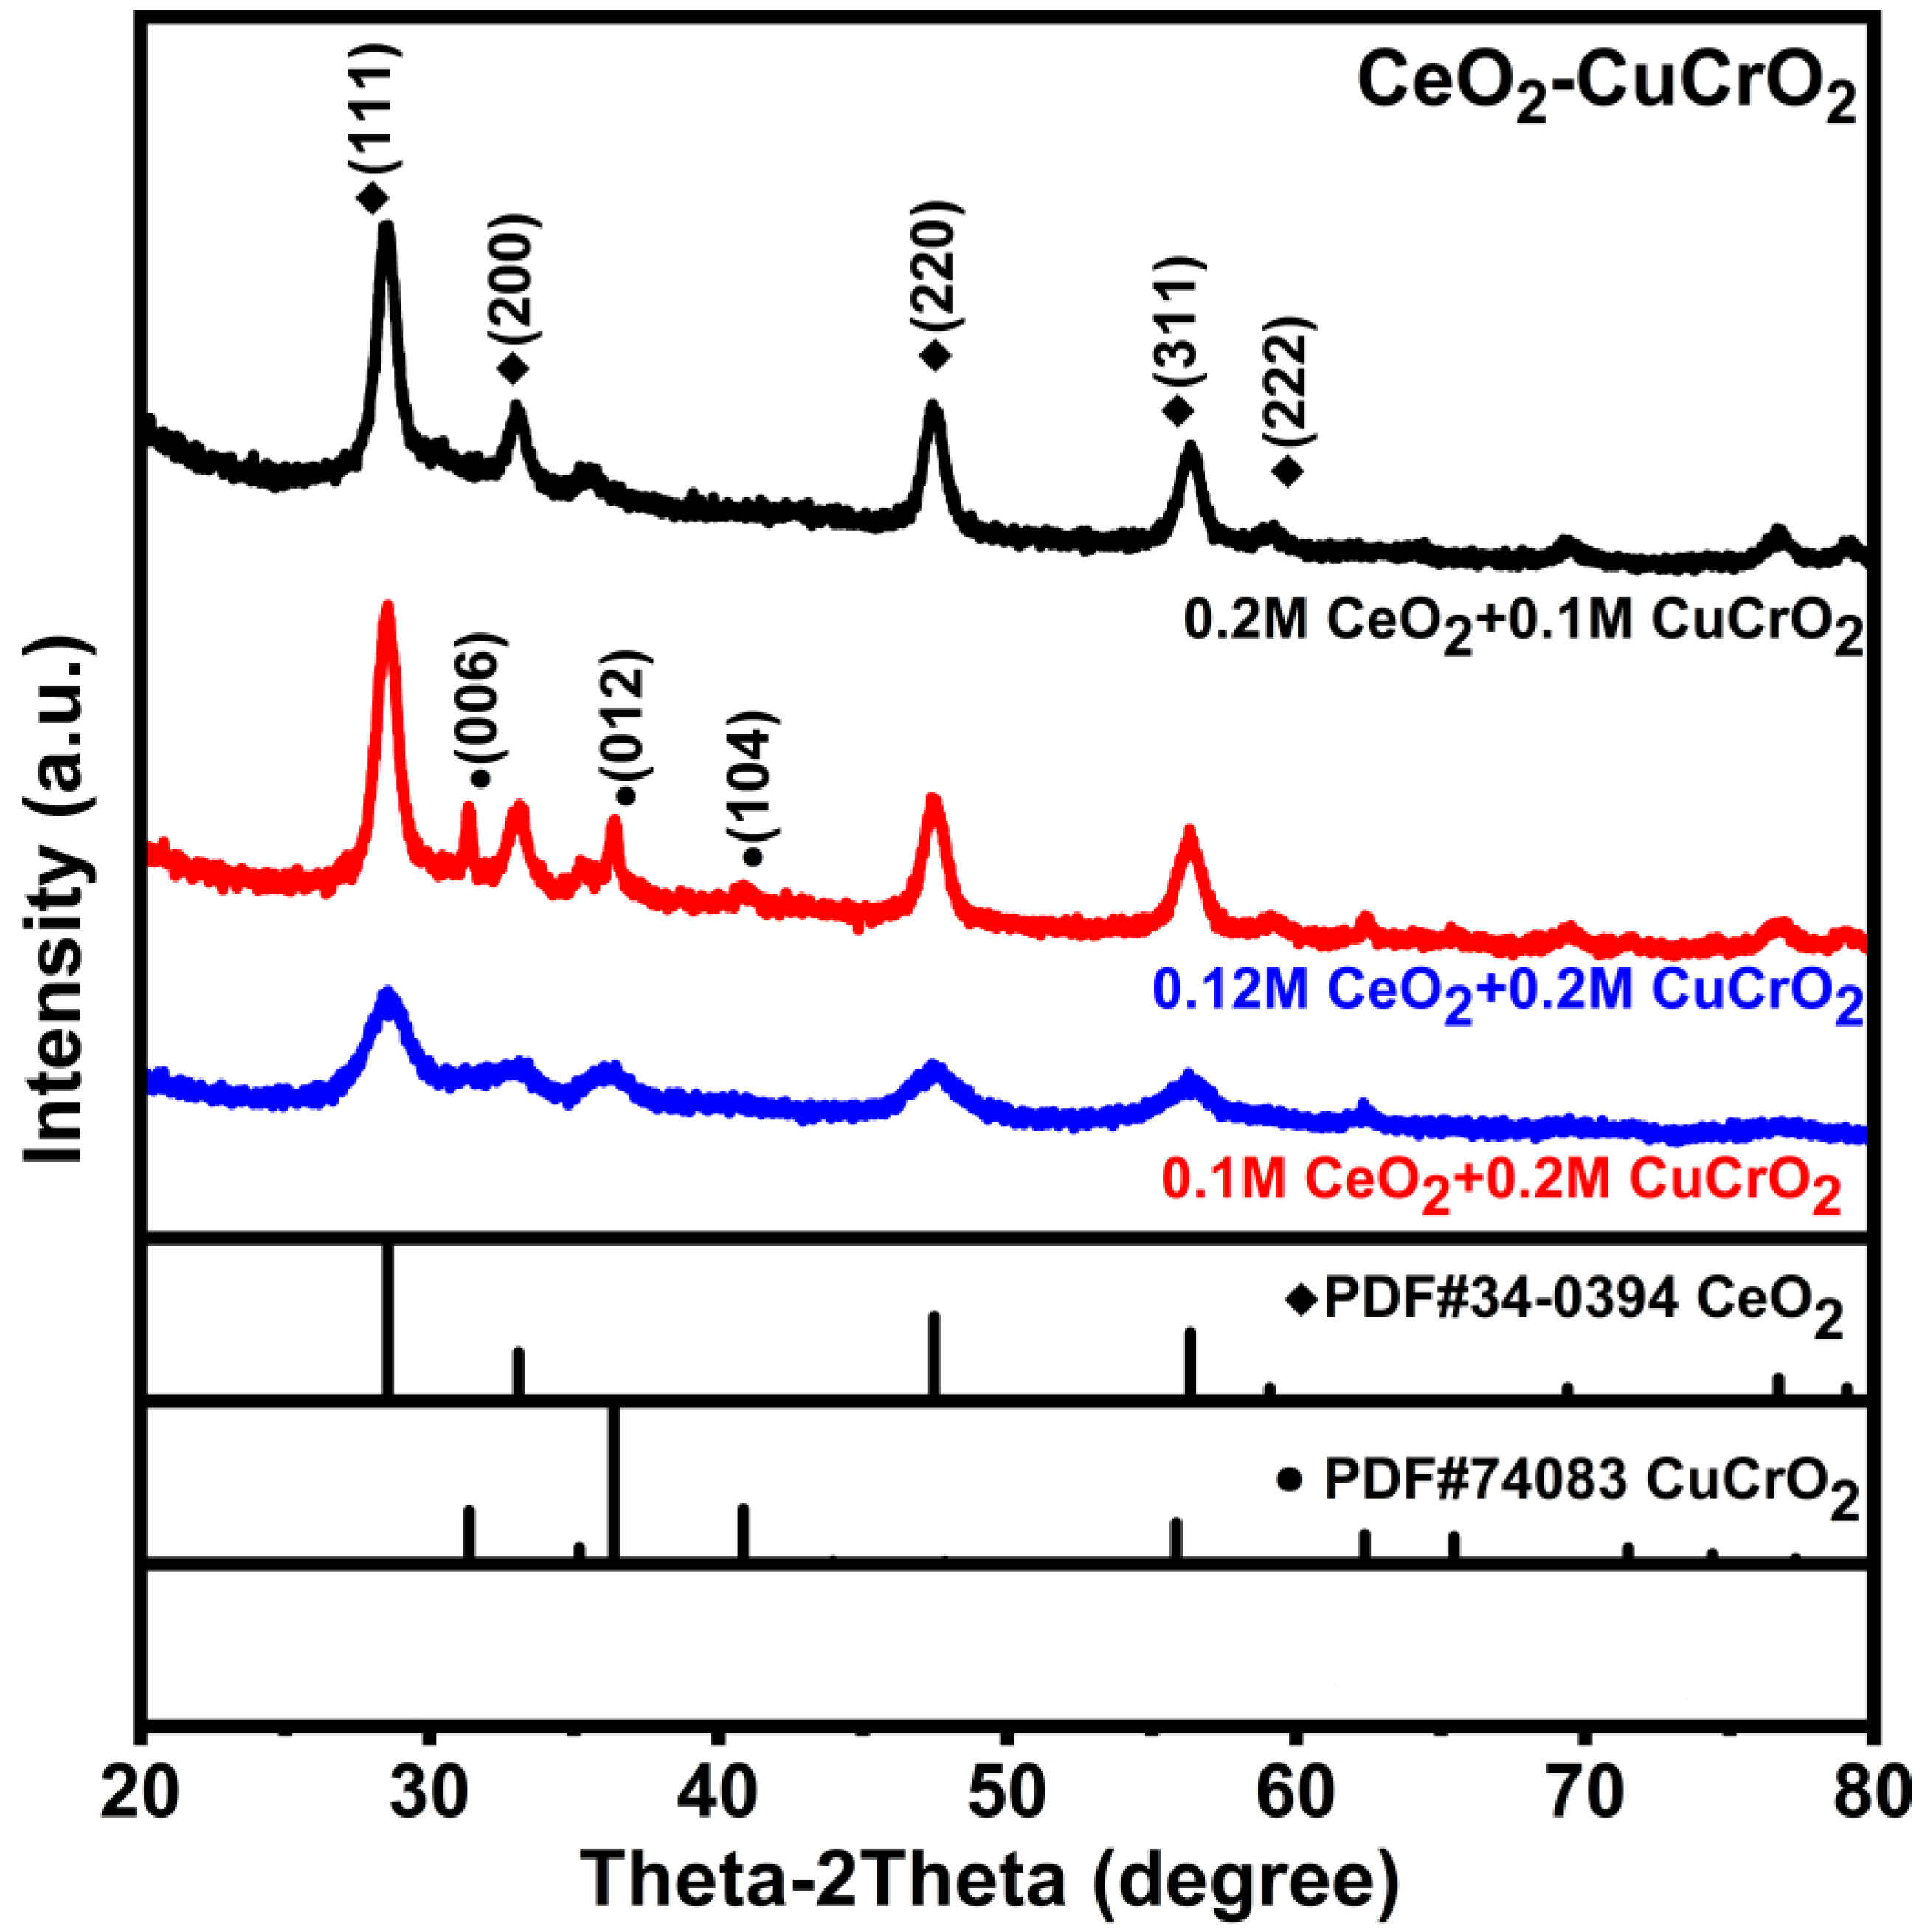
3.1. XRD Analysis
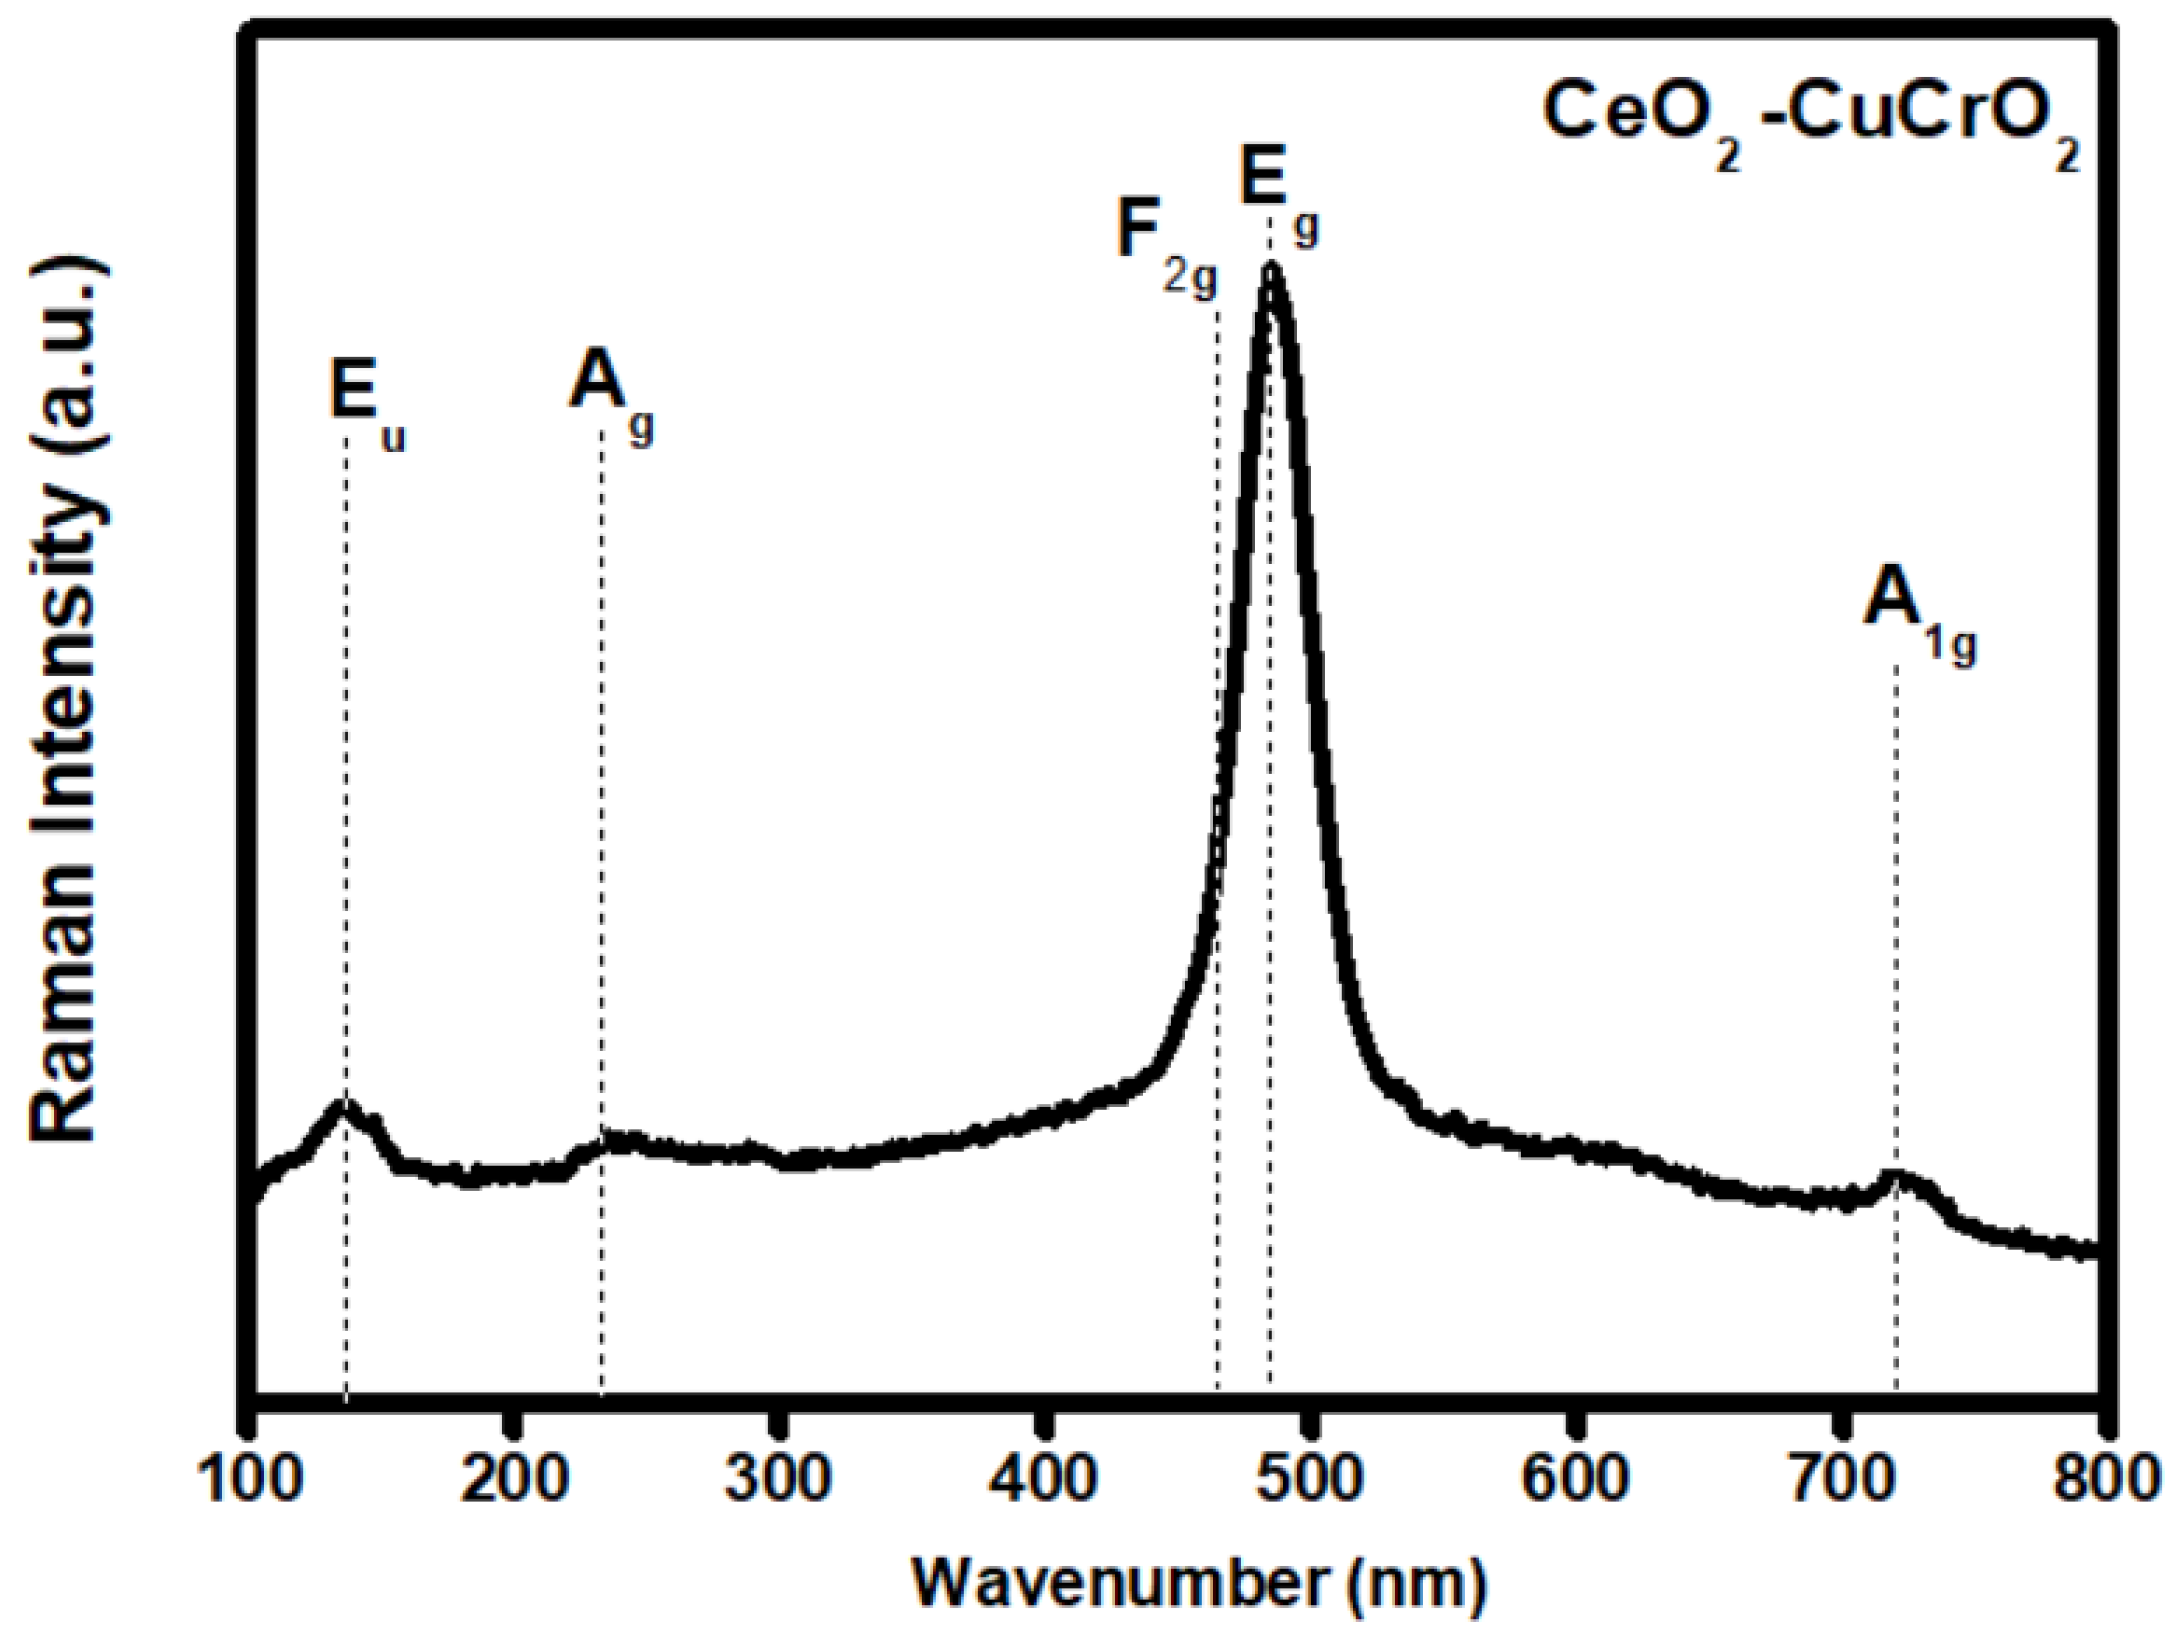
3.2. Raman Analysis
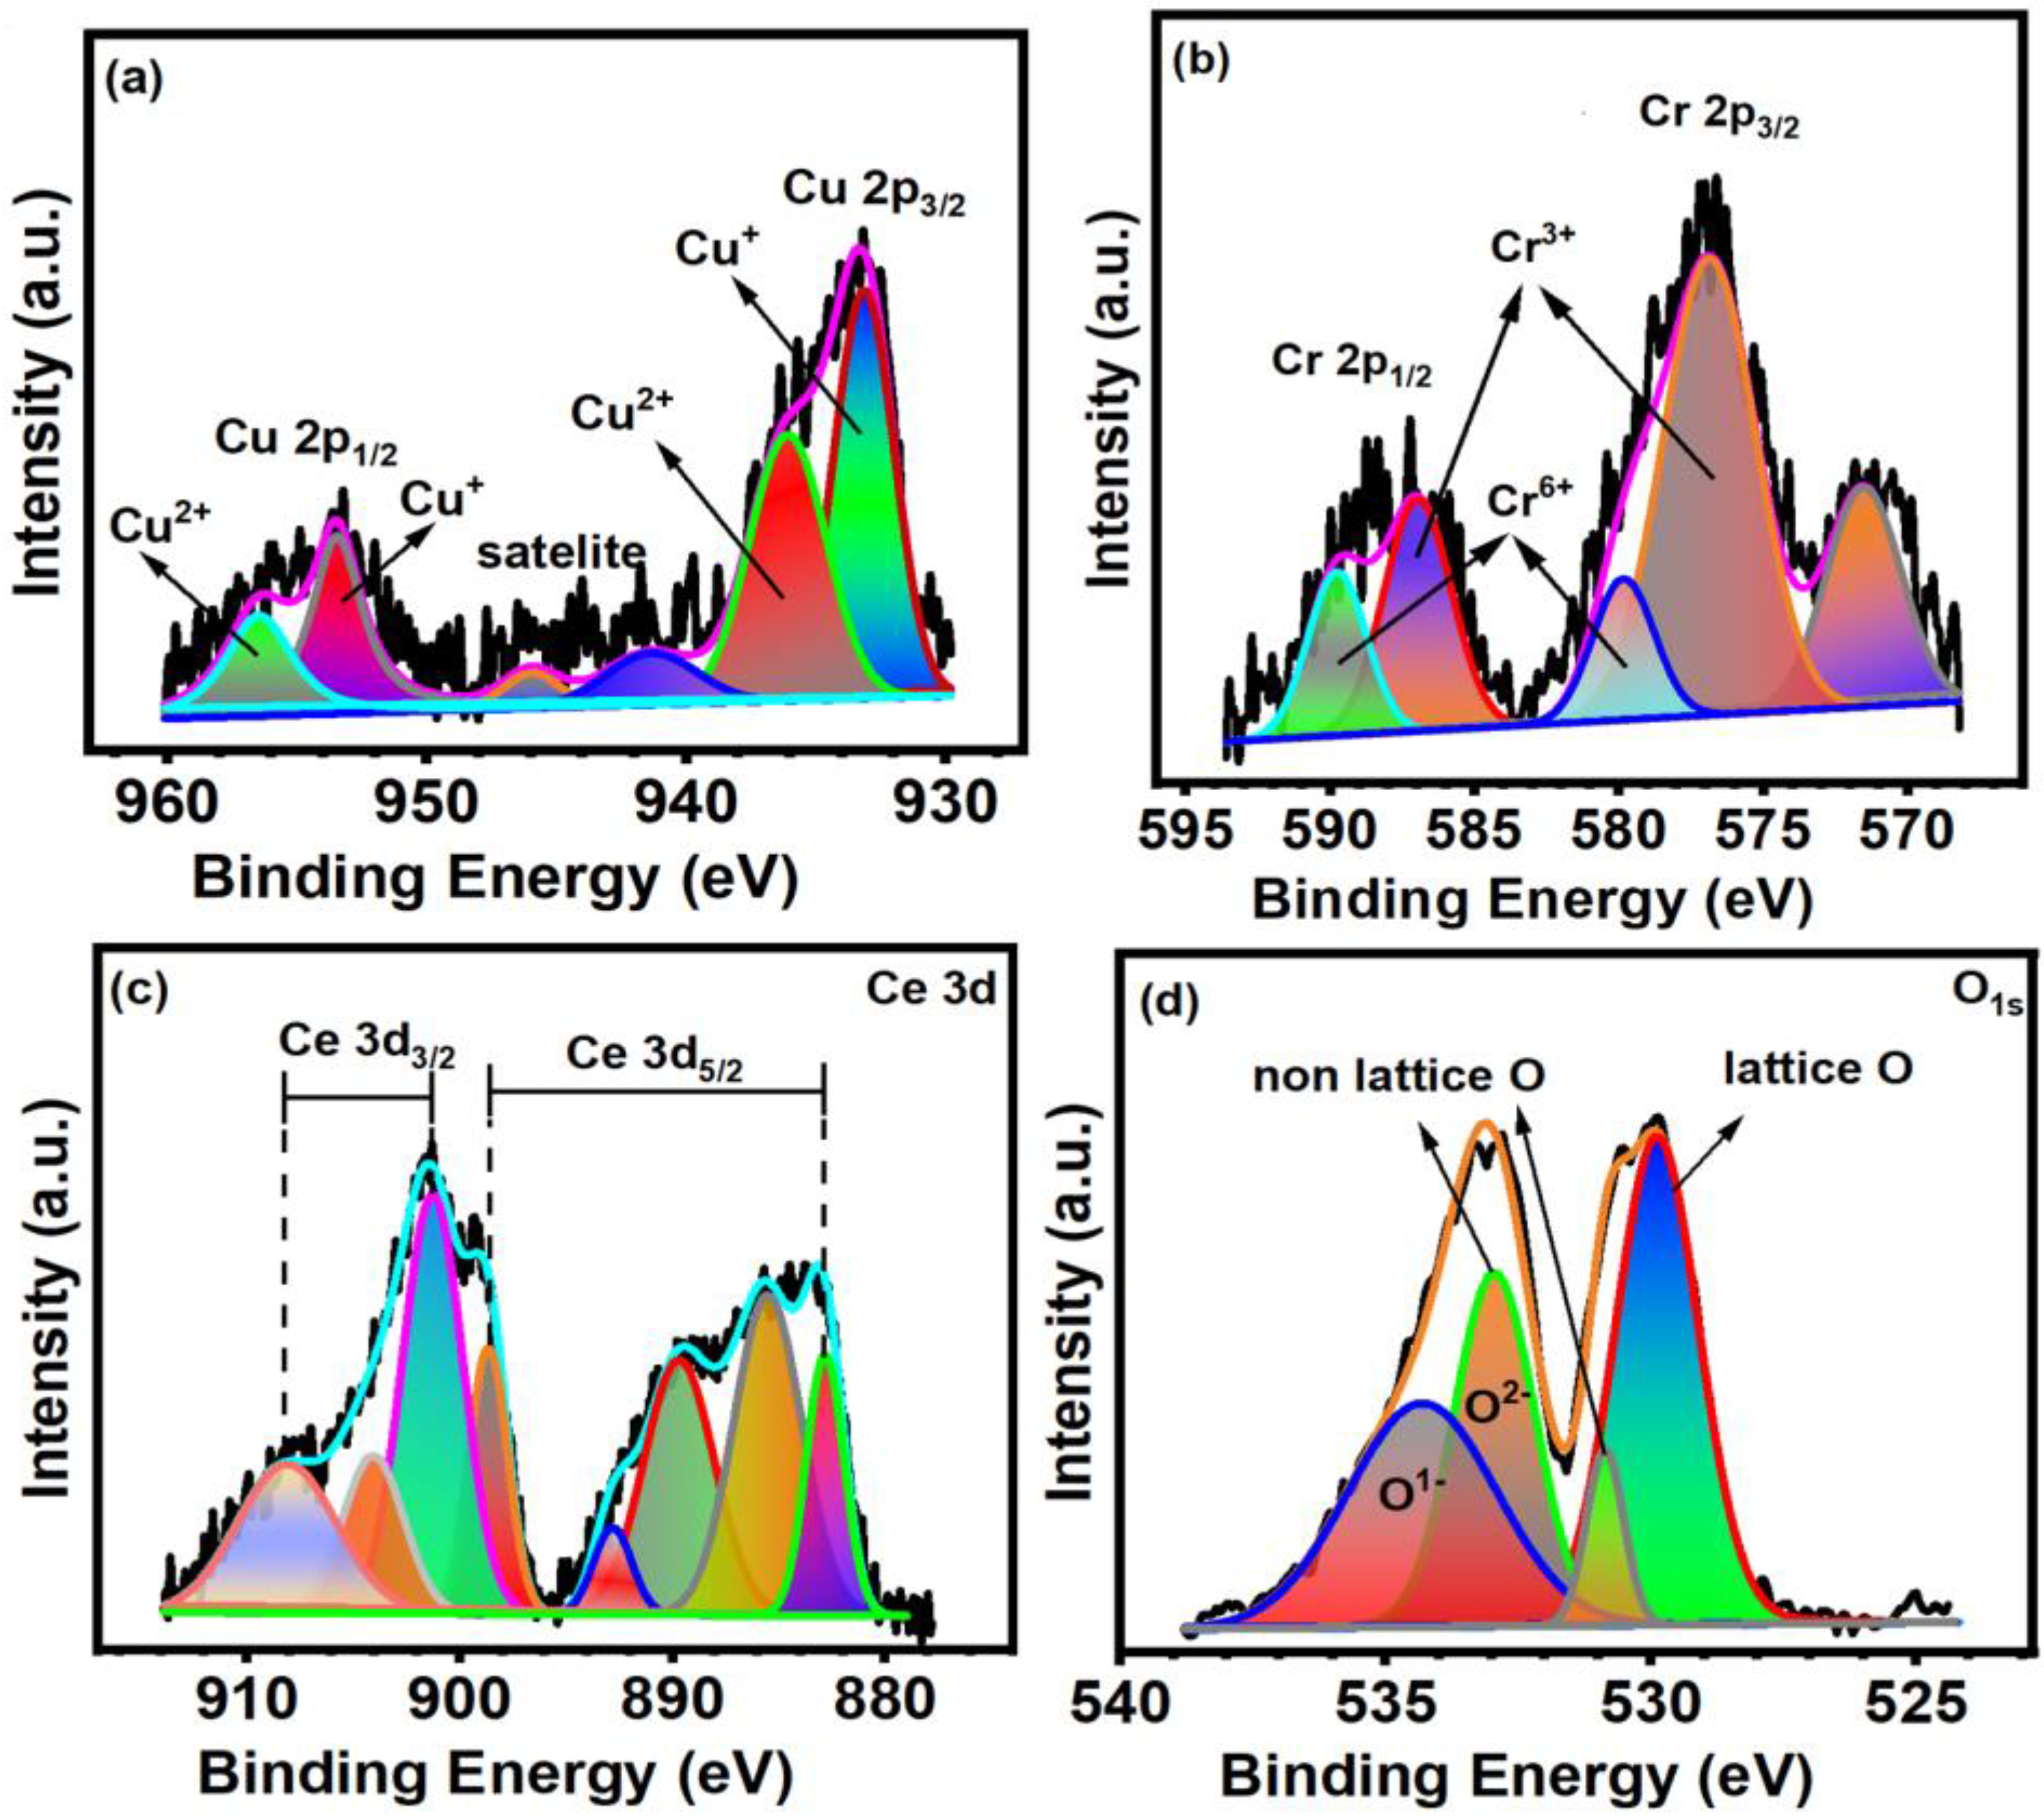
3.3. X-ray Photoelectron Spectroscopy (XPS)
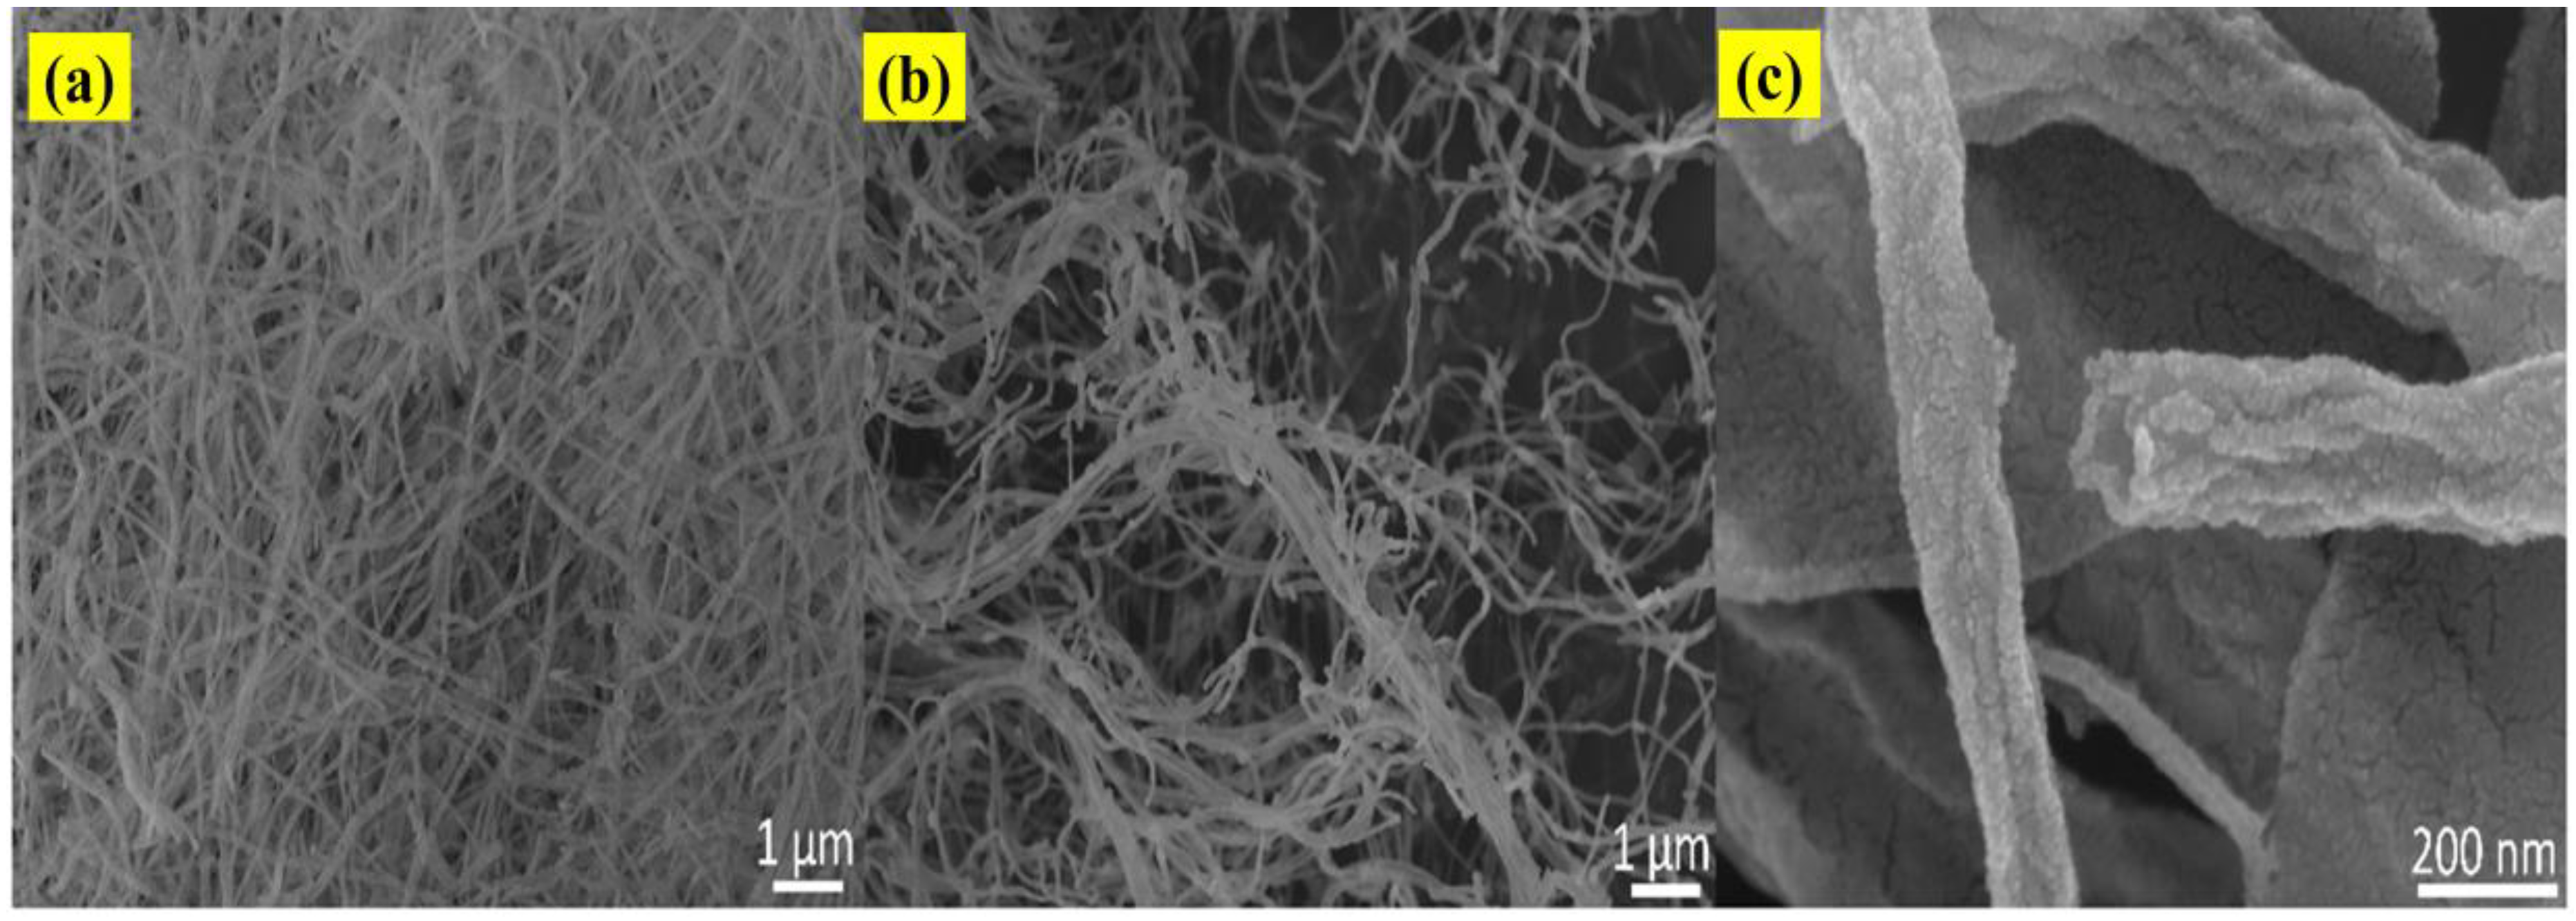
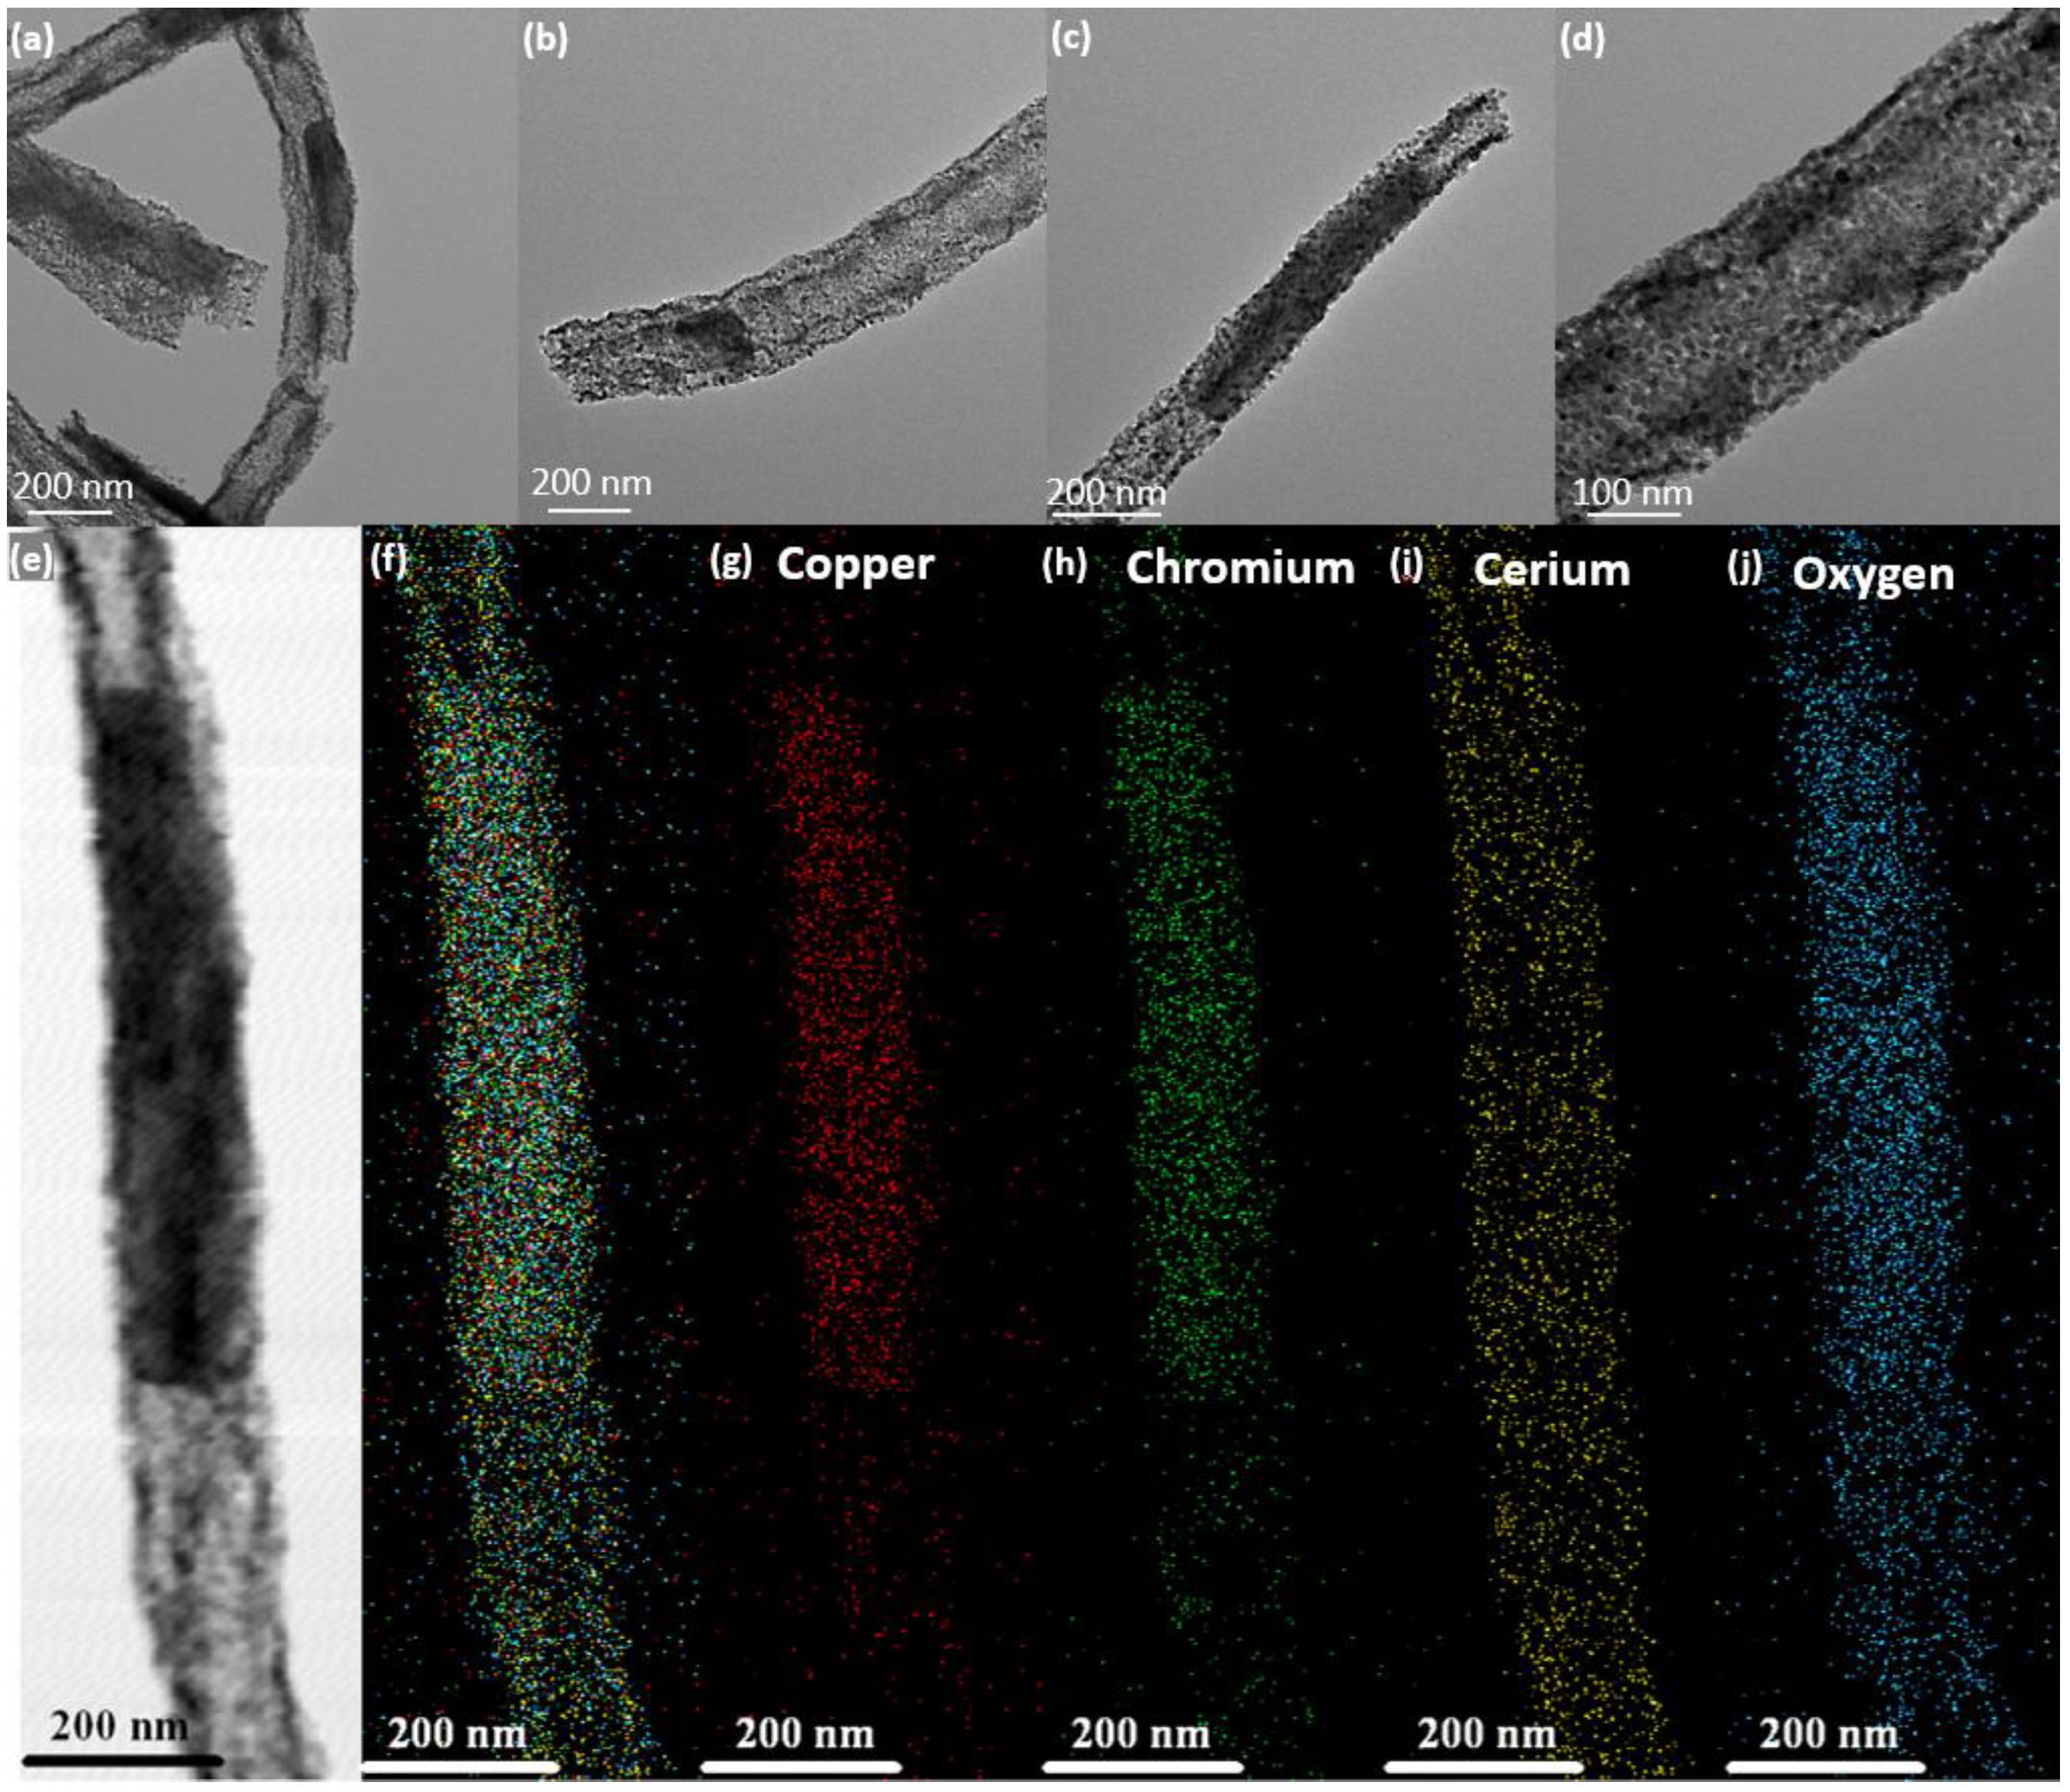
3.4. Surface Morphology and Topography Analysis
3.5. BET Analysis
4. Electrochemical Applications
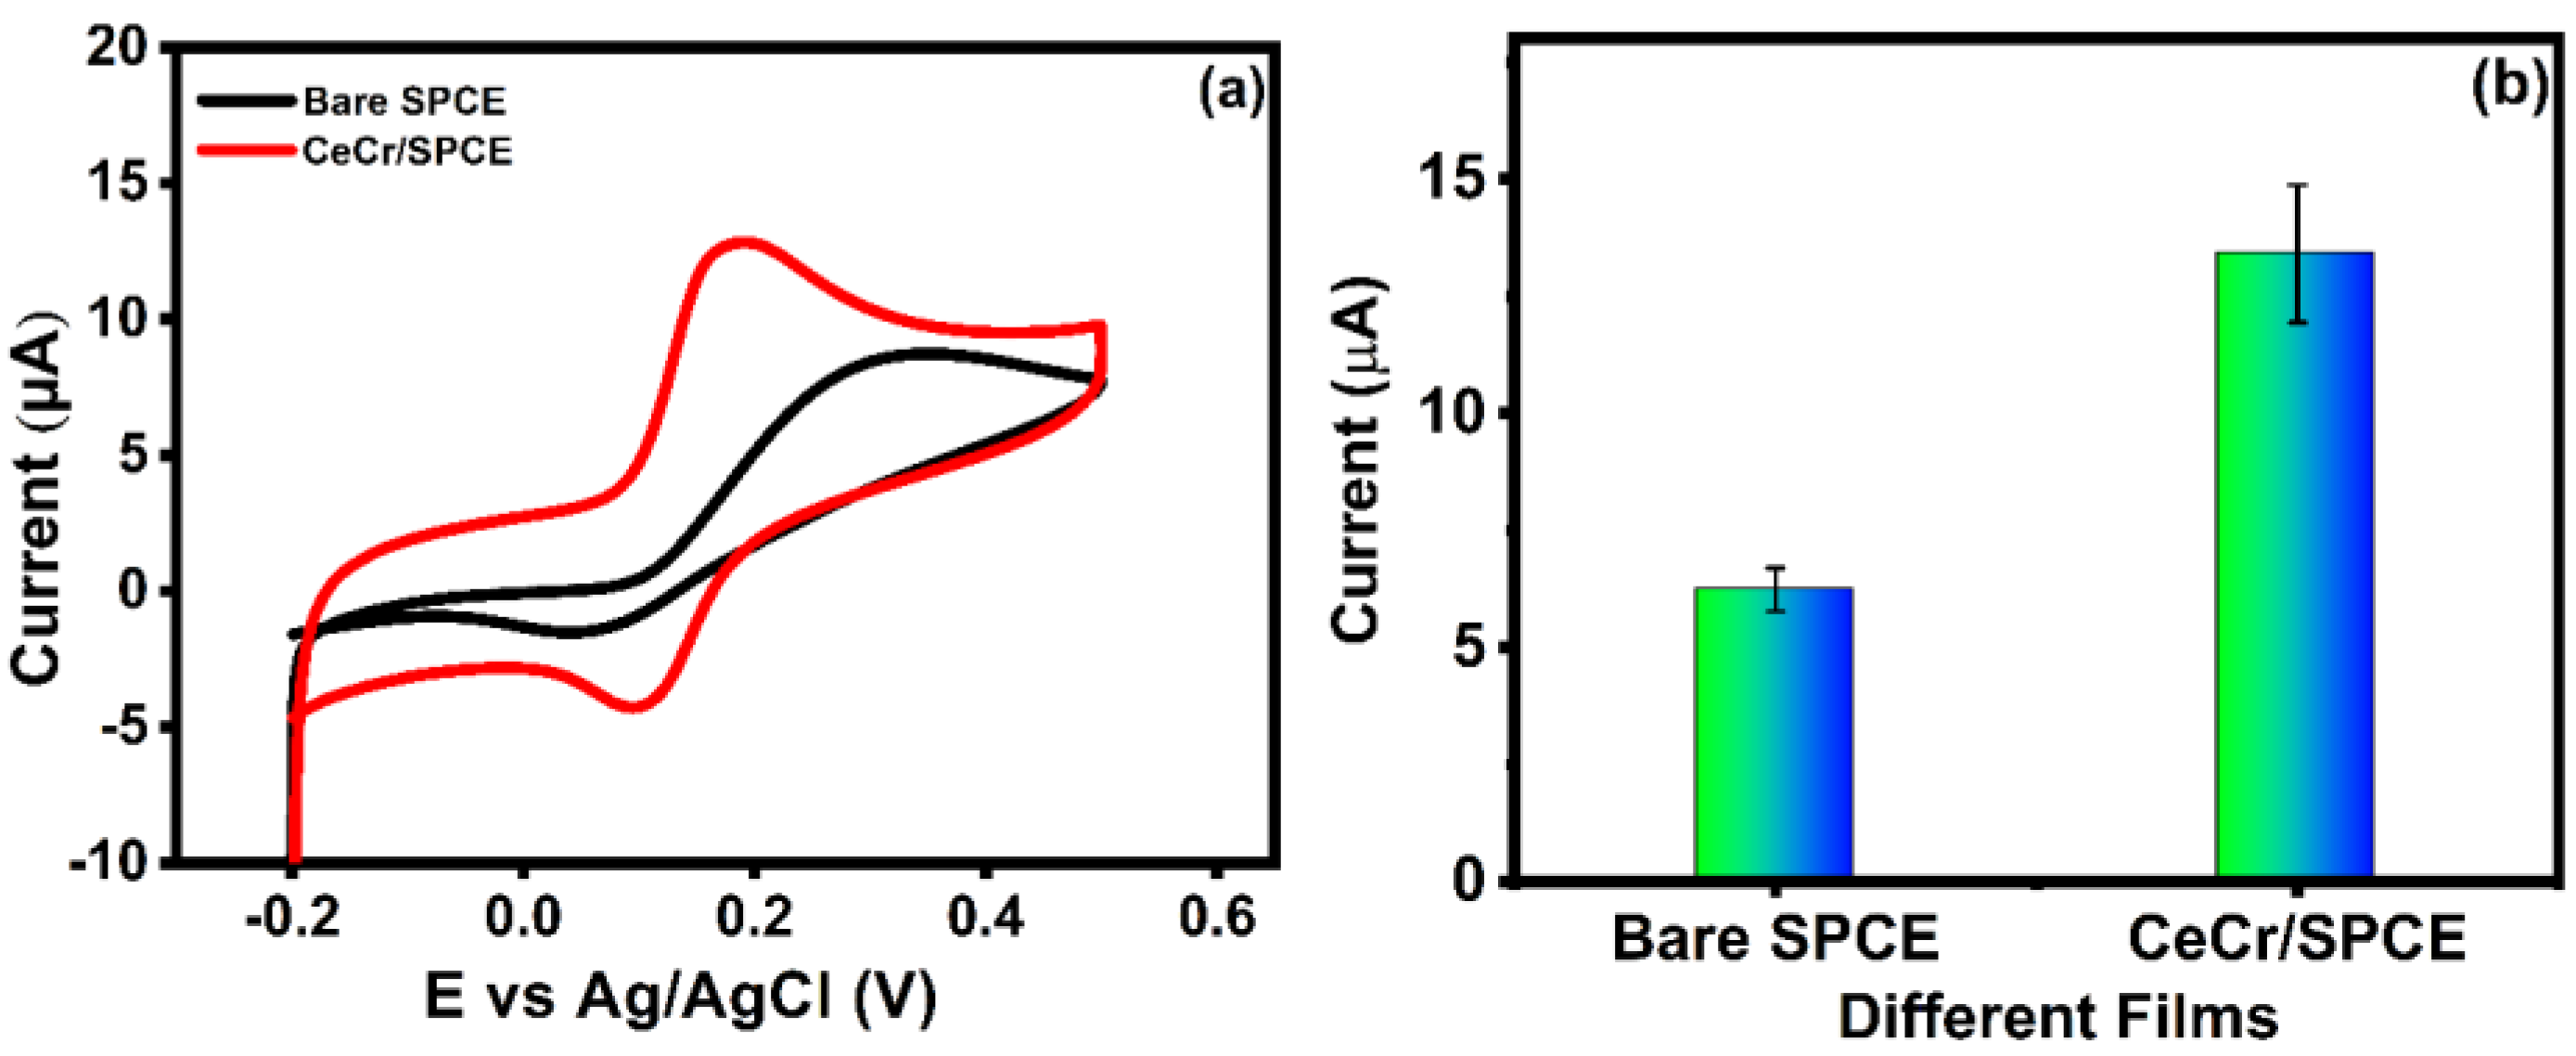
4.1. The Electrochemical Ability of CeO2–CuCrO2 Composite Nanofibers to Detect Dopamine
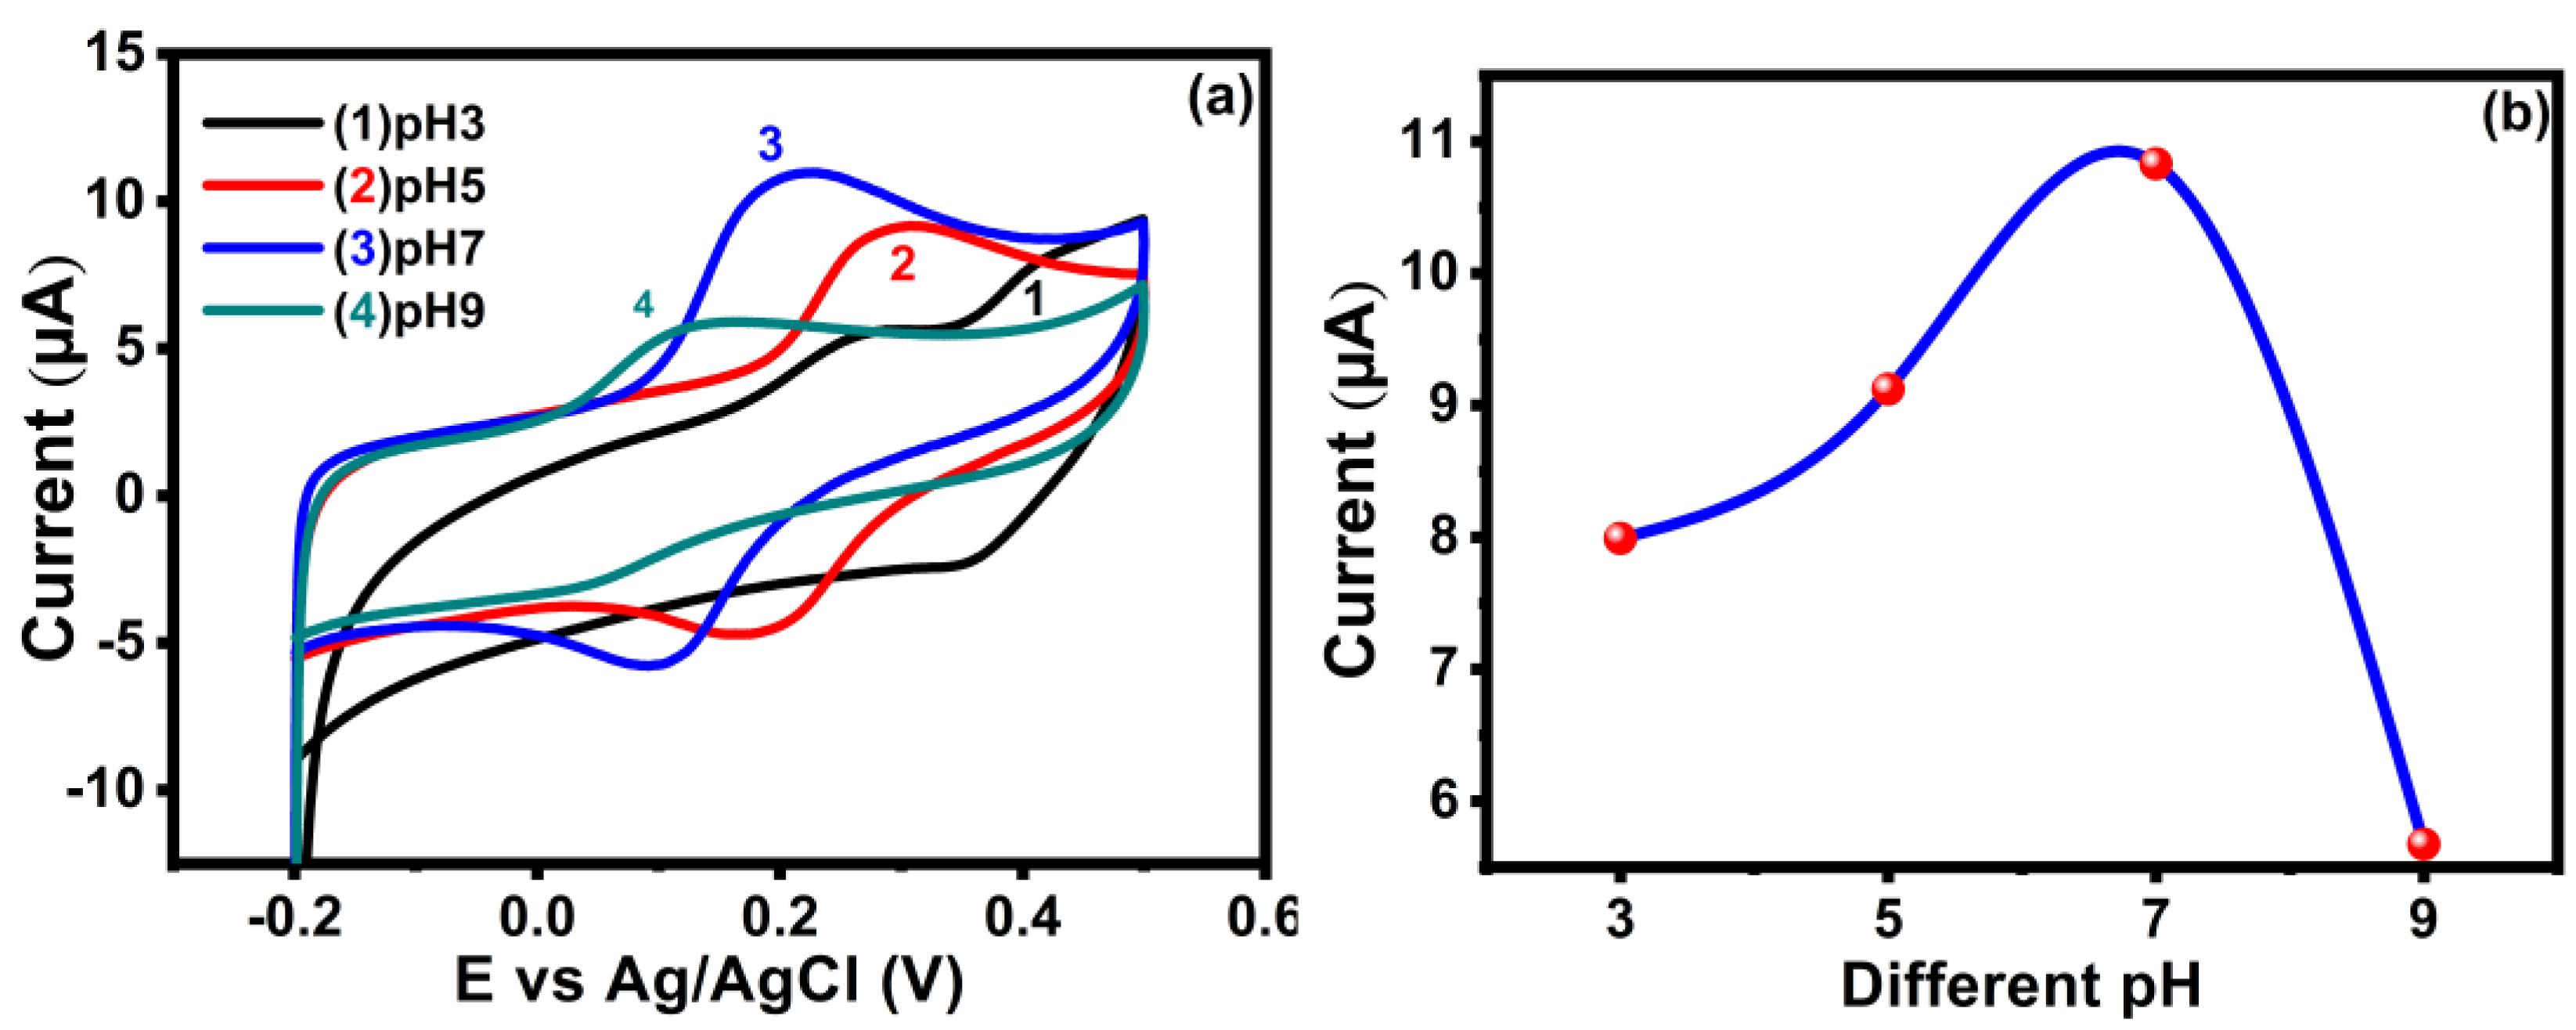
4.2. Influence of pH
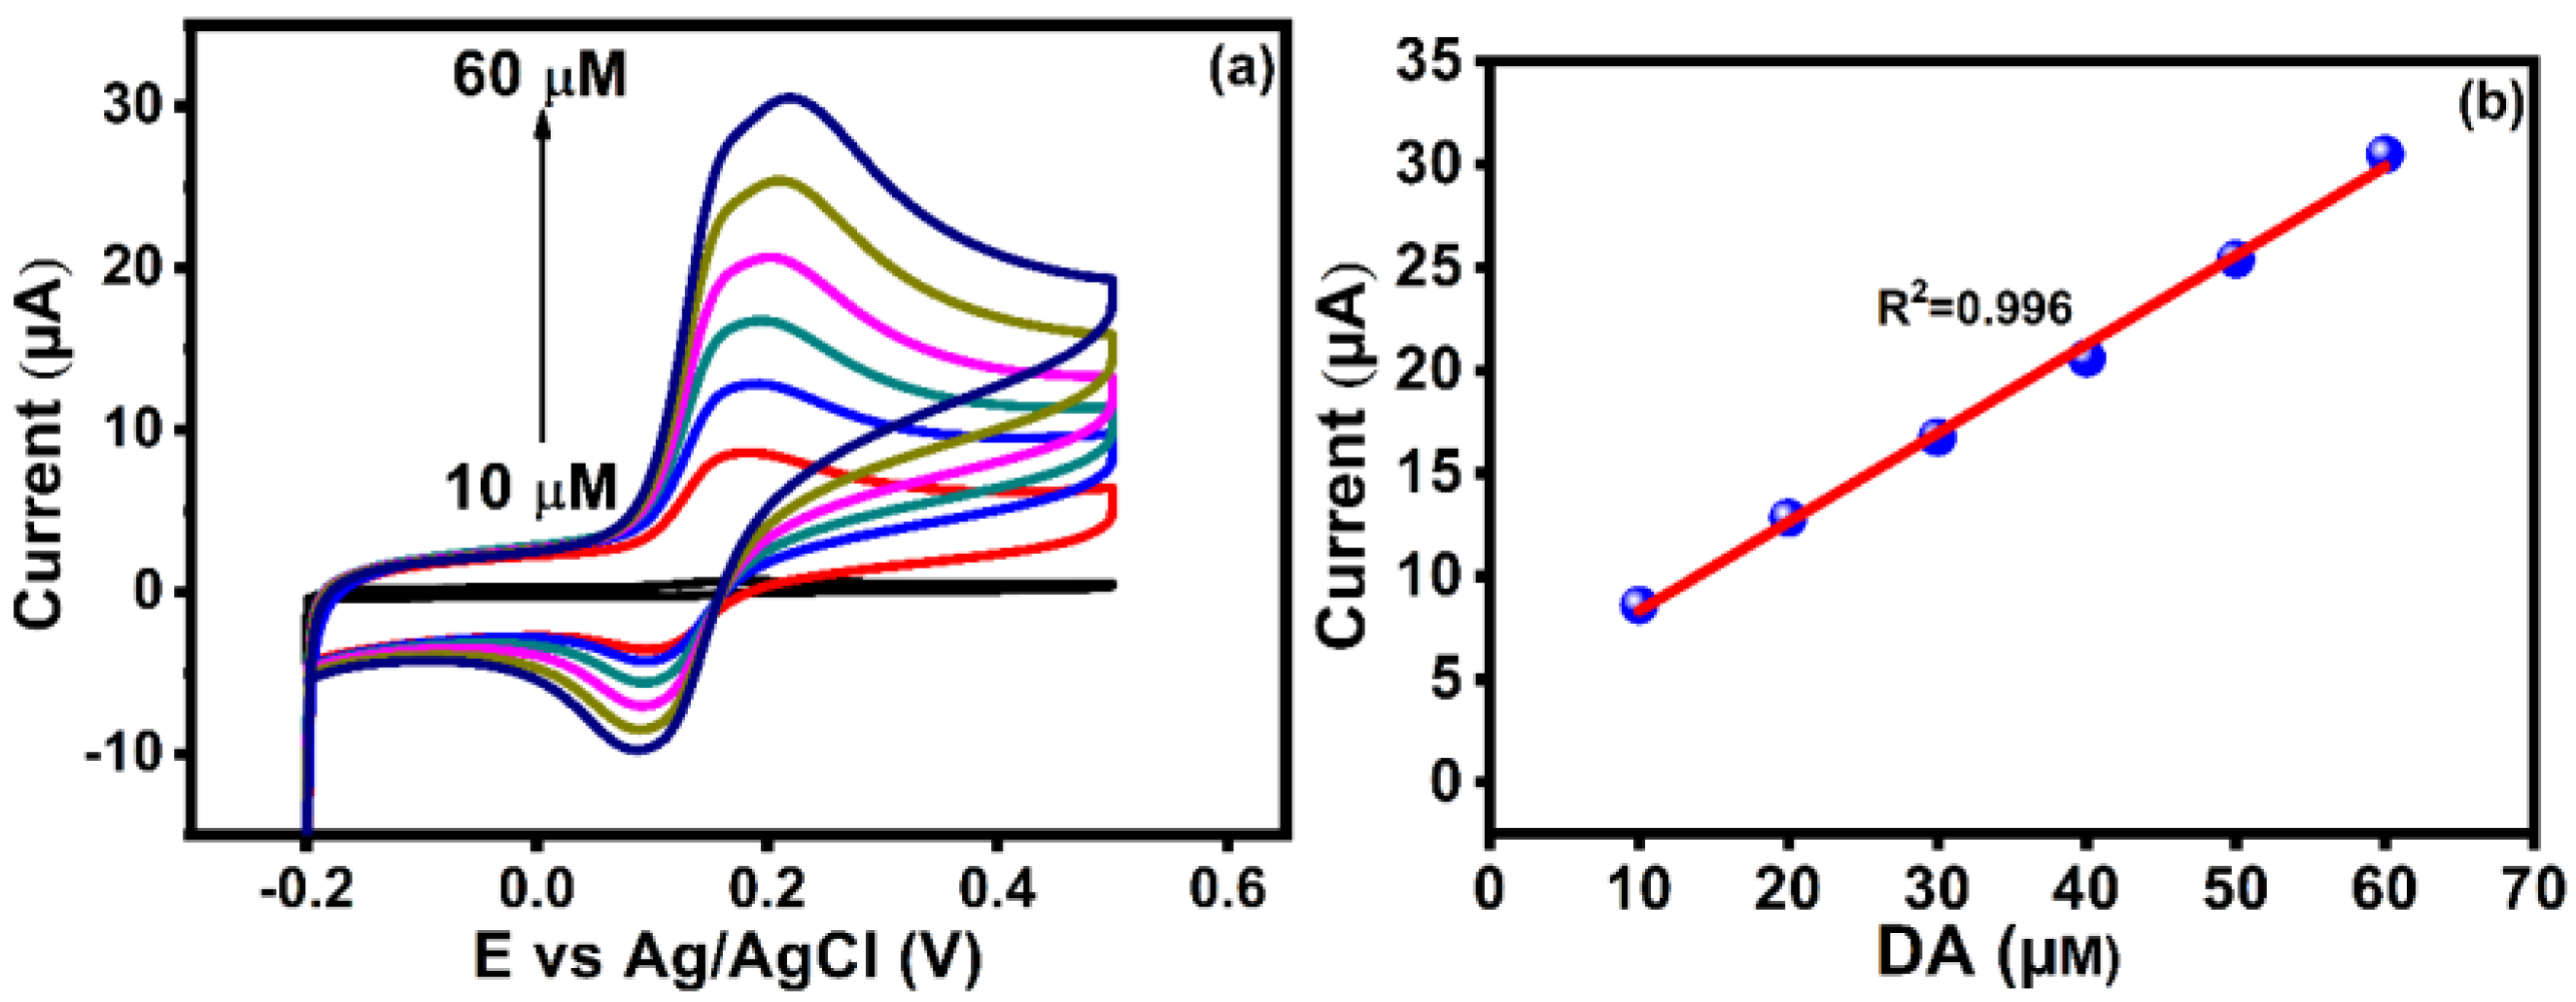
4.3. Effect of Different Dopamine Concentrations on CeO2–CuCrO2 Composite Nanofibers Electrode
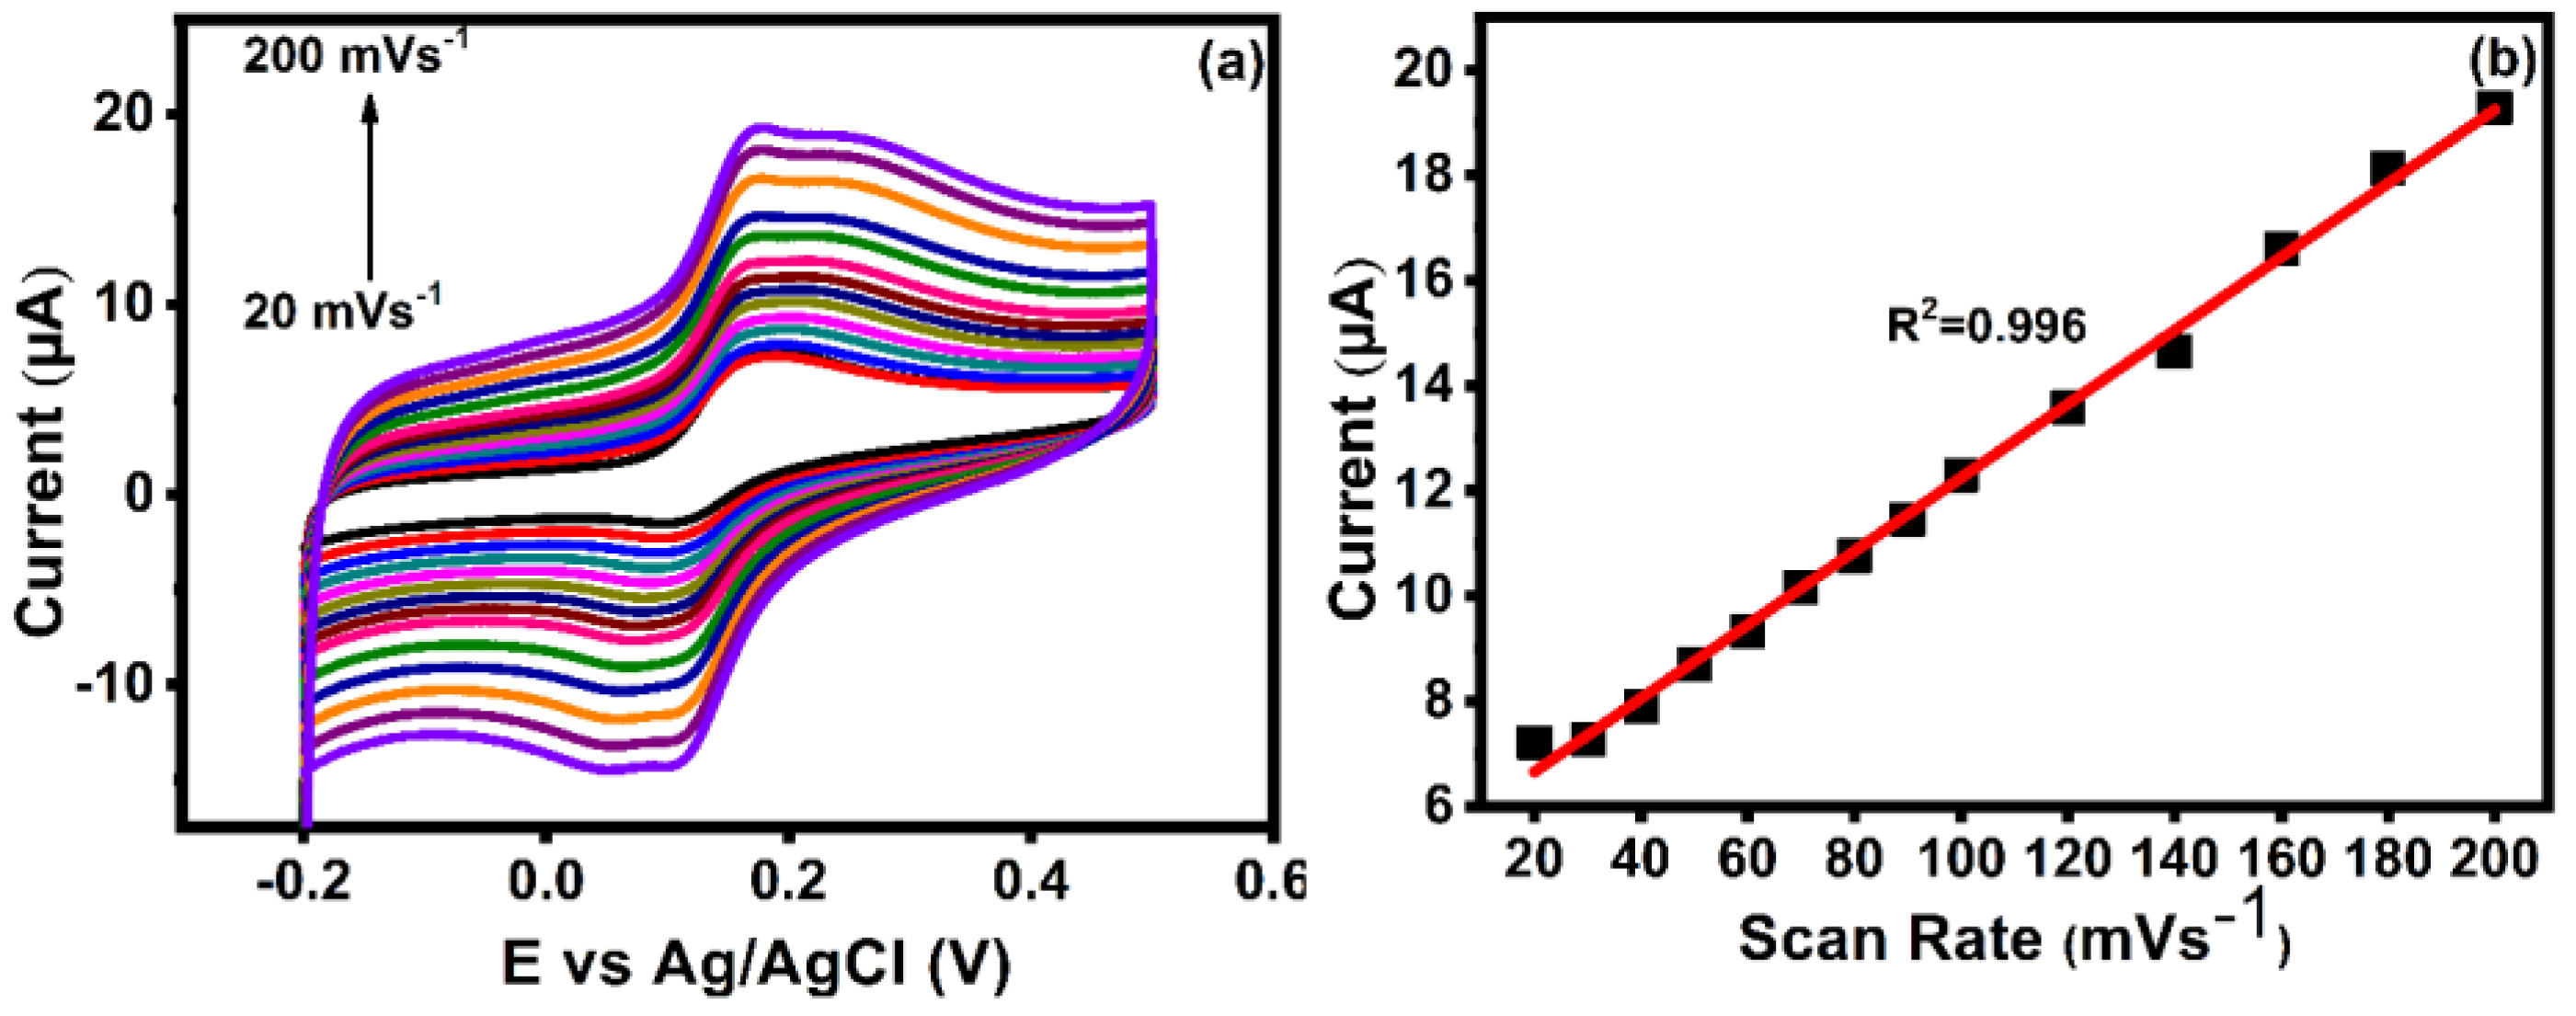
4.4. Influence of Scan Rates on CeO2–CuCrO2 Composite Nanofibers
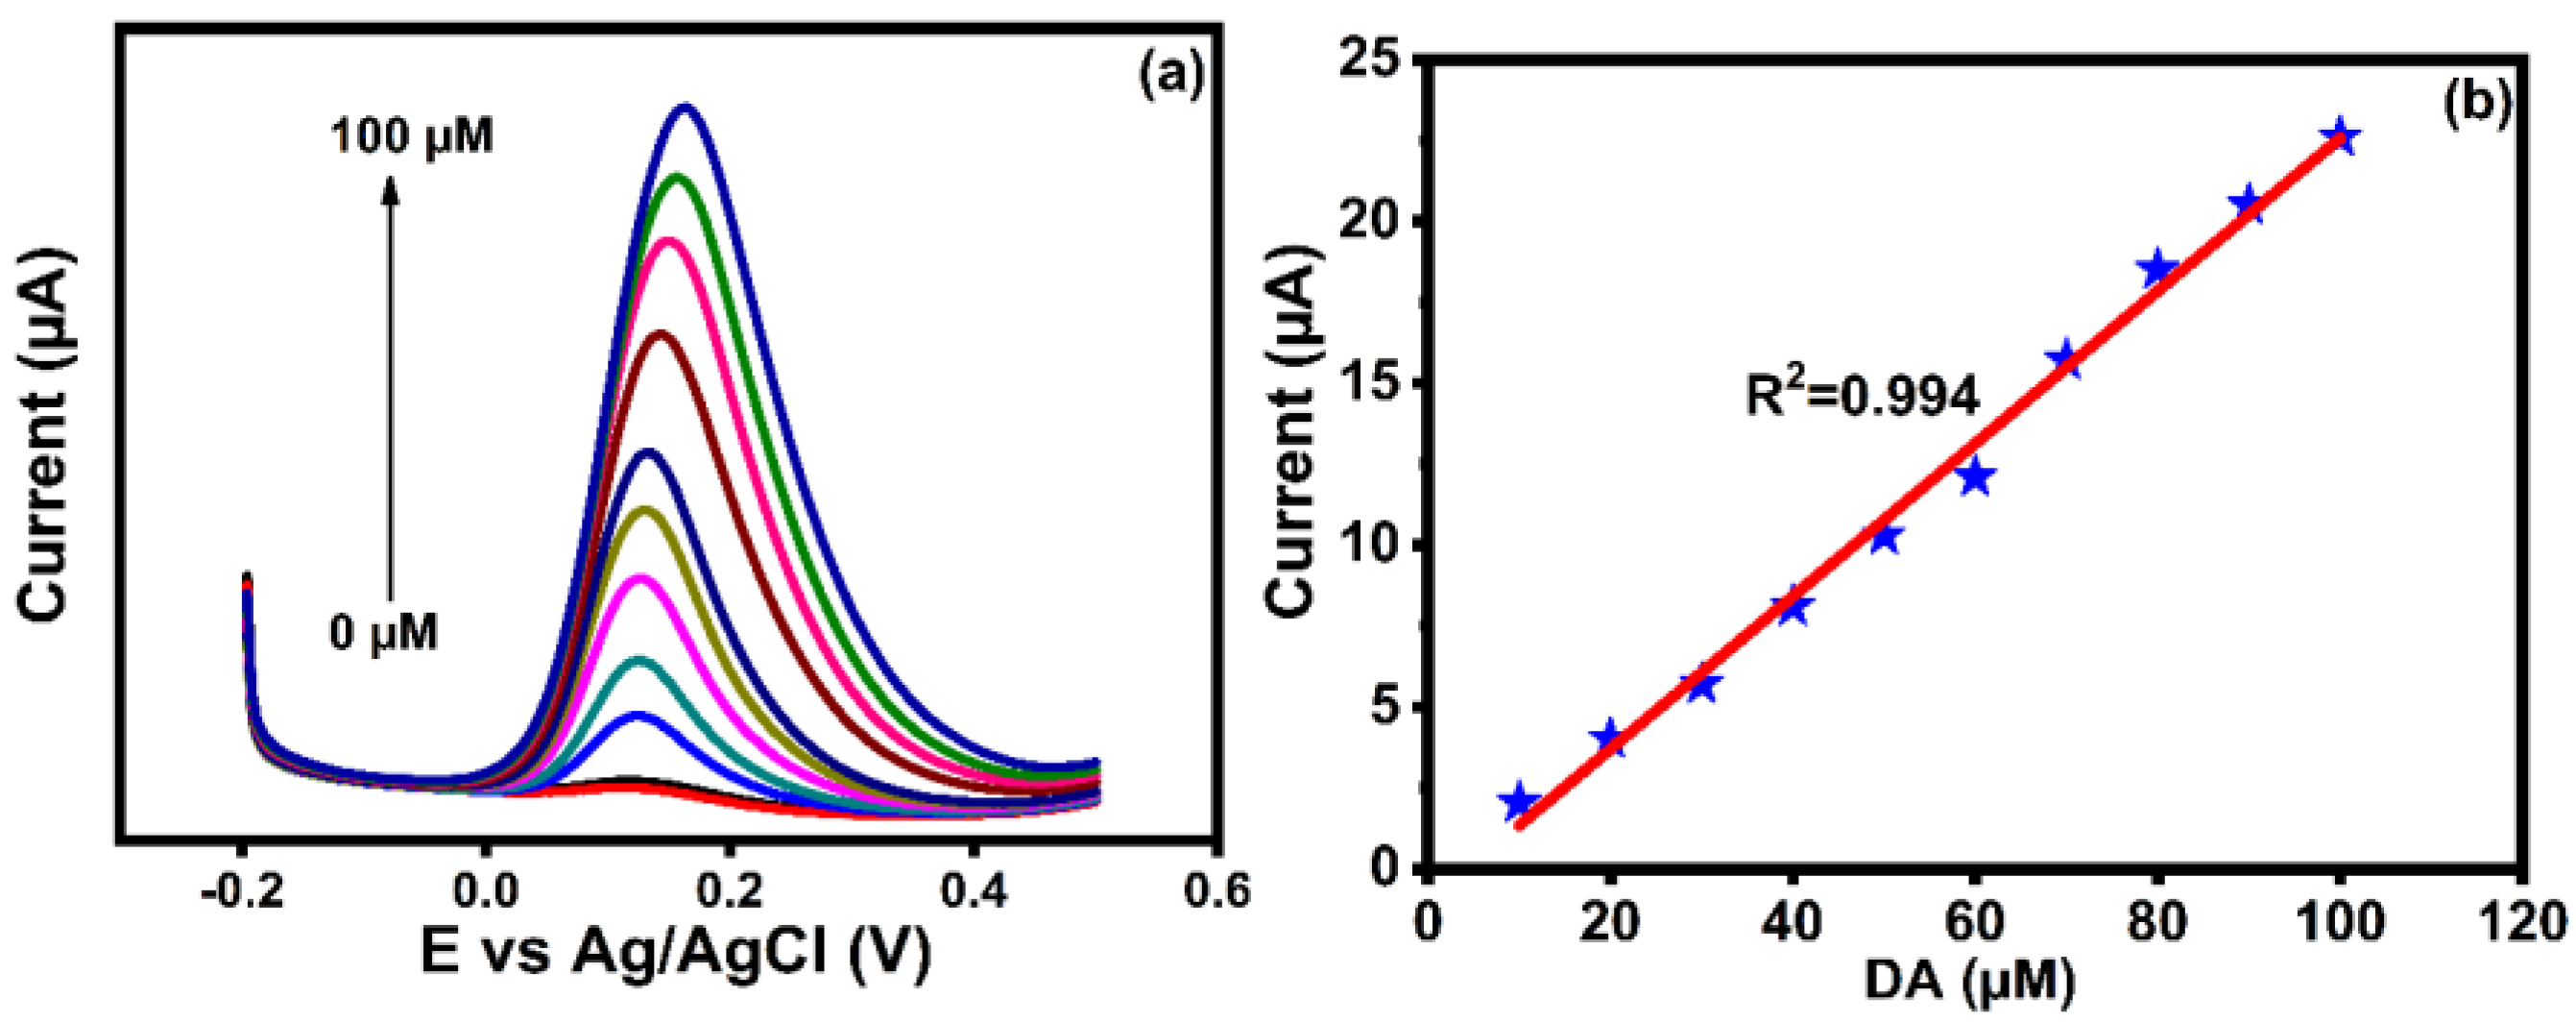
4.5. DA Detection Using DPV
4.6. Real-Samples Analysis
5. Conclusions
Supplementary Materials
Author Contributions
Funding
Informed Consent Statement
Data Availability Statement
Conflicts of Interest
References
- Olguín, H.J.; Guzmán, D.C.; García, E.H.; Mejía, G.B. The Role of Dopamine and Its Dysfunction as a Consequence of Oxidative Stress. Oxid. Med. Cell. Longev. 2015, 2016, 9730467. [Google Scholar] [CrossRef] [Green Version]
- Velez-Pardo, C.; Jimenez del Rio, M.; Ebinger, G.; Vauquelin, G. Manganese and copper promote the binding of dopamine to “serotonin binding proteins” in bovine frontal cortex. Neurochem. Int. 1995, 26, 615–622. [Google Scholar] [CrossRef] [PubMed]
- Bisaglia, M.; Bubacco, L. Copper Ions and Parkinson’s Disease: Why Is Homeostasis So Relevant? Biomolecules 2020, 10, 195. [Google Scholar] [CrossRef] [PubMed] [Green Version]
- Volkow, N.D.; Wang, G.-J.; Logan, J.; Alexoff, D.; Fowler, J.S.; Thanos, P.K.; Wong, C.; Casado, V.; Ferre, S.; Tomasi, D. Caffeine increases striatal dopamine D2/D3 receptor availability in the human brain. Transl. Psychiatry 2015, 5, e549. [Google Scholar] [CrossRef] [Green Version]
- Ferlazzo, A.; Espro, C.; Iannazzo, D.; Bonavita, A.; Neri, G. Yttria-zirconia electrochemical sensor for the detection of tyrosine. Mater. Today Commun. 2023, 35, 106036. [Google Scholar] [CrossRef]
- Xu, Z.; Qiao, X.; Tao, R.; Li, Y.; Zhao, S.; Cai, Y.; Luo, X. A wearable sensor based on multifunctional conductive hydrogel for simultaneous accurate pH and tyrosine monitoring in sweat. Biosens. Bioelectron. 2023, 234, 115360. [Google Scholar] [CrossRef]
- Gan, A.W.; Seah, G.E.; Kwek, L.H.; Goh, S.S. Ion transfer voltammetry of amino acids with an all-solid-state ion-selective electrode for non-destructive phenylalanine sensing. Electroanalysis 2023, 35, e202200501. [Google Scholar] [CrossRef]
- Ferlazzo, A.; Espro, C.; Iannazzo, D.; Neri, G. Determination of phenylalanine by a novel enzymatic PHD/SPE biosensor. IEEE Trans. Instrum. Meas. 2023, 72, 9508308. [Google Scholar] [CrossRef]
- Diedkova, K.; Pogrebnjak, A.D.; Kyrylenko, S.; Smyrnova, K.; Buranich, V.V.; Horodek, P.; Zukowski, P.; Koltunowicz, T.N.; Galaszkiewicz, P.; Makashina, K.; et al. Polycaprolactone–MXene Nanofibrous Scaffolds for Tissue Engineering. ACS Appl. Mater. Interfaces 2023, 15, 14033–14047. [Google Scholar] [CrossRef]
- Kyrylenko, S.; Kornienko, V.; Gogotsi, O.; Oleshko, O.; Kolesnyk, M.; Mishchenko, O.; Zahorodna, V.; Buranich, V.; Pogrebnjak, A.; Zozulia, Y.; et al. Bio-functionalization of electrospun polymeric nanofibers by Ti3C2Tx MXene. In Proceedings of the 2020 IEEE 10th International Conference Nanomaterials: Applications & Properties (NAP), Sumy, Ukraine, 9–13 November 2020; IEEE: Piscataway, NJ, USA, 2023; p. 02BA10-1. [Google Scholar]
- Narro-Ríos, J.S.; Garduño-Wilches, I.; Alarcón-Flores, G.; Ruiz-Rojas, C.A.; Gómez-Lizárraga, K.; Aguilar-Frutis, M. Spray pyrolysis synthesis of a semi-transparent p-CuCrO2/n-ZnO heterojunction: Structural, optical, and electrical properties. Phys. B Condens. Matter 2021, 624, 413426. [Google Scholar] [CrossRef]
- Lee, E.H.; Kim, E.B.; Akhtar, M.S.; Ameen, S. Delafossite CuCrO2 nanoparticles as possible electrode material for electrochemical supercapacitor. Ceram. Int. 2022, 48, 16667–16676. [Google Scholar] [CrossRef]
- Cheng, W.; Li, C.; Zhou, C.; He, Y.; Wei, R.; Hu, L.; Song, W.; Zhu, X.; Sun, Y. Existence of bipolar resistive switching with self-rectifying behavior in a p-CuCrO2/n-Si heterostructure. Thin Solid Films 2022, 762, 139542. [Google Scholar] [CrossRef]
- Erfan, N.A.; Barakat, N.A.M.; Muller-Borer, B.J. Preparation and characterization of ß-lactoglobulin/poly(ethylene oxide) magnetic nanofibers for biomedical applications. Colloids Surfaces A Physicochem. Eng. Asp. 2019, 576, 63–72. [Google Scholar] [CrossRef]
- Sanam, P.K.J.A.; Shah, M.; Pradyumnan, P.P. Structure induced modification on thermoelectric and optical properties by Mg doping in CuCrO2 nanocrystals. Solid State Commun. 2022, 353, 114855. [Google Scholar] [CrossRef]
- Chen, C.Y.; Sakthinathan, S.; Yu, C.L.; Wang, C.C.; Chiu, T.W.; Han, Q. Preparation and characterization of delafossite CuCrO2 film on flexible substrate. Ceram. Int. 2021, 47, 23234–23239. [Google Scholar] [CrossRef]
- Lin, S.-Y.; Chiu, T.-W.; Dong, C. Preparation and characterization of CuCrO2–CeO2 composite nanopowder by a self-combustion glycine nitrate process. Ceram. Int. 2017, 43, S639–S642. [Google Scholar] [CrossRef]
- Yu, C.-L.; Lai, G.-T.; Sakthinathan, S.; Lin, C.-C.; Chiu, T.-W.; Liu, M.-C. Hydrogen generation from methanol steam reforming process of CuCrO2–CeO2 nanopowders catalyst. Mater. Sci. Eng. B 2022, 286, 115989. [Google Scholar] [CrossRef]
- Çetin, Ç.; Akyıldız, H. Production and characterization of CuCrO2 nanofibers 13. Mater. Chem. Phys. 2016, 170, 138–144. [Google Scholar] [CrossRef]
- Trevino, K.M.; Tautges, B.K.; Kapre, R.; Franco, F.C., Jr.; Or, V.W.; Balmond, E.I.; Shaw, J.T.; Garcia, J.; Louie, A.Y. Highly Sensitive and Selective Spiropyran-Based Sensor for Copper(II) Quantification. ACS Omega 2021, 6, 10776–10789. [Google Scholar] [CrossRef]
- Serafin, J.; Llorca, J. Nanoshaped Cerium Oxide with Nickel as a Non-Noble Metal Catalyst for CO2 Thermochemical Reactions. SSRN Electron. J. 2022, 2, 2926. [Google Scholar] [CrossRef]
- Chen, W.P.; He, K.F.; Wang, Y.; Chan, H.L.W.; Yan, Z. Highly mobile and reactive state of hydrogen in metal oxide semiconductors at room temperature. Sci. Rep. 2013, 3, 3149. [Google Scholar] [CrossRef] [PubMed] [Green Version]
- Gopal, C.B.; García-Melchor, M.; Lee, S.C.; Shi, Y.; Shavorskiy, A.; Monti, M.; Guan, Z.; Sinclair, R.; Bluhm, H.; Vojvodic, A.; et al. Equilibrium oxygen storage capacity of ultrathin CeO2-δ depends non-monotonically on large biaxial strain. Nat. Commun. 2017, 8, 15360. [Google Scholar] [CrossRef] [PubMed] [Green Version]
- Kumari, M.; Singh, S.P.; Chinde, S.; Rahman, M.F.; Mahboob, M.; Grover, P. Toxicity Study of Cerium Oxide Nanoparticles in Human Neuroblastoma Cells. Int. J. Toxicol. 2014, 33, 86–97. [Google Scholar] [CrossRef] [PubMed]
- Raudonyte-Svirbutaviciene, E.; Neagu, A.; Vickackaite, V.; Jasulaitiene, V.; Zarkov, A.; Tai, C.-W.; Katelnikovas, A. Two-step photochemical inorganic approach to the synthesis of Ag-CeO2 nanoheterostructures and their photocatalytic activity on tributyltin degradation. J. Photochem. Photobiol. A Chem. 2018, 351, 29–41. [Google Scholar] [CrossRef]
- Murali, A.; Sarswat, P.K.; Free, M.L. Minimizing electron-hole pair recombination through band-gap engineering in novel ZnO-CeO2-rGO ternary nanocomposite for photoelectrochemical and photocatalytic applications. Environ. Sci. Pollut. Res. 2020, 27, 25042–25056. [Google Scholar] [CrossRef]
- Wang, Q.; Zhou, X.; Ji, S.; Li, S.; Gu, J.; Shen, L.; Liu, P.; Yin, J.; Xu, G.; Shi, W. Synthesis and photocatalysis of novel Z-scheme CeO2/Ag-AgVO3 heterojunction nanofibers and their efficient antibacterial properties. J. Environ. Chem. Eng. 2021, 9, 106498. [Google Scholar] [CrossRef]
- Sabzehmeidani, M.M.; Karimi, H.; Ghaedi, M. CeO2 nanofibers-CdS nanostructures n–n junction with enhanced visible-light photocatalytic activity. Arab. J. Chem. 2020, 13, 7583–7597. [Google Scholar] [CrossRef]
- Wang, C.-C.; Yu, C.-L.; Sakthinathan, S.; Chen, C.-Y.; Chiu, T.-W.; Fu, Y.-S. Preparation and characterization of CuCrO2–CeO2 nanofibers by electrospinning method. J. Mater. Sci. Mater. Electron. 2021, 33, 1091–1100. [Google Scholar] [CrossRef]
- Lin, Y.-H.; Chiu, T.-W.; Park, J.-H. Lamination of CuCrO2 thin films to poly methyl methacrylate substrate with boron nitride demolding layer. Ceram. Int. 2018, 44, S22–S25. [Google Scholar] [CrossRef]
- Dong, Y.; Lin, H.; Qu, F. Synthesis of ferromagnetic ordered mesoporous carbons for bulky dye molecules adsorption. Chem. Eng. J. 2012, 193–194, 169–177. [Google Scholar] [CrossRef]
- Saravanan, S.; Carolin, C.F.; Kumar, P.S.; Chitra, B.; Rangasamy, G. Biodegradation of textile dye Rhodamine-B by Brevundimonas diminuta and screening of their breakdown metabolites. Chemosphere 2022, 308, 136266. [Google Scholar] [CrossRef]
- Aktas, O.; Truong, K.D.; Otani, T.; Balakrishnan, G.; Clouter, M.J.; Kimura, T.; Quirion, G. Raman scattering study of delafossite magnetoelectric multiferroic compounds: CuFeO2 and CuCrO2. J. Physics Condens. Matter 2011, 24, 036003. [Google Scholar] [CrossRef] [Green Version]
- Monteiro, J.F.H.L.; Siqueira, E.C.; Vallis, D.S.; de Andrade, E.; Barcote, M.V.W.; Jurelo, A.R. Raman spectroscopy of (Fe,Li)-doped delafossite oxide CuCrO2. Vib. Spectrosc. 2018, 98, 77–81. [Google Scholar] [CrossRef]
- Li, Z.; Deng, L.; Kinloch, I.A.; Young, R.J. Raman spectroscopy of carbon materials and their composites: Graphene, nanotubes and fibres. Prog. Mater. Sci. 2023, 135, 101089. [Google Scholar] [CrossRef]
- Lee, M. A Raman Study of CeO2 Nanomaterials with Different Morphologies. Master’s Thesis, Friedrich-Alexander University Erlangen-Nürnberg, Erlangen, Germany, 2017; pp. 1–45. [Google Scholar]
- Sakthinathan, S.; Keyan, A.K.; Rajakumaran, R.; Chen, S.-M.; Chiu, T.-W.; Dong, C.; Vinothini, S. Synthesis of N-rGO-MWCNT/CuCrO2 Catalyst for the Bifunctional Application of Hydrogen Evolution Reaction and Electrochemical Detection of Bisphenol-A. Catalysts 2021, 11, 301. [Google Scholar] [CrossRef]
- Bortamuly, R.; Konwar, G.; Boruah, P.K.; Das, M.R.; Mahanta, D.; Saikia, P. CeO2-PANI-HCl and CeO2-PANI-PTSA composites: Synthesis, characterization, and utilization as supercapacitor electrode materials. Ionics 2020, 26, 5747–5756. [Google Scholar] [CrossRef]
- Zhang, Y.; Shi, R.; Yang, P.; Song, X.; Zhu, Y.; Ma, Q. Fabrication of electronspun porous CeO2 nanofibers with large surface area for pollutants removal. Ceram. Int. 2016, 42, 14028–14035. [Google Scholar] [CrossRef]
- Zhang, J.; Ma, Y.; Han, Y.; Xu, K.; Yao, S.; Shi, L.; Zhu, M. 3D porous structure assembled from MXene via breath figure method for electrochemical detection of dopamine. Chem. Eng. J. 2023, 452, 139414. [Google Scholar] [CrossRef]
- Sharma, V.; Singh, P.; Kumar, A.; Gupta, N. Electrochemical detection of dopamine by using nickel supported carbon nanofibers modified screen printed electrode. Diam. Relat. Mater. 2023, 133, 109677. [Google Scholar] [CrossRef]
- Vinoth, S.; Ramaraj, R.; Pandikumar, A. Facile synthesis of calcium stannate incorporated graphitic carbon nitride nanohybrid materials: A sensitive electrochemical sensor for determining dopamine. Mater. Chem. Phys. 2020, 245, 122743. [Google Scholar] [CrossRef]


| Sample Name | Material | Crystalline Size (nm) | Micro-Strain (103) | FWHM |
|---|---|---|---|---|
| CCC1:2 | CuCrO2 | 28.02 | 4.40 | 0.33 |
| CeO2 | 5.20 | 21.85 | 1.85 | |
| CCC1.2:2 | CuCrO2 | 7.11 | 17.80 | 1.30 |
| CeO2 | 9.86 | 11.27 | 0.97 | |
| CCC2:1 | CuCrO2 | 5.63 | 20.32 | 1.70 |
| CeO2 | 10.69 | 10.48 | 0.90 |
| Compound | Surface Area | Reference |
|---|---|---|
| CuCrO2 (Electrospinning) | 7.85 m2/g | 19 |
| CeO2 (Electrospinning) | 195.75 m2/g | 39 |
| CeO2–CuCrO2 (Combustion glycine nitrate) CeO2–CuCrO2 (Electrospinning) | 46.13 m2/g 25.03 m2/g | 17 This work |
Disclaimer/Publisher’s Note: The statements, opinions and data contained in all publications are solely those of the individual author(s) and contributor(s) and not of MDPI and/or the editor(s). MDPI and/or the editor(s) disclaim responsibility for any injury to people or property resulting from any ideas, methods, instructions or products referred to in the content. |
© 2023 by the authors. Licensee MDPI, Basel, Switzerland. This article is an open access article distributed under the terms and conditions of the Creative Commons Attribution (CC BY) license (https://creativecommons.org/licenses/by/4.0/).
Share and Cite
Lei, H.-J.; Su, H.-M.; Vasu, D.; You, Y.-F.; Chiu, T.-W.; Vittayakorn, N. Highly Efficient CeO2–CuCrO2 Composite Nanofibers Used for Electrochemical Detection of Dopamine in Biomedical Applications. Fibers 2023, 11, 66. https://doi.org/10.3390/fib11080066
Lei H-J, Su H-M, Vasu D, You Y-F, Chiu T-W, Vittayakorn N. Highly Efficient CeO2–CuCrO2 Composite Nanofibers Used for Electrochemical Detection of Dopamine in Biomedical Applications. Fibers. 2023; 11(8):66. https://doi.org/10.3390/fib11080066
Chicago/Turabian StyleLei, Heng-Jyun, Homg-Ming Su, Dhanapal Vasu, Yu-Feng You, Te-Wei Chiu, and Naratip Vittayakorn. 2023. "Highly Efficient CeO2–CuCrO2 Composite Nanofibers Used for Electrochemical Detection of Dopamine in Biomedical Applications" Fibers 11, no. 8: 66. https://doi.org/10.3390/fib11080066