
Natural and Sustainable? Consumers’ Textile Fiber Preferences


Consumption Research Norway (SIFO), Oslo Metropolitan University, 0170 Oslo, Norway
*
Author to whom correspondence should be addressed.
Fibers 2023, 11(2), 12; https://doi.org/10.3390/fib11020012
Submission received: 30 November 2022
/
Revised: 12 January 2023
/
Accepted: 19 January 2023
/
Published: 26 January 2023
(This article belongs to the Special Issue Natural Fiber Competitiveness and Sustainability)
Abstract
:Textile fibers have become a major issue in the debate on sustainable fashion and clothing consumption. While consumers are encouraged to choose more sustainable and circular textile materials, studies have indicated that a reduction in production and consumption has the greatest potential to reduce the total environmental impact. This can be considered an ecocentric perspective with a focus on degrowth as opposed to a technocentric view where new technologies are expected to solve environmental problems while economic growth continues. Based on a survey in Norway (N = 1284), we investigate how the techno- and ecocentric perspectives impact Norwegian consumers’ fiber preferences and perceptions and the corresponding effects on their clothing consumption. We found that the majority of consumers preferred natural fibers compared to synthetic materials. This contradicts current market practices and the recommendations by material sustainability comparison tools such as the Higg Material Sustainability Index (MSI), where many synthetics receive better ratings than natural fibers. We also found that perceptions of high sustainability regarding fibers were negatively correlated with reduced consumption. Our study suggests that a continued focus on material substitution and other technological measures for reducing climate change will impede the move toward sustainability in the textile sector.
1. Introduction
Clothing consumption has increased dramatically in the last decades, leading to vast levels of environmental pollution and problems related to social inequity [1,2]. The substantial increase in textile production has occurred almost entirely due to synthetic fibers which represent over two-thirds of all materials used in textiles, and over half of all textiles contain synthetics [3,4]. The clothing and textile industry is impactful due to high CO2 emissions, water consumption, chemical use, microplastic pollution, and massive volumes of waste [1,5]. Increased production volumes as a result of today’s fast fashion production pattern have resulted in increased textile waste generation. Both pre- and post-consumer textile waste volumes have increased in tandem with fast fashion [1]. The impacts of the clothing and textile industry have been acknowledged by policymakers, the industry and other stakeholders, as for instance the European Union (EU) developed a strategy for sustainable and circular textiles in order to start tackling the problem [6]. The main goal of the strategy is to shift the textile industry to a climate-neutral, circular economy where textile products placed on the EU market are long-lived, recyclable, contain a significant amount of recycled fibers, free of hazardous substances, and produced in respect of social rights and the environment.
Proposed solutions to sustainability issues in the fashion sector have focused predominantly on technological measures [7]. One of the most common suggestions to reducing the environmental impacts of textile production in line with the EU priorities is the use of more sustainable materials, such as recycled or organic fibers. The Preferred Fiber and Materials Market Report shows that though the share of fibers produced according to specified standards has increased, they represent less than one-fifth of the global fiber market [8]. Within textile recycling, polyester and cotton are two of the most studied materials [9]. However, to date, most recycled polyester originates from plastic bottles, and in 2020, less than 0.5% of the global fiber market originated from pre- and post-consumer recycled textiles. In addition, several negative impacts have been pointed out by researchers in relation to producing and using sustainable fibers and materials. Özkan and Gündoğdu [10] found that recycled polyester sheds almost 2.3 times more microplastics in washing compared to virgin polyester as the strength of the fiber is reduced due to thermal exposure and shear degradation during the recycling process. For organic cotton, attention has been called to issues such as higher production costs and the need for more agricultural land to achieve equal yields to conventional cotton [11,12,13]. The production of new sustainable fibers to replace conventional fiber types has also received attention. Examples of this include regenerated cellulose fibers made from materials such as byproducts from the citrus industry and biomass waste products from the beer, wine, and liquor industries [8], and bio-leather made from soy or mushrooms [14]. Recently, the issue of sustainable fibers has become even more complex as attention has been drawn to the poor quality of data used in fiber comparisons, which leads to inaccuracies in conclusions regarding the environmental impacts of materials [15,16,17].
Another perspective that has often been referred to as “ecocentric” is the reduction of levels of production and consumption. In this view, it is assumed that approaches focused solely on technical aspects will prove insufficient in terms of overturning the negative impacts of a continuously growing textile sector. It is argued that both production and consumption have increased to levels that effectively reduce the benefits of the industry’s technological development [18], and that efforts to improve resource efficiency must be complemented by changes in consumption patterns and reductions in material consumption [19]. Maldini and Balkenende [20] applied this argument to the apparel sector and stated that the amount of clothes being produced is a central issue. However, decreasing production volumes is challenging since many stakeholders, including brands, manufacturers, media, and consumers, benefit from the growing fashion industry.
Strategies for reducing textile production and consumption have been developed but currently remain at the conceptual level [21]. However, consumer behavior is difficult to predict, and even if these strategies are implemented, consumers may still increase total consumption [18]. While the various impacts of products and materials have been studied, the development of socio-economic systems of sustainable consumption requires more knowledge about consumer behavior in order to ensure that potential environmental savings from the products will not be lost on additional purchases or that there will be no other rebound effects [19,22]. In Norway, a general change in consumers’ environmental attitudes has been detected. Norwegian consumers have become more optimistic about technological innovations and increasingly believe in technological solutions to environmental and climate challenges of the future while maintaining the current levels of consumption. The belief that consumers’ actions will have an impact has simultaneously decreased, thereby affecting consumers’ willingness to reduce consumption and hindering society in moving forward in a more sustainable direction [21].
Understanding the correlations between different approaches to and understandings of sustainable textile consumption and production, and consumers’ perceptions of fibers can render valuable insights into consumer behavior which may guide future proposals for sustainability within the clothing and textile sector. This article will explore the topic through the following research question:
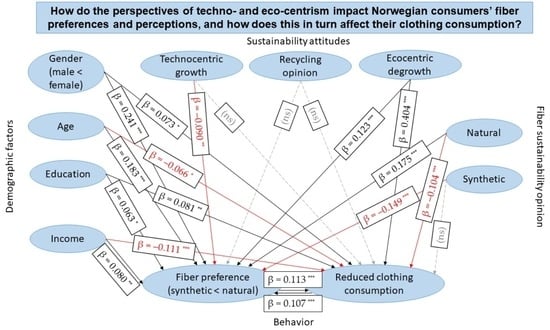
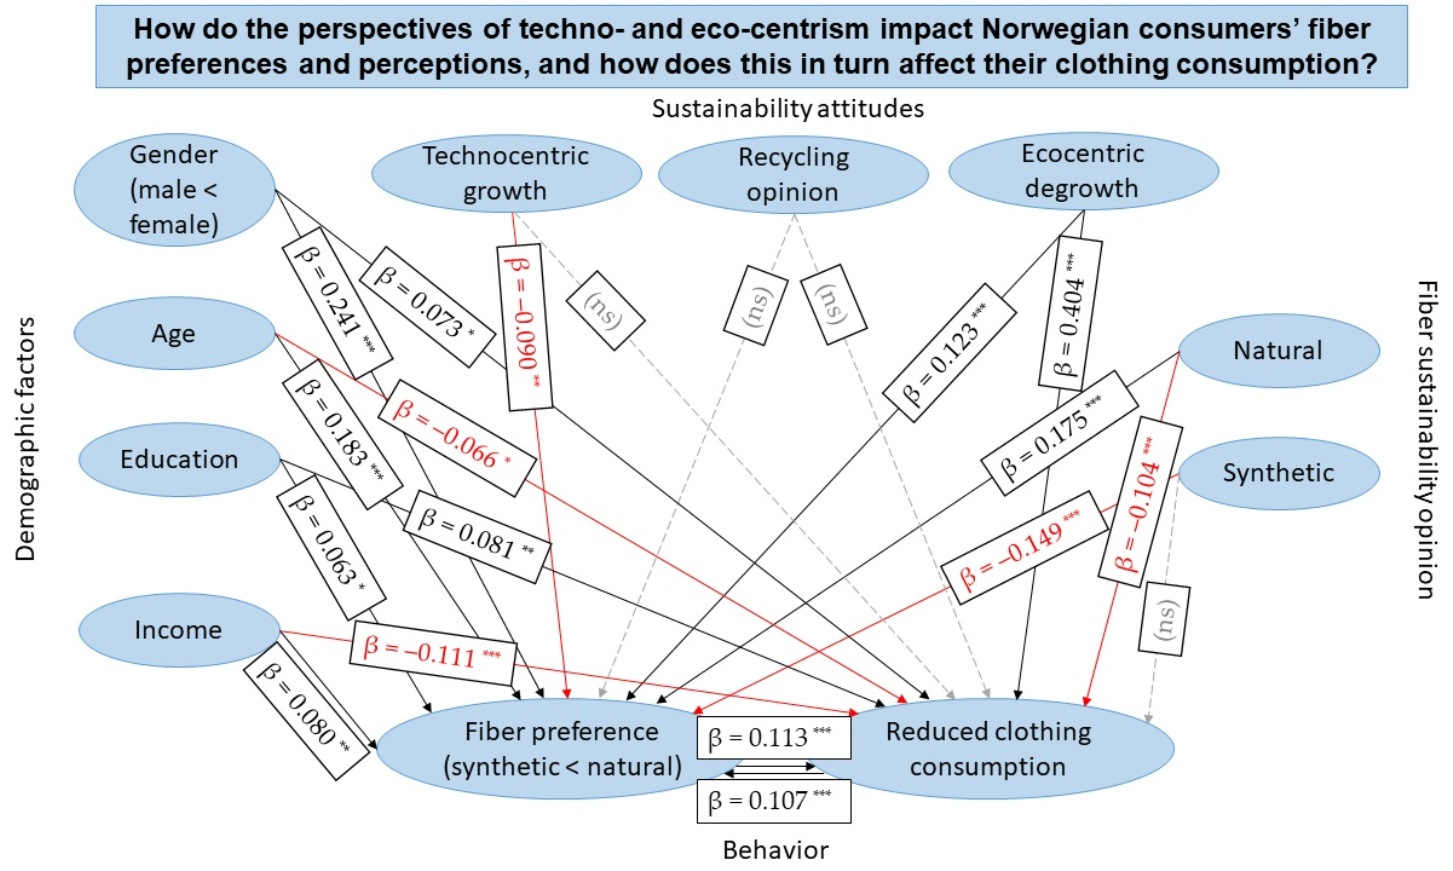
How do the perspectives of techno- and eco-centrism impact Norwegian consumers’ fiber preferences and perceptions, and how does this, in turn, affect their clothing consumption?
The article is structured as follows. First, in Section 2, we will present literature on sustainable clothing consumption and consumer positions with key theoretical concepts pertinent to our research. This includes the building of hypotheses and presenting a model to test them. The third section describes the research method and analysis, followed by a presentation of the results in Section 4. In the fifth section, we discuss our results and, finally, conclude and provide recommendations for future studies in Section 6.
2. Background and Hypotheses Development
This section will present an overview of previous research on three topics: consumers’ fiber preferences according to demographic indicators; the sustainability of fibers, including tools for measurement and consumer perceptions; and the techno- vs. ecocentric perspectives. Previous research will be used for development of the hypotheses.
2.1. Sustainable Clothing Consumption and Consumer Preferences
There are various mechanisms through which consumers can adopt sustainable practices in their acquisition of clothing. They can choose products that they believe to have been produced in a more sustainable manner and, thus, have had a lower environmental impact during prior steps in the value chain. They can also reduce the volumes they purchase, for example, by using existing garments for longer periods, or borrowing or renting instead of buying new ones. This section presents an overview of previous research on consumers’ preferences and attitudes regarding clothing acquisitions in terms of fiber choice and sustainability.
2.1.1. Fiber Preferences
Fiber preferences have been studied both in general and in correlation with certain demographic groups. According to Forsythe and Thomas [23], fiber content is one of the most important criteria influencing decisions regarding clothing acquisition. The choice of fiber is significant for the appearance of garments. Sensory attraction plays an important role in driving purchases since consumers use touch to evaluate and appreciate textile products. Touching the fabric is among one of the first actions performed when evaluating fabric quality and performance [24].
Studies have found that consumers use fiber content as an indicator of quality when purchasing garments. Davis [25] found that identifying a garment as 100% cotton led to higher ratings than garments labeled as a polyester-cotton blend. Johnson and Workman [26] demonstrated that consumer perception related to fabric characteristics improved aesthetic appeal by adding as little as five to ten percent of natural fibers (silk) to synthetic (polyester) garments. In addition, they found indications that the participants were more likely to purchase garments consisting of 100% silk than garments containing any amount of polyester. Hatch and Roberts [27] found a correlation between price and fiber as garments comprising wool recorded a significantly higher rating than acrylic garments, though only at the higher price point.
Other factors may impact fiber preferences that may have nothing to do with the specific properties of the fibers. Textile production can impact animal welfare in various ways, which may affect preferences for certain types of fibers. For example, some consumers may avoid wool due to the mulesing of Merino sheep, which is a procedure where skinfolds around a lamb’s breech and tail are severed in order to prevent flies from laying eggs [28,29]. While the procedure is painful, it prevents sheep from contracting the potentially fatal condition flystrike. However, the Merino wool industry is working on breeding to reduce the need for mulesing [30]. The production of fibers that are not of animal origin can also have indirect impacts on animal welfare through ecosystem damage. Examples include the use of toxic chemicals, the destruction of wildlife, or the spread of plastics (synthetics) in nature.
The textile contents of different materials have different properties that impact comfort during use [31]. Thermophysical comfort is affected by heat and moisture exchange between the wearer’s body and the environment [32]. Fibers with high bending rigidity feel coarser and may cause a prickling sensation during use, while finer fibers produce smoother fabrics [33]. These and other physical properties are likely to impact the consumer fiber preference for different applications.
Wilfling et al. [34] studied consumers’ perceptions of clothing comfort in sports and exercise wear and found that men compared to women considered cotton to be heavier and warmer. Furthermore, more men than women considered polyester to be silkier and have a colder sensation, whereas women compared to men considered polyester to be stiffer. For sports clothing, warm, heavy, and stiff characteristics can be considered negative associations, whereas cool and silky feelings can be positive. This led the authors to assume that more men prefer polyester for sports clothes than women and that more women prefer cotton. Čubrić et al. [24] found that female consumers perceived viscose fabrics as the smoothest and fabrics with elastane as the softest while male consumers perceived polyester fabrics as the smoothest and cotton fabrics as the softest. In addition, studies have found that women have greater concerns about the human health impacts of marine plastic pollution [35] and a greater willingness than men to reduce microplastic emissions [36]. This could negatively influence women’s perception of synthetic fibers. Thus, we propose the following hypothesis:
Hypothesis (H1a).
Women have a greater preference than men for more natural fibers.
Schutz and Phillips [37] found that older women distinguished between synthetic and natural fibers more than younger women, making it more likely that their preference will be based on fiber content. When Forsythe and Thomas [23] examined women’s perceptions of and preferences for fiber, they found that the age group 25–34 years preferred cotton for a casual blouse, whereas the age group 35–49 had a preference for the polyester-cotton blend. This may be explained by the sensational introduction of synthetics as a material for clothing production due to their quick-drying, no-iron qualities from the mid-1950s to the 1970s [38]. This popularity may still be remembered by the 35–49 years age group but not by younger women. Similarly, Peterson et al. [39] studied consumer preferences for wool products in the US and found that they generally preferred wool to acrylic. However, in this study, the older respondents valued acrylic over wool. Čubrić et al. [24] studied consumer preferences for single jersey knit fabrics and found that consumers aged 40+ had a particular preference for viscose when it came to smoothness. Birtwistle and Tsim [40] studied consumer purchasing behavior among mature women (aged 45+) in the UK and found a preference for natural fibers due to their comfort. The largest consumers of fast fashion are generally younger and primarily Generation Y (born between the start of the 1980s and mid-1990s) [41,42], and since fast fashion largely consists of garments made entirely from or containing synthetic fibers, it can be argued that this consumer segment may be less negative toward these materials. As such, studies have indicated different directions related to age and fiber preference. However, based on a majority of existing studies, we propose the following hypothesis:
Hypothesis (H1b).
Elderly respondents prefer more natural fibers.
Čubrić et al. [24] found that although all the respondents in their study considered fabrics containing elastane as very soft and smooth in comparison with other fabrics, consumers with the highest level of education also included viscose and polyester as a preference in terms of smoothness. Conversely, Forsythe and Thomas [23], found that the preference for blends was higher among those with less education and most education than those in with mid-level education. Blends were considered more luxurious and durable among those with less education than the more highly educated. In a study of fiber preferences for thermal comfort in cold weather, Roper [43] found that education had an effect on the preference for wool as those with no college education were more negative towards wool than the college-educated group. Again, studies have indicated different directions, but based on a majority, the following hypothesis is proposed:
Hypothesis (H1c).
Respondents characterized by higher education prefer more natural fibers.
Few studies have examined the correlation between income and fiber preference. Saricam and Erdumlu [44] found that fast fashion consumers in Turkey were generally young and on low income. Since fast fashion products contain high quantities of synthetic materials making them relatively cheaper than other garments, it could be assumed that people on low income prefer synthetic fibers. However, this assumption is based on the price of the garments as an important factor and may not hold true for garments of equal price but varying fiber content. It could still be assumed that low-income consumers are less negative toward synthetic fibers than those on higher incomes. Peterson et al. [41], for example, found that respondents on higher incomes valued wool over acrylic. Therefore, the following hypothesis will be tested:
Hypothesis (H1d).
Respondents with higher incomes prefer more natural fibers.
2.1.2. Reduced Clothing Consumption
Studies have shown that female consumers purchase clothes more frequently than their male counterparts [45], arguably indicating that women would be less likely than men to reduce their clothing consumption. However, so-called conscious or “green” consumers are more often women who often have a higher education level [46,47,48]. These are consumers who are more sensitive to environmental issues and are willing to pay more for environmentally friendly products. This group has also been argued to include people on higher incomes as they can afford the increase in the cost of more environmentally friendly products [49]. However, in terms of reducing consumption, Lang et al. [45] showed that consumers on higher incomes disposed of clothing more frequently than those on lower incomes. This may be due to the fact that higher-income consumers have a greater financial ability to purchase more new clothing, resulting in more frequent turnover. Older consumers have been shown to have a lower turnover as they wear their clothes for longer periods of time; they are not as sensitive to issues of style and fit as younger people and, therefore, discard their clothing at a relatively slower rate [45,50,51]. Based on this, the following hypotheses are proposed:
Hypothesis (H1e).
Women are more likely to report reduced clothing consumption.
Hypothesis (H1f).
Elderly respondents are less likely to report reduced clothing consumption.
Hypothesis (H1g).
Respondents with higher levels of education are more likely to report reduced clothing consumption.
Hypothesis (H1h).
Respondents on higher incomes are less likely to report reduced clothing consumption.
2.2. Sustainable Production, Tools, and Consumer Perceptions
According to Sandin et al. [17] “there are no ”sustainable” or ”unsustainable” fibre types” (p. 8). Furthermore, fiber production represents only about 12% of the total environmental impact from textile production, according to a recent UN report [52]. However, the choice of fiber impacts the functional properties and lifetime of garments, and some fibers are more difficult to manage sustainably at the end-of-life state. Therefore, the properties of a fiber and how they fit into the product life cycle in an environmentally appropriate way are important to consider [17].
Measuring the sustainability of clothing consumption has been prioritized by both industry and political actors, and several tools have been developed. Among the most frequently discussed are the Higg Material Sustainability Index (MSI) and the EU Product Environment Footprint (PEF). The Higg MSI was developed by the Sustainable Apparel Coalition as a tool for measuring the environmental impact of materials used in clothing production [53]. The PEF was developed by the European Union as a method for quantifying environmental impacts over the lifetime of a product [54]. The current Higg MSI scoring claims that most synthetic fibers are a more sustainable choice than natural fibers, especially if recycled [15,55]. Both tools have been heavily criticized, including in relation to non-transparent datasets and being overly influenced by industry interests [56]. These difficulties in data collection due to long and highly distributed value chains have also been identified by Luo et al. [57] as a major challenge in LCA and footprint-based methods regarding textiles. Another concern is that they overlook the impact of microplastic pollution from polyester garments [16,55]. Recently, more attention has been drawn to problems connected to the spread of micro- and nanoplastics in nature. The EU has banned microplastics from rinse-off cosmetics as an effective intervention against intentionally added microplastics [58], but to date, there are no regulations or measurement standard of microplastics in textiles.
The actual sustainability of different fibers is difficult to determine due to large local differences and boundaries to Life Cycle Analysis (LCA) that make comparisons between synthetics and natural materials difficult, or even impossible [55,59]. In addition, dyeing and finishing are often more critical in terms of environmental impact than fiber content, albeit less discussed [5,53,60].
At the same time, interest in sustainability in the fashion industry has increased over the last decade and consumers are becoming increasingly interested in purchasing sustainable clothing [61,62]. Therefore, it is likely that consumers will prefer fiber types that they perceive to be more sustainable. Hiller Connell [63] found that participants who wished to take part in eco-conscious apparel acquisition bought some of their clothes because they perceived the fiber content to be environmentally friendly. The same study found that the most common environmentally preferable fibers among the participants were organic cotton and recycled fibers. The following section discusses a correlation between the perception of sustainability and the preference for fibers and reduced clothing consumption. Therefore, the following hypotheses are suggested:
Hypothesis (H2a).
Respondents who believe that natural fibers are sustainable prefer more natural fibers.
Hypothesis (H2b).
Respondents who believe that natural fibers are sustainable are more likely to report reduced clothing consumption.
Hypothesis (H3a).
Respondents who believe that synthetic fibers are sustainable are less likely to prefer natural fibers.
Hypothesis (H3b).
Respondents who believe that synthetic fibers are sustainable are less likely to report reduced clothing consumption.
2.3. Techno-Optimism or Reduced Consumption
Payne [64] established two positions within sustainable fashion with differing definitions of sustainability: the techno- and ecocentric. On one hand, techno-optimists propose a future in which cleaner technologies will lead to the gradual evolution of a better industry. On the other hand, a cautionary approach is suggested; it seeks to unbind fashion from the unsustainable growth imperative of capitalism. A recent report by Consumption Research Norway (SIFO) found the technocentric and ecocentric narratives to be prevalent in the analysis of marketing strategies of clothing and cosmetics through the use of sustainability claims [65]. These two perspectives differ in the way they perceive the sustainable consumption of clothes and textiles, their preferences for materials and fiber, and the way they perceive the role of the consumer. We will outline some of the major themes within the positions.
2.3.1. Technocentric Green Growth
The technocentric perspective can be broadly defined as techno-optimism; the belief that advances within science and technology will be able to solve current and future environmental problems within the economic growth imperative [66]. As a theory, green growth asserts that continued economic expansion will be compatible with our planet’s ecology through the absolute decoupling of GDP growth from resource use and carbon emissions [67]. Technological environmental innovations will represent the solution to environmental problems through “greening strategies” such as sustainable resource management, clean technologies, product design for environment, recycling, and low-emissions processes [68]. Here, the consumer plays the role of a ”purchaser” who accepts and adopts new and greener products and services [69,70]. Continued consumption is perceived as necessary for the deployment of improved technologies and continued economic growth [64].
In relation to textiles, the technocentric perspective is firmly positioned within the existing fashion system and holds that sustainable development within this system and continued capitalist expansion are not mutually exclusive [64]. Green growth aims to decouple growth in the textile industry from a reliance on virgin materials by keeping already-produced materials in circulation for as long as possible. Solutions to environmental issues in the fashion industry revolve around technical aspects, such as better filtering out of microplastics, recycling, and the development of new, sustainable fiber types. [64,71]. Furthermore, “greener” materials, such as bio-synthetics (laboratory-developed synthetic fibers made from industrial and agricultural waste) and recycled fibers, should be preferred and chosen over other fibers [72].
Based on the technocentric perspective, the following hypotheses are proposed:
Hypothesis (H4a).
Respondents who score high on technocentric green growth opinion are less likely to prefer natural fibers.
Hypothesis (H4b).
Respondents who score high on technocentric green growth opinion are less likely to report reduced clothing consumption.
Hypothesis (H5a).
Respondents who think recycling is important do not have a preference between natural and synthetic fibers (as both can be recycled).
Hypothesis (H5b).
Respondents who believe that recycling is important are less likely to report reduced clothing consumption.
2.3.2. Ecocentric Degrowth
In contrast to the technocentric perspective, the ecocentric degrowth narrative holds at its core ideas such as scarcity, reduced consumption and lifestyle sacrifices at a time of shrinking resources. A cautious approach in a postgrowth fashion system is suggested [64,73]. The ecocentric approach does not disregard technology but holds that we cannot rely solely on new and better technology. Instead, it focuses primarily on behavior change and argues that a paradigm shift is necessary to transform conventional fashion production and consumption [64].
Fletcher and Tham [74] developed the Earth Logic Research Plan (ELRP), which encourages “researchers, practitioners and decision makers to call out as fiction the idea that sustainability can be achieved within growth logic” and, instead, put the planet and the health of all species before industry, business, and economic growth. It is critical toward ideas such as the circular economy, claiming it to be part of the same paradigm that created the problems in the first place [69] and stating that it remains inattentive to whether the goal of growth is possible within ecological limits. The ELRP represents a perspective that champions the reduced production and consumption of textiles and where synthetics are faced out and replaced by natural, biodegradable fibers [75]. It perceives plastics as textiles and, thus, highly problematic and argues that plastics cannot be insulated in separate circles from natural materials because they inevitably ”leak”, especially during use and laundering. A consequence of this is the standpoint of the ELRP that “any material in use must not pollute when it inevitably escapes,” and “there is no alternative to the phasing out of non-compostable materials like polyester” [74].
Based on the ecocentric perspective, the following hypotheses are proposed:
Hypothesis (H6a).
Respondents who score high on ecocentric degrowth opinions are more likely to prefer natural fibers.
Hypothesis (H6b).
Respondents who score high on ecocentric degrowth opinions are more likely to report reduced clothing consumption.
Hypothesis (H7).
Respondents who prefer natural fibers are more likely to report reduced clothing consumption.
Hypothesis (H8).
Respondents who have reduced their clothing consumption will more likely prefer natural fibers.
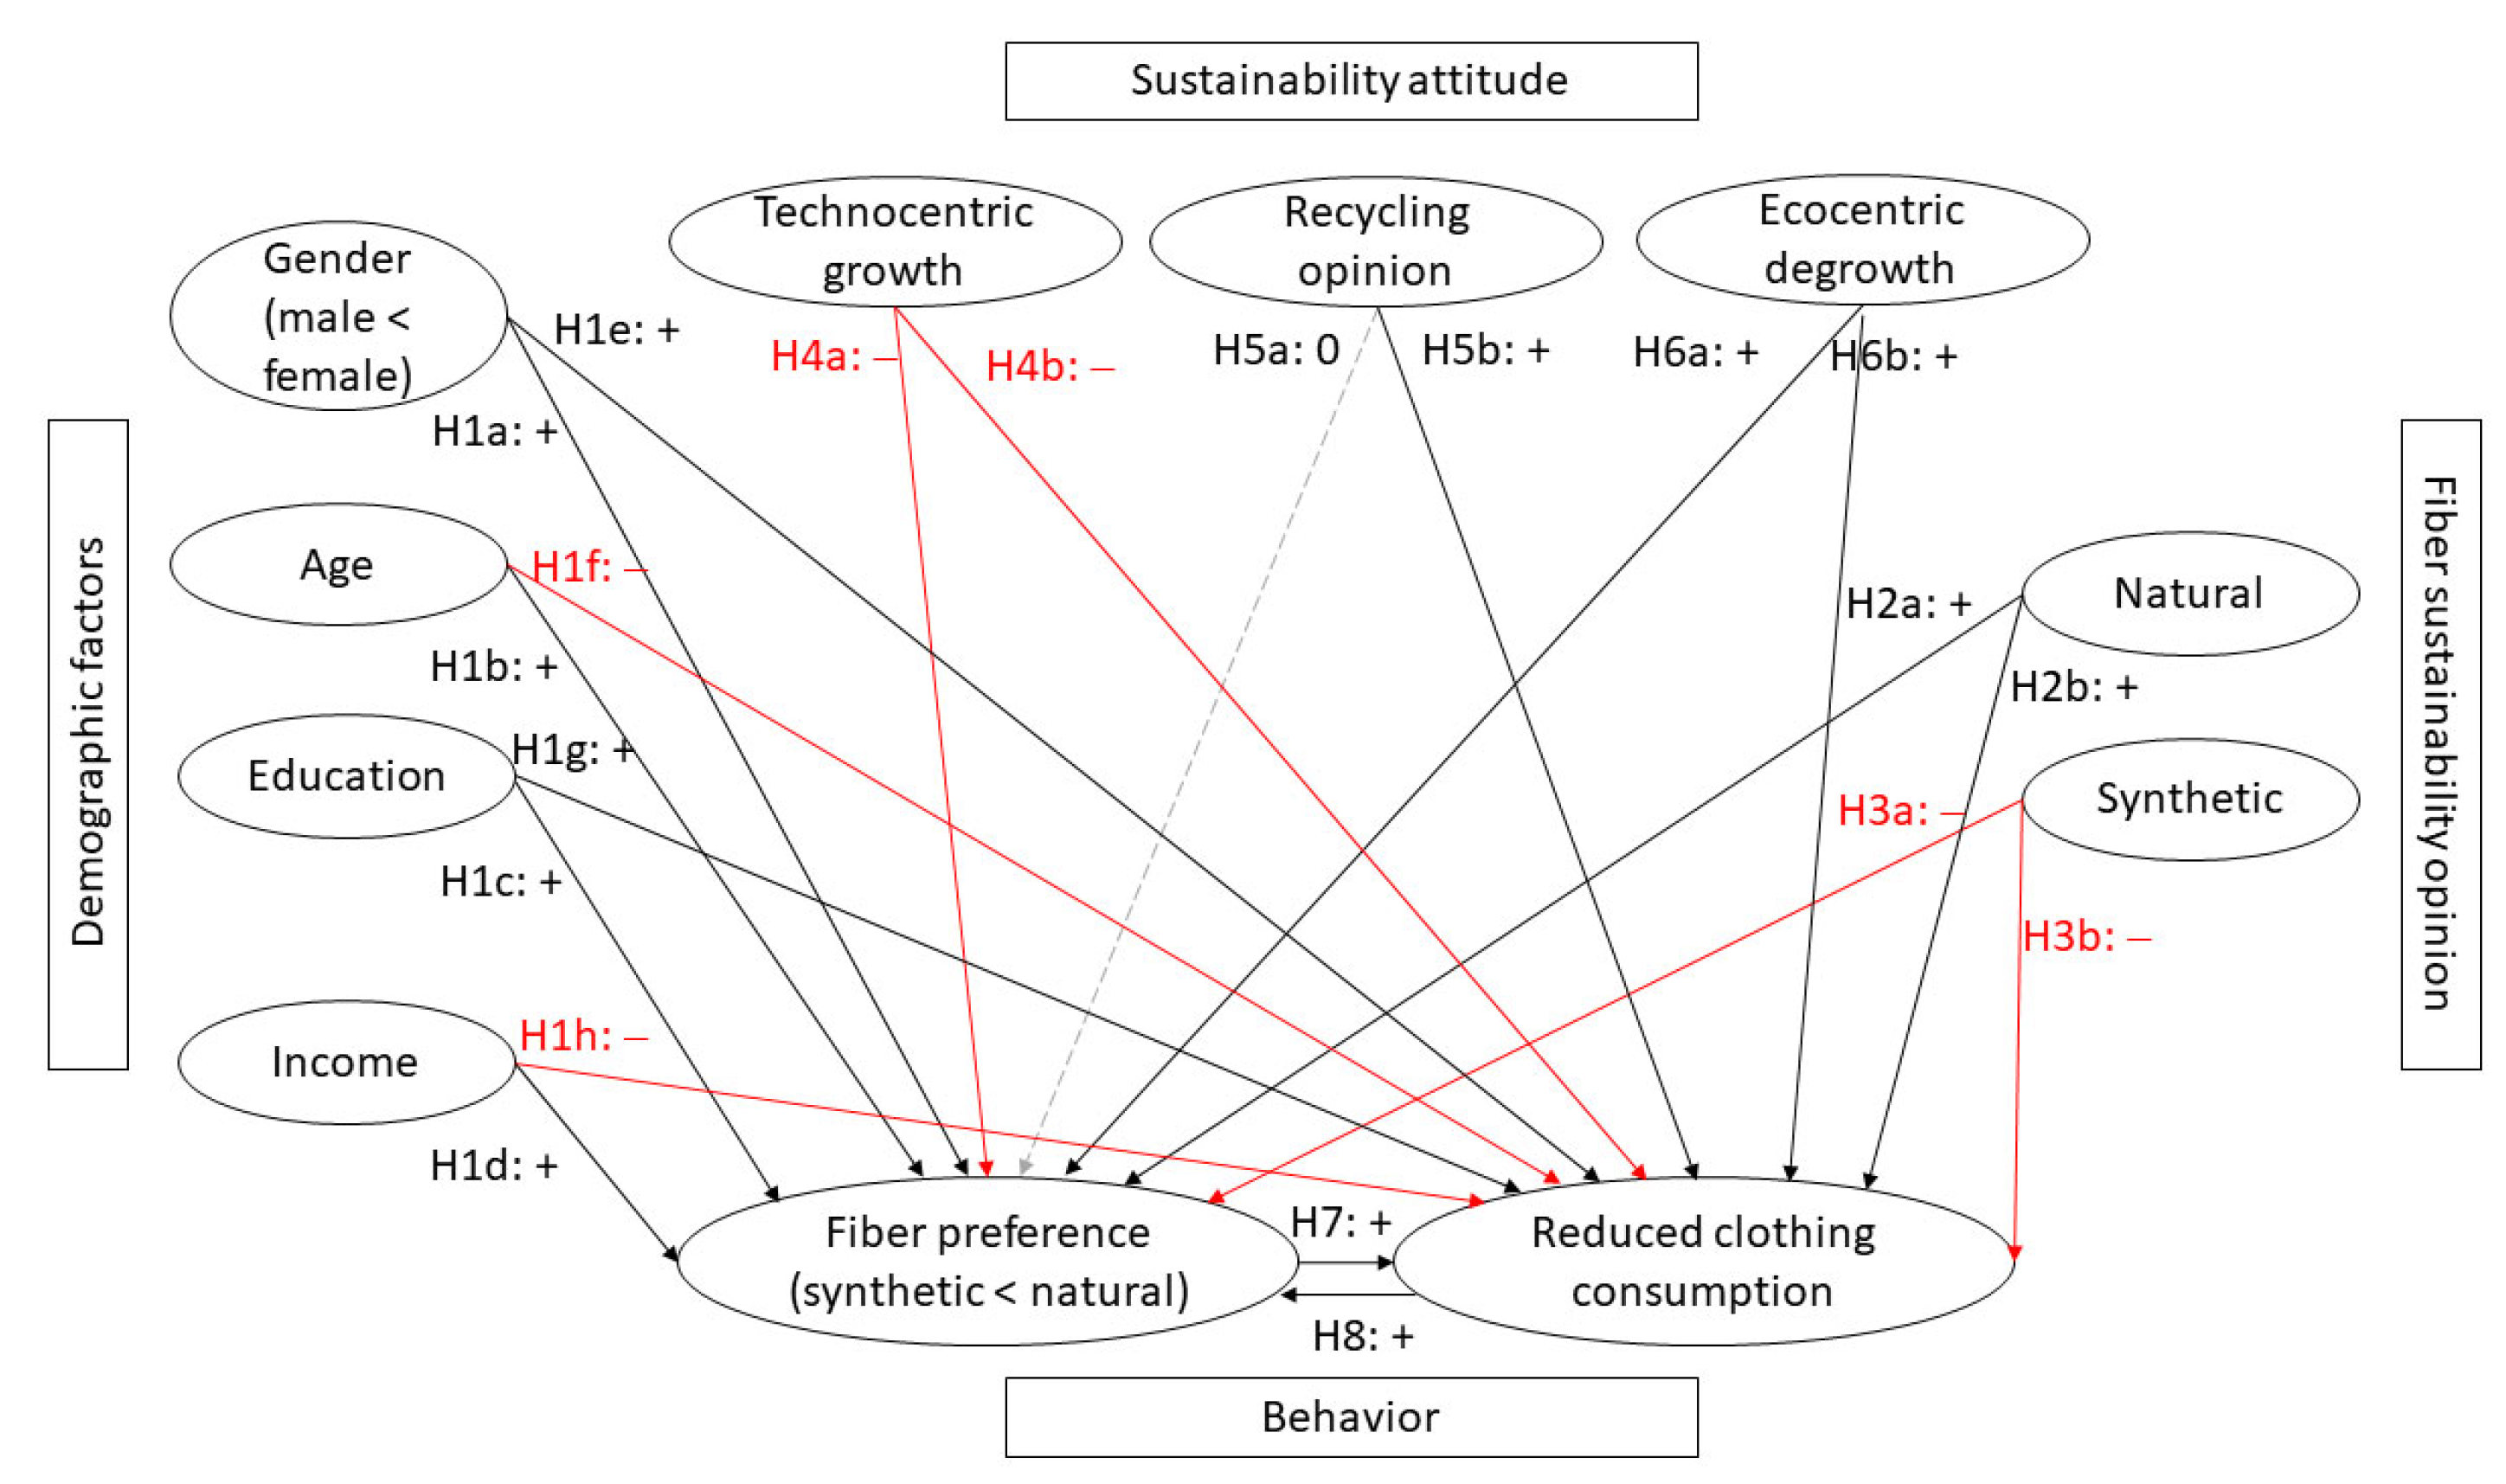
2.4. Hypothesis Model
Based on the hypotheses presented in the previous sections, we built a model to show the assumed connections between the variables (Figure 1).
3. Research Methodology
We now present the research method including the sample collection, questionnaire development, variable reduction with factor analysis, and the correlations between the chosen variables.
3.1. Samples and Procedure
An online survey questionnaire was developed to measure the consumers’ opinions on sustainability in general and in relation to various textile materials, and how this is connected to their preferences regarding material choice. The data were collected in Norway between December 2021 and January 2022. The web-based survey was conducted by Kantar TNS on behalf of SIFO, Oslo Metropolitan University.
The target group was a representative selection of the Norwegian population aged 18–80, and the questionnaire was distributed to a pre-recruited consumer panel willing to participate in various surveys. The panel population was pre-stratified according to age, gender, place of residence, and level of education. The panel was certified according to standard ISO 260252, and the confidentiality, anonymity, and privacy requirements were treated in accordance with the Personal Information Act and the guidelines of the Norwegian Data Protection Authority Sikt [76].
The invitation email was sent to 4818 respondents, of which 1405 recipients opened the link to the survey questionnaire. The final number of valid, complete responses was 1281. The final sample was weighted in correspondence with the distribution of the population based on demographic weight (age, gender, and region). These weighted data were used in the analysis to reflect population-level frequencies. The reported education level was higher than the official statistics in Norway indicate. This is partly due to a higher level of education among the population using the Internet and among younger respondents, but also due to differences in the categories used, and backlogs in the official education register (including education pursued abroad). Some of it is also overreporting by the respondents, who might have started a course of higher education but are yet to complete it. The demographics of the respondents are presented in Table 1.
3.2. Questionnaire Development
The questionnaire was built on the basis of existing literature, including the development of new questions, to inform our research topic. Questions related to environmental opinions have been posed in the SIFO survey in an attempt to follow the development of environmental beliefs since 1993 and consumption reduction since 2014 [77,78,79,80]. The topic of use preference and sustainability opinions related to textile fibers were developed specifically for this study. The questionnaire was pre-tested by a small number of consumers, and minor adjustments were made before conducting the final survey. It included five parts designed to achieve the study objectives: (1) demographics, (2) opinions about sustainability in general, and more specifically about (3) fiber sustainability, in addition to the dependent variables (4) fiber use preferences, and (5) the reduction of clothing consumption. The scales for part 2 used five-point Likert-type statements ranging from strongly disagree (1) to strongly agree (5).
The survey data were analyzed with the IBM SPSS statistics software version 28 [81]. The descriptive statistics are reported for the respondents’ demographic background (Table 1) and fiber preferences, fiber sustainability opinion, and the reduced clothing consumption variable (Section 4.1).
3.3. Factor Analysis
Principal component analysis (PCA) factor extraction with orthogonal varimax rotation was conducted to select items for constructs that best described the respondents’ opinions related to ecocentric degrowth, technocentric growth, fiber use preference, and opinions on fiber sustainability. Single items were used to measure recycling opinion and behavior related to reduced clothing consumption.
The Kaiser–Meyer–Olkin (KMO) measure was used to test for sampling adequacy, where values below 0.5 were deemed unacceptable [82]. Bartlett’s test of sphericity was used to evaluate the significance of the correlations among the variables and, thus, determine the suitability of the data for structure detection [82]. Cronbach’s alpha was used to measure the internal consistency of the scales. The generally accepted lower limit for alpha is 0.7, but 0.6 is acceptable in exploratory research [83]. The more stringent requirements applied to scales with a large number of items [82].
The survey instrument included seven items of relevance to measuring ecocentric degrowth opinions. Items with factor loadings below 0.6 were eliminated in order to improve the consistency of the constructs [82], leaving a total of five items for further analysis (Table 2). The lowest item loading was 0.774; thus, all items showed high correlations with the latent ecocentric degrowth variable. The KMO of 0.843 shows great sampling adequacy, and the significant result (<0.001) of Bartlett’s test of sphericity indicates high reliability.
To measure opinions related to technocentric growth, the instrument included five items, but the PCA indicated that they measure two underlying factors with some cross-loadings. Therefore, the three items that best described the latent variable were kept for the final scale. The lowest factor loading was 0.670, indicating the consistency of the constructs. The KMO for the scale was 0.580, which is not optimal but still shows adequate sampling. The significant result (<0.001) of Bartlett’s test of sphericity indicates high reliability, and Cronbach’s alpha was at the limit of suitability at 0.60 [82].
Only one item was used to measure opinions related to the importance of recycling. The questionnaire did not include other similar questions, and the PCA confirmed that this item did not have sufficient factor loadings with any other sustainability opinion statements in the questionnaire, as all were well below the level of 0.6.
The survey included questions about the use preferences of 11 fibers (polyester, recycled polyester, acrylic, cotton, organic cotton, viscose, bamboo viscose, wool, alpaca wool, silk, and linen). These fibers were chosen to include common fibers from different categories, both natural and manmade. The manmade fibers included synthetics as well as regenerated cellulose fibers. Both regenerated fibers were based on viscose technology, but it was specified that one of them was made from bamboo pulp. Bamboo-based viscose fibers are often falsely labeled as bamboo only, and many consumers do not know that it is viscose. Therefore, the questionnaire specified this so as not to mislead the respondents by conflating the fiber with genuine bamboo bast fiber. For additional sustainability dimensions, examples of recycled (polyester) and organic fibers (cotton) were included. The individual results are given in Table 4 in the descriptive results section. The respondents could select whether they preferred the fiber, had no opinion, or avoided it for some specific reasons such as comfort or sustainability. A fiber preference scale from avoidance to preference was built for the analysis. In this scale, fiber preference was retained as it was given in the questionnaire, while for avoidance, any selection of one of the avoidance reasons was coded as avoidance of fiber, independent of how many different reasons for avoidance were selected. “No opinion,” “don’t know,” and missing responses were combined into the same no-opinion category. The scale ranged from 0 to 2, with values below 1 indicating avoidance, 1 no opinion and values above 1 indicating a preference for the specific fiber.
In the next step, the fiber preference scales were analyzed with PCA, and the results indicated that there were three underlying factors related to the preference for these fibers, with viscose recording cross-loadings with two of the categories. When viscose was omitted, only two factors appeared; one for the synthetic and the second for natural fibers, which also included bamboo viscose. However, the factor loading for bamboo viscose was below the threshold of 0.6 and was therefore excluded from the scale of natural fibers. The final scale for natural fibers included cotton, organic cotton, wool, alpaca wool, silk, and linen, and had good sampling adequacy (KMO 0.755, significant < 0.001). The preference scales for the synthetic fibers included polyester, recycled polyester, and acrylic and showed mediocre sampling adequacy (KMO 0.678, significant < 0.001).
The PCA on opinions relating to how sustainable the different fibers were revealed two underlying factors, where viscose had cross-loadings with both. The viscose factor loadings with both latent variables were below the level of 0.6, therefore, it was left out of the analysis. The two remaining latent variables were divided between natural and synthetic fibers. The construct for natural fiber sustainability had great sampling adequacy (KMO 0.849, significant < 0.001). The construct scale for synthetics showed good sampling adequacy (KMO 0.716), with the significant result (<0.001) of Bartlett’s test of sphericity indicating high reliability.
The Cronbach’s alpha coefficients of all constructs were above 0.7 (aside from the abovementioned techno-optimism scale), suggesting acceptable internal consistency [83]. Regarding the composite reliability (CR), the coefficients for all constructs were well above 0.6, indicating good internal consistency [84]. All constructs but one had an average variance extracted (AVE) above 0.5, suggesting convergent validity, and at least 50% of the variance in all the constructs was due to the underlying trait. The AVE for natural fiber preference was slightly below this limit, but according to Fornell and Larcker [85], the convergent validity of the construct can still be considered adequate since the CR is higher than 0.6.
The constructs were calculated by using mean values of the remaining scale items.
For further regression analysis, all the constructs and variables were recoded to start from 0. In addition, the scales for fiber sustainability were reversed so that they would start from a large environmental impact (0) to no environmental impact (4). Missing answers on the demographic variables were excluded pairwise in the regressions.
Further, with built a fiber preference scale between synthetics and natural fibers. In this process, the scale construct for preference for synthetic fibers was given negative values, and the scale construct for preference for natural fibers was kept positive. These scale constructs were combined, so values varied from −2 to 2. The scale was recoded to start from 0 for further analysis, thus having values from 0 to 4 (from 0 = synthetic preference, 2 = no opinion, 4 = natural preference).
3.4. Correlations
Table 3 shows the Pearson correlations between the variables. Several of the variables had significant correlations, suggesting that they were related and suitable for further analysis. All correlation coefficients were well below the limit of 0.8, indicating that there was no problem with multicollinearity.
4. Results
4.1. Descriptive Statistics
The respondents showed a high preference for natural fibers (Table 4), especially wool, which was preferred by 72% of them, followed by cotton (63%), alpaca (38%), organic cotton (34%), linen (30%), silk (23%), bamboo viscose (22%), viscose (10%), and, finally, synthetics at the bottom of the scale, with polyester being preferred by only two percent, followed by recycled polyester (2%) and acrylic (1%). All the natural fibers were more popular than the manmade ones, and out of the manmade fibers, the synthetics were least popular, even the recycled polyester.
Almost half of the respondents said that they avoided polyester (47%) and acrylic (46%), and 35% avoided even recycled polyester. Every fifth respondent tried to avoid regular viscose (21%), while only nine percent avoided viscose made from bamboo. Seventeen percent steered clear of silk and twelve percent from linen, while all other natural fibers were avoided by less than eight percent. The most common reason for avoiding fibers was comfort as especially the synthetics were perceived as uncomfortable to wear or touch. The second most common reason for avoidance were environmental and climate considerations. This was most common for polyester (16%), followed by acrylic (13%) and, surprisingly, recycled polyester (11%). All other fibers were avoided by less than five percent of the respondents for sustainability reasons. Personal health issues were a less common reason for avoidance and were mainly reported for polyester and acrylics by five percent of the respondents. Only a very small portion of respondents (1–2%) avoided any specific fiber types due to animal welfare issues.
Overall, the results also indicate that many consumers did not have specific opinions on use preferences.
The respondents were asked to place fibers on a scale based on their climate and environmental impacts: from 1 ”no impact” to 5 ”very high impact”. On average, wool was seen as the most sustainable fiber (score 2.1), followed by alpaca wool (2.2), linen (2.3), bamboo viscose (2.4), silk (2.5), organic cotton (2.6), and cotton (2.8). All synthetic fibers were considered to be less sustainable than natural fibers, but recycled polyester was assumed to be about as sustainable as viscose (both scored 3.2). Polyester and acrylic received the highest score toward higher impact (both 3.7). However, many respondents struggled to answer. Especially viscose was seen as difficult to place and almost half of the respondents (43%) did not want to guess the extent of its environmental impact. Some of them also struggled to answer since climate and the other environmental impacts were placed within the same questions, with potentially varying impacts (i.e., some fibers with a high climate impact can have lower toxicity impacts and vice versa).
The respondents were also asked to evaluate the degree to which they had reduced their clothing consumption for environmental reasons on a scale from 1 (very small degree) to 7 (to a very large extent). The average response was 3.5, which can be considered a moderate reduction. Furthermore, 22.3% of the respondents answered that they had reduced only to a very small degree (grade 1), which arguably means that they had not reduced their clothing consumption, at least not for environmental reasons. On the opposite side, 6.3% said that they had reduced their clothing consumption to a very large extent. Four percent did not answer this question.
4.2. Hypothesis Testing with Two Multiple Linear Regressions
Two linear regression models were built, the first one for measuring consumers’ fiber preferences between synthetic and natural fibers (Table 5) and the second for measuring behavior related to reducing clothing consumption (Table 6).
A significant regression equation was found for fiber preferences (F(10, 935) = 32.964, p < 0.001). The model had an adjusted R2 of 0.253, indicating that it explained 25.3% of the variation in fiber preference between synthetic and natural fibers. The level of collinearity was very low (highest VIF 1.5), with the largest Cook’s distance being of 0.028, and there were no cases with a standard residual above 3.
The contribution of each variable is presented in Table 5. The dependent variable is a fiber preference scale starting from 0 for consumers whose only preference was synthetic materials and ending in 4 for consumers whose only preference was natural fibers. Levels around 2 indicated responses with no strong opinion.
The results show that most of the variation was explained by gender, followed by age, sustainability opinion of natural fibers, sustainability opinion of synthetic fibers, ecocentric degrowth opinions, and reduced clothing consumption. Specifically, women, older respondents, respondents with higher education and income levels, high scores on ecocentric degrowth opinions, those who thought that natural fibers were more sustainable, and those who had reduced their clothing consumption had significant positive coefficients for preference for natural fibers. Respondents receiving high scores on technocentric opinion and those thinking that synthetic fibers were more sustainable had significant negative coefficients toward preferring natural fibers. Opinions on the importance of recycling were not a significant predictor for fiber preference.
The second model was built to study variables contributing to reduced clothing consumption (Table 6). A significant regression equation was found (F(10, 935) = 40.937, p < 0.001), with an adjusted R2 of 0.297, indicating that the model explained 29.7% of the variation in behavior related to reduced clothing consumption. The level of collinearity was very low (highest VIF 1.4), with the largest Cook’s distance of 0.016, and no cases recorded standard residual above 3.
The contribution of each variable is presented in Table 6. The results show that most of the variation in the reduction of clothing consumption was explained by ecocentric degrowth opinions, which were almost four times more important as a predictor than any other variable in the equation. Other significant positive predictors were fiber preference, which showed that those who preferred more natural fibers were more likely to have reduced their clothing consumption, in addition to women and respondents with higher education qualifications. Significant negative coefficients included personal income, sustainability opinions of natural fibers, and age, indicating that people on lower incomes were more likely to have reduced their clothing consumption, in addition to younger consumers and those who did not think that natural fibers were highly sustainable. Opinions about the importance of recycling, technocentric growth, and the sustainability of synthetic fibers did not have significant contributions to the model.
5. Discussion
The results indicate that several variables had a significant impact on consumers’ fiber preferences between synthetic and natural fibers as well as behavior related to the reduction of clothing consumption. The demographic variables were important, but so were the sustainability opinions, especially those related to ecocentric degrowth, which had the largest effect of all the included variables.
The younger consumers said that they had reduced their clothing consumption due to environmental reasons to a larger degree than the older consumer groups. This is in line with existing findings indicating that larger shares of younger consumers are more interested in sustainability than older generations [86,87]. Furthermore, the older respondents had reduced their clothing consumption to a lesser extent than the younger participant because wardrobe overhauls are less frequent for older consumers for than younger ones; therefore, clothing consumption would have already been reduced as much as possible. At the same time, younger consumers buy more clothes than older ones [46]. Thus, reduced consumption and greater environmental concerns do not necessarily translate into low consumption.
There was a negative correlation between income and reduced clothing consumption, confirming the hypothesis that people on higher incomes are less likely to reduce consumption. Studies have shown a negative correlation between income and perception of risk as potentially translating into lower environmental concerns [88,89]. However, reduced clothing consumption could result from lack of affordability. It is a limitation of this study that the only possible reason stated for reduced clothing consumption was concern for the environment. Some respondents may have reduced clothing consumption due to higher prices or reduced purchasing power but chose to answer that they had reduced consumption due to environmental concerns since there were no other answer options in the questionnaire. In addition, the way in which clothing consumption may have been reduced was based on the respondents’ self-assessment. This means that the interpretation of reduced consumption becomes highly subjective, and dependent on the respondents’ previous level of consumption.
An interesting finding is that sustainability opinions regarding synthetic and natural fibers were negatively correlated with self-reported reduced clothing consumption (though for synthetic fibers this correlation was not significant). Fiber preference was positively correlated with reduced clothing consumption, meaning that those who preferred more natural fibers had reduced their clothing consumption more than those who preferred synthetic fibers. This fits with the ecocentric perspective of degrowth and reduced consumption. However, it seems that believing that fibers of any kind are sustainable negatively affects consumption reduction. An explanation for this could be that if the fibers used to produce clothing are considered sustainable, reducing consumption is not necessary. As consumption is considered sustainable, continuing at the same level of consumption is made possible. This relates to the issues with the Higg Index and the PEF, which will be discussed in the conclusion.
The PCA indicated that the respondents had problems placing viscose fibers, as they were considered to be somewhere between the natural and synthetic spheres. This applied both to the preference regarding use and in estimating the sustainability of the fiber. An earlier study by Laitala and Klepp [90] found that Norwegian consumers expressed that they knew very little about different fibers. Similarly, Heidenstrøm et al. [65] found that Norwegian consumers felt that they had insufficient knowledge of different textile fibers to make informed purchase decisions. This could explain why the respondents found it difficult to place viscose and generally had difficulty placing the fibers in terms of sustainability. As mentioned in the methods section, bamboo was specified as bamboo viscose since consumers in general do not know that bamboo is a type of viscose. This lack of knowledge regarding specific fibers could also explain the much higher preference for cotton than organic cotton. If the respondents were unsure of what organic entailed in terms of cotton, they could be hesitant about expressing a preference for organic cotton. Ritch [62] found that consumers lacked clarity regarding how sustainability in fashion could be interpreted and were generally skeptical about paying higher prices for organic cotton, perhaps since they did not know how it applied to sustainability or whether there were any benefits compared to conventional cotton.
Recycled polyester also received relatively low scores both in terms of perceived sustainability and preference among consumers compared to expectations. One explanation could be that the consumers viewed recycled polyester clothes as being of poor quality. Wagner and Heinzel [10] conducted a literature review on consumer perceptions related to recycled textiles and circular fashion. They found that even though consumer attitudes toward circular products were generally positive, some studies had shown that consumers may perceive circular products, such as products made from recycled materials, as being of lower quality. Magnier et al. [91] found that although their participants generally had positive attitudes and expectations toward products made from recycled ocean plastic, textile products (sweaters and running shoes) made from such plastics were rated as significantly inferior in terms of quality to durable electronics made from the ocean plastics included in the study.
The regression models explained about 25% of the respondents’ fiber preferences and 30% of their behavior in relation to reduced clothing consumption, which is a fairly good result in social sciences. However, the inclusion of other variables could have increased the explanatory power of the models. The respondents’ place of residence was not included but could affect their fiber preferences in terms of whether they live in colder parts of the country or in the city versus the countryside. Where they grew up could also be a factor. In addition, interest in fashion could have been included as a factor as this could mean that other things were regarded as more important by the respondents than fiber choice, and this might impact the consumption levels. Consumers’ knowledge of textile fibers could be affected by advertisements from producers and retailers, and those following trends and fashion news more closely could portray other preferences than less interested consumers. Knowledge on the environment and fibers is also likely to influence preferences, perceptions, and behavior.
6. Conclusions
This paper attempted to develop new insights into consumer behavior regarding clothing and textile consumption by examining consumer perceptions of and preferences for textile fibers. The hypotheses building required a thorough investigation of previous research on fiber preferences based on demographic indicators, resulting in an important contribution. This was coupled with two opposing positions in sustainable fashion, techno- and eco-centrism, which were integrated into a general discussion of fiber sustainability, thereby connecting the micro- and macro levels of environmentally sustainable fashion. This may guide future sustainability proposals within the clothing and textile sector.
The study showed a strong preference for natural fibers among Norwegian consumers, which is the opposite of what is happening in the market, where synthetics are receiving increasingly high levels of attention from producers. A larger share of consumers expressed ecocentric opinions related to degrowth and reduced consumption than opinions related to technocentric growth. However, the current clothing markets based on fast fashion business models are focused on increased growth in volumes based on synthetic materials and attempts to reduce climate impacts from textiles have largely been focused on technical measures such as shifting to sustainable fibers and materials.
Based on the correlation between the perceived sustainability of fiber and reduced clothing consumption, our study suggests that a continued focus on material substitution and other technological measures for reducing climate change will impede the move toward sustainability in the textile sector. Sustainability has more aspects than just the selection between fibers; production varies greatly, and a volume reduction perspective has greater potential to reduce pollution and climate impacts. Therefore, consumers’ willingness to reduce consumption is important and may be weakened if the focus continues to be on fibers and materials instead of reduced production and consumption.
Not only do Norwegian consumers prefer wool, they also believe that wool is the most sustainable choice of fiber, with polyester being the least. The preferences portrayed by Norwegian consumers are almost the opposite of the order of preferred fibers in sustainability comparison tools such as the Higg MSI. Therefore, in the future, it will be beneficial to encourage studies to measure the sustainability aspects of specific fibers in more detail so that comparisons will be more realistic, while also contributing to the knowledge that other stages of the production process are of more importance. Another suggestion is to improve LCA methodology to include more categories such as microplastic emissions, plastic waste, and impacts related to toxicity and biodiversity in the ecosystem in order to give a more realistic picture of the environmental impacts of clothing production [56,92].
In addition, even though Norwegian consumers expressed a preference for natural fibers, it was also evident from the responses that knowledge about fibers and sustainability in textile production and consumption was low. This seemed to be true especially for viscose but could also be an explanation as to why organic cotton and recycled polyester received relatively low scores for perceived sustainability. Many consumers did think that recycling was important, but they still did not prefer recycled polyester garments. Low fiber knowledge could also explain why the consumers reported a preference for natural fibers despite fiber market share data showing that most consumers are buying textiles made from synthetic fibers.
In future studies of consumer preferences, it will be important to consider this knowledge gap among consumers. One way to work around it could be to study consumer preferences and perceptions of specific pieces of clothing and clothing features in general because it may be less challenging for consumers to convey their opinions and experiences on a more concrete topic. Afterwards, these perceptions and preferences could be compared to the fiber content and lifetime of each piece of clothing in order to look for correlations.
In future studies, the measurement instruments for sustainability could be developed to include more variables describing techno-optimism and recycling-related opinions. The applied indices could be further validated, and the robustness of the findings could be studied with different operationalizations. In relation to fiber preferences and sustainability opinions, it would be beneficial to also include other fiber types such as recycled cotton and wool. In addition, changes in clothing consumption other than reduced consumption could be included, such as buying more second-hand clothes or repairing or mending more frequently.
Author Contributions
Conceptualization, A.S.S. and K.L.; methodology, A.S.S. and K.L; formal analysis, K.L.; investigation, A.S.S. and K.L.; writing—original draft preparation, A.S.S. and K.L.; writing—review and editing, A.S.S. and K.L.; supervision, K.L. All authors have read and agreed to the published version of the manuscript.
Funding
This research was funded by Research Council of Norway and Norwegian Retailers’ Environment Fund, grant number 318862 “Wasted Textiles: Reduced synthetic textile waste through the development of resource-efficient value chains” and funding from SIFO for conducting the survey, project number 202365.
Data Availability Statement
Data are contained within the article.
Acknowledgments
We would like to thank the anonymous reviewers as well as Vilde Haugrønning and Andreea Ioana Alecu from SIFO, OsloMet, for commenting on the article draft.
Conflicts of Interest
The authors declare no conflict of interest. The funders had no role in the design of the study; in the collection, analyses, or interpretation of data; in the writing of the manuscript; or in the decision to publish the results.
References
- Niinimäki, K.; Peters, G.; Dahlbo, H.; Perry, P.; Rissanen, T.; Gwilt, A. The environmental price of fast fashion. Nat. Rev. Earth Environ. 2020, 1, 189–200. [Google Scholar] [CrossRef] [Green Version]
- de Bogotá, C.D.C. The State of Fashion 2022; BOF and McKinsey Company: Chicago, USA, 2022. [Google Scholar]
- Changing Markets Foundation. Fossil Fashion: The Hidden Reliance on Fossil Fuels; Changing Markets Foundation: Utrecht, The Netherlands, 2021. [Google Scholar]
- Henry, B.; Laitala, K.; Klepp, I.G. Microfibres from apparel and home textiles: Prospects for including microplastics in environmental sustainability assessment. Sci. Total Environ. 2019, 652, 483–494. [Google Scholar] [CrossRef] [PubMed]
- Quantis. Measuring Fashion. Environmental Impact of the Global Apparel and Footwear Industries Study; Quantis: Lausanne, Switzerland, 2018. [Google Scholar]
- Directorate-General for Environment. EU Strategy for Sustainable and Circular Textiles; European Commission: Brussels, Belgium, 2022. [Google Scholar]
- Fletcher, K. Design for Sustainability in Fashion and Textiles. In Handbook of Fashion Studies; Sandra Black, A.d.l.H., Root Agnès Rocamore, R., Thomas, H., Eds.; Bloomsbury: London, UK; New York, NY, USA, 2014; pp. 562–579. [Google Scholar]
- Textile Exchange. Preferred Fiber & Materials Market Report 2021; Textile Exchange: Lamesa, TX, USA, 2021. [Google Scholar]
- Wagner, M.M.; Heinzel, T. Human perceptions of recycled textiles and circular fashion: A systematic literature review. Sustainability 2020, 12, 10599. [Google Scholar] [CrossRef]
- Özkan, İ.; Gündoğdu, S. Investigation on the microfiber release under controlled washings from the knitted fabrics produced by recycled and virgin polyester yarns. J. Text. Inst. 2021, 112, 264–272. [Google Scholar] [CrossRef]
- Adanacioglu, H.; Olgun, A. Evaluation of the efficiency of organic cotton farmers: A case study from Turkey. Bulg. J. Agric. Sci. 2012, 18, 418–428. [Google Scholar]
- Seufert, V.; Ramankutty, N.; Foley, J.A. Comparing the yields of organic and conventional agriculture. Nature 2012, 485, 229–232. [Google Scholar] [CrossRef]
- de Ponti, T.; Rijk, B.; van Ittersum, M.K. The crop yield gap between organic and conventional agriculture. Agric. Syst. 2012, 108, 1–9. [Google Scholar] [CrossRef]
- Kim, H.; Song, J.E.; Kim, H.R. Comparative study on the physical entrapment of soy and mushroom proteins on the durability of bacterial cellulose bio-leather. Cellulose 2021, 28, 3183–3200. [Google Scholar] [CrossRef]
- Kassatly, V.B.; Baumann-Pauly, D. The Great Greenwashing Machine Part 1: Back to the Roots of Sustainability; Eco Age: London, UK, 2021. [Google Scholar]
- Kassatly, V.B.; Baumann-Pauly, D. The Great Green Washing Machine Part 2: The Use And Misuse of Sustainability Metrics In Fashion; Eco Age: London, UK, 2022. [Google Scholar]
- Sandin, G.; Roos, S.; Johansson, M. Environmental Impact of Textile Fibers—What We Know and What We Don’t Know; Mistra Future Fashion: Gothenburg, Sweden, 2019. [Google Scholar]
- Niinimäki, K.; Hassi, L. Emerging design strategies in sustainable production and consumption of textiles and clothing. J. Clean. Prod. 2011, 19, 1876–1883. [Google Scholar] [CrossRef]
- Mont, O.; Plepys, A. Sustainable consumption progress: Should we be proud or alarmed? J. Clean. Prod. 2008, 16, 531–537. [Google Scholar] [CrossRef]
- Maldini, I.; Balkenende, A. Reducing clothing production volumes by design: A critical review of sustainable fashion strategies. Proceedings of PLATE conference, Delft, The Netherlands, 8–10 November 2017; Conny, A.B., Ruth, M., Eds.; IOS Press BV: Amsterdam, The Netherlands, 2017; pp. 233–237. [Google Scholar]
- Heidenstrøm, N.; Tangeland, T. Indikatorer for Forbruksutviklingen i Norge. [Indicators of consumption trends in Norway - Implications for Sustainability]; SIFO: Oslo, Norway, 2015. [Google Scholar]
- Fletcher, K.; Grose, L. Fashion & Sustainability: Design for Change, 1st ed.; Laurence King: London, UK, 2012. [Google Scholar]
- Forsythe, S.M.; Thomas, J.B. Natural, synthetic, and blended fiber contents: An investigation of consumer preferences and perceptions. Cloth. Text. Res. J. 1989, 7, 60–64. [Google Scholar] [CrossRef]
- Čubrić, I.S.; Čubrić, G.; Perry, P. Assessment of Knitted Fabric Smoothness and Softness Based on Paired Comparison. Fibers Polym. 2019, 20, 656–667. [Google Scholar] [CrossRef]
- Davis, L.L. Consumer use of label information in ratings of clothing quality and clothing fashionability. Cloth. Text. Res. J. 1987, 6, 8–14. [Google Scholar] [CrossRef]
- Johnson, K.; Workman, J.E. Effect of Fiber—Content Information on Perception of Fabric Characteristics. Home Econ. Res. J. 1990, 19, 132–138. [Google Scholar] [CrossRef]
- Hatch, K.L.; Roberts, J.A. Use of intrinsic and extrinsic cues to assess textile product quality. J. Consum. Stud. Home Econ. 1985, 9, 341–357. [Google Scholar] [CrossRef]
- Sneddon, J.; Rollin, B. Mulesing and animal ethics. J. Agric. Environ. Ethics 2010, 23, 371–386. [Google Scholar] [CrossRef]
- Lee, C.; Fisher, A. Welfare consequences of mulesing of sheep. Aust. Vet. J. 2007, 85, 89–93. [Google Scholar] [CrossRef]
- AWI. Flystrike Program Overview and Progress. Available online: https://www.wool.com/sheep/welfare/breech-flystrike/progress/ (accessed on 21 November 2022).
- Kamalha, E.; Zeng, Y.; Mwasiagi, J.I.; Kyatuheire, S. The comfort dimension; a review of perception in clothing. J. Sens. Stud. 2013, 28, 423–444. [Google Scholar] [CrossRef]
- Benisek, L.; Harnett, P.; Palin, M. Influence of fibre and fabric type on thermophysiological comfort. Melliand. Textilber. Eng. 1987, 68, 878. [Google Scholar]
- Behery, H. Effect of Mechanical and Physical Properties on Fabric Hand; Elsevier: Amsterdam, The Netherlands, 2005. [Google Scholar]
- Wilfling, J.; Havenith, G.; Raccuglia, M.; Hodder, S. Consumer expectations and perception of clothing comfort in sports and exercise garments. Res. J. Text. Appar. 2021, 26, 293–309. [Google Scholar] [CrossRef]
- Davison, S.M.; White, M.P.; Pahl, S.; Taylor, T.; Fielding, K.; Roberts, B.R.; Economou, T.; McMeel, O.; Kellett, P.; Fleming, L.E. Public concern about, and desire for research into, the human health effects of marine plastic pollution: Results from a 15-country survey across Europe and Australia. Glob. Environ. Chang. 2021, 69, 102309. [Google Scholar] [CrossRef]
- Deng, L.; Cai, L.; Sun, F.; Li, G.; Che, Y. Public attitudes towards microplastics: Perceptions, behaviors and policy implications. Resour. Conserv. Recycl. 2020, 163, 105096. [Google Scholar] [CrossRef]
- Schutz, H.G.; Phillips, B.A. Consumer Perceptions of Textiles. Home Econ. Res. J. 1976, 5, 2–14. [Google Scholar] [CrossRef]
- Schneider, J. In and Out of Polyester: Desire, Disdain and Global Fibre Competitions. Anthropol. Today 1994, 10, 2–10. [Google Scholar] [CrossRef]
- Peterson, H.H.; Hustvedt, G.M.; Chen, Y.-J. Consumer preferences for sustainable wool products in the United States. Cloth. Text. Res. J. 2012, 30, 35–50. [Google Scholar] [CrossRef]
- Birtwistle, G.; Tsim, C. Consumer purchasing behaviour: An investigation of the UK mature women’s clothing market. J. Consum. Behav. 2005, 4, 453–464. [Google Scholar] [CrossRef]
- Hill, J.; Lee, H.-H. Sustainable brand extensions of fast fashion retailers. J. Fash. Mark. Manag. 2015, 19, 205–222. [Google Scholar] [CrossRef]
- Mason, M.C.; Pauluzzo, R.; Umar, R.M. Recycling habits and environmental responses to fast-fashion consumption: Enhancing the theory of planned behavior to predict Generation Y consumers’ purchase decisions. Waste Manag. 2022, 139, 146–157. [Google Scholar] [CrossRef]
- Roper, L.L. Fiber preferences of the elderly for thermal comfort in cold weather. Educ. Gerontol. Int. Q. 1989, 15, 465–480. [Google Scholar] [CrossRef]
- Saricam, C.; Erdumlu, N. Modeling and Analysis of the Motivations of Fast Fashion Consumers in Relation to Innovativeness. AUTEX Res. J. 2016, 16, 205–213. [Google Scholar] [CrossRef] [Green Version]
- Lang, C.; Armstrong, C.M.; Brannon, L.A. Drivers of clothing disposal in the US: An exploration of the role of personal attributes and behaviours in frequent disposal. Int. J. Consum. Stud. 2013, 37, 706–714. [Google Scholar] [CrossRef]
- Roberts, J.A. Green consumers in the 1990s: Profile and implications for advertising. J. Bus. Res. 1996, 36, 217–231. [Google Scholar] [CrossRef]
- Mainieri, T.; Barnett, E.G.; Valdero, T.R.; Unipan, J.B.; Oskamp, S. Green buying: The influence of environmental concern on consumer behavior. J. Soc. Psychol. 1997, 137, 189–204. [Google Scholar] [CrossRef]
- Laroche, M.; Bergeron, J.; Barbaro-Forleo, G. Targeting consumers who are willing to pay more for environmentally friendly products. J. Consum. Mark. 2001, 18, 503–520. [Google Scholar] [CrossRef] [Green Version]
- Straughan, R.D.; Roberts, J.A. Environmental segmentation alternatives: A look at green consumer behavior in the new millennium. J. Consum. Mark. 1999, 16, 558–575. [Google Scholar] [CrossRef]
- Domina, T.; Koch, K. Textile recycling, convenience, and the older adult. J. Fam. Consum. Sci. 2001, 93, 35. [Google Scholar]
- Laitala, K.; Klepp, I.G. What affects garment lifespans? International clothing practices based on wardrobe survey in China, Germany, Japan, the UK and the USA. Sustainability 2020, 12, 9151. [Google Scholar] [CrossRef]
- United Nations Environment Programme. Sustainability and Circularity in the Textile Value Chain: Global Stocktaking; UNEP: Nairobi, Kenya, 2020. [Google Scholar]
- SAC. The Higg Index. Available online: https://apparelcoalition.org/the-higg-index/ (accessed on 25 February 2022).
- PEF Apparel & Footwear. PEF Apparel & Footwear. Available online: https://pefapparelandfootwear.eu/ (accessed on 21 November 2022).
- Clarke, s.J.; Klepp, I.G.; Laitala, K.; Wiedemann, S.G. Delivering EU Environmental Policy through Fair Comparisons of Natural and Synthetic Fibre Textiles in PEF; Make The Label Count: Brussels, Belgium, 2022; p. 20. [Google Scholar]
- Kentin, E.; Kaarto, H. An EU ban on microplastics in cosmetic products and the right to regulate. Rev. Eur. Community Int. Environ. Law 2018, 27, 254–266. [Google Scholar] [CrossRef] [Green Version]
- Luo, Y.; Song, K.; Ding, X.; Wu, X. Environmental sustainability of textiles and apparel: A review of evaluation methods. Environ. Impact Assess. Rev. 2021, 86, 106497. [Google Scholar] [CrossRef]
- Eunomia. Plastics in the Marine Environment; Eunomia Research & Consulting Ltd.: Bristol, UK, 2016. [Google Scholar]
- Wiedemann, S.G.; Nguyen, Q.V.; Clarke, S.J. Using LCA and Circularity Indicators to Measure the Sustainability of Textiles; Examples of Renewable and Non-Renewable Fibres. Sustainability 2022, 14, 16683. [Google Scholar] [CrossRef]
- Sandin, G.; Roos, S.; Spak, B.; Zamani, B.; Peters, G. Environmental Assessment of Swedish Clothing Consumption—Six Garments, Sustainable Futures; Chalmers University of Technology: Gothenburg, Sweden, 2019. [Google Scholar]
- Pérez, A.; Collado, J.; Liu, M.T. Social and environmental concerns within ethical fashion: General consumer cognitions, attitudes and behaviours. J. Fash. Mark. Manag. 2022, 26, 792–812. [Google Scholar] [CrossRef]
- Ritch, E.L. Consumers interpreting sustainability: Moving beyond food to fashion. Int. J. Retail. Distrib. Manag. 2015, 43, 1162–1181. [Google Scholar] [CrossRef]
- Hiller Connell, K.Y. Exploring consumers’ perceptions of eco-conscious apparel acquisition behaviors. Soc. Responsib. J. 2011, 7, 61–73. [Google Scholar] [CrossRef] [Green Version]
- Payne, A. Fashion Futuring in the Anthropocene: Sustainable Fashion as "Taming" and "Rewilding". Fash. Theory 2019, 23, 5–23. [Google Scholar] [CrossRef]
- Heidenstrøm, N.; Haugsrud, I.; Hebrok, M.; Throne-Holst, H. ”Hvorfor kan ikke bare alle Produkter være Bærekraftige?” Hvordan Forbrukere Oppfatter og Påvirkes av Markedsføring Med Bærekraftpåstander. [«Why Can’t All Products Just Be Sustainable?» How Consumers Perceive and Are Influenced by Marketing with Sustainability Claims]; Consumption Research Norway (SIFO); OsloMet: Oslo, Norway, 2021. [Google Scholar]
- Alexander, S.; Rutherford, J. A critique of techno-optimism: Efficiency without sufficiency is lost. In Routledge Handbook of Global Sustainability Governance, 1st ed.; Kalfagianni, A., Fuchs, D., Hayden, A., Eds.; Routledge: Oxfordshire, UK, 2019; pp. 231–241. [Google Scholar]
- Hickel, J.; Kallis, G. Is Green Growth Possible? New Political Econ. 2020, 25, 469–486. [Google Scholar] [CrossRef]
- Huber, J. Pioneer countries and the global diffusion of environmental innovations: Theses from the viewpoint of ecological modernisation theory. Glob. Environ. Chang. 2008, 18, 360–367. [Google Scholar] [CrossRef]
- Hobson, K. The limits of the loops: Critical environmental politics and the Circular Economy. Environ. Politics 2021, 30, 161–179. [Google Scholar] [CrossRef]
- Mylan, J.; Holmes, H.; Paddock, J. Re-introducing consumption to the ‘circular economy’: A sociotechnical analysis of domestic food provisioning. Sustainability 2016, 8, 794. [Google Scholar] [CrossRef] [Green Version]
- Lehmann, M.; Tärneberg, S.; Tochtermann, T.; Chalmer, C.; Eder-Hansen, J.; Seara, J.F.; Boger, S.; Hase, C.; Berlepsch, V.V.; Deichmann, S. Pulse of the Fashion Industry; Global Fashion Agenda & The Boston Consulting Group: Copenhagen, Denmark; Boston, MA, USA, 2018. [Google Scholar]
- Kerr, J.; Landry, J. Pulse of the Fashion Industry; Global Fashion Agenda & The Boston Consulting Group: Copenhagen, Denmark; Boston, MA, USA, 2017. [Google Scholar]
- Fletcher, K. Post-Growth Fashion and the Craft of Users. In Shaping Sustainable Fashion; Routledge: Oxfordshire, UK, 2012; pp. 165–175. [Google Scholar]
- Fletcher, K.; Tham, M. Earth Logic: Fashion Action Research Plan; JJ Charitable Trust: Maduranthakam, India, 2019. [Google Scholar]
- Biomimicry Institute. The Nature of Fashion: Moving Towards a Regenerative System; Missoula, MT, USA, 2020. [Google Scholar]
- Kantar. Right of Privacy. Available online: https://kantar.no/om/norsk-gallup/right-of-privacy/ (accessed on 21 November 2022).
- Tangeland, T.; Heidenstrøm, N.; Vittersø, G. Endringer i Forbruksutviklingen i Norge—Implikasjoner for Det Grønne Skiftet [Changes in Consumption Trends in Norway—Implications for the Green Shift]; SIFO: Oslo, Norway, 2017; p. 103. [Google Scholar]
- Tangeland, T. Miljøholdninger Blant Norske Forbrukere: Endringer i Perioden 1993–2012 [Environmental Attitudes among Norwegian Consumers: Changes in the Period 1993–2012]; SIFO: Oslo, Norway, 2013. [Google Scholar]
- Tangeland, T.; Heidenstrøm, N.; Throne-Holst, H. Teknologioptimisme—En behagelig hindring for bærekraftig forbruksutvikling? In Forbruk og det Grønne Skiftet; Vittersø, G., Borch, A., Laitala, K., Strandbakken, P., Eds.; Novus: Oslo, Norway, 2016; p. 55. [Google Scholar]
- Vittersø, G.; Hebrok, M.; Heidenstrøm, N.; Klepp, I.G.; Laitala, K.; Tangeland, T.; Throne-Holst, H.; Torjusen, H. Sustainable Corona Life—Changes in Consumption among Norwegian during the COVID-19 Lockdown in 2020; SIFO, OsloMet: Oslo, Norway, 2021. [Google Scholar]
- George, D.; Mallery, P. IBM SPSS Statistics Software; Version 28; IBM: Armonk, NY, USA, 2021. [Google Scholar]
- Hair, J.F.; Black, W.C.; Babin, B.J.; Anderson, R.E. Multivariate Data Analysis, 8th ed.; Cengage Learning EMEA: Andover, MA, USA, 2019. [Google Scholar]
- Robinson, J.P.; Shaver, P.R.; Wrightsman, L.S. Criteria for Scale Selection and Evaluation. In Measures of Personality and Social Psychological Attitudes; Robinson, J.P., Shaver, P.R., Wrightsman, L.S., Eds.; Academic Press: San Diego, CA, USA, 1991; Volume 1, pp. 1–16. [Google Scholar]
- Bagozzi, R.P.; Yi, Y. On the evaluation of structural equation models. J. Acad. Mark. Sci. 1988, 16, 74–94. [Google Scholar] [CrossRef]
- Fornell, C.; Larcker, D.F. Evaluating structural equation models with unobservable variables and measurement error. J. Mark. Res. 1981, 18, 39–50. [Google Scholar] [CrossRef]
- Diamantopoulos, A.; Schlegelmilch, B.B.; Sinkovics, R.R.; Bohlen, G.M. Can socio-demographics still play a role in profiling green consumers? A review of the evidence and an empirical investigation. J. Bus. Res. 2003, 56, 465–480. [Google Scholar] [CrossRef]
- Johnson, E.W.; Schwadel, P. It Is Not a Cohort Thing: Interrogating the Relationship between Age, Cohort, and Support for the Environment. Environ. Behav. 2019, 51, 879–901. [Google Scholar] [CrossRef]
- Akerlof, K.; Maibach, E.W.; Fitzgerald, D.; Cedeno, A.Y.; Neuman, A. Do people “personally experience” global warming, and if so how, and does it matter? Glob. Environ. Chang. 2013, 23, 81–91. [Google Scholar] [CrossRef]
- Kramm, J.; Steinhoff, S.; Werschmöller, S.; Völker, B.; Völker, C. Explaining risk perception of microplastics: Results from a representative survey in Germany. Glob. Environ. Chang. 2022, 73, 102485. [Google Scholar] [CrossRef]
- Laitala, K.; Klepp, I.G. Environmental and ethical perceptions related to clothing labels among Norwegian consumers. Res. J. Text. Appar. 2013, 17, 50–58. [Google Scholar] [CrossRef]
- Magnier, L.; Mugge, R.; Schoormans, J. Turning ocean garbage into products–Consumers’ evaluations of products made of recycled ocean plastic. J. Clean. Prod. 2019, 215, 84–98. [Google Scholar]
- EEB. The EU Product Environmental Footprint (PEF) Methodology—What Can it Deliver and What Not? An NGO Viewpoint; European Environmental Bureau: Brussels, Belgium, 2018. [Google Scholar]
Figure 1.
Hypothesis model. Black full lines indicate positive correlations, red lines negative correlations, and stapled line indicates the null hypothesis (no significant correlation).
Figure 1.
Hypothesis model. Black full lines indicate positive correlations, red lines negative correlations, and stapled line indicates the null hypothesis (no significant correlation).

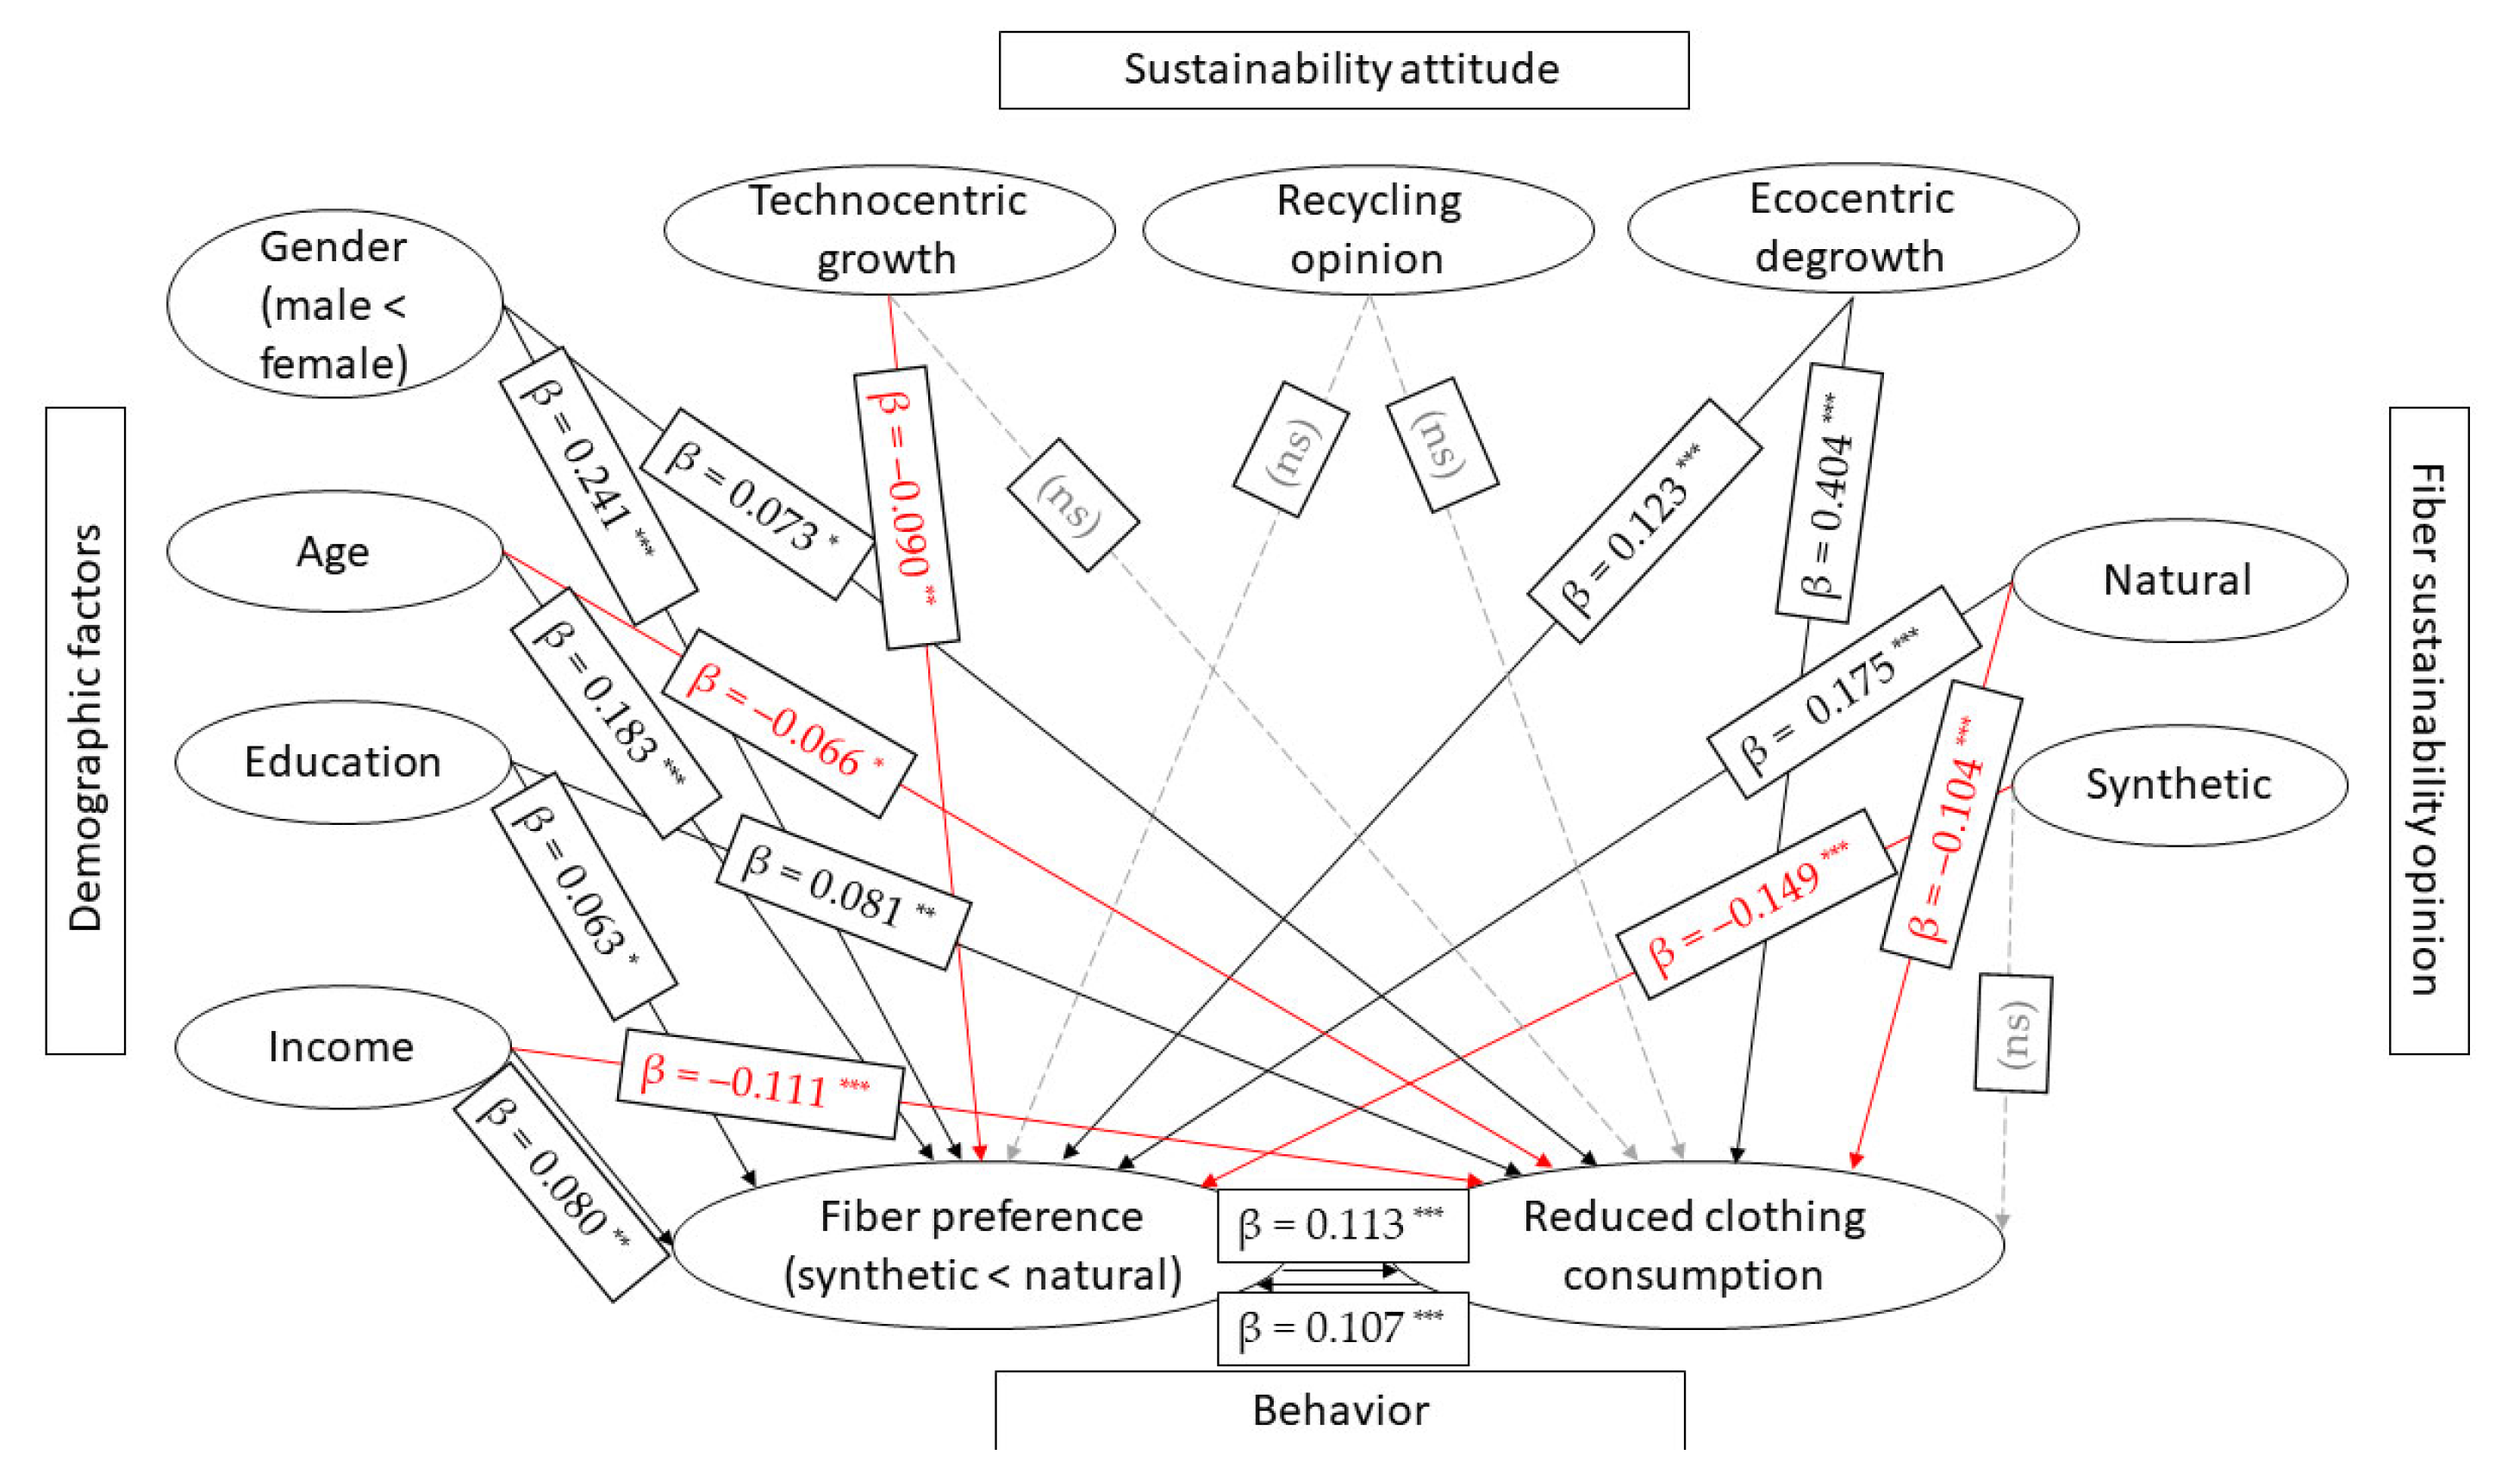
Figure 2.
Results of regression models with standardized beta coefficients and significance (* p < 0.05; ** p < 0.01; *** p < 0.001, ns = not significant p ≥ 0.05).
Figure 2.
Results of regression models with standardized beta coefficients and significance (* p < 0.05; ** p < 0.01; *** p < 0.001, ns = not significant p ≥ 0.05).


Table 1.
The demographic characteristics of the respondents (weighted data, N = 1281).
| Demographic Variable | Sample Size | Percentage | |
|---|---|---|---|
| Gender | Male | 646 | 50.4 |
| Female | 635 | 49.6 | |
| Age-group | 18–29 | 265 | 20.7 |
| 30–44 | 333 | 26.0 | |
| 45–59 | 329 | 25.7 | |
| 60+ | 354 | 27.6 | |
| Education | Primary education | 67 | 5.3 |
| Secondary general education | 247 | 19.3 | |
| Secondary vocational education | 250 | 19.5 | |
| Vocational education that builds on secondary education | 142 | 11.1 | |
| University/college education (up to 4 years) | 315 | 24.6 | |
| University/college education (more than 4 years) | 260 | 20.3 | |
| Region | Oslo and the surrounding area | 310 | 24.2 |
| Rest of Eastern Norway | 340 | 26.5 | |
| South/West Norway | 400 | 31.2 | |
| Trøndelag/Northern Norway | 231 | 18.0 | |
| Personal income | Below 300,000 NOK | 273 | 21.3 |
| 300,000–499,999 NOK | 358 | 28.0 | |
| 500,000–699,999 NOK | 316 | 24.7 | |
| 700,000–999,999 NOK | 129 | 10.1 | |
| 1,000,000 NOK or more | 56 | 4.3 | |
| No answer | 148 | 11.6 | |
Table 2.
Principal component factor analysis and items for analysis (FL = factor loadings, mean = mean value of the items and constructs, SD = standard deviation, α = Cronbach’s alpha, CR = composite reliability, AVE = average variance extracted).
Table 2.
Principal component factor analysis and items for analysis (FL = factor loadings, mean = mean value of the items and constructs, SD = standard deviation, α = Cronbach’s alpha, CR = composite reliability, AVE = average variance extracted).
| Constructs | Items | FL | α | Mean | SD | CR | AVE |
|---|---|---|---|---|---|---|---|
| Ecocentric Degrowth 1 | 0.86 | 3.36 | 0.902 | 0.899 | 0.639 | ||
| In order to achieve more environmentally friendly behavior, we must ban environmentally harmful goods and services. | 0.785 | 3.69 | 1.034 | ||||
| I am willing to give up goods and services I now use, if I can thereby contribute to protecting our natural resources | 0.813 | 3.64 | 1.017 | ||||
| Use of private cars must be reduced in order to decrease greenhouse gas emissions in Norway | 0.774 | 3.01 | 1.276 | ||||
| I am willing to pay more for environmentally friendly/sustainable products | 0.812 | 3.15 | 1.168 | ||||
| It should cost more to produce goods that contribute to environmental pollution and climate emissions, even if it causes these products to be more expensive | 0.814 | 3.50 | 1.126 | ||||
| Technocentric growth 1 | 0.60 | 3.00 | 0.790 | 0.787 | 0.554 | ||
| New technology will solve our environmental problems without leading to major changes in our way of life | 0.831 | 2.71 | 1.072 | ||||
| Increased consumption is important to ensure economic growth and employment | 0.670 | 2.86 | 1.041 | ||||
| Climate and environmental problems can be solved with the help of new technology | 0.723 | 3.55 | 0.910 | ||||
| Recycling is an important environmental measure 1 | 4.29 | 0.753 | |||||
| Reduced clothing consumption for environmental reasons 2 | 3.54 | 1.867 | |||||
| Natural fiber preference 3 | 0.76 | 1.34 | 0.413 | 0.832 | 0.453 | ||
| Cotton | 0.696 | 1.57 | 0.611 | ||||
| Organic cotton | 0.678 | 1.27 | 0.578 | ||||
| Wool | 0.703 | 1.64 | 0.625 | ||||
| Alpaca wool | 0.736 | 1.30 | 0.615 | ||||
| Silk | 0.608 | 1.05 | 0.631 | ||||
| Linen | 0.609 | 1.18 | 0.624 | ||||
| Synthetic fiber preference 3 | 0.80 | 0.59 | 0.445 | 0.884 | 0.718 | ||
| Polyester | 0.891 | 0.55 | 0.541 | ||||
| Recycled polyester | 0.859 | 0.67 | 0.514 | ||||
| Acrylic | 0.789 | 0.56 | 0.520 | ||||
| Combined fiber preference scale 4 | 2.74 | 0.651 | |||||
| Natural fiber sustainability 5 | 0.91 | 2.44 | 0.793 | 0.927 | 0.645 | ||
| Cotton sustainability | 0.787 | 2.80 | 1.081 | ||||
| Organic cotton sustainability | 0.765 | 2.57 | 1.057 | ||||
| Bamboo viscose sustainability | 0.681 | 2.44 | 0.899 | ||||
| Wool sustainability | 0.855 | 2.10 | 0.885 | ||||
| Alpaca wool sustainability | 0.876 | 2.18 | 0.915 | ||||
| Silk sustainability | 0.825 | 2.51 | 1.005 | ||||
| Linen sustainability | 0.819 | 2.33 | 0.918 | ||||
| Synthetic fiber sustainability 5 | 0.83 | 3.51 | 0.760 | 0.899 | 0.749 | ||
| Polyester sustainability | 0.885 | 3.72 | 0.873 | ||||
| Recycled polyester sustainability | 0.840 | 3.18 | 0.871 | ||||
| Acrylic sustainability | 0.871 | 3.68 | 0.837 | ||||
1 Scale from strongly disagree (1) to strongly agree (5). 2 Scale from 1 (very small degree) to 7 (to a very large extent). 3 Fiber preference scale from 0 to 2, where values below 1 indicate avoidance, 1 is for no opinion and values above 1 indicate a preference of the specific fiber. 4 Combined fiber preference scale 0 = synthetic, 2 = no opinion, 4 = natural. 5 Fiber sustainability scale: 1 = no environmental impact, 5 = very large impact.
Table 3.
Pearson correlations with a 2-tailed significance at the lower diagonal. Correlation significance indicated: * p < 0.05; ** p < 0.01; *** p < 0.001, ns = not significant, p ≥ 0.05.
Table 3.
Pearson correlations with a 2-tailed significance at the lower diagonal. Correlation significance indicated: * p < 0.05; ** p < 0.01; *** p < 0.001, ns = not significant, p ≥ 0.05.
| Fiber Pref | Gender | Age | Educ | Income | Technocentric | Ecocentric | Recyc | Sust Synth | Sust Natur | Reduc | |
|---|---|---|---|---|---|---|---|---|---|---|---|
| Fiber preference scale | 1 | ||||||||||
| Gender | 0.259 *** | 1 | |||||||||
| Age | 0.245 *** | −0.143 *** | 1 | ||||||||
| Education | 0.178 *** | −0.045 (ns) | 0.246 *** | 1 | |||||||
| Personal income | 0.069 * | −0.297 *** | 0.277 *** | 0.407 *** | 1 | ||||||
| Techno-centric | −0.207 *** | −0.180 *** | −0.047 (ns) | −0.020 (ns) | 0.105 *** | 1 | |||||
| Ecocentric | 0.250 *** | 0.171 *** | −0.037 (ns) | 0.148 *** | −0.037 (ns) | −0.260 *** | 1 | ||||
| Recycling | 0.143 *** | 0.119 *** | 0.083 ** | 0.050 (ns) | 0.040 (ns) | −0.082 ** | 0.244 *** | 1 | |||
| Sustainability opinion of synthetic fibers | −0.257 *** | −0.150 *** | −0.105 *** | −0.101 *** | 0.011 (ns) | 0.214 *** | −0.298 *** | −0.162 *** | 1 | ||
| Sustainability opinion of natural fibers | 0.140 *** | −0.078 ** | 0.315 *** | 0.012 (ns) | 0.085 ** | 0.054 (ns) | −0.214 *** | 0.070 * | 0.177 *** | 1 | |
| Reduced clothing consumption | 0.213 *** | 0.225 *** | −0.103 *** | 0.098 *** | −0.132 *** | −0.164 *** | 0.501 *** | 0.165 *** | −0.200 *** | −0.209 *** | 1 |
Table 4.
Distribution of fiber preference and avoidance categories.
| Polyester | Recycled Polyester | Acrylic | Cotton | Organic Cotton | Viscose | Bamboo Viscose | Wool | Alpaca Wool | Silk | Linen | |
|---|---|---|---|---|---|---|---|---|---|---|---|
| Prefer to use | 2% | 2% | 1% | 63% | 34% | 10% | 22% | 72% | 38% | 23% | 30% |
| Avoid—Any of the reasons | 47% | 35% | 46% | 6% | 7% | 21% | 9% | 8% | 8% | 17% | 12% |
| 5% | 3% | 5% | 2% | 1% | 2% | 1% | 1% | 2% | 2% | 1% |
| 31% | 22% | 29% | 2% | 1% | 11% | 3% | 4% | 2% | 6% | 5% |
| 2% | 2% | 2% | 1% | 1% | 1% | 1% | 1% | 2% | 2% | 1% |
| 16% | 11% | 13% | 3% | 3% | 5% | 2% | 1% | 2% | 2% | 1% |
| 9% | 7% | 9% | 0% | 1% | 5% | 3% | 1% | 1% | 7% | 5% |
| No opinion | 37% | 39% | 32% | 24 % | 45% | 39% | 44% | 14% | 38% | 44% | 43% |
| Don’t know | 12% | 23% | 20% | 5% | 13% | 29% | 22% | 4% | 14% | 13% | 13% |
Table 5.
Regression model 1 for fiber preference. (SE B = standard error for B. * p < 0.05; ** p < 0.01; *** p < 0.001, ns = not significant, p ≥ 0.05.).
Table 5.
Regression model 1 for fiber preference. (SE B = standard error for B. * p < 0.05; ** p < 0.01; *** p < 0.001, ns = not significant, p ≥ 0.05.).
| Unstandardized Coefficients (B) | SE B | Beta | |
|---|---|---|---|
| (Constant) | 1.935 | 0.136 | *** |
| Gender (0 = male, 1 = female) | 0.314 | 0.040 | 0.241 *** |
| Age group | 0.109 | 0.019 | 0.183 *** |
| Education | 0.026 | 0.013 | 0.063 * |
| Personal income | 0.047 | 0.019 | 0.080 ** |
| Technocentric | −0.074 | 0.025 | −0.090 ** |
| Ecocentric | 0.089 | 0.025 | 0.123 *** |
| Recycling important | 0.000 | 0.026 | 0.000 (ns) |
| Sustainability opinion of synthetic fibers | −0.128 | 0.026 | −0.149 *** |
| Sustainability opinion of natural fibers | 0.144 | 0.026 | 0.175 *** |
| Reduced clothing consumption | 0.039 | 0.012 | 0.113 *** |
| R2 | 0.261 | ||
| Adjusted R2 | 0.253 | ||
| Delta F | 32.964 *** |
Table 6.
Regression model 2 for reduced clothing consumption. (SE B = standard error for B. * p < 0.05; ** p < 0.01; *** p < 0.001, ns = not significant, p ≥ 0.05.).
Table 6.
Regression model 2 for reduced clothing consumption. (SE B = standard error for B. * p < 0.05; ** p < 0.01; *** p < 0.001, ns = not significant, p ≥ 0.05.).
| Unstandardized Coefficients (B) | SE B | Beta | |
|---|---|---|---|
| (Constant) | −0.018 | 0.418 | (ns) |
| Gender (0 = male, 1 = female) | 0.274 | 0.114 | 0.073 * |
| Age group | −0.112 | 0.053 | −0.066 * |
| Education | 0.096 | 0.037 | 0.081 ** |
| Personal income | −0.185 | 0.054 | −0.111 *** |
| Technocentric | −0.001 | 0.069 | −0.001 (ns) |
| Ecocentric | 0.837 | 0.065 | 0.404 *** |
| Recycling important | 0.134 | 0.071 | 0.054 (ns) |
| Sustainability opinion of synthetic fibers | −0.027 | 0.074 | −0.011 (ns) |
| Sustainability opinion of natural fibers | −0.246 | 0.072 | −0.104 *** |
| Fiber preference | 0.306 | 0.090 | 0.107 *** |
| R2 | 0.304 | ||
| Adjusted R2 | 0.297 | ||
| Delta F | 40.937 *** |
Table 7.
Summary of hypothesis testing results.
| No. | Hypothesis | Conclusion |
|---|---|---|
| H1a | Women have a greater preference than men for more natural fibers. | Supported |
| H1b | Elderly respondents prefer more natural fibers. | Supported |
| H1c | Respondents characterized by higher education prefer more natural fibers. | Supported |
| H1d | Respondents on higher incomes prefer more natural fibers. | Supported |
| H1e | Women are more likely to report reduced clothing consumption | Supported |
| H1f | Elderly respondents are less likely to report reduced clothing consumption | Supported |
| H1g | Respondents with higher levels of education are more likely to report reduced clothing consumption | Supported |
| H1h | Respondents on higher incomes are less likely to report reduced clothing consumption | Supported |
| H2a | Respondents who believe that natural fibers are sustainable prefer more natural fibers | Supported |
| H2b | Respondents who believe that natural fibers are sustainable are more likely to report reduced clothing consumption | Not supported |
| H3a | Respondents who believe that synthetic fibers are sustainable are less likely to prefer natural fibers | Supported |
| H3b | Respondents who believe that synthetic fibers are sustainable are less likely to report reduced clothing consumption | Not supported |
| H4a | Respondents who score high on technocentric green growth opinion are more likely to prefer natural fibers less | Supported |
| H4b | Respondents who score high on technocentric green growth opinion are less likely to report reduced clothing consumption | Not supported |
| H5a | Respondents who believe that recycling is important do not have a preference between natural and synthetic fibers | Supported |
| H5b | Respondents who believe that recycling is important are less likely to report reduced clothing consumption | Not supported |
| H6a | Respondents who score high on ecocentric degrowth opinions are more likely to prefer natural fibers | Supported |
| H6b | Respondents who score high on ecocentric degrowth opinions are more likely to report reduced clothing consumption | Supported |
| H7 | Respondents who prefer natural fibers are more likely to report reduced clothing consumption | Supported |
| H8 | Respondents who have reduced their clothing consumption will more likely prefer natural fibers | Supported |
Disclaimer/Publisher’s Note: The statements, opinions and data contained in all publications are solely those of the individual author(s) and contributor(s) and not of MDPI and/or the editor(s). MDPI and/or the editor(s) disclaim responsibility for any injury to people or property resulting from any ideas, methods, instructions or products referred to in the content. |
© 2023 by the authors. Licensee MDPI, Basel, Switzerland. This article is an open access article distributed under the terms and conditions of the Creative Commons Attribution (CC BY) license (https://creativecommons.org/licenses/by/4.0/).
Share and Cite
MDPI and ACS Style
Sigaard, A.S.; Laitala, K. Natural and Sustainable? Consumers’ Textile Fiber Preferences. Fibers 2023, 11, 12. https://doi.org/10.3390/fib11020012
AMA Style
Sigaard AS, Laitala K. Natural and Sustainable? Consumers’ Textile Fiber Preferences. Fibers. 2023; 11(2):12. https://doi.org/10.3390/fib11020012
Chicago/Turabian StyleSigaard, Anna Schytte, and Kirsi Laitala. 2023. "Natural and Sustainable? Consumers’ Textile Fiber Preferences" Fibers 11, no. 2: 12. https://doi.org/10.3390/fib11020012
Note that from the first issue of 2016, this journal uses article numbers instead of page numbers. See further details here.