Article

Bending Behavior Analysis of Box Beams with the Reinforcement of Composite Materials for Wind Turbine Blades

by
Ofelia Maldonado-Santiago
1,
Jose Billerman Robles-Ocampo
2,*,
Eduardo Gálvez
3,
Perla Yazmin Sevilla-Camacho
2,*,
Sergio de la Cruz
2,
Juvenal Rodríguez-Reséndiz
4 and
Edwin Hernández
2
1
Maestría en Energía Renovables, Universidad Politécnica de Chiapas, Carretera Tuxtla Gutiérrez, Portillo Zaragoza Km 21 + 500, Col. Las Brisas, Suchiapa CP. 29150, Chiapas, Mexico
2
Energy and Sustainability Academic Group, Universidad Politécnica de Chiapas, Carretera Tuxtla Gutiérrez, Portillo Zaragoza Km 21 + 500, Col. Las Brisas, Suchiapa CP. 29150, Chiapas, Mexico
3
Ingeniería en Tecnología de Manufactura, Universidad Politécnica de Chiapas, Carretera Tuxtla Gutiérrez, Portillo Zaragoza Km 21 + 500, Col. Las Brisas, Suchiapa CP. 29150, Chiapas, Mexico
4
Facultad de Ingeniería, Universidad Autónoma de Querétaro, Querétaro CP. 76010, Querétaro, Mexico
*
Authors to whom correspondence should be addressed.
Fibers 2023, 11(12), 99; https://doi.org/10.3390/fib11120099
Submission received: 13 October 2023 / Revised: 15 November 2023 / Accepted: 20 November 2023 / Published: 22 November 2023

Abstract

:
Wind turbine blades in excessive wind conditions present extreme deflection problems. For this reason, an analysis of the structural response of composite reinforced box beams is developed. For this purpose, reinforced box beams were fabricated to improve the bending strength in the flapwise direction of the wind turbine blades. The box beams were analyzed with three-dimensional models using the Finite Element Method (FEM) and validated with bending tests at four-points and two-points. The box beam meets the characteristics of lightness and mechanical strength. Experimental four-point bending results showed that reinforced cross-sections decrease displacements by 30.09% and increase their stiffness to 43.41% for a box beam without structural reinforcement. In addition, the two-point bending results showed a difference of 18.98% between the displacements of the beams with structural reinforcements. In the FEM analysis, a maximum error of 11.24% was obtained when correlating the maximum displacement value with the experimental results of the beams.

Graphical Abstract

1. Introduction

As the capacity to generate energy in wind farms increases day by day, and in order to take advantage of the energy provided by the winds, there is a trend of designing wind turbines with rotor sizes larger than 200 m in diameter [1]. In turn, failures occur in different components, ranging from the foundation to the blades. These failures are due to design, materials, working conditions, and life cycles.
The wind turbine blades (WTB) are considered one of the most critical components and are susceptible to operational failures. The WTB works with various loads, such as tension–compression, torsional, cyclic, transient, induced, and self-induced. This diversity of loads makes the mechanical and structural behavior of the blades very complex. These loads cause bending efforts, stress, and strain [2,3]. There are several factors to consider in the blade design; however, most reside in two categories: (1) aerodynamic efficiency and (2) structural resistance. The first defines the blade topology and performance; the second defines the structural resistance parameters that are directly linked to the material properties and the internal design of the WTB structure. A structural analysis is desired to minimize the values of the maximum tension of the WTB and the maximum deflection of the tip, which can become unstable due to the various load sources. Currently, the Finite Element Method (FEM) is used to study the structural analysis of blades. FEM is used to analyze the behavior of various situations via dividing the structure into many small elements. In addition, the design process encompasses conceptual design, detailed component design, and the subsequent testing of complete WTB. As far as the detailed component design is concerned, the aim is to ensure that the blade components withstand the loads that are expected to be experienced [4,5]. Veludirthi et al. use Ansys software to model the buckling of the WTB. The software can predict the critical loads that support the different blades. In this study, the weights of the blades, the geometric shape, the material, and the working conditions or restrictions are considered [6].
Other studies [7,8] prove that the structural collapse of a WTB is the consequence of the combination of various failure modes: (1) spar cap buckling, (2) separation of the first layer, (3) bulge in the center of the cut, (4) detachment of the adhesive at the trailing edge, (5) matrix cracking, (6) the influence of the blade’s weight, (7) manufacturing imperfections effects, and (8) the Brazier effect, mainly local buckling on the suction side of the airfoil (spar cap). Therefore, it is necessary to investigate the structural performance to predict the deformation and, in turn, the deviation of the WTB tip due to extreme deflections [9]. Jensen et al. [10] demonstrated the positive effect of reinforcement on the stringer cap. In this work, real-scale tests of beams with and without reinforcement were carried out. In addition to testing the results, they used three reinforcement configurations on the stringer cover: wires, i-shaped pultruded profiles, and dry fiber mats. Clausen et al. added different structural members, such as box beam reinforcements, preventing box beams from deforming in the transverse direction [11].
On the other hand, the Blazier effect is of great interest when analyzing the cross-sections, due the non-linear behavior of both the effects of the material and the geometric deformations, which manifests in the buckling and wrinkles of the beam faces. This effect can be minimized with internal reinforcement in the cross-sections of the box beams [12].
The WTBs comprise two casings, which were manufactured separately and joined to a structural beam. At present, the structural beam is designed with a box-shaped cross-section and can be made of fiberglass, carbon, or aramid. The box beam is considered a critical and essential structure of the WTB because it is the element that supports the force produced by the wind [13,14,15]. Nevertheless, it is necessary to understand the mechanical behavior of box beams to analyze the failure modes. Some researchers use the Euler–Bernoulli beam theory to calculate the load and deflection characteristics of thin-walled composite blades and beams [16,17,18].
However, the structural designs of the WTB and their manufacture are complex, because the folds (creases) that occur after their manufacture can significantly reduce the overall performance of the structure [19]. In addition, research has been carried out to identify the optimal angle of the laminate to perform the stacking sequence of each sheet to form the laminate of a thin-walled beam; subsequently, the thicknesses and orientations of the laminate are optimized to obtain the maximum bending–twisting torque effect [20]. In addition, the damage detection technique using deformation sensors helps to determine the location of the failures, deformations, and stresses produced in the WTB and the beam [21]. Experimental results are validated using MEF. Chen et al. developed a numerical simulation methodology to predict the failure modes of large composite structures [22].
Some researchers [19,23,24] have proposed different types of non-linear solutions for WTB and composite beams, both numerical and experimental, and have reported a difference of less than 10% when comparing the load determined by strain gauges with the FEM. Lopez et al. developed a system to validate the cantilever blade’s behavior experimentally. For this study, the geometry, the rigidity, the blade deflection, and the different types of loads were considered. These tests show that non-linearities are linked to the large deflections of the WTB [25].
On the contrary, Kam et al. compared his experimental results with the simulation results, finding a difference of more than 10% [6]. Other authors compare their experimental results with FEM [8,9,25,26]. Likewise, the configurations in numerical analysis and the lack of standardized test procedures and experimental techniques imply differences in the results [27]. This difference in the results can be caused by imperfections resulting from the manufacturing technique or the inaccuracies in the measurement system that was used, such as extensometer configuration, load points, and beam configuration [28].
Research on the performance of box beams in bending WTB is limited, and available comparisons with Euler–Bernoulli and Timoshenko’s theories of composite beams with different cross-sectional shapes usually include solid and hollow shapes. The objective of the work is to analyze the behavior of the reinforcements of the box beams to increase the rigidity of the WTBs. The study considers profiles with different cross-section shapes subjected to transverse loads in the flag direction. These profiles are analyzed using three-dimensional models by the FEM. Likewise, to validate the rigidity in the box beams with flexural reinforcements, experimental tests were carried out: (1) flexural tests at four- points and (2) flexural tests at two-points.

2. Materials and Methods

2.1. Materials

In the reinforced box beam, mat-type fiberglass 450 × 52, polyester resin matrix (Resin PP 70 × 60) and catalyzer K-2000, a stacking of three sheets was considered to standardize the thickness of each laminate that makes up the beams and the reinforcements. Figure 1 shows the beam wall configuration, three polyester resin matrix layers, and three mat-type fiberglass layers [29].

2.2. Methods

The methodology proposed in this work arises from an understanding of the different types of multi-scale structural tests of WTBs and the study conducted by Tang and Chen [15]. This generic model methodology assesses the resistance and structural failure experimentally and numerically under bending conditions in four-points and two-points. Figure 2 shows the proposed methodology, and Figure 3 shows the profiles proposed for the development of a flexural analysis by FEM.

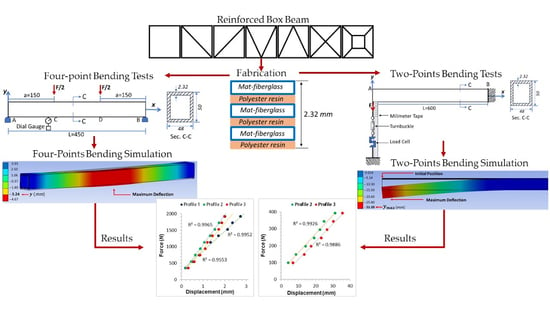
2.3. Beam Manufacturing

In the manufacturing process, the amounts of catalyst, grams of resin, and grams of fiberglass were controlled; fiberglass is the element that provides the higher resistance at the blades. However, despite taking care of the parameters mentioned above, each manufactured profile showed a variation in the density (Figure 4). All tests were performed within certain temperature ranges in order to guarantee the chemical, physical, and mechanical properties of the materials. However, the density of the samples ranged from 0.9250 to 1.0857 g/cm3. One of the inherent reasons for this density variation could be environmental conditions (humidity was not controlled) and the contact manufacturing process (manual manufacturing). However, the parameter that did remain constant was the amount of fiberglass sheets in each profile.
Each profile’s cross-sectional area and moment-of-inertia properties were calculated with a wall thickness of 2.32 mm (Table 1). These properties help to estimate blade stiffness.
Figure 5a shows the composite material at 4× zoom with a Velab stereo microscope model VE-S1 (upper view). Figure 5b shows the micrograph of the composite material used to manufacture the box beams (cross-section view). These micrographs were taken at a 7 kV acceleration voltage in a field emission scanning electron microscope (field emission) Brand JEOL model JSM 7100F. Previously, the sample was prepared by depositing gold particles on the surface, which was deposited at 10 mA for 120 s with a GSEM model G20 (SEM Coater) metal evaporator.

2.4. Experimental Setup and Instrumentation

2.4.1. Four-Point Bending Tests

For the bending tests at four-points, a system was assembled consisting of two parallel supports and two parallel load points positioned symmetrically to the central point between the supports, and a precision measurement indicator of 0.01 mm with a range of measurement from 0 to 10 mm. The bending tests at four points were developed with the test method ASTM D7264 [30], and the load was applied at a uniform speed as established by the Mexican standard NMX-C-191-ONNCCE-2004 [31]. Figure 6 shows the setup to four points, and the displacement is determined by Equation (1).
y A C = F a 6 E I   ( 3 a L 3 a 2 x 2 )
where: F is the cross-section force; a is the distance between the center of the support and the point of load; E is the elastic modulus of the material; I is the inertia moment; L is the total length of the beam, and x is an arbitrary point between the stretch AC.

2.4.2. Two-Points Bending Tests

A system was mounted for the bending tests at two points, as shown in Figure 7. The system consists of a load cell S3-A-200 kg with a sensitivity of 2000 mv/v, a signal amplifier, a tensor attached to the ground to apply the load, and two iron clamps to hold the specimen at one end. The maximum displacement of the simple cantilever beam is determined using Equation (2). The procedure for the application of the load in the bending tests at two points was carried out by adjusting a tensioner, and with the help of the signal amplifier, the data of the increase in the applied load were acquired.
y m á x = F L 3 3 E I
where: F is the transverse force; L is the distance between the support and the point of load; E is the elastic modulus of material; and I is the moment of intertia.

2.5. Finite Element Simulation

Figure 6 and Figure 7 show the dimensions of profiles. The simulations were considered under the four-point bending and two-point bending scheme, respectively. In addition, 3D models were created based on the primary box beam model by adding reinforcements to the cross-section of the same thickness of the shear center and the stringer cap that make up the box beam. The beams were subjected to a static structural analysis using the Mechanical APDL solver for the processing stage. These beams were analyzed considering small deformations with homogeneous and isotropic material [32] and, subsequently, the relationships between the “Bonded” and “No separation” types. The methodology used to discretize the beams was the creation of a global mesh to include supports and loading tips and two local meshes for lateral and transversal faces with different dimensions, thereby avoiding convergence problems in the results. In addition, a counter was added to increase the load by 10 steps for both bending cases. Finally, the quality criteria Skewness and Orthogonal Quality were considered because they were the elements in three dimensions that matched an acceptable range of mesh quality.

3. Results

3.1. Design of Experiments

Numerical simulations were created of the seven profiles of Figure 3 using FEM, and profiles B and C were discarded by statistical analysis because they presented similar displacements to box profile A. Also, profile D was discarded because the reinforcement configuration implies higher displacements to profile E. Profile G was discarded because a box-shaped reinforcement was attached in its center and presented a (1) higher mass and (2) a complex manufacturing process compared to all profiles. Consequently, profiles E and F were chosen because they retain the property of lightness and present fewer displacements compared to profile A. Finally, three test pieces of each selected profile were manufactured. The profiles are as follows: in first place, profile A as the reference element; in second place, profile E; in third place, profile F. In the following sections, profiles A, E, and F are called Profile 1, Profile 2, and Profile 3, respectively.

3.2. Four-Point Bending Tests

A total of nine test pieces were studied for the evaluation of the experiments. The bending tests at four-points were performed with a maximum load of 2114.91 N in the flag direction according to the classical beam theory.
Figure 8 shows the force results and the average displacement of profiles 1, 2, and 3. The structural response naturally demonstrates a difference in the displacements of the tested beams. In other words, V-shaped and X-shaped reinforcements like those in profile 2 and profile 3 to a box beam (profile 1) were incorporated, resulting in a percentage decrease in displacements of approximately 30.09% and 19.41%, respectively. The profiles are compared in terms of maximum load capacity. The results show that the total failure of profile 1 occurred when the applied load reached the value of 3000 N. Thus, the proposed reinforcements increase the maximum load capacity of the beams, since the fracture of profiles 2 and 3 occurs under loads higher than 5000 N and 4000 N, respectively. Generally, the highest displacement is observed for the simple box beam (profile 1) at 3.09 mm, profile 3 at 2.49 mm, and profile 2 at 2.16 mm.
As the load increased on the profiles, the deformation of the profiles caused acoustic waves. These acoustic waves indicate an eminent fracture of the element to tension. Thus, fractures of profiles 1, 2, and 3 occurred in the joint. The failures in profile 1 are displayed in Figure 9. As the upper laminate failed (compression), the lateral laminates continued to compress, creating a fracture in the joining fibers. The total failure of profile 1 is the result of the complete separation of the beam components. In profiles 2 and 3, the failures were similar.
Nevertheless, a deformation distribution was formed in the contact zone with the loading tip, causing matrix cracking, as seen in Figure 10a. However, joint failure and fracture of each profile are an inherent possibility during the manufacturing process. An extensometer was placed on one side of a load point to measure displacements. The displacements recorded by the extensometer were 3.09 mm, 2.16 mm, and 2.49 mm of profiles 1, 2, and 3, respectively.

3.3. Bending Tests at Two-Points

Figure 11 shows the results of the force–displacement relationship with the linear behavior of profiles 2 and 3. The maximum displacement of profiles 2 and 3 before the workload of 392.26 N is 30.83 mm and 36.68 mm, respectively. In addition, if the result of profile 3 is compared to profile 2 with a load of 392.26 N, there is an increase in displacement of 18.98% by profile 3. The fractures of profiles 2 and 3 were similar, as shown in Figure 11. When a fault occurs at the junction that is located between the contact face and the side face, a deformation distribution is formed, with some fiber breaks located around the contact area. These broken fibers cause the cracking of the matrix. However, total failure due to fracture was recorded under loads of 617.82 N and 441.30 N in profiles 2 and 3, respectively.

3.4. Four-Point Bending Simulation

The elastic modulus used to simulate profiles 1, 2, and 3 is 4.58 GPa, calculated by Equation (1). Figure 12 shows that, at the ends of profile 1, there are positive displacements of 3.93 mm. In addition, there are displacements around the supports from 1.06 mm to −1.80 mm because the displacement is zero at the support points. Naturally, the most significant deflections are found just below the peak loads; for this reason, the maximum deflection (shaded red) is found at the midpoint of the beam, and its approximate value y m á x is −4.67 mm. Therefore, the value of −4.67 mm for profile 1 is taken as a reference to compare the results of the simulations of profiles 2 and 3.
On the other hand, the maximum negative displacement of profile 2 “ y m á x ” is 2.40 mm, and deforms less than 48.61% compared to the displacement of profile 1. Likewise, the displacement to one side of the load points is −1.96 mm and is approximated with the displacement registered in the bending tests at four points. Finally, the simulation results of profile 3 indicated a maximum negative displacement of −2.31 mm, just below the load points. However, profile 3 deforms less than 50.54% to profile 1.

3.5. Two-Point Bending Simulation

An elastic modulus of 3.66 GPa, calculated by Equation (2), was used in the bending simulations. In lateral view, profile 2 presents a displacement of 31 mm with a load of 392.27 N, as shown in Figure 13a. Profile 3 presents a displacement of 37.70 mm with a load of 392.27 N, as shown in Figure 13b. Finally, when comparing the numerical simulation results of profiles 2 and 3, profile 3 presents higher displacements at its free end, of 21.61%, compared to profile 2.

4. Discussion

The boundary conditions derive from the problem of extreme deflections in blades under loads in the flag direction. In addition, in the bending studies, the solution for shear deformations was not considered necessary because it is a thin laminate. Therefore, the analysis is mostly influenced by deflection calculations in its static response.
In both bending tests (four/two-point bending tests), the laminates that make up the beams failed in a brittle manner, resulting in fiber breaks leading to the matrix’s fracture; then, the laminates’ separation began. The results are similar to the work reported by Martin et al. [33,34].
In the four-point bending tests, the laminates on the upper face of profile 1 deform in a fragile manner due to the penetration of the loading tips. Then, the faces and joints fail. Finally, the side laminates also fail. On the other hand, the reinforcement of profiles 2 and 3 prevented the laminate of the upper face from bending inward. These reinforcements help the joints between faces to support higher loads. The deformity and failure of the profile structure depend on the geometry of the cross-section and the element’s stiffness. The maximum displacement values of profiles 2 and 3 ranged between 2.16 mm and 2.49 mm, respectively, while profile 1 had a maximum displacement of 3.09 mm. However, the inverted V-reinforced profile 2 delayed superior surface compression failure, presenting a lower deformation of 15.32% compared to profile 3.
As noted, the experimental results show that the reinforcement of the cross-section of the beams (profile 2 and profile 3) exhibited better resistance to flexion at four points of 43.41% and 24.33%, respectively, compared to the box beam (profile 1). This result means that the elastic rigidity of the beams increases equally with increases in fiber content [35]. The elastic modulus was determined in a theoretical–experimental way, with notable results achieved for each of the profiles. On the other hand, considering both the displacement and rigidity results determined by the bending tests at four points and two points, profile 2 has a better performance and is more suitable to support loads in flag direction than profile 3.
The three forms of failure mentioned above were observed: (1) failure through the stress-compression of upper and lower laminates; (2) cracking in the resin matrix caused by brittle deformation; (3) total fracture caused by the separation of the joints of the beam faces. In addition, the simulation results showed that the profiles with structural reinforcements performed better, with minor deformations compared to the hollow profiles.
The most excellent convergence of numerical and experimental results was obtained with the bending tests at two points, with a percentage difference of less than 10%. It was also determined that simulations can reasonably predict the behavior of cantilevered beams with reinforcements in the cross-section. However, in the bending tests at four points, the maximum percentage difference was 11.24%, possibly due to the contact conditions applied in the simulations. Finite element models could be used to optimize parameters, improving performance, lightness, and flexibility required to replace box beams.
In addition, the profile failure showed fragile behavior due to a fortuitous defect in the type of laminate joint (in this case, the type of failure constitutes a variable that is not being studied). However, understanding the failure of the joints is vital to improving the structural design to satisfy the design needs of beams in WTB due to the complexity of calculations, manufacturing, and optimization.

5. Conclusions

Based on experimental and simulation work, a static analysis of fiberglass box beams was presented in four-point and two-point bending tests.
  • In the bending analysis at four points, it was determined that profile 2, with an inverted V shape, and profile 3, with an X shape, decrease their bending by 30.09% and 19.41%, respectively, compared to profile 1.
  • Comparisons between simulations and experiments were made regarding the bending response, and the most excellent convergence in the results was obtained with the bending tests at two points, with an error of less than 10%.
  • The box beam reinforced with the same composite material has a higher structural resistance of 43.41% (profile 2) and 24.33% (profile 3) in four-point bending tests. In addition, by using the same material for structural reinforcements, properties such as lightness and flexibility are preserved.
  • The elastic modulus of the material was determined theoretically and experimentally by bending tests at two points and bending tests at four points. The values range from 3.66 GPa to 6.57 GPa, respectively.
  • Using inverted V-shaped fiberglass and polyester resin laminates as a structural reinforcement improved the flexural strength of the box beam by 43.41%. In this way, the reinforcement of profile 2 with an inverted V shape improves the resistance of the box beams when they are subjected to loads in the flag direction. For this reason, applying WTB is a viable option.

Author Contributions

Conceptualization, O.M.-S. and J.B.R.-O.; validation, O.M.-S., J.B.R.-O. and E.G.; review, J.B.R.-O., P.Y.S.-C., E.H. and S.d.l.C.; resources, J.B.R.-O., P.Y.S.-C., S.d.l.C., E.G., J.R.-R. and E.H.; writing—original draft preparation, O.M.-S. and J.B.R.-O.; review, editing and supervision, O.M.-S., J.B.R.-O., P.Y.S.-C., E.H., S.d.l.C., J.R.-R. and E.G.; project administration, J.B.R.-O. All authors have read and agreed to the published version of the manuscript.

Funding

The authors are grateful for the support provided by the Mexican Government foundation CONAHCYT for the financial support for the postgraduate student No. 799602 and with the rehabilitation of the Scanning Electron Microscope (SEM) for scientific academic and technological purposes resources under project No. 322405.

Institutional Review Board Statement

Not applicable.

Informed Consent Statement

Not applicable.

Data Availability Statement

Data will be made available on request.

Acknowledgments

This research was done with the help from Polytechnic University of Chiapas.

Conflicts of Interest

The authors declare no conflict of interest.

References

  1. Cooperman, A.; Eberle, A.; Lantz, E. Wind Turbine Blade Material in the United States: Quantities, Cost, and end-of-life Options. Resour. Conserv. Recycl. 2021, 168, 105439. [Google Scholar] [CrossRef]
  2. Santiuste, C. Análisis y Modelización de Vigas de Tipo Laminado Sometidas a Cargas Impulsivas. Ph.D. Thesis, Universidad Carlos III de Madrid, Madrid, Spain, 2007. [Google Scholar]
  3. Hernandez-Estrada, E.; Lastres-Danguillecourt, O.; Robles-Ocampo, J.B.; Lopez-Lopez, A.; Sevilla-Camacho, P.Y.; Perez-Sariñana, B.Y.; Dorrego-Portela, J.R. Considerations for the structural analysis and design of wind turbine towers: A review. Renew. Sustain. Energy Rev. 2021, 137, 110447. [Google Scholar] [CrossRef]
  4. Manwell, J.F.; McGowan, J.G.; Rogers, A.L. Wind Energy Explained, Theory, Design and Application, 2nd ed.; Wiley: Hoboken, NJ, USA, 2009. [Google Scholar]
  5. Maheri, A. Multiobjective Optimisation and Integrated Design of Wind Turbine Blades using WTBM-ANSYS for High Fidelity Structural Analysis. Renew. Energy 2019, 145, 814–834. [Google Scholar] [CrossRef]
  6. Veledurthi, A.; Bolleddu, V. Experimental Buckling Analysis of NACA 63415 Aerofoil Wind Turbine Blade. Mater. Today Proc. 2021, 46, 205–211. [Google Scholar] [CrossRef]
  7. Kam, T.Y.; Su, H.M.; Huang, C.Y. Quasi-Static Buckling and First-Ply Failure Loads of Shear Web Reinforced Glass-Fabric Composite Wind Blades. Compos. Struct. 2017, 160, 1225–1235. [Google Scholar] [CrossRef]
  8. Zhang, L.; Guo, Y.; Yu, L.; Wei, X.; Liu, W.; Huang, X. Structural Collapse Characteristics of a 48.8 m Wind Turbine Blade under Ultimate Bending Loading. Eng. Fail. Anal. 2019, 106, 104150. [Google Scholar] [CrossRef]
  9. Zuo, Y.; Montesano, J.; Veer Singh, C. Assessing Progressive Failure in Long Wind Turbine Blades Under Quasi-Static and Cyclic Loads. Renew. Energy 2018, 119, 754–766. [Google Scholar] [CrossRef]
  10. Jensen, F.M.; Puri, A.S.; Dear, J.P.; Branner, K.; Morris, A. Investigating the Impact of Non-Linear Geometrical Effects on Wind Turbine Blades—Part 1 Current Status of Design and Test Methods and Future Challenges in Design Optimization. Wind Energy 2011, 14, 239–254. [Google Scholar] [CrossRef]
  11. Clausen, P.; Reynal, F.; Wood, D. Advances in Wind Turbine Blade Design and Materials; Elsevier Science: Exeter Devon, UK, 2013. [Google Scholar]
  12. Jensen, F.M.; Weaver, P.M.; Cecchini, L.S.; Stang, H.; Nielsen, R.F. The Brazier Effect in Wind Turbine Blades and its Influence on Design. Wind Energy 2012, 15, 319–333. [Google Scholar] [CrossRef]
  13. Eker, B.; Akdogan, A.; Vardar, A. Using of Composite Material in Wind Turbine Blades. Appl. Sci. 2006, 6, 2917–2921. [Google Scholar] [CrossRef]
  14. Ghasemi, A.R.; Mohandes, M. Composite Blades of Wind Turbine: Design, Stress Analysis, Aeroelasticity, and Fatigue. In Wind Turbines—Design, Control and Applications; IntechOpen: London, UK, 2016. [Google Scholar]
  15. Tang, J.; Chen, X. Experimental Investigation on Ultimate Strength and Failure Response of Composite Box Beams Used in Wind Turbine Blades. Compos. Struct. 2018, 198, 19–34. [Google Scholar] [CrossRef]
  16. Doeva, O.; Masjedi, P.K.; Weaver, P.M. Static Deflection of Fully Coupled Composite Timoshenko Beams: An Exact Analytical Solution. Eur. J. Mech. A Solids 2020, 81, 103975. [Google Scholar] [CrossRef]
  17. Masjedi, P.K.; Doeva, O.; Weaver, P.M. Closed-Form Solutions for the Coupled Deflection of anisotropic Euler–Bernoulli composite beams with arbitrary boundary conditions. Thin Walled Struct. 2021, 161, 107479. [Google Scholar] [CrossRef]
  18. Chen, H.; Yu, W.; Capellaro, M. A Critical Assessment of Computer Tools for Calculating Composite Wind Turbine Blade Properties. Wind Energy 2010, 13, 497–516. [Google Scholar] [CrossRef]
  19. Li, J.; Wang, J.; Yu, L.; Liu, W.; Zhang, L. Study on Failure Mechanisms of Composite Box Beam on Wind Turbine Blades under Extreme Combined Loading. Mech. Adv. Mater. Struct. 2020, 29, 2176–2185. [Google Scholar] [CrossRef]
  20. Cestino, E.; Frulla, G.; Piana, P.; Duella, R. Numerical/Experimental Validation of Thin-Walled Composite Box Beam Optimal Design. Aerospace 2020, 7, 111. [Google Scholar] [CrossRef]
  21. Du, Y.; Zhou, S.; Jing, X.; Peng, Y.; Wu, H.; Kwok, N. Damage Detection Techniques for Wind Turbine Blades A Review. Mech. Syst. Signal Process. 2020, 141, 106445. [Google Scholar] [CrossRef]
  22. Chen, X.; Tang, J.; Yang, K. Modeling Multiple Failures of Composite Box Beams used in Wind Turbine Blades. Compos. Struct. 2019, 217, 130–142. [Google Scholar] [CrossRef]
  23. Emara, M.; EI-Zohairy, A.; Fekry, M.; Husain, M. Effect of using ECC Layer on the Flexural Performance of RC Beams Previously Strengthened with EB CFRP Laminates. Sustainability 2022, 14, 16990. [Google Scholar] [CrossRef]
  24. Bilston, D.; Ruan, D.; Candido, A.; Durandet, Y. Parametric Study of the Cross-Section Shape of Aluminium tubes in Dynamic three-point bending. Thin Walled Struct. 2019, 136, 315–322. [Google Scholar] [CrossRef]
  25. Lopez-Lopez, A.; Robles-Ocampo, J.B.; Sevilla-Camacho, P.Y.; Lastres-Danguillecourt, O.; Muniz, J.; Perez-Sariñana, B.Y.; de la Cruz, S. Dynamic Instability of a Wind Turbine Blade Due to Large Deflections: An Experimental Validation. J. Mech. Eng. 2020, 66, 523–533. [Google Scholar] [CrossRef]
  26. Chen, X.; Haselbach, P.U.; Branner, K.; Madsen, S.H. Effects of Different Material Failures and Surface Contact on Structural Response of Trailing Edge Sections in Composite Wind Turbine Blades. Compos. Struct. 2019, 226, 111306. [Google Scholar] [CrossRef]
  27. Gliszczyński, A.; Kubiak, T. Load-Carrying Capacity of Thin-Walled Composite Beams Subjected to Pure Bending. Thin Walled Struct. 2017, 115, 76–85. [Google Scholar] [CrossRef]
  28. Obst, M.; Kurpisz, D.; Paczos, P. The Experimental and Analytical Investigations of Torsion Phenomenon of Thin-Walled Cold Formed Channel Beams Subjected to Four-Point Bending. Thin Walled Struct. 2016, 106, 179–186. [Google Scholar] [CrossRef]
  29. Yeou-Fong, L.; Tseng-Hsing, H.; Fu-Chr, H. Study on Improving the Mechanical Behaviors of the Pultruded GFRP Composite Material Members. Sustainability 2019, 11, 577. [Google Scholar]
  30. ASTM D7264; Standard Test Method for Flexural Properties of Polymer Matrix Composite Materials. American Society for Testing and Materials: West Conshohocken, PA, USA, 2021.
  31. NMX-C-191-ONNCCE-2004; Industria de la Construcción-Concreto Determinación de la Resistencia a la Flexión del Concreto Usando una viga Simple con Carga en los Tercios del Claro. Organismo Nacional de Normalización y Certificación de la Construcción y Edificación, S.C.: Juárez, México, 2004.
  32. Barbero, E.J. Introduction to Composite Materials Desing, 2nd ed.; CRC Press: Boca Raton, FL, USA, 2011. [Google Scholar]
  33. Vcelka, M.; Dunn, M.; Durandet, Y.; Berndt, C.C.; Ruan, D. Behavior of CFRC/Al Foam Composite Sandwich Beams Under Three-Point Bending. Adv. Eng. Mater. 2014, 16, 9–14. [Google Scholar] [CrossRef]
  34. Vcelka, M.; Durandet, Y.; Berndt, C.C.; Ruan, D. Deformation and Energy Absorption of Composite Sandwich Beams. Key Eng. Mater. 2014, 626, 468–473. [Google Scholar] [CrossRef]
  35. Abbass, A.; Abid, S.; Özakça, M. Experimental Investigation on the Effect of Steel Fibers on the Flexural Behavior and Ductility of High-Strength Concrete Hollow Beams. Adv. Civ. Eng. 2019, 2019, 8390345. [Google Scholar] [CrossRef]
Figure 1. Thickness of laminate.
Fibers 11 00099 g001
Figure 2. General methodology.
Fibers 11 00099 g002
Figure 3. Profiles for FEM simulation: (a) simple square, (b) square with left diagonal reinforcement, (c) simple square with diagonal reinforcement, (d) simple square with V reinforcement, (e) simple square with inverted V reinforcement, (f) simple square with X reinforcement, and (g) simple square with reinforcement made up of a square and diagonals.
Fibers 11 00099 g003
Figure 4. Composite materials beams: (a) box-shaped profile 1, (b) box-shaped profile 2 with inverted V reinforcement, and (c) box-shaped profile 3 with X-shaped reinforcement.
Fibers 11 00099 g004
Figure 5. Beams composite material: (a) 4× zoom with the microscope model VE-S1 (upper view), and (b) micrograph with a GSEM model G20 (cross-section view).
Fibers 11 00099 g005
Figure 6. Configuration of a simple beam supported with symmetric point loads in mm.
Fibers 11 00099 g006
Figure 7. Configuration of a simple cantilever beam with point load in mm.
Fibers 11 00099 g007
Figure 8. Comparison of the average force-displacement relationships of the experimentally tested profiles in bending with four-points.
Fibers 11 00099 g008
Figure 9. Joint failure of profile 1: (a) fracture in the upper and lower left corner, (b) fracture in the upper and lower right corner, and (c) crushing on the upper surface of the section by the load points.
Fibers 11 00099 g009
Figure 10. Joint failure: (a) upper surface of profile 2 after applying the bending test at four-points and (b) lower surface of profile 2 due to clamping after applying the bending test at two-points.
Fibers 11 00099 g010
Figure 11. Comparison of the average force–displacement relationships of the experimentally tested profiles during bending with two-points.
Fibers 11 00099 g011
Figure 12. 3D Displacement of profile 1 with a load of 2114.91 N.
Fibers 11 00099 g012
Figure 13. Displacement with a load of 392.27 N with lateral view: (a) profile 2, (b) profile 3.
Fibers 11 00099 g013
Table 1. Physical properties of manufactured profiles.
Cross-Sectional
Area (mm2)
Inertia Moment
(mm4)
Profiles
1433.19162,769.25
2661.30201,114.18
3708.10250,022.23
Disclaimer/Publisher’s Note: The statements, opinions and data contained in all publications are solely those of the individual author(s) and contributor(s) and not of MDPI and/or the editor(s). MDPI and/or the editor(s) disclaim responsibility for any injury to people or property resulting from any ideas, methods, instructions or products referred to in the content.

